Expansion of Lithium Ion Pouch Cell Batteries ...
16
1 Expansion of Lithium Ion Pouch Cell Batteries: Observations from Neutron Imaging. Jason Siegel, Anna Stefanopoulou, Patrick Hagans, Yi Ding and David Gorsich Abstract The expansion of battery material during lithium intercalation is a concern for the cycle life and performance of lithium ion batteries. In this paper, the electrode expansion is quantified from in situ neutron images taken during cycling of pouch cells with lithium iron phosphate positive and graphite negative electrodes. The impact of various charging cycles and rates on electrode expansion was investigated. At low C-rates the measured battery thickness was a function of State of Charge (SOC) and independent of a small external clamping force. A 0.3 % increase in total thickness was observed when charging the battery from 0 to 30% SOC, up to the stage 4-3 transition associated with the first voltage plateau. As the battery was charged beyond 30% SOC the expansion rate was reduced and then continued again after 70% SOC. The observed 0.5% expansion is attributed to a 1.7% swelling of the carbon anode; however the expansion of the negative electrode could be larger if the iron phosphate electrode also contracted during battery charging. This result is consistent with previous dilatometer experiments on lithium ion batteries with graphite materials which show up to 4% increase in electrode thickness during charging of carbon. The charging rate was shown to have a strong influence on the observed expansion. During high-rate cycling (5C charge and discharge over a voltage range larger than the advisable 3.6V high voltage limit), the battery showed a much larger and irreversible expansion of around 1.5% which was correlated with a 4% loss in capacity over the duration of 21 cycles. 1. Introduction The expansion of lithium battery material is a concern for the cycle life and performance of lithium ion batteries. Expansion and contraction of the material can lead to fracture of the electrode and eventually capacity loss as particles are no longer electrically connected to the current collector, each other, or the carbon matrix in which they are suspended. The carbon anode material is known to expand upon intercalation of lithium into the host structure that occurs during charging of the battery. Expansion of the graphite can cause deformations as large as 10% of the anode volume [1]- [2] depending upon the type of carbon. The stress that develops inside the battery is also related to the rate of charging [3]. Lee et al. in [4] measured the dimensional changes in lithium cobalt oxide pouch cells during cycling using a specialized dilatometer setup. They found that the expansion of the battery consists of two components; an irreversible thickness increase, corresponding to initial formation of the solid electrolyte interface (SEI), and one which is reversible and follows the battery state of charge, expanding upon charging [4]. They attributed the volume change during cycling, approximately 2% of the total battery initial thickness, to the anode active material since the cobalt oxide does not show significant volume change upon lithium intercalation.
Transcript of Expansion of Lithium Ion Pouch Cell Batteries ...

1
Expansion of Lithium Ion Pouch Cell Batteries: Observations from Neutron Imaging.
Jason Siegel, Anna Stefanopoulou, Patrick Hagans, Yi Ding and David Gorsich
Abstract
The expansion of battery material during lithium intercalation is a concern for the cycle life and performance of lithium ion batteries. In this paper, the electrode expansion is quantified from in situ neutron images taken during cycling of pouch cells with lithium iron phosphate positive and graphite negative electrodes. The impact of various charging cycles and rates on electrode expansion was investigated. At low C-rates the measured battery thickness was a function of State of Charge (SOC) and independent of a small external clamping force. A 0.3 % increase in total thickness was observed when charging the battery from 0 to 30% SOC, up to the stage 4-3 transition associated with the first voltage plateau. As the battery was charged beyond 30% SOC the expansion rate was reduced and then continued again after 70% SOC. The observed 0.5% expansion is attributed to a 1.7% swelling of the carbon anode; however the expansion of the negative electrode could be larger if the iron phosphate electrode also contracted during battery charging. This result is consistent with previous dilatometer experiments on lithium ion batteries with graphite materials which show up to 4% increase in electrode thickness during charging of carbon. The charging rate was shown to have a strong influence on the observed expansion. During high-rate cycling (5C charge and discharge over a voltage range larger than the advisable 3.6V high voltage limit), the battery showed a much larger and irreversible expansion of around 1.5% which was correlated with a 4% loss in capacity over the duration of 21 cycles.
1. Introduction
The expansion of lithium battery material is a concern for the cycle life and performance of lithium ion batteries. Expansion and contraction of the material can lead to fracture of the electrode and eventually capacity loss as particles are no longer electrically connected to the current collector, each other, or the carbon matrix in which they are suspended. The carbon anode material is known to expand upon intercalation of lithium into the host structure that occurs during charging of the battery. Expansion of the graphite can cause deformations as large as 10% of the anode volume [1]- [2] depending upon the type of carbon. The stress that develops inside the battery is also related to the rate of charging [3].
Lee et al. in [4] measured the dimensional changes in lithium cobalt oxide pouch cells during cycling using a specialized dilatometer setup. They found that the expansion of the battery consists of two components; an irreversible thickness increase, corresponding to initial formation of the solid electrolyte interface (SEI), and one which is reversible and follows the battery state of charge, expanding upon charging [4]. They attributed the volume change during cycling, approximately 2% of the total battery initial thickness, to the anode active material since the cobalt oxide does not show significant volume change upon lithium intercalation.

Report Documentation Page Form ApprovedOMB No. 0704-0188
Public reporting burden for the collection of information is estimated to average 1 hour per response, including the time for reviewing instructions, searching existing data sources, gathering andmaintaining the data needed, and completing and reviewing the collection of information. Send comments regarding this burden estimate or any other aspect of this collection of information,including suggestions for reducing this burden, to Washington Headquarters Services, Directorate for Information Operations and Reports, 1215 Jefferson Davis Highway, Suite 1204, ArlingtonVA 22202-4302. Respondents should be aware that notwithstanding any other provision of law, no person shall be subject to a penalty for failing to comply with a collection of information if itdoes not display a currently valid OMB control number.
1. REPORT DATE 21 DEC 2012
2. REPORT TYPE Journal Article
3. DATES COVERED 13-05-2012 to 20-11-2012
4. TITLE AND SUBTITLE Expansion of Lithium Ion Pouch Cell Batteries: Observations fromNeutron Imaging
5a. CONTRACT NUMBER
5b. GRANT NUMBER
5c. PROGRAM ELEMENT NUMBER
6. AUTHOR(S) Jason Siegel; Anna Stefanopoulou; Patrick Hagans; Yi Ding; David Gorsich
5d. PROJECT NUMBER
5e. TASK NUMBER
5f. WORK UNIT NUMBER
7. PERFORMING ORGANIZATION NAME(S) AND ADDRESS(ES) U.S. Army TARDEC,6501 East Eleven Mile Rd,Warren,Mi,48397-5000
8. PERFORMING ORGANIZATIONREPORT NUMBER #23579
9. SPONSORING/MONITORING AGENCY NAME(S) AND ADDRESS(ES) U.S. Army TARDEC, 6501 East Eleven Mile Rd, Warren, Mi, 48397-5000
10. SPONSOR/MONITOR’S ACRONYM(S) TARDEC
11. SPONSOR/MONITOR’S REPORT NUMBER(S) #23579
12. DISTRIBUTION/AVAILABILITY STATEMENT Approved for public release; distribution unlimited
13. SUPPLEMENTARY NOTES
14. ABSTRACT The expansion of battery material during lithium intercalation is a concern for the cycle life andperformance of lithium ion batteries. In this paper, the electrode expansion is quantified from in situneutron images taken during cycling of pouch cells with lithium iron phosphate positive and graphitenegative electrodes. The impact of various charging cycles and rates on electrode expansion wasinvestigated. At low C-rates the measured battery thickness was a function of State of Charge (SOC) andindependent of a small external clamping force. A 0.3 % increase in total thickness was observed whencharging the battery from 0 to 30% SOC, up to the stage 4-3 transition associated with the first voltageplateau. As the battery was charged beyond 30% SOC the expansion rate was reduced and then continuedagain after 70% SOC. The observed 0.5% expansion is attributed to a 1.7% swelling of the carbon anode;however the expansion of the negative electrode could be larger if the iron phosphate electrode alsocontracted during battery charging. This result is consistent with previous dilatometer experiments onlithium ion batteries with graphite materials which show up to 4% increase in electrode thickness duringcharging of carbon. The charging rate was shown to have a strong influence on the observed expansion.During high-rate cycling (5C charge and discharge over a voltage range larger than the advisable 3.6Vhigh voltage limit), the battery showed a much larger and irreversible expansion of around 1.5% whichwas correlated with a 4% loss in capacity over the duration of 21 cycles.
15. SUBJECT TERMS
16. SECURITY CLASSIFICATION OF: 17. LIMITATION OF ABSTRACT
Public Release
18. NUMBEROF PAGES
14
19a. NAME OFRESPONSIBLE PERSON
a. REPORT unclassified
b. ABSTRACT unclassified
c. THIS PAGE unclassified

Standard Form 298 (Rev. 8-98) Prescribed by ANSI Std Z39-18

2
In this paper we document the expansion of Lithium Iron Phosphate (LiFePO4) pouch cells upon charging. The measurements are taken using Neutron Imaging (NI), an in situ technique similar to X-ray imaging that is sensitive to lighter elements such as hydrogen and lithium. We also provide a method for quantifying the expansion from the NI data. For the cell held under compression, we observed a 0.5% total cell expansion (after SEI formation), which corresponds to a 1.7 % expansion of the graphite material if attributed entirely to the negative electrode and ignoring the potential expansion (contraction) of the positive electrode [5] [6]. This finding agrees with the results from dilatometer experiments previously reported in the literature. The impact of charging rate was also investigated by applying a 5C charge-discharge cycle to the battery with an increased voltage window. A non-recoverable increase in the battery thickness from cycle to cycle was observed under this abusive condition, which was correlated with a 4% decrease in capacity throughout the test.
2. Experimental Setup
The neutron imaging was performed at the National Institute for Standards and Technology (NIST) Center for Neutron Research. The collimated neutron beam originates from a 20MW reactor, which provides the high flux source of neutrons. The transmission image is captured by a micro-channel plate (MCP) neutron counting detector with 5 µm pixel pitch and 13.5 µm spatial resolution. Further details about the detector and facility can be found in [7, 8]. The battery fixture is mounted in front of the detector so that the neutron beam path, which travels into the page, is parallel to the plane of the separator as shown in Figure 1. The resulting images formed on the detector are a two-dimensional projection of the battery structure onto the detector surface.
Figure 1: The Battery pouch cell is positioned in front of the neutron sensitive detector so that the beam axis (z-direction) is parallel to the separator.
Two similar battery pouch cells with different electrode sizes were used for the experiment. The first battery, (sample A) is a 120 mAh cell used in [7]. This battery had a width of approximately 1.5 cm and height of 2.5 cm. The 2nd battery (sample B) is also a 10-layer pouch cell constructed from strips cut from A123 production Plug in Hybrid Electric Vehicle (PHEV) electrode material. The battery dimensions were chosen to utilize the as much as possible of the available detector area and optimize the neutron transmission through the sample as described in [7], resulting in the tall narrow cell design used for
x y
z

3
sample B. The negative electrode strip is 7 mm wide carbon on a copper foil and the positive electrode is 5 mm wide Lithium Iron Phosphate (LiFePO4) on an aluminum collector. The electrodes were hand stacked with a woven separator and banded together using Kapton tape around the middle to hold the electrodes in place before inserting into the pouch. The battery consists of 11 negative electrodes and 10 positive electrodes stacked inside the pouch and electrically connected in parallel. The batteries were then filled with electrolyte, sealed, formed (cycled) and finally re-sealed in a glovebox. The LiFePO4 active material is 54 μm thick applied to each side of a 20 μm aluminum current collector, yielding a total thickness of 128 μm for the positive electrode. The carbon active material is 39 μm thick applied to each side of a 10 μm copper current collector, yielding a total thickness of 88 μm for the negative electrode. The separator is 25 μm thick. The measured capacity of the battery is 64 mAh.
Since sample B was hand stacked, it was first imaged using X-ray tomography to ensure the flatness of the layers. Flatness of the battery layers and alignment parallel to the neutron beam path are critical to achieve high quality data sets. If the layers are not flat or not parallel to the beam axis then the resulting images will be blurred because they are a projection through multiple layers of the battery. The copper current collectors of the negative electrode correspond to the very bright regions in the slice from the x-ray tomographic image shown in Figure 2. The 1/8” thick Teflon block visible on the right side of the image was placed inside the pouch cell to help maintain rigidity and flatness of the electrode layers. The metal foil pouch surrounding the battery is also well resolved in the x-ray image.
Figure 2: A horizontal slice of the battery (x-z plane) from x-ray tomography is used to visualize the flatness of the battery layers. The 11 bright layers in the x-ray image correspond to the copper current collectors of the negative electrodes. A Teflon block was placed inside the pouch cell, shown on the right side of the image, to help maintain rigidity of the battery and keep the electrodes straight. Flatness is important because the neutron images are projections of the structure onto the x-y plane of the detector.
Sample A was taped onto an aluminum block which provided a ridged mounting surface, but no external force was applied; therefore the battery was free to swell during charging. Sample B was placed into a fixture that applied pressure on the surface of the pouch cell using a spring loaded mechanism. The two springs, each having a spring rate of 10.86 lbs. per inch, applied a nominal pressure of 3 lbs. over an area of 0.49 square inches (7 mm wide x 45 mm tall). This yielded an actual pressure of
x
z

4
approximately 12 psi. Since the clamping force is applied via springs the battery is able to deform during cycling if the spring force is overcome. The clamping fixture with springs is shown in Figure 1. The aluminum plate on the left is mounted to a fixed optical table, while the plate on the right is spring loaded and free to move as the battery thickness changes. High compression or rigid fixture of the battery compression plates would contribute to closure of the membrane pores during charging [9]. However because of the low pressure applied and spring loaded fixture used for this experiment we do not anticipate any seperator creep in our experiments.
3. Principle of Neutron Imaging
Neutron transmission imaging is similar to X-ray imaging. The neutron sensitive detector, placed
behind the object of interest, measures the transmitted neutron beam intensity by localizing and counting the number of neutrons which hit the surface of the detector over a given time period. The neutron beam intensity after passing through an object of thickness δ can be described by the Lambert-Beer Law;
( ) ( )( )( )0 exp A Li Li i iI t I N c t cδ σ σ= − +∑ (1)
where 0I is the incident neutron beam intensity, iσ is the neutron cross section (cm2) of each material,
NA is Avogadro’s number, and ci is the concentration (mol cm-3) of each material in the sample. Lithium and hydrogen have large neutron cross sections, so these elements strongly attenuate the beam relative to other materials present in the battery. Therefore, areas of the battery with a high density of lithium atoms, for example the negative electrode layer of a charged battery, will allow the transmission of fewer neutrons. The aluminum layers corresponding to the positive current collector cause a bright (high intensity) ridge in the neutron image, as shown in Figure 4, due to the excellent neutron transmission property of aluminum relative to other battery materials.
A. Stroboscopic Imaging
The ability to accurately locate edges in the image, and to detect small changes in lithium concentration, is limited by the image exposure time and the detector spatial resolution. The measurement noise is governed by neutron counting which can be modeled as a Poisson random process. Temporal averaging of subsequent images can be used to increase the neutron counting rate, which increases the signal to noise ratio (SNR). However, the 20 minute exposure time needed to get good quality data would prevent imaging of transient behaviors under high C-rates. Therefore a stroboscopic imaging technique is applied to study transients. A periodic current profile is applied to the battery, as shown in Figure 3, and image acquisition is synchronized with the start of each cycle. Therefore, each image during the charge or discharge period can be acquired with relatively fast (20-45 s) exposure time and multiple frames from subsequent cycles can be averaged together to achieve the desired SNR.

5
Figure 3: Stroboscopic 1C charge and 2C discharge profile applied to Sample B. The battery was cycled at constant current between 2 V and 3.6 V. Imaging was triggered at the same point in the discharge curve over multiple cycles and averaged together to increase the effective exposure time.
B. Line Profiles
Spatial averaging over a uniform region in the image is one way to increase the number of counted neutrons, and hence decrease the measurement uncertainty without requiring excessively long exposure times [8]. Due to the planar structure of the electrode, and its large aspect ratio, we expect to see changes in lithium concentration across the electrode indicated by the x-direction. We also expect to see swelling in the x-direction due to lithium intercalation in the electrode material. We assume that the structure of the battery is uniform along the y-axis and z-axis. The two-dimensional image data can then be averaged along the y-axis without loss of information. This yields an N fold increase in the neutron count rate, where N=4000 is the number of averaged pixels in the image. Averaging along the y-direction reduces the data to a line profile as shown in Figure 4.
0.9 0.95 1 1.05 1.1 1.15 1.2x 10⁵
2.6
2.8
3
3.2
3.4
3.6vo
ltage
0.9 0.95 1 1.05 1.1 1.15 1.2x 10⁵
-100
-50
0
50
Time (s)
mA
/ m
Ah

6
Figure 4: Neutron transmission image of the battery and corresponding line profile from averaging along the y-axis in the image. The peaks in the line profile are caused by the aluminum current collectors which have significantly lower neutron attenuation than other materials present in the battery.
The peaks in the line profile are caused by the aluminum current collectors which have significantly lower neutron attenuation than other materials present in the battery. The copper current collectors of the negative electrode unfortunately are not clearly resolved. They could have been more visible (higher peaks) if they were thicker, however 10 μm is narrower than the detector spatial resolution. The lowest intensity is expected in the region where the separators are located as they contain a high density of hydrogen atoms which strongly attenuates the neutron beam. However, the thin membrane separator and its proximity to the electrode, does not allow us to distinguish clearly its location.
C. Quantifying Expansion
Although the movement of the Aluminum peak between images of the battery in the charged and discharged state is clearly visible to the human eye, a method to accurately quantify the expansion from the line profile data is needed. For the purpose of quantifying electrode swelling it is important to have well resolved features in the image so that the motion can be accurately tracked between successive frames. The metal anode and cathode current collectors should produce high contrast edges in the image due to the larger difference in neutron transmission relative to the surrounding active material. However, due to the detector spatial resolution the edges from the aluminum are blurred in the images. Expansion of the battery layers can be quantified by tracking the movement of the 10 peaks in the line profile. The peaks in the line profile are fit with a symmetric function, shown in (3), to locate the center of the peak as shown in Figure 5. The parameters a1-a6 are identified using a nonlinear least squares curve fitting algorithm in MATLAB based on the interior-reflective Newton method [10]. The algorithm seeks to minimize the two norm of the error between the model and the intensity data from the line profile using 25 data points on each side of the peak.
2
min ( , )a
f x a data− (2)
2
1 2 3 4 5 3 6( , ) exp ( ) expf x a a a x a a a x a a = − − + − − + (3)
The parameter a3 corresponds to the center of the peak. The resolution of the neutron sensitive detector is about 13.5 µm, but sub-pixel expansion of the battery layers can be detected by fitting the blurred edge in the image [11]. The expected peak spacing is 265 µm based on the nominal values of the materials used in construction. However, based upon the 5 µm detector pixel pitch the average measured peak spacing was 284 µm. The additional expansion is expected as a result of post-coating processing of the anode to enhance electrode adhesion and increase binder strength.

7
Figure 5: Fitting the peaks in the line profile data which correspond to the aluminum current collectors. The cell fixture is mounted on the left, so expansion of each layer causes compounded displacement of each layer moving rightward.
The center of each peak is indicated by a vertical line as in shown in Figure 5. The expansion of the battery layers during charging results in a shift of each layer to the right since the battery is rigidly mounted on the left side. The swelling of each stacked electrode compounds the displacement of the rightmost layer. Therefore a small expansion of each layer can be measured by the larger displacement of the outer layer. Since there is only one well defined feature in the line profile, and neither the copper current collectors nor the separators were clearly resolved, we cannot quantify possible cathode contraction during charging.
The expansion of the battery layers also has important consequences for quantification of the changes in lithium concentration during cycling of the battery. The change in neutron transmission between the charged and discharged states of the battery can be seen by comparing the line profiles shown in Figure 5. The increase in lithium concentration in the negative electrode (graphite) during charging leads to a decrease in neutron transmission through the battery. The change in local number of counted neutrons between two different images can be related to the change in local lithium concentration, cLi, using the Beer-Lambert Law by assuming that the other material concentrations remain constant [7]. The shift in location of electrode layers prevents direct calculation of the change in lithium concentration because this fundamental assumption is violated. Therefore very accurate measurement of the expansion was needed to correctly re-align the battery layers to quantify the change in lithium concentration across each electrode as described in [7]. The change in lithium concentration across each of the 21 electrodes observed from neutron imaging is consistent with Coulomb counting and can be compared with the spatial distributions predicted by electrochemical models [7].
4. Experimental Results
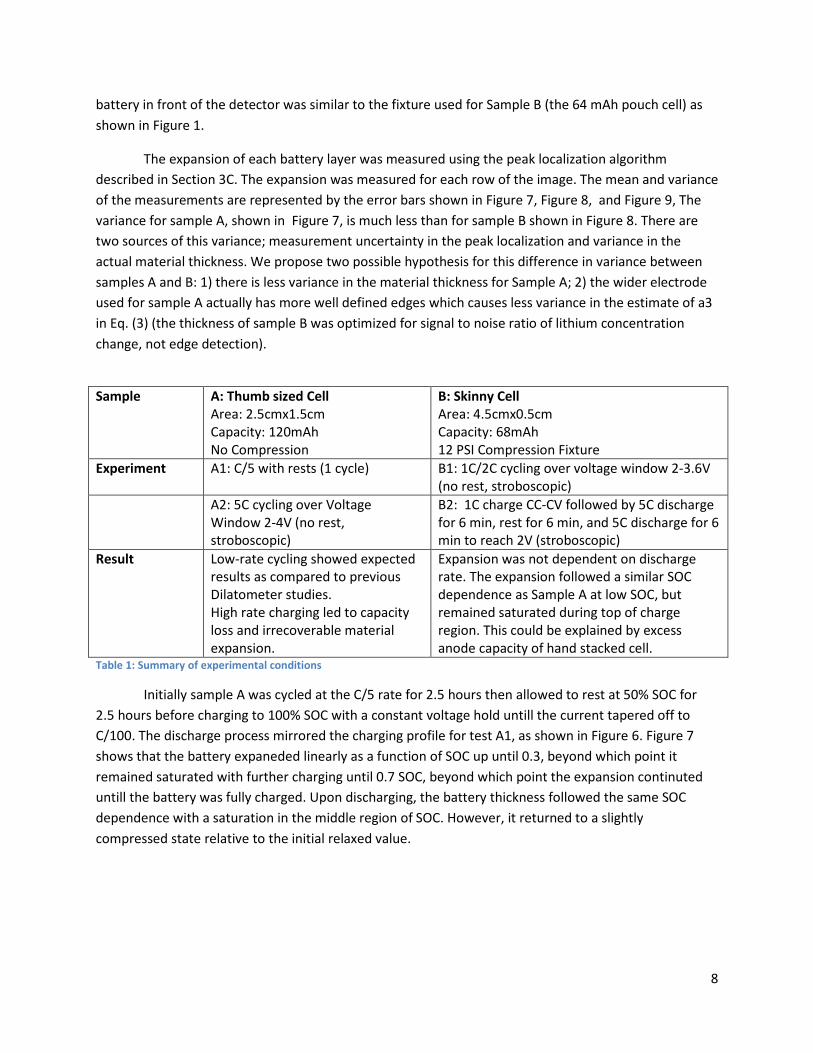
A summary of the experimental results is presented in Table 1. Two pouch cells with similar materials and construction were used for the experiment. Sample A (the larger 120 mAh pouch cell) was taped onto a rigid mounting plate while Sample B was held under mild compression using a spring loaded fixture. The cells were mounted on the left side and free to swell to the right. The position of the
8
battery in front of the detector was similar to the fixture used for Sample B (the 64 mAh pouch cell) as shown in Figure 1.
The expansion of each battery layer was measured using the peak localization algorithm described in Section 3C. The expansion was measured for each row of the image. The mean and variance of the measurements are represented by the error bars shown in Figure 7, Figure 8, and Figure 9, The variance for sample A, shown in Figure 7, is much less than for sample B shown in Figure 8. There are two sources of this variance; measurement uncertainty in the peak localization and variance in the actual material thickness. We propose two possible hypothesis for this difference in variance between samples A and B: 1) there is less variance in the material thickness for Sample A; 2) the wider electrode used for sample A actually has more well defined edges which causes less variance in the estimate of a3 in Eq. (3) (the thickness of sample B was optimized for signal to noise ratio of lithium concentration change, not edge detection).
Sample A: Thumb sized Cell
Area: 2.5cmx1.5cm Capacity: 120mAh No Compression
B: Skinny Cell Area: 4.5cmx0.5cm Capacity: 68mAh 12 PSI Compression Fixture
Experiment A1: C/5 with rests (1 cycle) B1: 1C/2C cycling over voltage window 2-3.6V (no rest, stroboscopic)
A2: 5C cycling over Voltage Window 2-4V (no rest, stroboscopic)
B2: 1C charge CC-CV followed by 5C discharge for 6 min, rest for 6 min, and 5C discharge for 6 min to reach 2V (stroboscopic)
Result Low-rate cycling showed expected results as compared to previous Dilatometer studies. High rate charging led to capacity loss and irrecoverable material expansion.
Expansion was not dependent on discharge rate. The expansion followed a similar SOC dependence as Sample A at low SOC, but remained saturated during top of charge region. This could be explained by excess anode capacity of hand stacked cell.
Table 1: Summary of experimental conditions
Initially sample A was cycled at the C/5 rate for 2.5 hours then allowed to rest at 50% SOC for 2.5 hours before charging to 100% SOC with a constant voltage hold untill the current tapered off to C/100. The discharge process mirrored the charging profile for test A1, as shown in Figure 6. Figure 7 shows that the battery expaneded linearly as a function of SOC up until 0.3, beyond which point it remained saturated with further charging until 0.7 SOC, beyond which point the expansion continuted untill the battery was fully charged. Upon discharging, the battery thickness followed the same SOC dependence with a saturation in the middle region of SOC. However, it returned to a slightly compressed state relative to the initial relaxed value.

9
Figure 6: Measured voltage (top), applied current (middle), and stored charge (bottom) for the slow and fast cycling of Sample A. At the 5C rate approximately 75% of the total capacity was available when cycling between 2 and 4V.
Figure 7: The upper subplot shows the battery voltage as a function of state of charge for the C/5 charge and discharge cycle. The percent expansion for Sample A at the C/5 rate is shown in the lower subplot. Saturation of the expansion occurs between 0.3 and 0.7 SOC corresponding to the staging of lithium within the graphite structure.
A. Relationship between negative electrode lithium stoichiometry and expansion
A linear expansion during charging from SOC=0 to 0.3 was measured for sample A as shown in the lower subplot of Figure 7. The expansion saturated from SOC=0.3 to 0.7, and then the expansion continued
2 3 4 5 6 7 8 9 10 11
x 104
2
2.5
3
3.5
4vo
ltage
time (s)
2 3 4 5 6 7 8 9 10 11
x 104
-2000
-1000
0
1000
2000
curr
ent (
mA
)
2 3 4 5 6 7 8 9 10 11
x 104
-50
0
50
100
150
time (s)
(mA
h)
9.7 9.75 9.8 9.85
x 104
2
2.5
3
3.5
4
volta
ge
0 0.1 0.2 0.3 0.4 0.5 0.6 0.7 0.8 0.9 13
3.1
3.2
3.3
3.4
3.5
3.6
SOC
Vol
tage
C/5 ChargeC/5 Discharge
0 0.1 0.2 0.3 0.4 0.5 0.6 0.7 0.8 0.9 1-0.2
-0.1
0
0.1
0.2
0.3
0.4
0.5
SOC
Tot
al P
erce
nt E
xpan
sion
C/5 120 mAh pouch
Charge
Discharge

10
past SOC=0.7, up to fully charged, in the highlighted region. This expansion is consistent with the previous findings for lithium intercalation into graphite; see Figure 1(a) in [1]. The upper subplot of Figure 7 shows the battery voltage as a function of SOC for the 1/5 C charge and discharge. The plateaus in the voltage profile can be attributed to the negative electrode since the LiFePO4 has a very flat OCV curve. Therefore, the observed voltage plateaus correspond to lithium staging in the graphite described in [1, 12, 13]. The specific voltage profile of the intercalation staging depends on the type of carbon as shown in Figure 3 of [14], and can be measured using half cells vs lithium metal reference electrode. In general, intercalation stage 1 correspond to 0-90mV, stage 2 correspond to 90-120mV, stage 3 correspond to 120-210mV, and stage 4 correspond to >210mV. The disappearance of the voltage plateaus at high C-rate, shown in the inset of Figure 6, is indicative that uniform staging across the electrode did not occur for our experiments at higher charging rates.
Two slightly different stroboscopic profiles were applied to sample B. Test B1 consisted of a 1C charge and 2C discharge cycling which was performed over the 2-3.6 V window as shown in Figure 3. Test B2 consisted of a 1C charge followed by a CV hold at 3.6 volt, and then the battery was discharged at the 5C rate for 180 s until the battery reached 50% SOC. The battery was allowed to rest for 180 s before discharging the rest of the way to 2 V at the 5C rate. This profile was repeated and again stroboscopic imaging was used to increase the effective exposure time while capturing the fast dynamic behavior.
The upper subplot of Figure 8 shows the near Open Circuit Voltage (OCV) profile of the battery as a function of SOC for a C/20 cycle. In the lower subplot the expansion of the electrode as a function of SOC during 1C charge and 2C/5C discharge cycling for sample B is shown. The battery percent expansion for 5C discharge with rest and the 1C charge follow the same SOC dependence as shown in Figure 8, however the dependence is different than that of sample A. The battery thickness increased linearly with SOC, up to 40% SOC. Above 40% SOC there was no further expansion. For sample B, the transition to the higher voltage plateau, corresponding to the highlighted region in Figure 8, occurs near 90% SOC instead of 70% SOC as observed for Sample A.
Figure 8: Lithium iron phosphate battery voltage vs. state of charge at the 20 hour rate is shown in the upper subplot. The voltage range in the plot is cropped to illustrate the plateaus. In the lower subplot the percent expansion of the total battery for sample B is shown also as a function of SOC. The thickness of the battery varies linearly with SOC below 0.4 and is
0 0.1 0.2 0.3 0.4 0.5 0.6 0.7 0.8 0.9 1
3.1
3.15
3.2
3.25
3.3
3.35
3.4
Vol
tage
Data C/20 chargeData C/20 dischargeData C/20 avg
0 0.1 0.2 0.3 0.4 0.5 0.6 0.7 0.8 0.9 1-0.1
0
0.1
0.2
0.3
0.4
0.5
0.6
SOC
Tot
al P
erce
nt E
xpan
sion
1C Charge 64mAh pouch2C Discharge 64mAh pouch5C Discharge with Rest1C Charge

11
saturated above. The percent expansion was independent of the discharge current rate for values less than 5C which were tested.
Previous dilatometer experiments have shown that the graphite expansion is a linear function of stoichiometry x in LixC6 up to x=0.3 [1]. If we assume that the negative electrode of sample B has 30% excess capacity relative to the positive electrode active material, then 40% SOC corresponds to x=0.3. These experimental observations are in agreement with [13] and [12]. The typical anode excess capacity used in commercial cells can be as high as 20%.
The capacity mis-match would also explain the shift in location of the start of the 2nd voltage plateau from 70% to 90% SOC; cf. the highlighted regions of Figure 7 and Figure 8. The 0.5% expansion of the battery corresponds to 1.7% of the active material in the negative electrode, which is 29.4 % of the total thickness. This expansion is slightly less than the 4% reported by Hahn et al [1] however the different type of graphite and binder strength contribute to the discrepancy. . Additionally, the total battery expansion is the sum of the iron phosphate contraction and carbon expansion upon charging [6]. Therefore, if the LiFePO4 is contracting at the same time, then the LiC6 expansion could be even larger than what was inferred from the measurements. Unfortunately, we cannot determine the relative expansion of the positive and negative electrodes because the separator interface is not resolved in the line profile data from neutron imaging.
B. The effect of charging rate
The effect of charging rate was investigated in a subsequent test (A2). Starting at t=84,000s sample A was cycled between 2V and 4V at the 5C rate as shown in Figure 6. A larger voltage window was needed to get resonable capacity when cycling of the battery at this high rate due to its large internal resistance. Eleven images, with 45s exposure time, were acquired during each charge and each discharge period. The first image from each discharge cycle was averaged together to generate a stroboscopic snapshot of the battery (at 70% SOC). Similarly each of the other images were averaged across the 22 cycles to generate snapshots of the expansion at various SOC. At this high rate we observed a large offest in expansion at 0% SOC, as shown in Figure 9, relative to the relaxed case. We suspect that this was casused by the combination of high-rate and lack of relaxation period between charging and discharging, since the opposite current was applied upon reaching the voltage limit. A small linear increase in thickness with increasing SOC was observed across the entire cycle as compared to the saturating behavior observed at lower C-rates. Although some temperature rise (10-15 °C) was expected during the 5C cycling, the thermal expansion of the battery layers (~10-5 m/m C) does not contribute a measureable amount (0.01%).

12
Figure 9: Percent expansion for Sample A (uncompressed) at the 5C rate. During this high-rate charging cycle the battery was not allowed to rest between charge and discharge. A large non-recoverable expansion was observed, which grows with increasing cycle number.
The number of Ah processed though the cell was tracked during the 5C cycling of the battery and a 4% decrease in cell capacity was observed as indicated in Figure 10. The decrease in capacity appears to be correlated with the cycle to cycle growth in battery thickness as shown in Figure 9, where the average expansion of the first three, middle three, and last three cycles are shown as a function of SOC. This irreversible expansion may be related to lithium plating during high charging rate or overcharge (4V) that can cause electrolyte and/or electrode decomposition [15]. Sample B was discharged at the 5C rate, and charged at the 1C rate, but did not exhibit any degradation in capacity throughout the experiment.
Figure 10: A 3% capacity loss occurred over the 21 cycles of 5C charging and discharging of sample A. The percent expansion of the first, middle and last 3 cycles are shown in Figure 9.
5. Conclusions
The expansion of a lithium iron phosphate pouch cell has been observed via post processing of neutron images acquired during galvanostatic cycling. Sub-pixel resolution of features in the image is achieved by fitting a symmetric function to line profile data in order to measure the expansion. Both
0 5 10 15 20 25
90
91
92
93
94
95
Cycle Number
mA
h
ChargeDischarge

13
samples showed similar traces of expansion vs. SOC at low C-rates, independent of the applied compression. However, during high C-rate (5C) charging Sample A exhibited a 4% decrease in capacity that was correlated with an irreversible expansion relative to the relaxed state. The relationship between expansion and SOC at higher charging rate was also different. A linear increase in thickness across the entire range of SOC was observed as opposed to the saturation in the middle range of SOC, which indicates uniform lithium staging across the graphite electrode. For sample B, the observed expansion was independent of discharging rate and demonstrated a saturation type behavior for SOC greater than 40% with no further expansion observed at higher SOC. The difference in transition points at low current cycling rate for the expansion vs. SOC relationship between samples A and B could be explained by the difference in anode excess capacity. The 0.5% expansion of the battery layers was attributed to lithium intercalation in the negative (graphite) electrode, which follows the staging of lithium in the graphite material as reported in [12] and [13]. The observed expansion agrees with previously published dilatometer and X-ray diffraction measurements of lithium batteries. Future work is needed to investigate high-rate charging under compression to determine the impact of compression vs. charging rate.
References
[1] M. Hahn, H. Buqa, P. W. Ruch, D. Goers, M. E. Spahr, J. Ufheil, P. Novak and R. Kotz, "A Dilatometric Study of Lithium Intercalation into Powder-Type Graphite Electrodes," Electrochem. Solid-State Lett., vol. 11, no. 9, pp. A151-A154, 2008.
[2] M. Winter, G. H. Wrodnigg, J. O. Besenhard, W. Biberacher and P. Novak, "Dilatometric Investigations of Graphite Electrodes in Nonaqueous Lithium Battery Electrolytes," J. Electrochem. Soc., vol. 147, no. 7, pp. 2427-2431, 2000.
[3] K. Zhao, M. Pharr, J. J. Vlassak and Z. Suo, "Fracture of electrodes in lithium-ion batteries caused by fast charging," J. Appl. Phys., vol. 108, pp. 073517-6, 2010.
[4] J. H. Lee, H. M. Lee and S. Ahn, "Battery dimensional changes occurring during charge/discharge cycles- thin rectangular lithium ion and polymer cells," J. Power Sources, Vols. 119-121, no. 0, pp. 833-837, jun 2003.
[5] Y. Zhu and C. Wang, "Strain accommodation and potential hysteresis of LiFePO4 cathodes during lithium ion insertion/extraction," J. Power Sources, vol. 196, no. 3, pp. 1442-1448, Feb 2011.
[6] A. Yamada, S. C. Chung and K. Hinokuma, "Optimized LiFePO4 for Lithium Battery Cathodes," J. Electrochem. Soc., vol. 148, pp. A224-A229, 2001.
[7] J. B. Siegel, X. Lin, A. G. Stefanopoulou, D. S. Hussey, D. L. Jacobson and D. Gorsich, "Neutron Imaging of Lithium Concentration in LFP Pouch Cell Battery," J. Electrochem. Soc., vol. 158, no. 5,

14
pp. A523-A529, 2011.
[8] D. S. Hussey, D. L. Jacobson, M. Arif, K. J. Coakley and D. F. Vecchia, "In Situ Fuel Cell Water Metrology at the NIST Neutron Imaging Facility," J. Fuel Cell Sci. Technol., vol. 7, 2010.
[9] C. Peabody and C. B. Arnold, "The role of mechanically induced separator creep in lithium-ion battery capacity fade," Journal of Power Sources, vol. 196, p. 8147– 8153, 2011.
[10] T. F. Coleman and Y. Li, "An Interior, Trust Region Approach for Nonlinear Minimization Subject to Bounds," SIAM J. Optimization, vol. 6, p. 418–445, 1996.
[11] A. Harms and D. Wyman, Mathematics and Physics of Neutron Radiography, Springer, 1986.
[12] J. R. Dahn, "Phase diagram of LixC6," Phys. Rev. B, vol. 44, no. 17, pp. 9170-9177, Nov 1991.
[13] N. Takami, A. Satoh, M. Hara and T. Ohsaki, "Structural and Kinetic Characterization of Lithium Intercalation into Carbon Anodes for Secondary Lithium Batteries," J. Electrochem. Soc., vol. 142, no. 2, pp. 371-379, 1995.
[14] Y. . F. Reynier, R. Yazami and B. Fultz, "Thermodynamics of Lithium Intercalation into Graphites and Disordered Carbons," J. Electrochem. Soc., vol. 151, no. 3, pp. A422-A426, 2004.
[15] R. V. Bugga and M. C. Smart, "Lithium Plating Behavior in Lithium-Ion Cells," ECS Transactions, vol. 25 , no. 36, pp. 241-252, 2010.