Exosome-like vesicles in uterine aspirates: a comparison ...
12
Campoy et al. J Transl Med (2016) 14:180 DOI 10.1186/s12967-016-0935-4 RESEARCH Exosome-like vesicles in uterine aspirates: a comparison of ultracentrifugation-based isolation protocols Irene Campoy 1† , Lucia Lanau 1† , Tatiana Altadill 1 , Tamara Sequeiros 2 , Silvia Cabrera 3 , Montserrat Cubo‑Abert 3 , Assumpción Pérez‑Benavente 3 , Angel Garcia 4 , Salvador Borrós 5 , Anna Santamaria 1 , Jordi Ponce 6 , Xavier Matias‑Guiu 7 , Jaume Reventós 1,8,9 , Antonio Gil‑Moreno 1,3‡ , Marina Rigau 1‡ and Eva Colas 1,7*‡ Abstract Background: Uterine aspirates are used in the diagnostic process of endometrial disorders, yet further applications could emerge if its complex milieu was simplified. Exosome‑like vesicles isolated from uterine aspirates could become an attractive source of biomarkers, but there is a need to standardize isolation protocols. The objective of the study was to determine whether exosome‑like vesicles exist in the fluid fraction of uterine aspirates and to compare proto‑ cols for their isolation, characterization, and analysis. Methods: We collected uterine aspirates from 39 pre‑menopausal women suffering from benign gynecological dis‑ eases. The fluid fraction of 27 of those aspirates were pooled and split into equal volumes to evaluate three differential centrifugation‑based procedures: (1) a standard protocol, (2) a filtration protocol, and (3) a sucrose cushion protocol. Characterization of isolated vesicles was assessed by electron microscopy, nanoparticle tracking analysis and immu‑ noblot. Specifically for RNA material, we evaluate the effect of sonication and RNase A treatment at different steps of the protocol. We finally confirmed the efficiency of the selected methods in non‑pooled samples. Results: All protocols were useful to isolate exosome‑like vesicles. However, the Standard procedure was the best performing protocol to isolate exosome‑like vesicles from uterine aspirates: nanoparticle tracking analysis revealed a higher concentration of vesicles with a mode of 135 ± 5 nm, and immunoblot showed a higher expression of exosome‑related markers (CD9, CD63, and CD81) thus verifying an enrichment in this type of vesicles. RNA contained in exosome‑like vesicles was successfully extracted with no sonication treatment and exogenous nucleic acids diges‑ tion with RNaseA, allowing the analysis of the specific inner cargo by Real‑Time qPCR. Conclusion: We confirmed the existence of exosome‑like vesicles in the fluid fraction of uterine aspirates. They were successfully isolated by differential centrifugation giving sufficient proteomic and transcriptomic material for further analyses. The Standard protocol was the best performing procedure since the other two tested protocols did not ameliorate neither yield nor purity of exosome‑like vesicles. This study contributes to establishing the basis for future comparative studies to foster the field of biomarker research in gynecology. Keywords: Biomarker, Endometrial biopsy, Exosomes, Exosomes isolation protocols, Exosome‑like vesicles, Extracellular vesicles, Gynecological disorders, Microvesicles, RNA, Uterine aspirates © 2016 The Author(s). This article is distributed under the terms of the Creative Commons Attribution 4.0 International License (http://creativecommons.org/licenses/by/4.0/), which permits unrestricted use, distribution, and reproduction in any medium, provided you give appropriate credit to the original author(s) and the source, provide a link to the Creative Commons license, and indicate if changes were made. The Creative Commons Public Domain Dedication waiver (http://creativecommons.org/ publicdomain/zero/1.0/) applies to the data made available in this article, unless otherwise stated. Open Access Journal of Translational Medicine *Correspondence: [email protected] † Irene Campoy and Lucia Lanau contributed equally to this work ‡ Antonio Gil‑Moreno, Marina Rigau and Eva Colas are co‑senior authors 7 Department of Pathology and Molecular Genetics/Oncologic Pathology Group, University Hospital Arnau de Vilanova, University of Lleida, IRBLleida, Lleida, Spain Full list of author information is available at the end of the article
Transcript of Exosome-like vesicles in uterine aspirates: a comparison ...
Campoy et al. J Transl Med (2016) 14:180 DOI 10.1186/s12967-016-0935-4
RESEARCH
Exosome-like vesicles in uterine aspirates: a comparison of ultracentrifugation-based isolation protocolsIrene Campoy1†, Lucia Lanau1†, Tatiana Altadill1, Tamara Sequeiros2, Silvia Cabrera3, Montserrat Cubo‑Abert3, Assumpción Pérez‑Benavente3, Angel Garcia4, Salvador Borrós5, Anna Santamaria1, Jordi Ponce6, Xavier Matias‑Guiu7, Jaume Reventós1,8,9, Antonio Gil‑Moreno1,3‡, Marina Rigau1‡ and Eva Colas1,7*‡
Abstract
Background: Uterine aspirates are used in the diagnostic process of endometrial disorders, yet further applications could emerge if its complex milieu was simplified. Exosome‑like vesicles isolated from uterine aspirates could become an attractive source of biomarkers, but there is a need to standardize isolation protocols. The objective of the study was to determine whether exosome‑like vesicles exist in the fluid fraction of uterine aspirates and to compare proto‑cols for their isolation, characterization, and analysis.
Methods: We collected uterine aspirates from 39 pre‑menopausal women suffering from benign gynecological dis‑eases. The fluid fraction of 27 of those aspirates were pooled and split into equal volumes to evaluate three differential centrifugation‑based procedures: (1) a standard protocol, (2) a filtration protocol, and (3) a sucrose cushion protocol. Characterization of isolated vesicles was assessed by electron microscopy, nanoparticle tracking analysis and immu‑noblot. Specifically for RNA material, we evaluate the effect of sonication and RNase A treatment at different steps of the protocol. We finally confirmed the efficiency of the selected methods in non‑pooled samples.
Results: All protocols were useful to isolate exosome‑like vesicles. However, the Standard procedure was the best performing protocol to isolate exosome‑like vesicles from uterine aspirates: nanoparticle tracking analysis revealed a higher concentration of vesicles with a mode of 135 ± 5 nm, and immunoblot showed a higher expression of exosome‑related markers (CD9, CD63, and CD81) thus verifying an enrichment in this type of vesicles. RNA contained in exosome‑like vesicles was successfully extracted with no sonication treatment and exogenous nucleic acids diges‑tion with RNaseA, allowing the analysis of the specific inner cargo by Real‑Time qPCR.
Conclusion: We confirmed the existence of exosome‑like vesicles in the fluid fraction of uterine aspirates. They were successfully isolated by differential centrifugation giving sufficient proteomic and transcriptomic material for further analyses. The Standard protocol was the best performing procedure since the other two tested protocols did not ameliorate neither yield nor purity of exosome‑like vesicles. This study contributes to establishing the basis for future comparative studies to foster the field of biomarker research in gynecology.
Keywords: Biomarker, Endometrial biopsy, Exosomes, Exosomes isolation protocols, Exosome‑like vesicles, Extracellular vesicles, Gynecological disorders, Microvesicles, RNA, Uterine aspirates
© 2016 The Author(s). This article is distributed under the terms of the Creative Commons Attribution 4.0 International License (http://creativecommons.org/licenses/by/4.0/), which permits unrestricted use, distribution, and reproduction in any medium, provided you give appropriate credit to the original author(s) and the source, provide a link to the Creative Commons license, and indicate if changes were made. The Creative Commons Public Domain Dedication waiver (http://creativecommons.org/publicdomain/zero/1.0/) applies to the data made available in this article, unless otherwise stated.
Open Access
Journal of Translational Medicine
*Correspondence: [email protected] †Irene Campoy and Lucia Lanau contributed equally to this work ‡Antonio Gil‑Moreno, Marina Rigau and Eva Colas are co‑senior authors
7 Department of Pathology and Molecular Genetics/Oncologic Pathology Group, University Hospital Arnau de Vilanova, University of Lleida, IRBLleida, Lleida, SpainFull list of author information is available at the end of the article
Page 2 of 12Campoy et al. J Transl Med (2016) 14:180
BackgroundUterine aspirates (UAs), which are endometrial biopsies obtained by aspiration, are considered a very complex biological sample that highly represents the uterine cav-ity milieu. It combines the components of the uterine fluid (secretions from the luminal epithelium and glands, proteins selectively transferred from blood, and likely contributors from tubal fluid) with a cellular fraction (endometrial and blood cells) [1]. Thanks to its location and composition, UAs reflect cytological and molecular alterations present in tissues from the female genital tract [2, 3]. Therefore, this sample is currently used for histo-pathological examination, performed after the transvagi-nal ultrasonography, to diagnose endometrial disorders [4, 5]. Biomedical research on UAs is limited. However, although few molecular studies have been performed, those have significantly contributed to improving sensi-tivity and negative predictive value of UAs as a diagnostic tool for endometrial cancer [2, 3, 6]. To expand research in the field of biomarker discovery for gynecological pathologies using UAs, exosome-like vesicles (EVs) arise as a promising source of biomarkers.
EVs are 20–200 nm round membrane vesicles [7–9] released by multivesicular bodies fusing with the cell mem-brane [10, 11]. These lipid bilayer entities bear well-pro-tected proteins, lipids, and RNAs, mediating intercellular communication between different cell types [12–15]. Spe-cific sorted information is horizontally transferred from the cells of origin to other cells, influencing the recipient cell functions [16]. EVs are constantly released by cells in cir-culation or proximal body fluids, and therefore, they have been described in blood [17], urine [18], saliva, and breast milk [19], among other body fluids. Differently, microvesi-cles (MVs) are 100–1000 nm vesicles originated by budding/shedding of the plasma membrane [20]; their size range overlaps partially with that of EVs, hence hindering a com-plete size-discrimination between these two populations of extracellular vesicles [21, 22]. The features of EVs have fostered biomarker research in many diseases [16, 23–25]. However, a major bottleneck when performing EVs-based studies is the lack of standardization for already challenging techniques to isolate and characterize EVs. Since EVs reflect the status of the originating cell [23], we propose the UAs’ fluid fraction as a promising source of EVs to find molecules that could improve the diagnosis, prognosis, and treatment of gynecological alterations. Here, we aim to determine whether EVs exist in UAs and to compare protocols for their isolation, characterization, and further RNA analysis.
MethodsSample collection and processingA total of 39 pre-menopausal patients with benign gynecological diseases or healthy donors who came to
the Unit of Gynecology at Vall Hebron University Hospi-tal were recruited following the ethically approved proto-col for this study (approval number: PR_AMI_50-2012). All patients signed the informed consent. A descrip-tion of the clinic-pathological features of all participat-ing patients is detailed in Additional file 1: Table S1. An inclusion criterion was pre-menopause. Women who had been treated previously for gynecological pelvic cancer, as well as patients positive for the human immunodefi-ciency virus and/or the hepatitis virus were excluded.
UAs were obtained by aspiration with a Cornier Pipelle (Gynetics Medical Products). Samples were placed in 1.5 mL tubes and kept on ice through all the processing which included addition of phosphate buffered saline (PBS) in a 1:1 ratio (v/v), gently pipetting of the sam-ple and centrifugation at 2500g (4 °C) in a F45-30-11 rotor (Eppendorf Microcentrifuge 5417R) for 20 min to remove the cellular fraction. The remaining fluid fraction of the UA, from now on referred to as Supernatant (SN) fraction, was then aliquoted and frozen at −80 °C until needed. To compare isolation protocols, a pool of 27 SNs (samples 1–27; Additional file 1: Table S1) were mixed and divided into 20 aliquots containing 445 µL.
Isolation of EVsProtocols described in sections “I”, “II”, and “III” (Fig. 1a) were performed in quadruplicates to optimize EVs isolation. To optimize miRNA/mRNA extraction, modifications of the Standard protocol were tested in duplicates—section “IV” (Fig. 3a).
Standard protocolEVs were obtained from the SNs of UAs by differential centrifugation, following a modification of a previously described EVs isolation protocol by Thery et al. [26]. Briefly, SNs were thawed and diluted in PBS to a final vol-ume of 25 mL. A centrifugation step at 10,000g (4 °C) for 30 min was performed on a Thermo Scientific Heraeus MultifugeX3R Centrifuge (FiberLite rotor F15-8x-50c) to remove cell debris, macroparticles and apoptotic bodies. The resulting pellet enriched in MVs was resuspended in 50 µL of PBS and frozen at −80 °C. Then, the supernatant was transferred to ultracentrifuge tubes (Beckman Coul-ter) and filled with PBS to perform a first ultracentrifuga-tion step at 100,000g (4 °C) for 2 h on a Thermo Scientific Sorvall WX UltraSeries Centrifuge with an AH-629 rotor. The supernatant of this second centrifugation was the soluble fraction and was frozen at −80 °C. This first pel-let was resuspended in PBS and again centrifuged at 100,000g (4 °C) for 1 h. The final pellet enriched in EVs (possibly along with MVs and some remaining apoptotic bodies) was resuspended in 50 µL of PBS. Five microliters from MVs and EVs pellets were reserved at −80 °C for

Page 3 of 12Campoy et al. J Transl Med (2016) 14:180
St F S St F S St F S
CD9
CD63
CD81TSG101
Flotillin-1
Annexin VHaptoglobin
MVs EVs SF
a b
c d f
Sta
ndar
d F
iltra
tion
Suc
rose
EV MV
500 nm
500 nm
200 nm
200 nm
200 nm 500 nm
UterineAspirate
x 27
Pool of Uterine Aspirates’ SNs
2,500 x g20 min (4ºC)
SNPellet
x 27
x 4 x 4 x 4
10,000 x g30 min (4ºC)
10,000 x g30 min (4ºC)
10,000 x g30 min (4ºC) pellet = Micro-
vesicles (MVs)SN SN SN
0,2 µm Filter
100,000 x g 2 h (4ºC)
100,000 x g 2 h (4ºC)
100,000 x g 2 h (4ºC) SN = Soluble
Fraction (SF)pellet pellet pellet
30% Sucrosecushion
100,000 x g 1 h (4ºC)
100,000 x g 1 h (4ºC)
100,000 x g 1 h (4ºC) pellet = Exosome-
like Vesicles (EVs)
Standard (St) Filtration (F) Sucrose (S)
x 20 aliquots
100,000 x g 1 h (4ºC)
e
Tetra
span
ins
expr
essi
on (A
.U.)* *
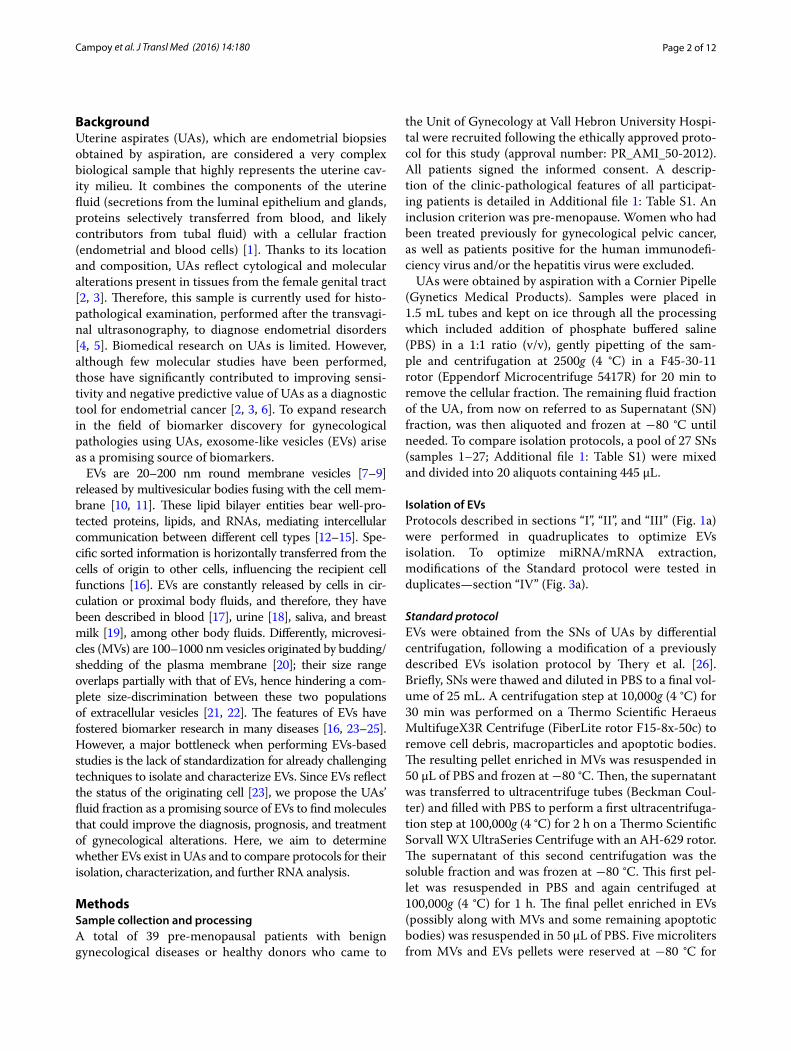
Fig. 1 Optimization of EVs isolation from uterine aspirates. a Schematic representation of the three protocols of EVs isolation, namely Standard (St), Filtration (F), and Sucrose (S) protocols. b Electron microscopy images of negatively stained EVs and MVs. c Size distribution of isolated EVs measured by NTA. d EVs concentration measured by NTA. e Immunoblot of isolated MVs, EVs and SF proteins (done in triplicates) against EVs/MVs markers and Haptoglobin. f Relative tetraspanins expression of EVs. The average of tetraspanins (CD9, CD63 and CD81) expression of each protocol was normalized to the Standard in order to have a relative measurement of EVs purity

Page 4 of 12Campoy et al. J Transl Med (2016) 14:180
particle size distribution and quantification by nanopar-ticle tracking analysis (NTA) while the rest of the sample was frozen at −80 °C for protein extraction.
Filtration protocolThe Filtration protocol consisted in depleting the super-natant obtained after the 10,000g centrifugation of struc-tures bigger than 200 nm using a sterile filter (Corning). The rest of the protocol remains the same as for the Standard.
Sucrose cushion protocolA 30 % sucrose cushion (20 mM Tris–HCl, pH 7.4 in D2O)—density from 1.13–1.19 g/mL—was introduced to the Standard protocol following the first ultracentrifu-gation at 100,000g. The sucrose cushion was then centri-fuged for 1 h at 100,000g (4 °C). EVs were recovered by poling the tube with a needle and were then washed with PBS for 1 h at 100,000g (4 °C). The final pellet was resus-pended in 50 μL of PBS and the same fractions as in Sec-tion “I” were stored at −80 °C.
Experimental conditions for RNA extractionFour experimental conditions (“A”, “B”, “C” and “D”) derived from the Standard protocol were tested, includ-ing sonication and RNase A treatment at different points, as shown in Fig. 3a. EVs were sonicated five cycles of 5 s at 100 Amplitude (Sartorius). For RNase A treatment, EVs were incubated with 500 µL of 0.1 mg/mL RNase A (Qiagen) for 1 h at 37 °C.
Particle size distribution and quantificationNTA was performed using a NanoSight LM10 system (Malvern Instruments) equipped with a 405 nm laser and a Hamamatsu C11440 ORCA-Flash2.8 camera (Hama-matsu). Data was analyzed with the NTA software 2.3. Size and concentration of particles were determined by the following settings: camera level and detection thresh-old were set to maximum (15 or 16) and minimum (3–5), respectively; camera gain was set to 512; blur, mini-mum track length, and minimum expected size were set to “auto.” Readings were taken in triplicates during 60 s at 18.87 frames/s, at room temperature ranging from 23–25 °C.
Electron microscopyIsolated MVs and EVs were analyzed per duplicate by transmission electron microscopy (TEM). Vesicles were fixed in 50 µL of 4 % paraformaldehyde. Gold grids were incubated with samples for 1 min. After removing sam-ple excess, negative staining was performed by incuba-tion with uranyl acetate for 1 min. After washing, grids were dried overnight at room temperature. Samples were
observed with a transmission electron microscope JEOL 1010 coupled to an Orius CCD camera (Gatan, Inc.), working at 80 kV with a tungsten filament.
Protein extractionProtein extraction of EVs and MVs was performed by adding RIPA buffer (40 mM Tris pH 8, 300 mM NaCl, 10 mM EDTA, 2 %Triton X-100, 1:100 protease inhibi-tors (#P8340 Sigma-Aldrich) in 1:1 ratio (v/v) to isolated vesicles and incubating at −20 °C overnight. Lysates were thawed on ice and sonicated five cycles of 5 s at ampli-tude 100 (Labsonic M, Sartorius Stedim Biotech) to ensure membrane disruption. Protein extraction of the soluble fraction collected after the 2 h ultracentrifugation step was performed by precipitation with 100 % stock solution of acetonitrile at a ratio of 1:5 (v/v) after incuba-tion at −20 °C overnight, and sequential centrifugations at 14,000×g 4 °C for 30 and 15 min, respectively. Finally, the pellet was dried and resuspended in 500 µL of RIPA. Protein concentration was determined by Bio-Rad DC Protein Assay (Bio-Rad Laboratories) following manufac-turer’s recommendations.
ImmunoblotProteins were separated by 10 % SDS-PAGE and trans-ferred to PVDF membranes. For blocking, membranes were soaked in 5 % non-fat dried milk in TBS-Tween20 (0.01 %). Proteins were immunodetected using primary antibodies. Then the membranes were washed and incu-bated with a secondary HRP-coupled antibody. Finally, HRP signal was revealed using the Immobilon Western Chemiluminescent HRP Substrate (ref. WBKLS0100; Merck Millipore). The intensity of the bands was densito-metrically quantified using the Image J software (v. 1.45s).
Primary antibodies: mouse anti-CD9 (1:250; ref. 555370, BD Biosciences), mouse anti-CD63 (1:1000; ref. OP171, Calbiochem), mouse anti-CD81 (1:1000; ref. sc-166028, Santa Cruz), mouse anti-TSG101 (1:500; ref. Ab83, Abcam), mouse anti-Flotillin-1 (1:250; ref. 610821, BD Biosciences), rabbit anti-Annexin V (1:1000; ref. ab108321, Abcam) and mouse anti-Haptoglobin (1:1000; ref. ab13429, Abcam). Secondary antibodies: rabbit anti-mouse Immunoglobulins/HRP, 1:2000, ref. P0260, Dako; and goat anti-rabbit Immunoglobulins/HRP, 1:2000, ref. P0448, Dako. Bands’ intensity was quantified using the Image J software (v. 1.45s).
Total RNA extractionTotal RNA, including miRNAs and other RNAs, was isolated using Qiazol and miRNeasy MiniKit (Qiagen) according to manufacturers’ protocol. DNase I treatment (Qiagen) was used. RNA from EVs and MVs was eluted with 20 µL of Nuclease-free water (Ambion) and stored at

Page 5 of 12Campoy et al. J Transl Med (2016) 14:180
−80 °C until further analysis. In all RNA extractions per-formed, 25 nmol of synthetic nonhuman miRNA-39 from Caenorhabditis elegans (cel-mir-39, 5′-UCACCGGGUG UAAAUCAGCUUG-3′) was added to each Qiazol lysate as a spike-in control for normalization in quantitative Real-Time qPCR (RT-qPCR) analysis [27–29]. RNA con-centration and integrity were determined by capillary electrophoresis using the Agilent RNA6000PicoKit on an Agilent2100 Bioanalyzer (AgilentTechnologies).
Reverse transcription, pre‑amplification, and RT‑qPCRFor mRNA analysis, RNA was converted to cDNA using SuperScript III Reverse Transcriptase (Invitro-gen). For miRNA analysis, RNA was reverse-transcribed using TaqMan MicroRNA Reverse Transcription Kit and miRNA-specific stem-loop primers. All cDNA was pre-amplified with TaqMan Preamp Master Mix Kit (Applied Biosystems) according to manufacturer’s instructions.
RT-qPCR was performed using TaqMan Universal MasterMix II, with UNG on an ABI7900 Real-Time PCR Systems with TaqMan probes against specific transcripts and miRNAs. Reactions were performed in triplicate, and only results with a standard deviation value <0.37 were accepted. Data analysis was done with Expression Suite Software v1.0; the same baseline and threshold were set for each plate to generate threshold cycle (Ct) values for all the targets in each sample. Threshold levels were set into the exponential phase of the RT-qPCR. Synthetic cel-mir-39 was used for data normalization since the same amount of the oligonucleotide was added to each sample before the addition of the lysis reagent for RNA isolation.
Real‑Time qPCR TaqMan probesAll probes were purchased from LifeTechnologies. TSG101 (Hs00173072), PDCD6IP-ALIX (Hs00183813_m1), CD24 (Hs02379687), MUC16-CA-125 (Hs01065189), MUC1 (Cf02626759_m1), 18S (4319413E), β-Actin (4333762T), GAPDH (Hs99999905_m1), miR-200b (002251), miR-200c (002300), miR-223 (002295), miR-141 (000463), miR-205 (000509), miR-17 (002308), miR-106a (002169), RNU48 (001006), RNU6B (001093), RNU44 (001094), U75 (001219), and miR-39 (000200).
Statistical analysesStatistical analyses were performed using GraphPad Prism 5 software. The Student’s t test was applied to compare means of EVs concentration, particle size dis-tribution, and expression of tetraspanins and miRNAs. The Pearsons’ Rho test was used to analyze correlation. The probability of p < 0.05 was considered statistically significant.
ResultsEVs are present in the fluid fraction of uterine aspirates and can be isolated by differential centrifugation‑based protocolsA pool of 27 UAs’ fluid fractions was used to compare three EVs isolation protocols based on differential cen-trifugation—Standard, Filtration and Sucrose. In addition to EVs, we collected fractions corresponding to MVs and proteins from the soluble fraction to monitor differences in the enrichment in EVs. A schematic representation of the experimental work is depicted in Fig. 1a.
All three protocols permitted the isolation of EVs of the expected round cup shape [30], as observed by TEM (Fig. 1b). Both EVs and MVs appeared as well-defined bilayer vesicles but notably, the size of all EVs was smaller than that for MVs, especially in the case of Standard pro-tocol. To further investigate EVs concentration and size distribution, samples were analyzed by NTA (Fig. 1c, d). The population of EVs isolated by the Standard and Filtration protocols followed a uniform size distribu-tion with a unique peak corresponding to a mode of 135 ± 5 and 115 ± 3 nm, respectively. For the Sucrose protocol, the distribution was not uniform; the mode was 135 ± 42 nm but presented an additional peak around 300 nm, and a high standard deviation was observed indicating less reproducibility of this isolation protocol. Differently, all MVs preparations presented a heterogene-ous distribution, and a lower concentration than that for EVs (Additional file 2: Figure S1).
A reduction in EVs concentration was seen as more steps were added to the isolation protocol; signifi-cant differences were observed between Standard and Sucrose protocols (p = 0.029), and the same tendency was observed when comparing the Standard and Filtra-tion protocols (Fig. 1d). To evaluate the purity of EVs obtained from each isolation protocol, we performed an immunoblot loading equal amounts of protein, and demonstrated that the expression of the tetraspanins CD63, CD9, and CD81—all considered late endosomal markers enriched in EVs [22, 31, 32]—was significantly higher in the Standard compared to the Sucrose protocol (p = 0.001) (Fig. 1e, f ). The same tendency was observed for TSG101, a known endosomal origin marker [33], and Flotillin-1, an element of the membrane lipid rafts [34, 35]. These two markers were practically undetect-able in MVs preparations, indicating a different biogen-esis of these vesicles. As expected, Annexin V, a marker of MVs [36], was highly expressed in all MVs prepara-tions; however, it was also detected in EVs derived from the Standard protocol suggesting that the smallest MVs populations might have precipitated at 100,000g or that specificity of this marker is arguably. None of the MVs or EVs markers were detected in the soluble fraction, but

Page 6 of 12Campoy et al. J Transl Med (2016) 14:180
haptoglobin—an abundant protein found in blood—was highly expressed (Fig. 1e).
Altogether, we demonstrated that all protocols were able to enrich the sample in EVs. Nevertheless, we selected the Standard protocol for further applications since it allowed to obtain a higher EVs concentration, while maintained higher EVs-related markers and better reproducibility than the other tested protocols.
To confirm that the enrichment in EVs following the Standard protocol holds when analyzing individual sam-ples, we recovered EVs, MVs and soluble proteins from the fluid fraction of 6 non-pooled UAs (samples 28–33, Additional file 1: Table S1). Concomitant to our previous observations in the pooled analysis, we observed that all EVs preparations from individual UAs had a similar size distribution, presenting a mode of 120–160 nm (Fig. 2a). The particles concentration differed clearly between patients but a total number of isolated EVs significantly correlated with the initial volume of UAs fluid fraction (r = 0.90, p = 0.02) (Fig. 2b, c), but not with protein con-centration (Additional file 3: Figure S2). On the other hand, no correlation was observed between a number of MVs and sample volume (Additional file 4: Figure S3).
EVs markers were expressed in both EVs and MVs prep-arations from all patients (Fig. 2d, e). As seen previ-ously, tetraspanins expression was higher in EVs than in MVs, indicating that we isolated a population of vesicles enriched in EVs. Altogether, these results indicate that the Standard protocol is suitable to obtain EVs from indi-vidual UAs.
Optimization of EVs isolation protocols for RNA analysisTo further optimize the Standard protocol to extract RNA specifically contained in EVs, we evaluated the effect of sonication and RNase treatment, which enhances membrane disruption and promotes RNA release, and degrades RNA material, respectively (Fig. 3a). Concen-tration and quality of extracted RNA was determined by Bioanalyzer and RT-qPCR amplification of a set of miR-NAs (miR-200b, miR-200c, miR-223, miR-17 and miR-106a), which were selected based on their expression in the female genital tract and their reported existence in EVs [22, 37–40]. Protocol “A”, which includes sonication before RNase A treatment, was used as negative con-trol. This condition confirmed the successful breakage of EVs due to sonication and the successful degradation
Pt. 28Pt. 29
Pt. 30Pt. 31
Pt. 32
Pt. 33
CD9
CD63
CD81
TSG101
Flotillin-1
Annexin V
Haptoglobin
Pt. 28 Pt. 29 Pt. 30 Pt. 31 Pt. 32 Pt. 33
MV EV SF MV EV SF MV EV SF MV EV SF MV EV SF MV EV SF
a b c
d
e
Pt. 28 Pt. 29 Pt. 30 Pt. 31 Pt. 32 Pt. 33 Pt. 28 Pt. 29 Pt. 30 Pt. 31 Pt. 32 Pt. 33
Pt. 28 Pt. 29 Pt. 30 Pt. 31 Pt. 32 Pt. 33
Tetra
span
ins
expr
essi
on (A
.U.)
r= 0.90p= 0.02
Total number of EVs
Fig. 2 Characterization of EVs from individual uterine aspirates. a Particle size and b concentration of EVs was measured by NTA. c Correlation plot between total number of isolated EVs and starting volume of uterine aspirates’ fluid fraction. d Characterization of MVs, EVs and soluble fraction (SF) proteins by immunoblot against EVs/MVs markers and Haptoglobin. e Quantification of tetraspanins (CD9, CD63 and CD81) expression of EVs for each patient

Page 7 of 12Campoy et al. J Transl Med (2016) 14:180
Soni
catio
n +
RN
ase
A +
Soni
catio
n +
RN
ase
A -
Soni
catio
n -
RN
ase
A +
Soni
catio
n -
RN
ase
A -
RNA Concentration: 21 pg/µl
RNA Concentration: 7,133 pg/µl
RNA Concentration: 3,488 pg/µl
RNA Concentration: 10,351 pg/µl
c
18S 2,138 2,309 0.0
Start Size [nt] End Size [nt] % of total AreaName
Pool of Uterine Aspirates SN
x 2 x 2 x 2
pellet = Micro-vesicles (MVs)
SN = SolubleFraction (SF)
pellet = Exosome-like Vesicles (EVs)
x 20 aliquots
x 2
SN
100,000 x g 2 h (4ºC)
Sonication
10,000 x g30 min (4ºC)
10,000 x g30 min (4ºC)
10,000 x g30 min (4ºC)
10,000 x g30 min (4ºC)
100,000 x g 2 h (4ºC)
100,000 x g 2 h (4ºC)
100,000 x g 2 h (4ºC)
SN SN SN
100,000 x g 1 h (4ºC)
100,000 x g 1 h (4ºC)
100,000 x g 1 h (4ºC)
100,000 x g 1 h (4ºC)
pellet pellet pellet pellet
RNase A treatment
Total RNA extraction
RNase A treatment
Sonication
A B C D
Total RNA extraction
Total RNA extraction
Total RNA extraction
A
B
C
D
b
a
SonicationRNaseA
++ - --+ + -
SonicationRNase A
++ - --+ + -
SonicationRNaseA
++ - --+ + -
SonicationRNase A
++ - --+ + -
SonicationRNaseA
++ - --+ + -
hsa-
miR
-200
b C
t val
ues
hsa-
miR
-200
c C
t val
ues
hsa-
miR
-223
Ct v
alue
shs
a-m
iR-1
7 C
t val
ues
hsa-
miR
-106
a C
t val
ues
D CBA
D CBA
D CBA
D CBA
D CBA
*
* *
*
* *
*
* *
*
* *
*
* **

Page 8 of 12Campoy et al. J Transl Med (2016) 14:180
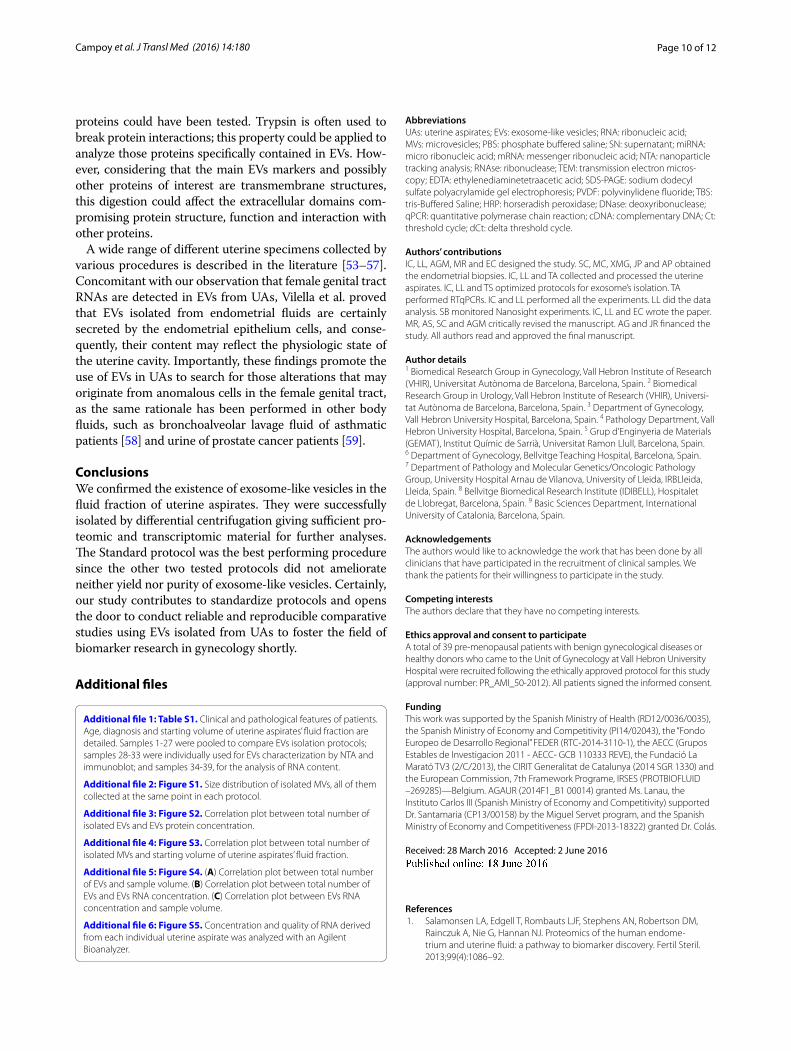
of RNA due to RNase A treatment, not obtaining RNA content nor amplification of any of the tested miRNAs (Fig. 3b, c). Protocols “B” and “D” did not deplete exter-nal RNA since RNase A was not applied; both protocols resulted in small size RNA profiles, yielding the highest amount of total RNA (Fig. 3b) and the highest expression of miRNAs (Fig. 3c). Importantly, the introduction of a sonication step did not report any advantage to enhance the release of EVs RNA content; conversely, we observed smaller RNA fragments, which are susceptible of RNA damage. In protocol “C”, RNase A was able to degrade 52 and 66 % of total RNA from treatment “B” and “D” respectively, suggesting that RNase A treatment is nec-essary to clean up the external nucleic acids that bind to EVs surface. This protocol (no sonication but RNase A treatment) was selected as the most appropriate to ana-lyze RNA specifically contained within EVs.
Next, we confirmed the efficiency of the selected proto-col for RNA analysis in 6 additional non-pooled samples (Samples 34–39; Additional file 1: Table S1). Isolated EVs were similar in size, presenting a mode of 120–170 nm and contained RNA fragments from 25–300 nucleotides (Additional file 5: Figure S4). RNA concentration ranged from 108–851 pg/µL (Fig. 4a), which was sufficient to per-form expression analysis by RT-qPCR. Sample volume, the total number of EVs and RNA concentration signifi-cantly correlated (Additional file 6: Figure S5A–C). Before RNA extraction, we added cel-miR-39 as a spike-in con-trol for data normalization purposes. As seen in Fig. 4b, its expression did not vary across different samples, indicating similar RNA extraction efficiency. Afterward, we tested the amplification of a set of 11 miRNAs and 8 mRNAs by RT-qPCR, all of them previously reported in EVs [41, 42] (Fig. 4c). Delta Ct (dCt) values were relativ-ized to the cel-miR-39 expression in each sample. We observed that 18S RNA presented the highest expression. Alix, TSG101, GAPDH and β-actin, EVs-related mark-ers, along with MUC16 [43] and CD24 [44–46], proteins related to some gynecological alterations, were detected at RNA level. In addition to those tested for the optimiza-tion, we also analyzed the expression of other female geni-tal tract-related miRNAs [38], miR-141 and miR-205, plus a set of tissue endogenous miRNAs [47], RNU6B, RNU48, RNU44, and U75. Expression of miR-200b, miR-200c, miR-223, miR-17, and miR-106a was higher compared
to miR-205 and miR-141. Interestingly, RNU6B, RNU48, RNU44, and U75 were expressed at very low level in EVs. Detection of female genital tract associated RNA in EVs from UAs supported the idea that EVs cargo might reflect the cell status and/or its origin. However, this study was designed to confirm the appropriate extraction of RNA material to pursue further RNA analysis on EVs isolated from UAs, and is not intended to draw any disease-spe-cific conclusion.
DiscussionHere, we demonstrated that EVs exist in the fluid fraction of UAs by comparing three protocols of isolation, all of them based on ultracentrifugation, as this has been the method of choice for concentrating and isolating EVs in several body fluids [48]. Moreover, we carried out an extensive characterization describing their morphol-ogy, size and enrichment in well-known EV markers. When comparing the Standard, Filtration, and Sucrose protocols, we observed that all of them were capable of isolating EVs; but in particular, the Standard protocol permitted not only a higher recovery of EVs, but also a higher enrichment in tetraspanins. Furthermore, this protocol was the simplest, most reproducible and less costly protocol investigated here.
Many studies did not consider whether identified RNAs were contained in EVs or adhered externally to their outer membrane and, consequently, co-precipitated with EVs during the isolation protocol [49–51]. Here, we also estab-lished the optimal conditions to extract EVs RNA content treating isolated vesicles with RNase A and not applying sonication. Even though sonication was applied to suc-cessfully disrupt EVs membrane to improve protein yield [52], when this step was performed for RNA extraction, far from obtaining higher RNA concentration, we detected fragmentation and degradation. Thus, sonication of EVs is not appropriate for RNA studies; lysis reagent is efficient enough to break EVs membranes. Noteworthy, treatment with RNAse A was critical to eliminate the exogenous material while preserving the inner genomic content. We found that more than half of the RNA isolated from EVs preparations was exogenous. This abundant contamina-tion should be considered, and if possible depleted when conducting transcriptomic studies. In line with this, a treat-ment to clean up EVs membranes from extraneous adhered
(See figure on previous page.) Fig. 3 Optimization of EVs isolation from uterine aspirates for RNA analysis. a Schematic representation of the four conditions tested to isolate EVs from uterine aspirates in order to purify their RNA content. Modifications were introduced to the standard protocol of ultracentrifugation. Protocol “A”: Sonication prior to RNase A treatment was applied to isolated EVs. Protocol “B”: Sonication of isolated EVs. Protocol “C”: RNase A treatment of isolated EVs. Protocol “D”: No modifications were included. b Concentration and quality of RNA derived from each condition was analyzed with an Agilent Bioanalyzer. c Ct values of miR‑200b, miR‑200c, miR‑223, miR‑205, miR‑17 and miR‑106a are plotted for each Protocol

Page 9 of 12Campoy et al. J Transl Med (2016) 14:180
Patie
nt 3
4Pa
tient
35
Patie
nt 3
6Pa
tient
37
Patie
nt 3
8Pa
tient
39
a b
c
cel-m
iR-3
9 C
t val
ues
Pt. 34 Pt. 35 Pt. 36 Pt. 37 Pt. 38 Pt. 39 Pt. 34 Pt. 35 Pt. 36 Pt. 37 Pt. 38 Pt. 39
Fig. 4 Characterization of EVs RNA content from individual uterine aspirates. a RNA concentration determined by Agilent Bioanalyzer. b Ct values of cel‑miR‑39 are plotted. c Expression of a set of miRNAs (left) and mRNAs (right) are ploted for each patient. Ct values were obtained by RT‑qPCR and were normalized using miR‑39 expression as a spike‑in control
Page 10 of 12Campoy et al. J Transl Med (2016) 14:180
proteins could have been tested. Trypsin is often used to break protein interactions; this property could be applied to analyze those proteins specifically contained in EVs. How-ever, considering that the main EVs markers and possibly other proteins of interest are transmembrane structures, this digestion could affect the extracellular domains com-promising protein structure, function and interaction with other proteins.
A wide range of different uterine specimens collected by various procedures is described in the literature [53–57]. Concomitant with our observation that female genital tract RNAs are detected in EVs from UAs, Vilella et al. proved that EVs isolated from endometrial fluids are certainly secreted by the endometrial epithelium cells, and conse-quently, their content may reflect the physiologic state of the uterine cavity. Importantly, these findings promote the use of EVs in UAs to search for those alterations that may originate from anomalous cells in the female genital tract, as the same rationale has been performed in other body fluids, such as bronchoalveolar lavage fluid of asthmatic patients [58] and urine of prostate cancer patients [59].
ConclusionsWe confirmed the existence of exosome-like vesicles in the fluid fraction of uterine aspirates. They were successfully isolated by differential centrifugation giving sufficient pro-teomic and transcriptomic material for further analyses. The Standard protocol was the best performing procedure since the other two tested protocols did not ameliorate neither yield nor purity of exosome-like vesicles. Certainly, our study contributes to standardize protocols and opens the door to conduct reliable and reproducible comparative studies using EVs isolated from UAs to foster the field of biomarker research in gynecology shortly.
Additional files
Additional file 1: Table S1. Clinical and pathological features of patients. Age, diagnosis and starting volume of uterine aspirates’ fluid fraction are detailed. Samples 1‑27 were pooled to compare EVs isolation protocols; samples 28‑33 were individually used for EVs characterization by NTA and immunoblot; and samples 34‑39, for the analysis of RNA content.
Additional file 2: Figure S1. Size distribution of isolated MVs, all of them collected at the same point in each protocol.
Additional file 3: Figure S2. Correlation plot between total number of isolated EVs and EVs protein concentration.
Additional file 4: Figure S3. Correlation plot between total number of isolated MVs and starting volume of uterine aspirates’ fluid fraction.
Additional file 5: Figure S4. (A) Correlation plot between total number of EVs and sample volume. (B) Correlation plot between total number of EVs and EVs RNA concentration. (C) Correlation plot between EVs RNA concentration and sample volume.
Additional file 6: Figure S5. Concentration and quality of RNA derived from each individual uterine aspirate was analyzed with an Agilent Bioanalyzer.
AbbreviationsUAs: uterine aspirates; EVs: exosome‑like vesicles; RNA: ribonucleic acid; MVs: microvesicles; PBS: phosphate buffered saline; SN: supernatant; miRNA: micro ribonucleic acid; mRNA: messenger ribonucleic acid; NTA: nanoparticle tracking analysis; RNAse: ribonuclease; TEM: transmission electron micros‑copy; EDTA: ethylenediaminetetraacetic acid; SDS‑PAGE: sodium dodecyl sulfate polyacrylamide gel electrophoresis; PVDF: polyvinylidene fluoride; TBS: tris‑Buffered Saline; HRP: horseradish peroxidase; DNase: deoxyribonuclease; qPCR: quantitative polymerase chain reaction; cDNA: complementary DNA; Ct: threshold cycle; dCt: delta threshold cycle.
Authors’ contributionsIC, LL, AGM, MR and EC designed the study. SC, MC, XMG, JP and AP obtained the endometrial biopsies. IC, LL and TA collected and processed the uterine aspirates. IC, LL and TS optimized protocols for exosome’s isolation. TA performed RTqPCRs. IC and LL performed all the experiments. LL did the data analysis. SB monitored Nanosight experiments. IC, LL and EC wrote the paper. MR, AS, SC and AGM critically revised the manuscript. AG and JR financed the study. All authors read and approved the final manuscript.
Author details1 Biomedical Research Group in Gynecology, Vall Hebron Institute of Research (VHIR), Universitat Autònoma de Barcelona, Barcelona, Spain. 2 Biomedical Research Group in Urology, Vall Hebron Institute of Research (VHIR), Universi‑tat Autònoma de Barcelona, Barcelona, Spain. 3 Department of Gynecology, Vall Hebron University Hospital, Barcelona, Spain. 4 Pathology Department, Vall Hebron University Hospital, Barcelona, Spain. 5 Grup d’Enginyeria de Materials (GEMAT), Institut Químic de Sarrià, Universitat Ramon Llull, Barcelona, Spain. 6 Department of Gynecology, Bellvitge Teaching Hospital, Barcelona, Spain. 7 Department of Pathology and Molecular Genetics/Oncologic Pathology Group, University Hospital Arnau de Vilanova, University of Lleida, IRBLleida, Lleida, Spain. 8 Bellvitge Biomedical Research Institute (IDIBELL), Hospitalet de Llobregat, Barcelona, Spain. 9 Basic Sciences Department, International University of Catalonia, Barcelona, Spain.
AcknowledgementsThe authors would like to acknowledge the work that has been done by all clinicians that have participated in the recruitment of clinical samples. We thank the patients for their willingness to participate in the study.
Competing interestsThe authors declare that they have no competing interests.
Ethics approval and consent to participateA total of 39 pre‑menopausal patients with benign gynecological diseases or healthy donors who came to the Unit of Gynecology at Vall Hebron University Hospital were recruited following the ethically approved protocol for this study (approval number: PR_AMI_50‑2012). All patients signed the informed consent.
FundingThis work was supported by the Spanish Ministry of Health (RD12/0036/0035), the Spanish Ministry of Economy and Competitivity (PI14/02043), the “Fondo Europeo de Desarrollo Regional” FEDER (RTC‑2014‑3110‑1), the AECC (Grupos Estables de Investigacion 2011 ‑ AECC‑ GCB 110333 REVE), the Fundació La Marató TV3 (2/C/2013), the CIRIT Generalitat de Catalunya (2014 SGR 1330) and the European Commission, 7th Framework Programe, IRSES (PROTBIOFLUID –269285)—Belgium. AGAUR (2014F1_B1 00014) granted Ms. Lanau, the Instituto Carlos III (Spanish Ministry of Economy and Competitivity) supported Dr. Santamaria (CP13/00158) by the Miguel Servet program, and the Spanish Ministry of Economy and Competitiveness (FPDI‑2013‑18322) granted Dr. Colás.
Received: 28 March 2016 Accepted: 2 June 2016
References 1. Salamonsen LA, Edgell T, Rombauts LJF, Stephens AN, Robertson DM,
Rainczuk A, Nie G, Hannan NJ. Proteomics of the human endome‑trium and uterine fluid: a pathway to biomarker discovery. Fertil Steril. 2013;99(4):1086–92.

Page 11 of 12Campoy et al. J Transl Med (2016) 14:180
2. Colas E, Perez C, Cabrera S, Pedrola N, Monge M, Castellvi J, Eyzaguirre F, Gregorio J, Ruiz A, Llaurado M, Rigau M, Garcia M, Ertekin T, Montes M, Lopez‑Lopez R, Carreras R, Xercavins J, Ortega A, Maes T, Rosell E, Doll A, Abal M, Reventos J, Gil‑Moreno A. Molecular markers of endometrial car‑cinoma detected in uterine aspirates. Int J Cancer. 2011;129(10):2435–44.
3. Esteller M, García A, Martínez‑Palones JM, Xercavins J, Reventós J. Detec‑tion of clonality and genetic alterations in endometrial pipelle biopsy and its surgical specimen counterpart. Lab Invest. 1997;76(1):109–16.
4. Rodolakis A, Biliatis I, Morice P, Reed N, Mangler M, Kesic V, Denschlag D. European society of gynecological oncology task force for fertility preservation: clinical recommendations for fertility‑sparing manage‑ment in young endometrial cancer patients. Int J Gynecol Cancer. 2015;25(7):1258–65.
5. Colombo N, Preti E, Landoni F, Carinelli S, Colombo A, Marini C, Sessa C. Endometrial cancer: ESMO clinical practice guidelines for diagnosis, treat‑ment and follow‑up. Ann Oncol. 2013;24(SUPPL):6.
6. Perez‑Sanchez C, Colas E, Cabrera S, Falcon O, Sanchez‑del‑Río A, García E, Fernández‑de‑Castillo L, Muruzabal JC, Alvarez E, Fiol G, González C, Torrejón R, Moral E, Campos M, Repollés M, Carreras R, Jiménez‑López J, Xercavins J, Aibar E, Perdones‑Montero A, Lalanne E, Palicio M, Maes T, Rosell‑Vives E, Nieto C, Ortega A, Pedrola N, Llauradó M, Rigau M, Doll A, Abal M, Ponce J, Gil‑Moreno A, Reventós J. Molecular diagnosis of endo‑metrial cancer from uterine aspirates. Int J Cancer. 2013;133(10):2383–91.
7. Chen CY, Hogan MC, Ward CJ. Purification of exosome‑like vesicles from urine. Methods Enzymol. 2013;524:225–41.
8. Koturbash I, Tolleson WH, Guo L, Yu D, Chen S, Hong H, Mattes W, Ning B. microRNAs as pharmacogenomic biomarkers for drug efficacy and drug safety assessment. Biomark Med. 2015;9(11):1153–76.
9. Kosaka N, Yoshioka Y, Tominaga N, Hagiwara K, Katsuda T, Ochiya T. Dark side of the exosome: the role of the exosome in cancer metastasis and targeting the exosome as a strategy for cancer therapy. Future Oncol. 2014;10(4):671–81.
10. Harding C, Stahl P. Transferrin recycling in reticulocytes: pH and iron are important determinants of ligand binding and processing. Biochem Biophys Res Commun. 1983;113(2):650–8.
11. Pan BT, Johnstone RM. Fate of the transferrin receptor during maturation of sheep reticulocytes in vitro: selective externalization of the receptor. Cell. 1983;33(3):967–78.
12. Simons M, Raposo G. Exosomes–vesicular carriers for intercellular com‑munication. Curr Opin Cell Biol. 2009;21(4):575–81.
13. Johnstone RM, Adam M, Hammond JR, Orr L, Turbide C. Vesicle formation during reticulocyte maturation. Association of plasma membrane activi‑ties with released vesicles (exosomes). J Biol Chem. 1987;262(19):9412–20.
14. Bang C, Thum T. Exosomes: new players in cell–cell communication. Int J Biochem Cell Biol. 2012;44(11):2060–4.
15. Ludwig A‑K, Giebel B. Exosomes: small vesicles participating in intercel‑lular communication. Int J Biochem Cell Biol. 2012;44(1):11–5.
16. Miller IV, Grunewald TGP. Tumour‑derived exosomes: tiny envelopes for big stories. Biol Cell. 2015;107(9):287–305.
17. Kosaka N, Iguchi H, Ochiya T. Circulating microRNA in body fluid: a new potential biomarker for cancer diagnosis and prognosis. Cancer Sci. 2010;101(10):2087–92.
18. Gámez‑Valero A, Lozano‑Ramos SI, Bancu I, Lauzurica‑Valdemoros R, Borràs FE. Urinary extracellular vesicles as source of biomarkers in kidney diseases. Front Immunol. 2015;6:6.
19. Lässer C, Alikhani VS, Ekström K, Eldh M, Paredes PT, Bossios A, Sjöstrand M, Gabrielsson S, Lötvall J, Valadi H. Human saliva, plasma and breast milk exosomes contain RNA: uptake by macrophages. J. Transl. Med. 2011;9:9.
20. Théry C, Ostrowski M, Segura E. Membrane vesicles as conveyors of immune responses. Nat Rev Immunol. 2009;9(8):581–93.
21. Samsonov R, Shtam T, Burdakov V, Glotov A, Tsyrlina E, Berstein L, Nosov A, Evtushenko V, Filatov M, Malek A. Lectin‑induced agglutination method of urinary exosomes isolation followed by mi‑RNA analysis: application for prostate cancer diagnostic. Prostate. 2015;76(1):68–79.
22. Ng YH, Rome S, Jalabert A, Forterre A, Singh H, Hincks CL, Salamonsen LA. Endometrial exosomes/microvesicles in the uterine microenvironment: a new paradigm for embryo‑endometrial cross talk at implantation. PLoS ONE. 2013;8(3):e58502.
23. Properzi F, Logozzi M, Fais S. Exosomes: the future of biomarkers in medi‑cine. Biomark Med. 2013;7(5):769–78.
24. Franzen CA, Blackwell RH, Foreman KE, Kuo PC, Gupta GN. Urinary exosomes: the potential for biomarker utility, intercellular signaling and therapeutics in urological malignancy. J Urol. 2015.
25. Sadovska L, Eglītis J, Linē A. Extracellular vesicles as biomark‑ers and therapeutic targets in breast cancer. Anticancer Res. 2015;35(12):6379–90.
26. Théry C, Amigorena S, Raposo G, Clayton A. Isolation and characterization of exosomes from cell culture supernatants and biological fluids. Curr Protoc Cell Biol. Editor. board, Juan S Bonifacino et al. 2006; vol. Chapter 3. p. Unit 3.22.
27. McDonald JS, Milosevic D, Reddi HV, Grebe SK, Algeciras‑Schimnich A. Analysis of circulating microRNA: preanalytical and analytical challenges. Clin Chem. 2011;57(6):833–40.
28. Turchinovich A, Weiz L, Langheinz A, Burwinkel B. Characteriza‑tion of extracellular circulating microRNA. Nucleic Acids Res. 2011;39(16):7223–33.
29. Gourzones C, Ferrand F‑R, Amiel C, Vérillaud B, Barat A, Guérin M, Gattol‑liat C‑H, Gelin A, Klibi J, Ben Chaaben A, Schneider V, Guemira F, Guigay J, Lang P, Jimenez‑Pailhes A‑S, Busson P. Consistent high concentration of the viral microRNA BART17 in plasma samples from nasopharyn‑geal carcinoma patients–evidence of non‑exosomal transport. Virol J. 2013;10:119.
30. Colombo M, Raposo G, Théry C. Biogenesis, secretion, and intercellular interactions of exosomes and other extracellular vesicles. Annu Rev Cell Dev Biol. 2014;30(1):255–89.
31. Donker RB, Mouillet JF, Chu T, Hubel CA, Stolz DB, Morelli AE, Sadovsky Y. The expression profile of C19MC microRNAs in primary human tropho‑blast cells and exosomes. Mol Hum Reprod. 2012;18(8):417–24.
32. Salomon C, Torres MJ, Kobayashi M, Scholz‑Romero K, Sobrevia L, Dobierzewska A, Illanes SE, Mitchell MD, Rice GE. A gestational profile of placental exosomes in maternal plasma and their effects on endothelial cell migration. PLoS ONE. 2014;9(6):e98667.
33. Mitchell MD, Peiris HN, Kobayashi M, Koh YQ, Duncombe G, Illanes SE, Rice GE, Salomon C. Placental exosomes in normal and complicated pregnancy. Am J Obstet Gynecol. 2015;213(4):S173–81.
34. Ge M, Ke R, Cai T, Yang J, Mu X. Identification and proteomic analysis of osteoblast‑derived exosomes. Biochem Biophys Res Commun. 2015;467(1):27–32.
35. Al‑Nedawi K, Meehan B, Rak J. Microvesicles: messengers and mediators of tumor progression. Cell Cycle. 2009;8(13):2014–8.
36. Dachary‑Prigent J, Freyssinet JM, Pasquet JM, Carron JC, Nurden AT. Annexin V as a probe of aminophospholipid exposure and platelet membrane vesiculation: a flow cytometry study showing a role for free sulfhydryl groups. Blood. 1993;81(10):2554–65.
37. Ohlsson Teague EMC, Van der Hoek KH, Van der Hoek MB, Perry N, Wagaarachchi P, Robertson SA, Print CG, Hull LM. MicroRNA‑regulated pathways associated with endometriosis. Mol Endocrinol. 2009;23(2):265–75.
38. Taylor DD, Gercel‑Taylor C. MicroRNA signatures of tumor‑derived exosomes as diagnostic biomarkers of ovarian cancer. Gynecol Oncol. 2008;110(1):13–21.
39. Keerthikumar S, Chisanga D, Ariyaratne D, Al Saffar H, Anand S, Zhao K, Samuel M, Pathan M, Jois M, Chilamkurti N, Gangoda L, Mathivanan S. ExoCarta: a web‑based compendium of exosomal cargo. J Mol Biol 2015.
40. Devor EJ, Hovey AM, Goodheart MJ, Ramachandran S, Leslie KK. microRNA expression profiling of endometrial endometrioid adeno‑carcinomas and serous adenocarcinomas reveals profiles containing shared, unique and differentiating groups of microRNAs. Oncol Rep. 2011;26(4):995–1002.
41. Valadi H, Ekström K, Bossios A, Sjöstrand M, Lee JJ, Lötvall JO. Exosome‑mediated transfer of mRNAs and microRNAs is a novel mechanism of genetic exchange between cells. Nat Cell Biol. 2007;9(6):654–9.
42. Mathivanan S, Fahner CJ, Reid GE, Simpson RJ. ExoCarta 2012: database of exosomal proteins. RNA and lipids. Nucleic Acids Res. 2012;40((Database issue)):1241–4.
43. Dharmaraj N, Chapela PJ, Morgado M, Hawkins SM, Lessey BA, Young SL, Carson DD. Expression of the transmembrane mucins, MUC1, MUC4 and MUC16, in normal endometrium and in endometriosis. Hum Reprod. 2014;29(8):1730–8.

Page 12 of 12Campoy et al. J Transl Med (2016) 14:180
• We accept pre-submission inquiries
• Our selector tool helps you to find the most relevant journal
• We provide round the clock customer support
• Convenient online submission
• Thorough peer review
• Inclusion in PubMed and all major indexing services
• Maximum visibility for your research
Submit your manuscript atwww.biomedcentral.com/submit
Submit your next manuscript to BioMed Central and we will help you at every step:
44. Sundqvist J, Andersson KL, Scarselli G, Gemzell‑Danielsson K, Lalitkumar PGL. Expression of adhesion, attachment and invasion markers in eutopic and ectopic endometrium: a link to the aetiology of endometriosis. Hum Reprod. 2012;27(9):2737–46.
45. Wei J‑J, Chiriboga L, Arslan AA, Melamed J, Yee H, Mittal K. Ethnic differ‑ences in expression of the dysregulated proteins in uterine leiomyomata. Hum Reprod. 2006;21(1):57–67.
46. Drosch M, Schmidt N, Markowski DN, Zollner TM, Koch M, Bullerdiek J. The CD24hi smooth muscle subpopulation is the predominant fraction in uterine fibroids. Mol Hum Reprod. 2014;20(7):664–76.
47. Torres A, Torres K, Wdowiak P, Paszkowski T, Maciejewski R. Selec‑tion and validation of endogenous controls for microRNA expression studies in endometrioid endometrial cancer tissues. Gynecol Oncol. 2013;130(3):588–94.
48. Peterson MF, Otoc N, Sethi JK, Gupta A, Antes TJ. Integrated systems for exosome investigation. Methods. 2015;87:31.
49. Zeringer E, Li M, Barta T, Schageman J, Pedersen KW, Neurauter A, Mag‑daleno S, Setterquist R, Vlassov AV. Methods for the extraction and RNA profiling of exosomes. World J Methodol. 2013;3(1):11–8.
50. Schageman J, Zeringer E, Li M, Barta T, Lea K, Gu J, Magdaleno S, Setter‑quist R, Vlassov AV. The complete exosome workflow solution: from isola‑tion to characterization of RNA cargo. Biomed Res Int. 2013;2013:253957.
51. Vaksman O, Tropé C, Davidson B, Reich R. Exosome‑derived miRNAs and ovarian carcinoma progression. Carcinogenesis. 2014;35(9):2113–20.
52. Salomon C, Yee S, Scholz‑Romero K, Kobayashi M, Vaswani K, Kvaskoff D, Illanes SE, Mitchell MD, Rice GE. Extravillous trophoblast cells‑derived exosomes promote vascular smooth muscle cell migration. Front Phar‑macol. 2014;5:175.
53. Hannan NJ, Stephens AN, Rainczuk A, Hincks C, Rombauts LJF, Salamon‑sen LA. 2D‑DiGE analysis of the human endometrial secretome reveals differences between receptive and nonreceptive states in fertile and infertile women. J Proteome Res. 2010;9(12):6256–64.
54. Scotchie JG, Fritz MA, Mocanu M, Lessey BA, Young SL. Proteomic analysis of the luteal endometrial secretome. Reprod Sci. 2009;16(9):883–93.
55. Boomsma CM, Kavelaars A, Eijkemans MJC, Lentjes EG, Fauser BCJM, Hei‑jnen CJ, Macklon NS. Endometrial secretion analysis identifies a cytokine profile predictive of pregnancy in IVF. Hum Reprod. 2009;24(6):1427–35.
56. Vilella F, Moreno‑Moya JM, Balaguer N, Grasso A, Herrero M, Martínez S, Marcilla A, Simón C. Hsa‑miR‑30d, secreted by the human endometrium, is taken up by the pre‑implantation embryo and might modify its tran‑scriptome. Development. 2015;142(18):3210–21.
57. Ametzazurra A, Matorras R, García‑Velasco JA, Prieto B, Simón L, Martínez A, Nagore D. Endometrial fluid is a specific and non‑invasive biologi‑cal sample for protein biomarker identification in endometriosis. Hum Reprod. 2009;24(4):954–65.
58. Levänen B, Bhakta NR, Torregrosa Paredes P, Barbeau R, Hiltbrunner S, Pollack JL, Sköld CM, Svartengren M, Grunewald J, Gabrielsson S, Eklund A, Larsson B‑M, Woodruff PG, Erle DJ, Wheelock ÅM. Altered microRNA profiles in bronchoalveolar lavage fluid exosomes in asthmatic patients. J Allergy Clin Immunol. 2013;131(3):894–903.
59. Nilsson J, Skog J, Nordstrand A, Baranov V, Mincheva‑Nilsson L, Breakefield XO, Widmark A. Prostate cancer‑derived urine exosomes: a novel approach to biomarkers for prostate cancer. Br J Cancer. 2009;100(10):1603–7.