Existing Conditions Report - Missouri Department of ... Purpose of the Existing Conditions Report...
80
Missouri State Rail Plan Existing Conditions TECHNICAL MEMORANDUM #2 Existing Conditions Report April 2012
Transcript of Existing Conditions Report - Missouri Department of ... Purpose of the Existing Conditions Report...
Missouri State Rail Plan Existing Conditions
TECHNICAL MEMORANDUM #2
Existing Conditions Report
April 2012
Missouri State Rail Plan Existing Conditions Report i
Table of Contents 1.0 Purpose of the Existing Conditions Report ..... .................................................................................. 1
2.0 Railroads in Missouri ......................... .................................................................................................. 2
2.1 Class I Railroads .............................................................................................................................. 5 2.1.1 Burlington Northern Santa Fe ............................................................................................. 5 2.1.2 CSX Transportation............................................................................................................. 7 2.1.3 Norfolk Southern Railway ................................................................................................... 7 2.1.4 Canadian Pacific/Soo Line .................................................................................................. 9 2.1.5 Kansas City Southern ....................................................................................................... 10 2.1.6 Union Pacific Railroad ....................................................................................................... 12
2.2 Switching and Terminal Railroads ................................................................................................. 13 2.2.1 Central Midland Railway ................................................................................................... 14 2.2.2 Columbia Terminal Colt .................................................................................................... 14 2.2.3 Manufacturers Railway Co. ............................................................................................... 15 2.2.4 Missouri & Valley Park Railroad Corp. .............................................................................. 15 2.2.5 Missouri North Central Railroad ........................................................................................ 15 2.2.6 Semo Port Railroad, Inc. ................................................................................................... 16 2.2.7 Terminal Railroad Association of St. Louis ....................................................................... 16 2.2.8 Kansas City Terminal Railway Company .......................................................................... 17 2.2.9 Kaw River Railroad ........................................................................................................... 18
2.3 Local Railroads .............................................................................................................................. 19 2.3.1 Arkansas & Missouri Railroad ........................................................................................... 19 2.3.2 Missouri & Northern Arkansas Railroad ............................................................................ 20 2.3.3 Ozark Valley Railroad, Inc. ............................................................................................... 21 2.3.4 South Kansas & Oklahoma Railroad ................................................................................ 21
2.4 Scenic/Dinner Trains ...................................................................................................................... 22
2.5 Intermodal Facilities ....................................................................................................................... 23
2.6 Port Facilities .................................................................................................................................. 23
2.7 Existing Level of Service ................................................................................................................ 25
3.0 Abandonments................................... ................................................................................................. 28
4.0 Passenger Rail ................................ .................................................................................................... 32
5.0 Rail Safety .................................. ........................................................................................................ 39
6.0 Previous Rail Studies and Reports ............. ...................................................................................... 42
6.1 Missouri Statewide Report and Studies ......................................................................................... 42 6.1.1 Statewide Transportation Improvement Program ............................................................. 42 6.1.2 Tracker .............................................................................................................................. 43 6.1.3 Missouri Freight and Passenger Rail Analysis Phase 2 ................................................... 44 6.1.4 Impact of Public Policy on Rail Development in Missouri ................................................. 45 6.1.5 Multimodal Operations Railroad Section........................................................................... 47 6.1.6 Missouri Freight Transportation, Rail Freight .................................................................... 47 6.1.7 Missouri Freight and Passenger Rail Capacity Analysis Phase 1 .................................... 47

Missouri State Rail Plan Existing Conditions Report ii
6.1.8 Report on Proposed Operation of Passenger Train Service Between St. Louis and Southwest Missouri .................................................................................................... 49 6.1.9 Capacity of Missouri Railroads ......................................................................................... 50 6.1.10 Missouri’s Long Range Transportation Plan ..................................................................... 50 6.1.11 Missouri Statewide Freight Study ..................................................................................... 51 6.1.12 Applications Submitted by MoDOT to FRA to Secure Additional Stimulus Funding ........ 52
6.2 Regional and Local Plans and Studies .......................................................................................... 54 6.2.1 Regional Transportation Plan 2040 .................................................................................. 54 6.2.2 Regional Transit Implementation Plan – Commuter Corridors ......................................... 55 6.2.3 Northside Southside Study – Planning Transit Improvements for St. Louis City .............. 56 6.2.4 Kansas City Regional Commuter Rail Study – Implementation Strategy ......................... 58 6.2.5 Kansas City Region Commuter Rail Study – Detailed Assessment of
Feasible Corridors ............................................................................................................. 59 6.2.6 Kansas City Regional Commuter Rail Study: Initial Corridor Screening Part 1 & Part 2 .. 60
6.3 Multi-State Studies and Reports .................................................................................................... 61 6.3.1 Feasibility Report of Proposed Amtrak Service Kansas City – Oklahoma City – Fort Worth ......................................................................................................................... 61 6.3. 2 Chicago to St. Louis 220 m.p.h. High Speed Rail Alternative Corridor Study Volume 1 ........................................................................................................................... 62 6.3.3 Chicago to St. Louis 220 m.p.h. High Speed Rail Alternative Corridor Study Volume 2 ........................................................................................................................... 64 6.3.4 Midwest Regional Rail System ......................................................................................... 65
6.4 National Studies and Reports ........................................................................................................ 67 6.4.1 Final Metrics and Standard for Intercity Passenger Rail Service ..................................... 67 6.4.2 Preliminary National Rail Plan .......................................................................................... 67 6.4.3 Vision for High Speed Rail in America .............................................................................. 69 6.4.4 Financing Freight Investments .......................................................................................... 70 6.4.5 Vision for the Future – U.S. Intercity Passenger Rail Network Through 2050 ................. 73 6.4.6 Railroad Corridor Transportation Plans: A Guidance Manual .......................................... 74
6.5 Federal and State Regulations ...................................................................................................... 76 6.5.1 Code of Federal Regulations, Title 49, Parts 200 to 299 ................................................................................................................ 76 6.5.2 Missouri Revised Statutes, Chapter 622, Division of Motor Carrier and Railroad Safety ................................................................................................................................ 76 6.5.3 Missouri Revised Statutes, Chapter 680, Transportation Services .................................. 76 6.5.4 Missouri Revised Statutes, Chapter 389, Regulation of Railroad Corporations ............... 76 6.5.5 Code of State Regulations, State Railroad Regulations ................................................... 76

Missouri State Rail Plan Existing Conditions Report iii
List of Tables Table 1 Railroads Operating in Missouri ................................................................................................ 3
Table 2 BNSF Railroad Mileage in Missouri ........................................................................................... 6
Table 3 CSX Railroad Mileage in Missouri ............................................................................................. 7 Table 4 Norfolk Southern Railroad Mileage in Missouri ......................................................................... 8
Table 5 CP/Soo Railroad Mileage in Missouri ........................................................................................ 9
Table 6 KCS Railroad Mileage in Missouri ........................................................................................... 11 Table 7 UP Railroad Mileage in Missouri ............................................................................................. 12
Table 8 Missouri National Highway System Intermodal Connectors ................................................... 24 Table 9 Railroad Abondonments in Missouri, 1949 - 2011 .................................................................. 29 Table 10 Current Amtrak Service Stops ................................................................................................. 34 Table 11 Total Missouri Rail Passenger Ridership by Rail Line and Fiscal Year .................................. 35 Table 12 Fastest Growing Rail Passenger Pairs for Missouri River Runner .......................................... 35 Table 13 Missouri Long Distance Train Boardings and Alightings ......................................................... 36 Table 14 Fastest Growing Rail Passenger Pairs to and from Missouri .................................................. 37 Table 15 Rail Program Estimated Financial Summary - Fiscal Year 2011 - 2015 ................................. 43 Table 16 Capacity Analysis Alternatives: Percent Delay Saved per $Million Invested ......................... 49 Table 17 Kansas City – Oklahoma City – Ft. Worth Route Alternatives and Cost ......................... 62
List of Figures Figure 1 Existing Rail Network ................................................................................................................. 4
Figure 2 BNSF Lines in Missouri ............................................................................................................. 6
Figure 3 NS Lines in Missouri .................................................................................................................. 8 Figure 4 CP/Soo Lines in Missouri ........................................................................................................ 10 Figure 5 KCS Lines in Missouri ............................................................................................................. 11 Figure 6 UP Lines in Missouri ................................................................................................................ 13 Figure 7 CMR Line ................................................................................................................................. 14 Figure 8 COLT Line ............................................................................................................................... 14 Figure 9 SE Line .................................................................................................................................... 16 Figure 10 Terminal Railroad Association of St. Louis Line in Missouri ................................................... 16 Figure 11 Kansas City Terminal Railway Line in Missouri ....................................................................... 17 Figure 12 Kaw River Railroad Line in Missouri ........................................................................................ 18
Figure 13 Arkansas & Missouri Line in Missouri ...................................................................................... 19 Figure 14 Missouri & Northern Arkansas Railroad Lines in Missouri ...................................................... 20 Figure 15 Ozark Valley Railroad Line ...................................................................................................... 21
Figure 16 South Kansas & Oklahoma Line in Missouri ........................................................................... 21 Figure 17 Existing Levels of Service for Missouri's Railroads ................................................................. 27
Figure 18 Passenger Rail Service in Missouri ......................................................................................... 33
Figure 19 Missouri Passenger Rail Ridership by Rail Line, Fiscal Years 2007 - 2011 ........................... 38 Figure 20 Missouri Total Train Accidents, January 2000 to November 2011 .......................................... 39 Figure 21 Missouri Total Highway/Rail Accidents, January 2000 to November 2011 ............................. 40 Figure 22 Rail Accidents in Missouri ........................................................................................................ 40 Figure 23 Missouri Highway/Rail Incidents .............................................................................................. 41 Figure 24 Location of Alternatives Relative to Percent Total Amtrak Delay ........................................... 45 Figure 25 Midwest Regional Rail System ................................................................................................ 66
Missouri State Rail Plan Existing Conditions Page 1
Existing Conditions Report
1.0 Purpose of the Existing Conditions Report The development of the Missouri State Rail Plan provides an important opportunity for maximizing the current and potential economic benefits of the state’s rail corridors.
Missouri’s rail infrastructure has long played a critical role in the state’s economic success by moving both people and goods throughout the region and beyond. But Missouri’s position as a global freight hub, critical for the state’s future economic competitiveness, can only be maintained and strengthened through a better understanding of how Missouri can improve its rail system’s capacity for increasing mobility and creating jobs.
The first step in realizing the full potential of the state’s rail system as an economic driver – a possibility now recognized by many leaders across the state – involves identifying Missouri’s existing passenger and freight rail conditions.
This report sets the rail system’s existing conditions as a baseline condition against which Missouri can compare the effects of current and future potential improvements. To meet this objective, the report explores and summarizes conditions and impacts in Missouri of:
1. Operating railroads, including Class 1 railroads, switching and terminal railroads and local railroads;
2. Abandoned railroads;
3. Passenger rail service;
4. Previous rail studies and reports (local, regional, multi-state and national); and
5. Federal and state regulations.
Missouri State Rail Plan Existing Conditions Page 2
2.0 Railroads in Missouri Missouri’s history of rail operations dates back to a five-mile length of track laid sometime between 1849 and 1851 from the Missouri River to Richmond in Ray County, near Kansas City, Missouri. The line was made entirely of wood (including the rails) and horses pulled the trains. Railroad building picked up in 1851 with the initiation of the construction of the Pacific Railroad in St. Louis and again a year later, in 1852 with the Hannibal & St. Joseph Railroad. In 1859, the Hannibal & St. Joseph Railroad completed its line, making it the first railroad to cross the state of Missouri.
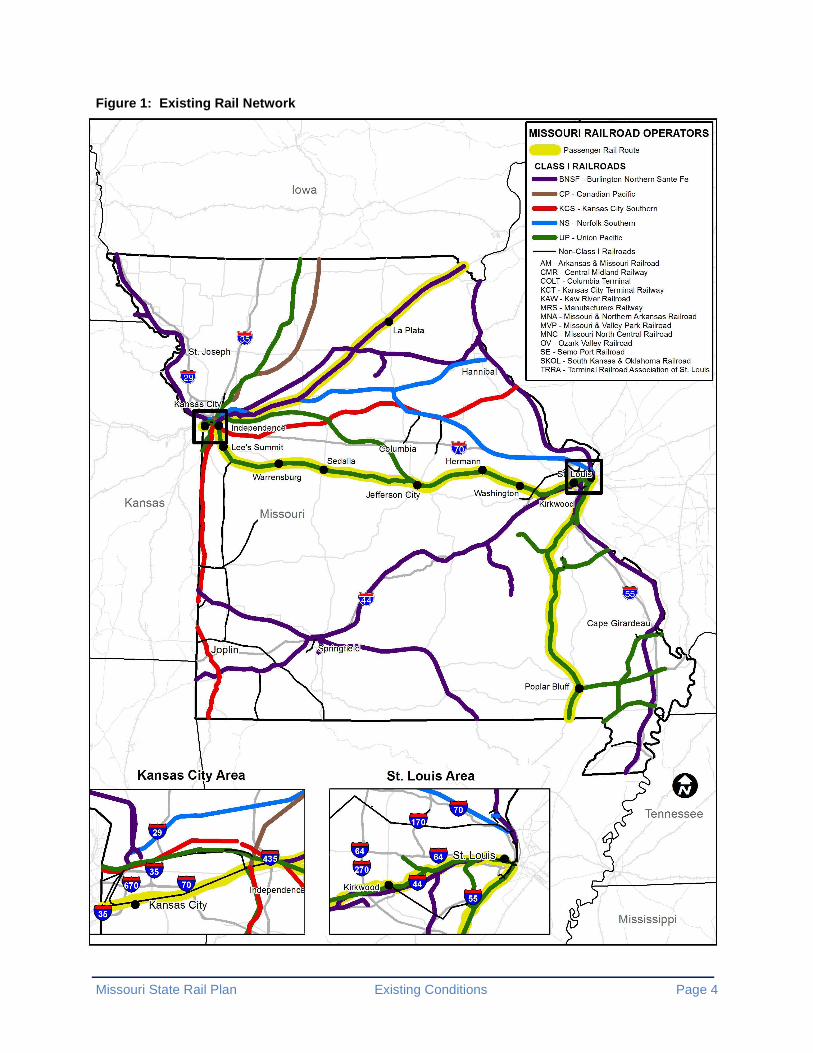
St. Joseph remained the westernmost Missouri city connected by rail through the Civil War. After the Civil War, steel rails spread quickly across the state to form the roots of a growing industry. Railroad mileage reached its peak in Missouri in the early 1920s with more than 8,000 miles of track throughout the state. The miles of railroad track in Missouri dropped to 7,042 miles in 1940, and have been gradually declining ever since.1 Currently there are about 4,000 track miles in Missouri. (Table 1 lists operators; Figure 1 shows the rail network.)
Railroads are typically categorized by measures of size and geographic reach, which are critical determinants of (1) the rail services available in a region, (2) competitive posture, (3) market access, (4) physical condition and (5) financial strength. In the United States, railroads are classified by size into classes following a scheme developed by the Association of American Railroads (AAR). This scheme is based on a combination of revenues and carrier characteristics. The classes are:
Class I – The Surface Transportation Board (STB) defines a Class I railroad in the United States as "having annual carrier operating revenues of $250 million (1992 dollars) or more " after adjusting for inflation using a Railroad Freight Price Index developed by the Bureau of Labor Statistics. Since 2000, there have been seven such carriers operating in the United States, of which six – Burlington Northern Santa Fe (BNSF), Canadian Pacific/Soo (CP), CSX Transportation (CSX), Kansas City Southern Railway (KCS), Norfolk Southern (NS) and Union Pacific (UP) have operations in Missouri.
Class II – A Class II railroad is defined as a non-Class I line-haul railroad operating 350 miles or more with operating revenues of at least $40 million, but less than the Class I minimum threshold. Class II railroads are sometimes known as regional railroads, though they are often classified with and referred to as short lines. Missouri currently has no independent Class II railroads.
Class III – Class III railroads are the remaining railroads which have revenues of less than $40 million and are engaged in line-haul movement. They are commonly referred to as short line or local railroads. Missouri has five local railroads.
Switching or Terminal – A Class III railroad engaged primarily in switching and/or terminal services for other railroads (i.e., they are not typically involved in line-haul moves between two geographical locations) is known as a switching or terminal railroad. They are often categorized with short line railroads due to their operational and revenue
1 Kirkendall, Richard S. A History of Missouri. Volume V: 1919 to 1953. University of Missouri Press. 2004.
Missouri State Rail Plan Existing Conditions Page 3
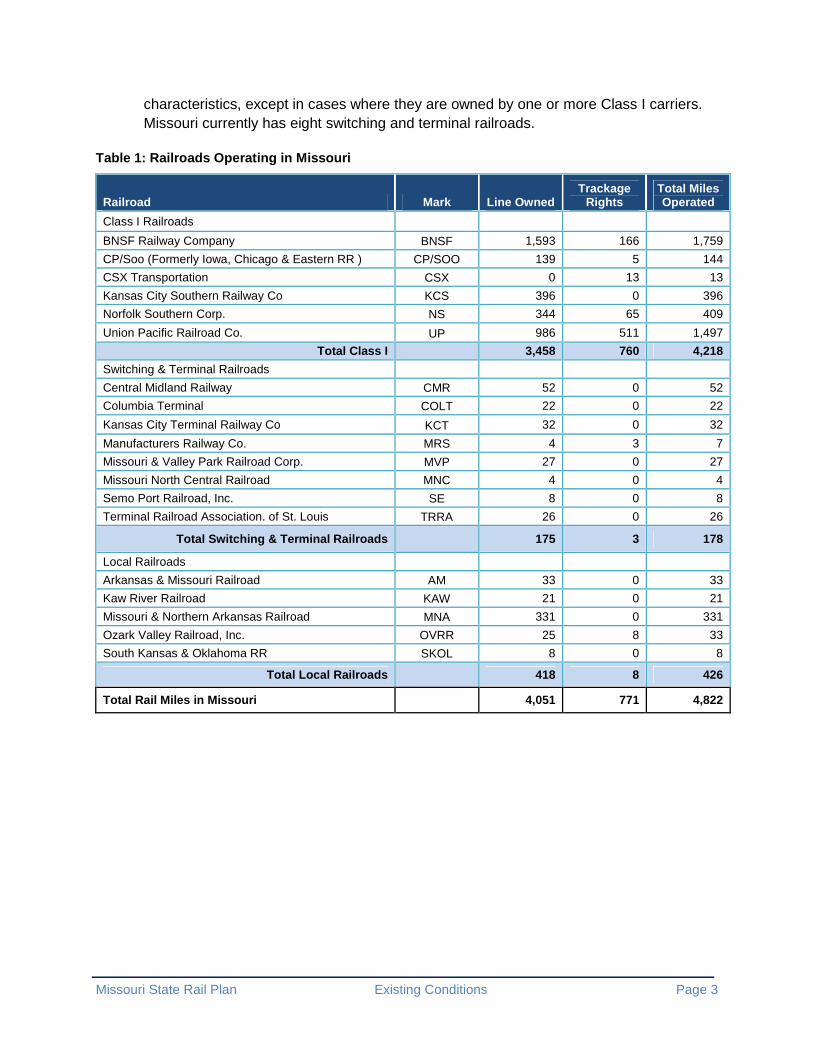
characteristics, except in cases where they are owned by one or more Class I carriers. Missouri currently has eight switching and terminal railroads.
Table 1: Railroads Operating in Missouri
Railroad Mark Line Owned Trackage
Rights Total Miles Operated
Class I Railroads
BNSF Railway Company BNSF 1,593 166 1,759
CP/Soo (Formerly Iowa, Chicago & Eastern RR ) CP/SOO 139 5 144
CSX Transportation CSX 0 13 13
Kansas City Southern Railway Co KCS 396 0 396
Norfolk Southern Corp. NS 344 65 409
Union Pacific Railroad Co. UP 986 511 1,497
Total Class I
3,458 760 4,218
Switching & Terminal Railroads
Central Midland Railway CMR 52 0 52
Columbia Terminal COLT 22 0 22
Kansas City Terminal Railway Co KCT 32 0 32
Manufacturers Railway Co. MRS 4 3 7
Missouri & Valley Park Railroad Corp. MVP 27 0 27
Missouri North Central Railroad MNC 4 0 4
Semo Port Railroad, Inc. SE 8 0 8
Terminal Railroad Association. of St. Louis TRRA 26 0 26
Total Switching & Terminal Railroads
175 3 178
Local Railroads
Arkansas & Missouri Railroad AM 33 0 33
Kaw River Railroad KAW 21 0 21
Missouri & Northern Arkansas Railroad MNA 331 0 331
Ozark Valley Railroad, Inc. OVRR 25 8 33
South Kansas & Oklahoma RR SKOL 8 0 8
Total Local Railroads
418 8 426
Total Rail Miles in Missouri
4,051 771 4,822
Missouri State Rail Plan Existing Conditions Page 4
Figure 1: Existing Rail Network
Missouri State Rail Plan Existing Conditions Page 5
Kansas City and St. Louis, historically major points for the interchange of rail traffic moving between the east and the west, are ranked the second- and third-largest transportation rail centers in the United States, respectively. More than 6,800 people work as freight rail employees in Missouri today. The average wage and benefits per freight rail employee is $100,540, for a total statewide benefit of more than $686 million. In 2011, 304 million tons of freight was carried on railroads, into, out of or through Missouri.
The primary commodities originating in Missouri are food products, farm products, intermodal, chemicals and motor vehicles and parts. Coal is Missouri’s primary terminating commodity terminating, and the state ranks third nationally for terminated rail tons of coal.2
2.1 Class I Railroads
Currently there are seven Class I railroads operating in the United States:
1. Burlington Northern Santa Fe Railway (BNSF)
2. CSX Transportation (CSX)
3. Grand Trunk Corporation (owned by Canadian National – CN)
4. Kansas City Southern Railway (KCS)
5. Norfolk Southern Railway (NS)
6. Soo Line Corporation (owned by Canadian Pacific – CP)
7. Union Pacific Railroad (UP)
All but the Grand Trunk Corporation and CSX own track and operate in Missouri. The CSX has 13 miles of operating rights in Missouri but does not own any tracks in the state.
Missouri Class I Railroads make up 4,218 miles – or about 4.4 percent - of the 95,700 miles operated by the nation’s Class I railroads (less trackage rights). The following sections provide a brief overview of each Class I railroad operating in Missouri.
2.1.1 Burlington Northern Santa Fe (BNSF) Railway
BNSF was created on Sept. 22, 1995, from the merger of Burlington Northern Inc. (parent company of Burlington Northern Railroad) and Santa Fe Pacific Corporation (parent company of the
Atchison, Topeka and Santa Fe Railway). On February 12, 2010, BNSF became a subsidiary of Berkshire Hathaway, Inc.3
BNSF Railway operates one of North America’s largest railroad networks, serving the western two-thirds of the United States. It employs more than 40,000 people and operates on 32,000 route miles stretching across 28 states and two Canadian provinces.
2 http://www.aar.org/Railroads-States/Missouri-2009.pdf 3 http://www.bnsf.com/about-bnsf/pdf/fact_sheet.pdf

Missouri State Rail Plan Existing Conditions Page 6
Table 2: BNSF Railroad Mileage in Missouri
Headquarters Fort Worth, TX
Track Mileage in Missouri 1,759
Total System Mileage 32,000 (28 states and Canada)
Missouri Connecting Cities Kansas City, St. Joseph, Hannibal, St. Louis, Springfield and Cape Girardeau
Major Local Facilities St. Louis and Kansas City, Kansas
Commodities Hauled
Waste or scrap materials; farm products; chemicals or allied products; waste hazardous materials or waste hazardous substances; coal, lumber or wood products (excluding furniture); transportation equipment; petroleum or coal products; non-metallic minerals; primary metal products
Figure 2: BNSF Lines in Missouri
Hannibal
Joplin
Jefferson City
Cape Girardeau

Missouri State Rail Plan Existing Conditions Page 7
2.1.2 CSX Transportation
CSX Corporation and its rail and intermodal businesses provide traditional rail service and the transport of intermodal containers and trailers. Its network encompasses about 21,000 route miles of track in 23 states, the District of
Columbia and the Canadian provinces of Ontario and Quebec. It serves all Atlantic and Gulf Coast ports, as well as the Mississippi River, the Great Lakes, the St. Lawrence Seaway and (through western railroad alliances) U.S. Pacific ports.4
The CSX transportation network serves some of the largest population centers in the nation. More than two-thirds of Americans live within CSX’s service territory. The western terminus of the CSX network is in East St. Louis, Illinois. While CSX does not own any Missouri trackage, according to their 2010 R-1 Report to the STB the company operates on 13 miles in the state via trackage rights5 secured through part ownership of the St. Louis Terminal Railroad Association (TRRA).
Table 3: CSX Railroad Mileage in Missouri
Headquarters Jacksonville, FL
Track Mileage in Missouri 13 (operating, not owned)
Total System Mileage 21,000 (23 states, DC and Canada)
Missouri Connecting Cities St. Louis
Major Local Facilities None
Commodities Hauled
Freight of all kinds; electrical machinery; equipment, or supplies; waste or scrap materials; chemicals or allied products; waste hazardous materials or waste hazardous substances; food or kindred products
No map provided of CSX rail lines since it does not own any rail lines in Missouri
2.1.3 Norfolk Southern Railway
Norfolk Southern Corporation (NS), through its Norfolk Southern Railway subsidiary, operates approximately 20,000 route miles in 22 states and the District of Columbia. The NS serves every major container port in the
eastern United States and operates the most extensive intermodal network in the East.6 It is a major transporter of coal and industrial products and has major rail classification yards and intermodal terminals in Kansas City and St. Louis.
4 http://www.csx.com/index.cfm/about-csx/company-overview/ 5 Class I Railroad Annual Report to the Surface Transportation Board for the Year Ending December 31, 2010. CSX Transportation, Inc.
6 http://www.nscorp.com/nscportal/nscorp/Media/Corporate%20Profile/
Missouri State Rail Plan Existing Conditions Page 8
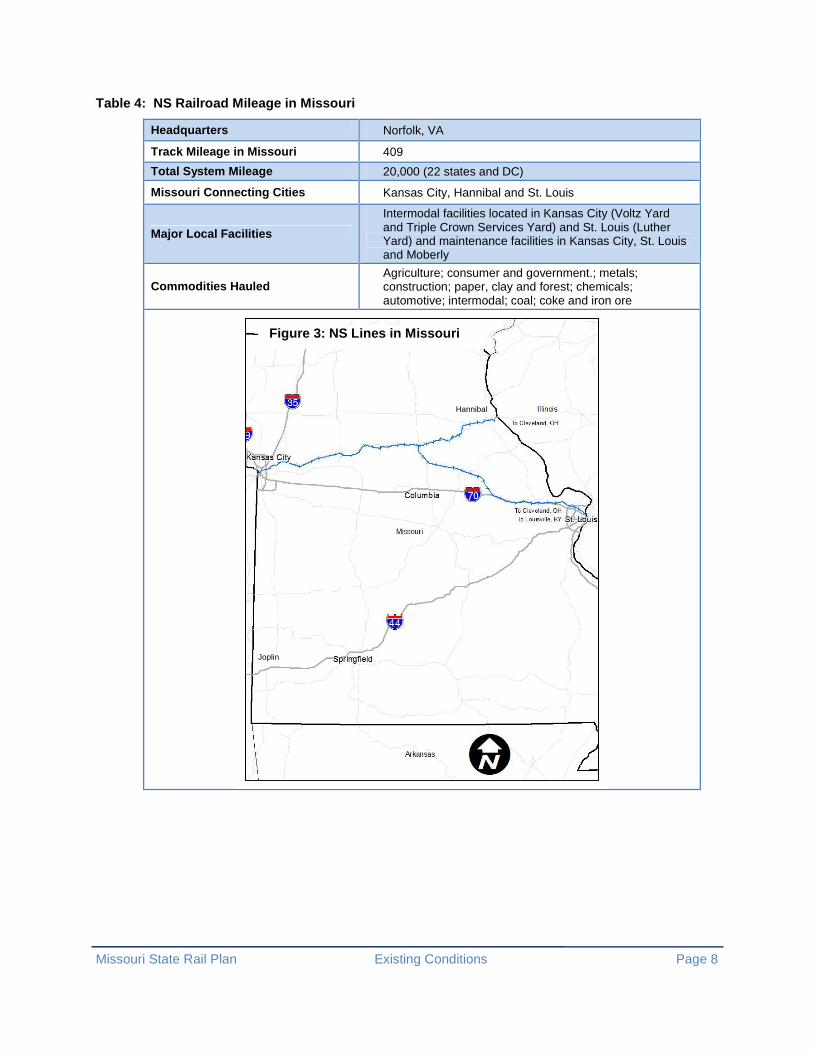
Table 4: NS Railroad Mileage in Missouri
Headquarters Norfolk, VA
Track Mileage in Missouri 409
Total System Mileage 20,000 (22 states and DC)
Missouri Connecting Cities Kansas City, Hannibal and St. Louis
Major Local Facilities
Intermodal facilities located in Kansas City (Voltz Yard and Triple Crown Services Yard) and St. Louis (Luther Yard) and maintenance facilities in Kansas City, St. Louis and Moberly
Commodities Hauled Agriculture; consumer and government.; metals; construction; paper, clay and forest; chemicals; automotive; intermodal; coal; coke and iron ore
Figure 3: NS Lines in Missouri
Hannibal
Joplin

Missouri State Rail Plan Existing Conditions Page 9
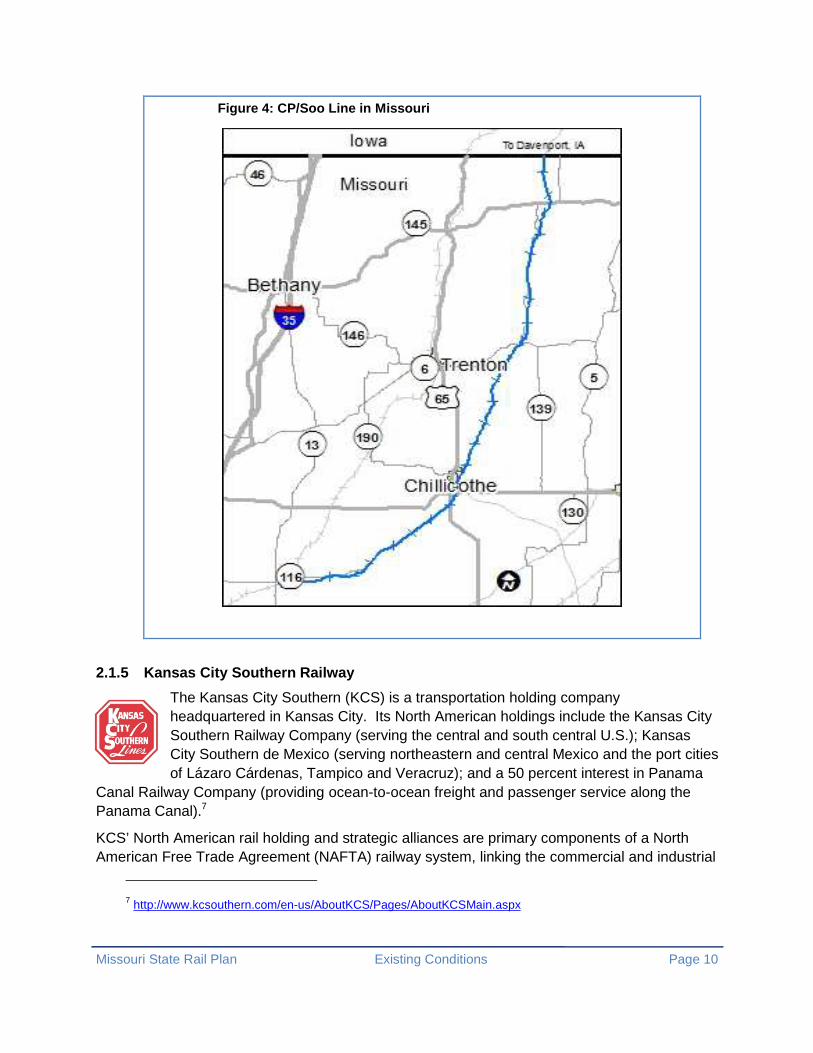
2.1.4 Canadian Pacific/Soo Line
The Canadian Pacific Railway (CP) operates on 14,800 miles of track in six Canadian provinces and 13 U.S. states. Kansas City is the southernmost point of the CP network. The Soo Line Railroad Co. is a Class 1 U.S. railroad, which is wholly owned by CP and does rail
business under the CP name. In 1990, Canadian Pacific acquired 100 percent of common stock, and the Soo Line became a wholly owned subsidiary. Soo Line, together with the Delaware and Hudson Railroad, are now part of the international CP system.
Canadian Pacific Railway officially gained control of the DM&E on October 30, 2008, after a year-long federal regulatory process. The acquisition was announced September 4, 2007, and closing held October 4, 2007. The acquisition concluded a competitive process to find the best approach to advance the DM&E's Powder River Basin (PRB) project. To date, the CP has not decided if it will build the PRB project.
The Dakota, Minnesota & Eastern Railroad Corporation (DM&E) acquired the I&M Rail Link (IMRL) in 2002. For legal and regulatory historical reasons, the IMRL was brought into the DM&E as a separate entity—Iowa, Chicago & Eastern (IC&E) Railroad—yet both the DM&E and IC&E were operated as a single system under common management by Cedar American Rail Holdings.
IC&E territory covers 1,400 miles of track in Illinois, Iowa, Minnesota, Missouri and Wisconsin. Its main lines extend from Chicago to Kansas City, and from Sabula, Iowa, along the Mississippi River northwesterly to the Minneapolis-St. Paul area, using trackage rights over the CP from La Crescent, Minnesota. Branch lines (known as the "Corn Lines") extend from extend through Iowa from Marquette west to Mason City and Sheldon, and through Minnesota from Austin to Jackson and Rosemount.
In December 2008, the Surface Transportation Board approved the merger of the IC&E and DM&E under the DM&E name. Today, the IC&E territory is known as DM&E South.
Table 5: CP/Soo Line Railroad Mileage in Missouri
U.S. Headquarters Minneapolis, MN
Track Mileage in Missouri 144
Total System Mileage 6,100 (18 states and provinces)
Missouri Connecting Cities Chillicothe
Major Local Facilities Kansas City, MO yard
Commodities Hauled Grains; automobiles; lumber; steel; chemicals Missouri originated and destined cars handled in excess of 30,000 loads in 2011
Missouri State Rail Plan Existing Conditions Page 10
2.1.5 Kansas City Southern Railway
The Kansas City Southern (KCS) is a transportation holding company headquartered in Kansas City. Its North American holdings include the Kansas City Southern Railway Company (serving the central and south central U.S.); Kansas City Southern de Mexico (serving northeastern and central Mexico and the port cities of Lázaro Cárdenas, Tampico and Veracruz); and a 50 percent interest in Panama
Canal Railway Company (providing ocean-to-ocean freight and passenger service along the Panama Canal).7
KCS’ North American rail holding and strategic alliances are primary components of a North American Free Trade Agreement (NAFTA) railway system, linking the commercial and industrial
7 http://www.kcsouthern.com/en-us/AboutKCS/Pages/AboutKCSMain.aspx
Figure 4: CP/Soo Line in Missouri

Missouri State Rail Plan Existing Conditions Page 11
centers of the U.S., Mexico and Canada.8 According to its 2010 STB R-1 report, KCS owns 396 miles of track in Missouri and does not have any additional operational miles through trackage rights.9
Table 6: KCS Railroad Mileage in Missouri
Headquarters Kansas City, MO
Track Mileage in Missouri 396
Total System Mileage 3,100 (10 states)
Missouri Connecting Cities Kansas City, Joplin
Major Local Facilities Kansas City (CenterPoint)
Commodities Hauled Farm products; lumber or wood products (excluding furniture); primary metal products; food or kindred products
8 http://www.kcsouthern.com/en-us/AboutKCS/Pages/AboutKCSMain.aspx 9 Class I Railroad Annual Report to the Surface Transportation Board for the Year Ending December 31, 2010.
Kansas City Southern Railway Company.
Figure 5: KCS Lines in Missouri
Hannibal
Joplin
Missouri State Rail Plan Existing Conditions Page 12
2.1.6 Union Pacific Railroad
Union Pacific Railroad (UP) is an operating subsidiary of Union Pacific Corporation. Its operation covers 23 states in the western two-thirds of the United States. The railroad links every major West Coast and Gulf Coast port and provides service to the east through its four major gateways in Chicago, St. Louis, Memphis and New Orleans. Additionally, Union Pacific operates key north/south corridors, serving all
six major gateways to Mexico and interchanging traffic with the Canadian rail systems.
The rail system serves the country's fastest growing cities and states. UP serves the western coal reserves, Gulf Coast chemical industry and the rock quarries of south Texas. The railroad is the nation's largest hauler of chemicals and one of the largest intermodal carriers of truck trailers and marine containers. The railroad helps link production and consumption points in the U.S, and across the world, delivering energy, food, raw materials, durable and consumer goods to support the nation's growth.
The railroad has a diversified commodity mix, including chemicals, coal, food and food products, forest products, grain and grain products, intermodal, metals and minerals and automobiles and parts. The largest of Union Pacific's 25,000 customers include steamship lines, vehicle manufacturers, agricultural companies, utilities, intermodal companies and chemical manufacturers.
About 85 Union Pacific trains pass through Missouri daily. The UP facility in DeSoto, 40 miles south of St. Louis, is one of UP’s three major freight car repair facilities. Kansas City is the site of a major UP freight classification yard, and the company operates terminals in St. Louis, Sedalia, Jefferson City and Poplar Bluff. The UP also connects with four Missouri shortline railroads: the Arkansas and Missouri, the Central Midland, the Missouri and Northern Arkansas, and the Semo Port. In 2010, UP handled more than 110,000 carloads originating from these short lines.
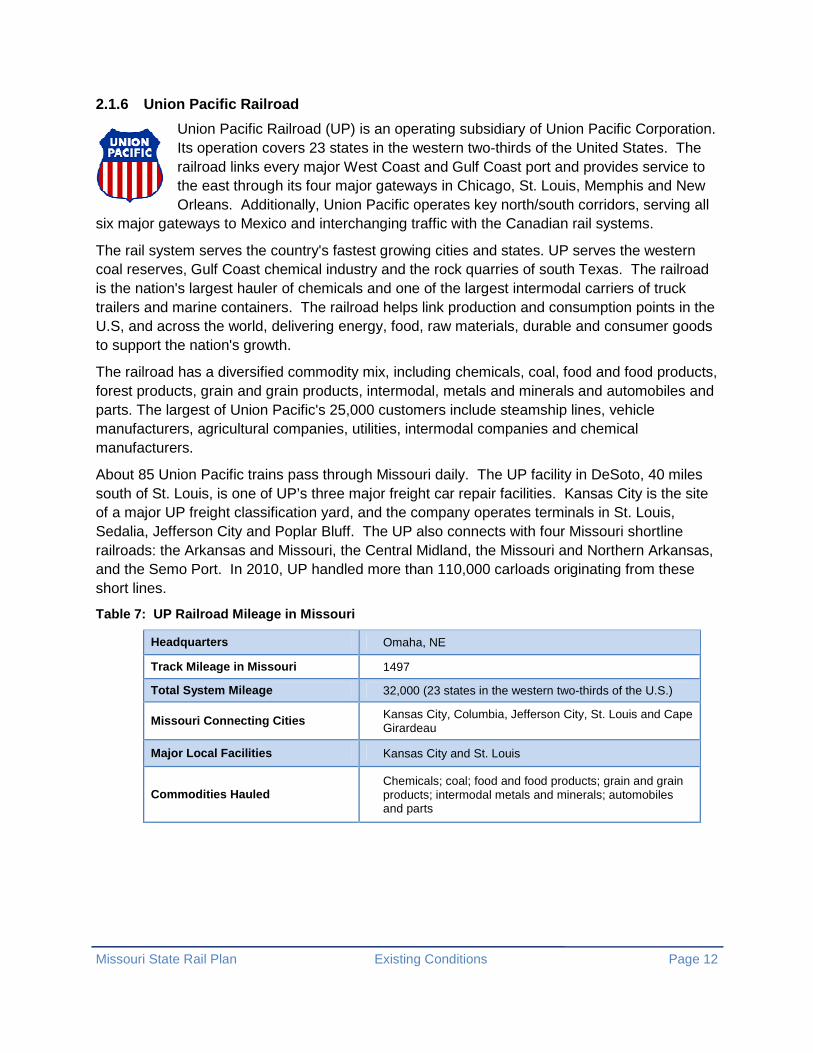
Table 7: UP Railroad Mileage in Missouri
Headquarters Omaha, NE
Track Mileage in Missouri 1497
Total System Mileage 32,000 (23 states in the western two-thirds of the U.S.)
Missouri Connecting Cities Kansas City, Columbia, Jefferson City, St. Louis and Cape Girardeau
Major Local Facilities Kansas City and St. Louis
Commodities Hauled Chemicals; coal; food and food products; grain and grain products; intermodal metals and minerals; automobiles and parts

Missouri State Rail Plan Existing Conditions Page 13
2.2 Switching & Terminal Railroads
A switching and terminal railroad owns and operates a terminal facility and/or performs local switching services within a yard. This involves making up and breaking up trains, storing and classifying cars, serving industries within yard limits and other related purposes. These movements are made at slow speed. The following section identifies the eight switching and terminal railroads operating a total of 178 miles track miles in Missouri.
Figure 6: UP Lines in Missouri
Hannibal
Joplin
Jefferson City

Missouri State Rail Plan Existing Conditions Page 14
2.2.1 Central Midland Railway
Central Midland Railway (CMR) operates 42 miles of the former Rock Island line between Vigus and Union, Missouri. CMR interchanges with the St. Louis Terminal Railway Association (TRRA) at Lackland. CMR is contracted by Ameren Corporation to operate the line owned by Missouri Central. The remaining 213 miles of the Rock Island Line between Union and Pleasant Hill is out of service, but is not formally abandoned.10
2.2.2 Columbia Terminal Railroad
The Columbia Terminal Railroad (COLT) is a full-service short line rail, trucking and storage network serving mid-Missouri. It is owned and operated by the city of Columbia, Missouri.
The COLT railroad operates on 22 miles of track running between Columbia and Centralia where the railroad interconnects with Norfolk Southern. Shippers located in the COLT area work directly with Norfolk Southern for car supply, tariffs, billing, collections and general marketing. COLT handles more than 1,500 cars annually and carries aggregates, automotive parts, chemicals, coal, forest products and scrap metals. The line is rated FRA Class II, which allows train speeds of 25 m.p.h.11
10 http://www.progressiverail.com/where_we_go.html 11 www.gocolumbiamo.com/WaterandLight/About_Us/COLT/
Figure 8: COLT Line
Figure 7: CMR Line
Missouri State Rail Plan Existing Conditions Page 15
COLT also operates the Columbia Star Dinner Train, which provides year-round evening dinner service on Friday and Saturdays and a brunch train on Sundays. The Columbia Star operates on COLT tracks between Columbia and Centralia using restored historic locomotives and dining cars.
2.2.3 Manufacturers Railway Co.
The Manufacturers Railway Company (MRS) located in St. Louis is owned by the Anheuser-Busch brewing company. Its 3.6-mile line connects with the TRRA in St. Louis. Through trackage rights over the company's line on the MacArthur Bridge, MRS connects with the Alton and Southern Railroad in East St. Louis, Illinois.
In March 2011, Anheuser-Busch applied to the Surface Transportation Board to discontinue all service on the MRS after the brewery began shipping outbound products via truck instead of rail. However, Anheuser-Bush later announced it would transfer all rail switching services to Foster Townsend Rail Logistics, Inc. (FTRL Railway) to support St. Louis brewery operations after Manufacturers Railway ceases operation.12
2.2.4 Missouri & Valley Park Railroad Corp.
Effective January 30, 2011, Burlington Junction Railway began operations in Fenton on the Valley Park line. The railroad serves online customers and a transload site in Fenton. The MVP interchanges with BNSF and has the capacity to handle loads up to 286,000 pounds. Its transload facility is near I-44 and I-270 and has an outdoor yard ramp for machinery and equipment loading/unloading. The facility can handle bulk transfer, including food grade, and offers warehousing and boxcar unloading and loading.
2.2.5 Missouri North Central Railroad
The Missouri North Central Railroad (MNC) serves an industrial park in Chillicothe through a lease with the city. Operations began in 2004 over 37 miles of track from Brunswick to Chillicothe in Northwest Missouri. The line from Sumner to Brunswick was subsequently abandoned. The line interchanges with the CP/Soo line (Formerly the IC&E/DM&E) in Chillicothe and with the BNSF in Brunswick.
12 http://www.ftrail.com/
Missouri State Rail Plan Existing Conditions Page 16
Figure 10: TRRA Lines in Missouri
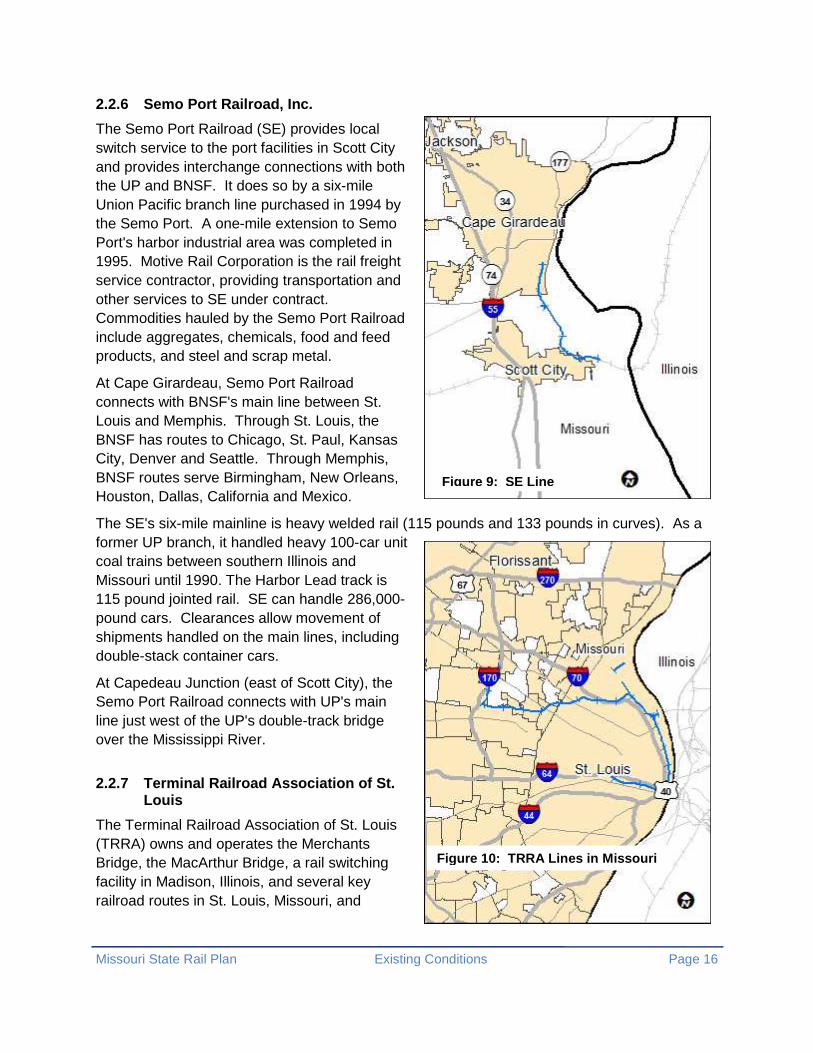
2.2.6 Semo Port Railroad, Inc.
The Semo Port Railroad (SE) provides local switch service to the port facilities in Scott City and provides interchange connections with both the UP and BNSF. It does so by a six-mile Union Pacific branch line purchased in 1994 by the Semo Port. A one-mile extension to Semo Port's harbor industrial area was completed in 1995. Motive Rail Corporation is the rail freight service contractor, providing transportation and other services to SE under contract. Commodities hauled by the Semo Port Railroad include aggregates, chemicals, food and feed products, and steel and scrap metal.
At Cape Girardeau, Semo Port Railroad connects with BNSF's main line between St. Louis and Memphis. Through St. Louis, the BNSF has routes to Chicago, St. Paul, Kansas City, Denver and Seattle. Through Memphis, BNSF routes serve Birmingham, New Orleans, Houston, Dallas, California and Mexico.
The SE's six-mile mainline is heavy welded rail (115 pounds and 133 pounds in curves). As a former UP branch, it handled heavy 100-car unit coal trains between southern Illinois and Missouri until 1990. The Harbor Lead track is 115 pound jointed rail. SE can handle 286,000-pound cars. Clearances allow movement of shipments handled on the main lines, including double-stack container cars.
At Capedeau Junction (east of Scott City), the Semo Port Railroad connects with UP's main line just west of the UP's double-track bridge over the Mississippi River.
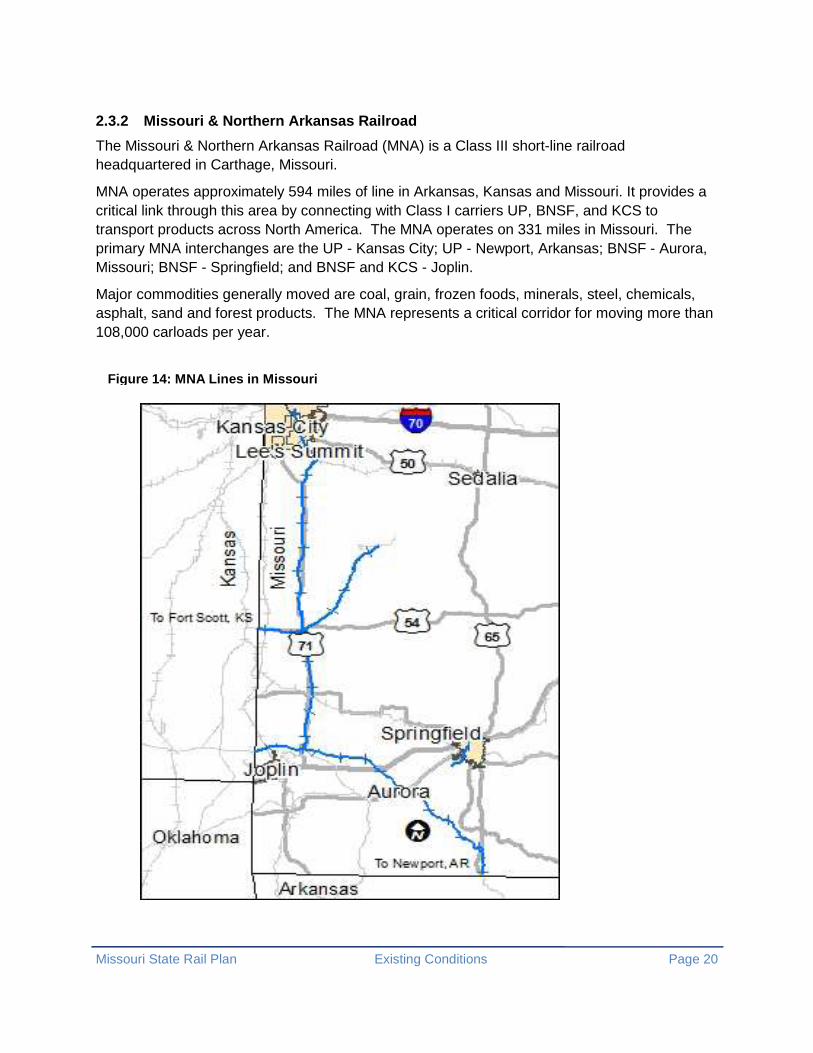
2.2.7 Terminal Railroad Association of St. Louis
The Terminal Railroad Association of St. Louis (TRRA) owns and operates the Merchants Bridge, the MacArthur Bridge, a rail switching facility in Madison, Illinois, and several key railroad routes in St. Louis, Missouri, and
Figure 9: SE Line

Missouri State Rail Plan Existing Conditions Page 17
Figure 11: KCT Lines in Missouri
Madison and St. Clair counties in Illinois.
The Merchants Bridge is a half-mile long railroad-only bridge over the Mississippi River located just north of the downtown St. Louis area. Still a vital link in the company's operations, the Merchants Bridge was completed on March 18, 1890.
The MacArthur Bridge is part of a 6.2 mile-long elevated track crossing the Mississippi River in the heart of downtown St. Louis. The MacArthur Bridge and elevated track is the second-longest elevated steel structure across the Mississippi River. The MacArthur Bridge was originally constructed with a road deck over the rail deck; the bridge is currently used for railroad traffic only.
The company's rail switching yard in Madison, Illinois, is the largest such facility in the region. Approximately 30,000 cars pass through the company's switching facility on a monthly basis and are re-directed to other destinations. The switching yard consists of 80 tracks (in-bound, out-bound and holding) with a capacity of 2,200 cars at any one time. The company operates 30 locomotives to move cars around the yard, deliver cars to local industries, and ready trains for departure. 2.2.8 Kansas City Terminal Railway Company
The Kansas City Terminal Railway (KCT) is a joint operation of the trunk railroads in the Kansas City metropolitan area, the country's second-largest rail hub. It is the nation’s largest terminal railway by gross ton and is presently operated by the Kaw River Railroad.
The railway owns and dispatches 100 miles of track (34 in Kansas and 66 in Missouri) and leases six locomotives. It serves the Class I railroads BNSF, Kansas City Southern, Norfolk Southern Railway, Union Pacific and Canadian Pacific/Soo (formerly DM&E); Class III Missouri and Northern Arkansas Railroad; and Amtrak.

Missouri State Rail Plan Existing Conditions Page 18
Figure 12: KAW Lines
2.2.9 Kaw River Railroad
The KAW River Railroad (KAW) is located in the greater Kansas City area. The railroad, which began operations in June 2004, serves customers in Kansas City, Kansas/Missouri and the historic Union Station on 12 miles of track connected to the Kansas City Southern Railroad. The KAW expanded in April 2005, adding 16 miles including the Birmingham to Kearney line in Missouri.
In March 2006, the original line was expanded and KAW began operations for the Kansas City Transportation Company LLC (KCTL), serving more than 30 customers. In May 2007, nearly 15 miles of industrial track was added, serving customers of the Bedford Yard.
Collectively, the KAW and KCTL handle approximately 15,000 carloads of animal-by-products, chemicals, plastics and industrial products annually. The KAW also has a transload site in Kansas City available for handling dry bulk products and other carload traffic.

Missouri State Rail Plan Existing Conditions Page 19
2.3 Local Railroads
Local railroads are non-regional railroads engaged in line-haul service. There are five local railroads in Missouri serving 526 miles of railroad. 2.3.1 Arkansas & Missouri Railroad
The Arkansas & Missouri Railroad (A&M) was established in 1986 as a Class III Railroad operating a 150-mile route from Monett, Missouri to Fort Smith, Arkansas. The home office is located in Springdale, Arkansas; major operations are based there and in Fort Smith. The company provides freight to customers along its route as well as excursion passenger service between Springdale and Van Buren/Fort Smith. A&M interchanges traffic with three Class I railroads (BNSF, KCS and UP) and the Fort Smith Railroad (FSR). All lines are rated at 286,000 lbs. and cleared for double-stack rail cars. Main lines feature continuous welded rail. Commodities hauled by the A&M include aggregates, chemicals, coal, food and feed products, forest products, metallic ores and minerals, and steel and scrap.
The A&M's sister company, Ozark Transmodal, Inc. (OTI), provides transloading and trucking operations in Gateway, Springdale and Fort Smith, Arkansas. OTI provides a wide range of transloading services for various commodities, inbound and outbound, for customers without direct rail access or sufficient inventory storage. OTI and A&M provide seven acres of outside inventory space and 40,000-square-feet of warehouse space in Fort Smith, with outside storage available at Springdale and Gateway. The Fort Smith warehouse features the region’s only plastics logistics facility, which includes packaging and blending capabilities.
In addition, the A&M serves a broad array of transload, warehouse and logistics partners, specializing in a variety of commodities and services, including temperature-controlled storage and transportation, dry and liquid bulk trucking, specialty metals handling and food-grade bonded warehousing.
The Arkansas and Missouri Railroad is one of the few commercial lines left in the United States operating both freight and passenger service. Passengers travel on the A&M’s regular working rails in refurbished antique passenger or parlor coaches.13
13 http://www.amrailroad.com/index.html
Figure 13: A&M Line in Missouri
Missouri State Rail Plan Existing Conditions Page 20
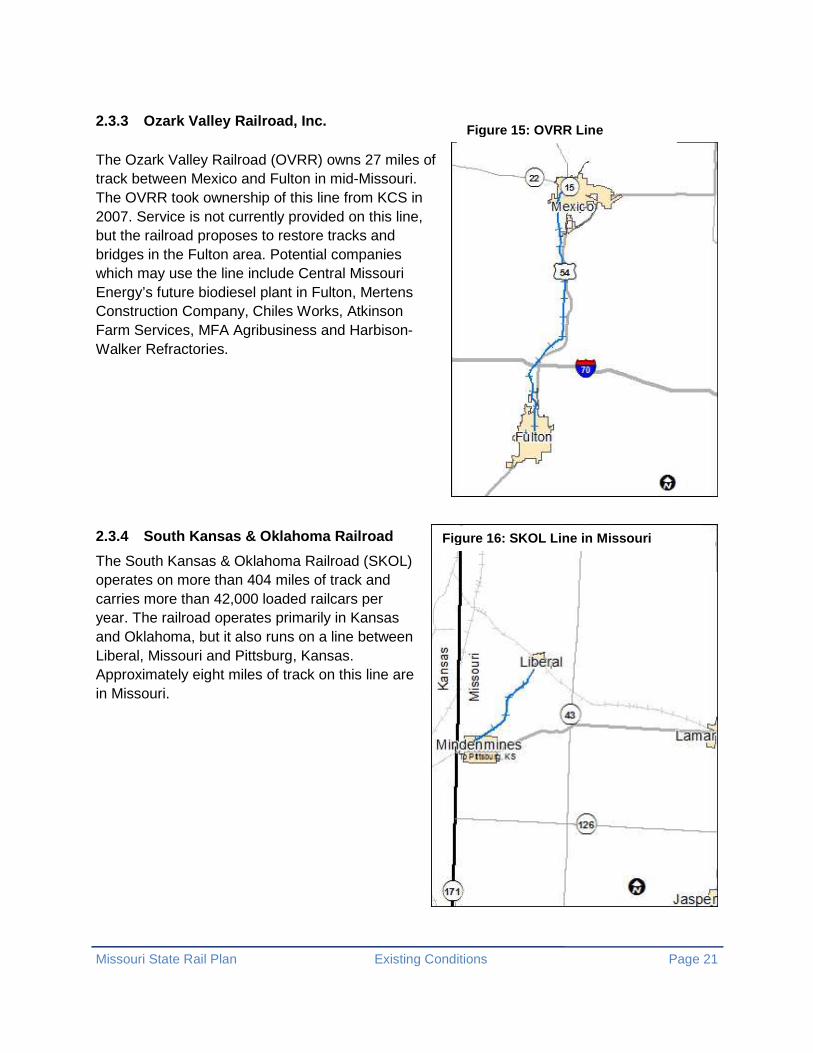
2.3.2 Missouri & Northern Arkansas Railroad
The Missouri & Northern Arkansas Railroad (MNA) is a Class III short-line railroad headquartered in Carthage, Missouri.
MNA operates approximately 594 miles of line in Arkansas, Kansas and Missouri. It provides a critical link through this area by connecting with Class I carriers UP, BNSF, and KCS to transport products across North America. The MNA operates on 331 miles in Missouri. The primary MNA interchanges are the UP - Kansas City; UP - Newport, Arkansas; BNSF - Aurora, Missouri; BNSF - Springfield; and BNSF and KCS - Joplin.
Major commodities generally moved are coal, grain, frozen foods, minerals, steel, chemicals, asphalt, sand and forest products. The MNA represents a critical corridor for moving more than 108,000 carloads per year.
Figure 14: MNA Lines in Missouri
Missouri State Rail Plan Existing Conditions Page 21
Figure 1 5: OVRR Line
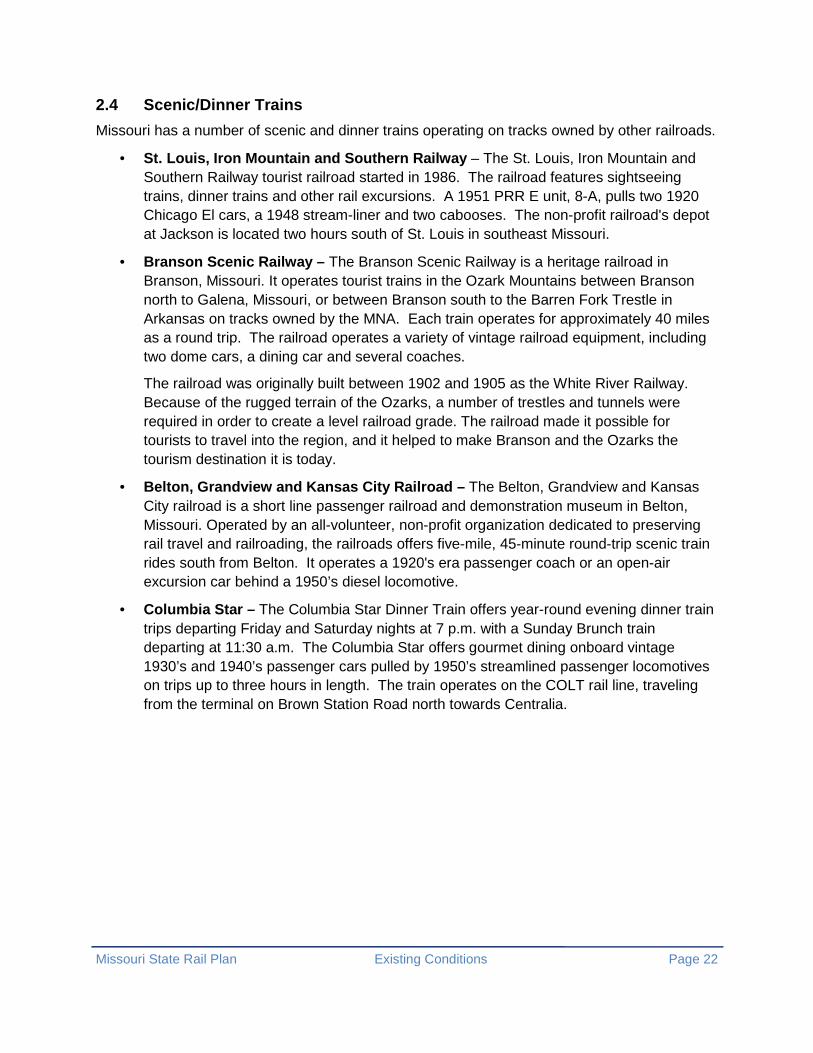
2.3.3 Ozark Valley Railroad, Inc.
The Ozark Valley Railroad (OVRR) owns 27 miles of track between Mexico and Fulton in mid-Missouri. The OVRR took ownership of this line from KCS in 2007. Service is not currently provided on this line, but the railroad proposes to restore tracks and bridges in the Fulton area. Potential companies which may use the line include Central Missouri Energy’s future biodiesel plant in Fulton, Mertens Construction Company, Chiles Works, Atkinson Farm Services, MFA Agribusiness and Harbison-Walker Refractories. 2.3.4 South Kansas & Oklahoma Railroad
The South Kansas & Oklahoma Railroad (SKOL) operates on more than 404 miles of track and carries more than 42,000 loaded railcars per year. The railroad operates primarily in Kansas and Oklahoma, but it also runs on a line between Liberal, Missouri and Pittsburg, Kansas. Approximately eight miles of track on this line are in Missouri.
Figure 1 6: SKOL Line in Missouri
Missouri State Rail Plan Existing Conditions Page 22
2.4 Scenic/Dinner Trains
Missouri has a number of scenic and dinner trains operating on tracks owned by other railroads.
• St. Louis, Iron Mountain and Southern Railway – The St. Louis, Iron Mountain and Southern Railway tourist railroad started in 1986. The railroad features sightseeing trains, dinner trains and other rail excursions. A 1951 PRR E unit, 8-A, pulls two 1920 Chicago El cars, a 1948 stream-liner and two cabooses. The non-profit railroad's depot at Jackson is located two hours south of St. Louis in southeast Missouri.
• Branson Scenic Railway – The Branson Scenic Railway is a heritage railroad in Branson, Missouri. It operates tourist trains in the Ozark Mountains between Branson north to Galena, Missouri, or between Branson south to the Barren Fork Trestle in Arkansas on tracks owned by the MNA. Each train operates for approximately 40 miles as a round trip. The railroad operates a variety of vintage railroad equipment, including two dome cars, a dining car and several coaches.
The railroad was originally built between 1902 and 1905 as the White River Railway. Because of the rugged terrain of the Ozarks, a number of trestles and tunnels were required in order to create a level railroad grade. The railroad made it possible for tourists to travel into the region, and it helped to make Branson and the Ozarks the tourism destination it is today.
• Belton, Grandview and Kansas City Railroad – The Belton, Grandview and Kansas City railroad is a short line passenger railroad and demonstration museum in Belton, Missouri. Operated by an all-volunteer, non-profit organization dedicated to preserving rail travel and railroading, the railroads offers five-mile, 45-minute round-trip scenic train rides south from Belton. It operates a 1920's era passenger coach or an open-air excursion car behind a 1950’s diesel locomotive.
• Columbia Star – The Columbia Star Dinner Train offers year-round evening dinner train trips departing Friday and Saturday nights at 7 p.m. with a Sunday Brunch train departing at 11:30 a.m. The Columbia Star offers gourmet dining onboard vintage 1930’s and 1940’s passenger cars pulled by 1950’s streamlined passenger locomotives on trips up to three hours in length. The train operates on the COLT rail line, traveling from the terminal on Brown Station Road north towards Centralia.

Missouri State Rail Plan Existing Conditions Page 23
2.5 Intermodal Facilities An intermodal facility is a location where freight is moved between multiple modes of transportation (rail, ship, truck and air) in containers or vehicles. These facilities are equipped with machines to reduce cargo-handling time thereby increasing the throughput in transporting freight faster. These facilities are operated with the help of movers, shippers and goods providers and users. Intermodal connectors may or may not be part of the National Highway System (NHS), but they can be connected to it through city, county or state roads. Below is a summary of intermodal facilities in Missouri. These facilities have, or are planned to have, a significant impact on freight mobility in the state.
NHS intermodal connectors are critical components of the nation’s freight system, tying modes together and facilitating distribution of products to users. They are key links for ensuring the U.S. transportation system seamlessly moves goods within regions, across the country and throughout the world.
Intermodal connectors are relatively short, averaging less than two miles in length. They usually are local, county or city streets designed to lower standards because they carry smaller volumes at slower speeds than the typical mainline NHS route (primarily Interstates and principal arterials). These connectors, however, must be capable of handling heavy, large trucks moving between the terminals and mainline NHS system or to other terminals for transfer to other modes (i.e., from port to rail yard). Those in poor condition or having design deficiencies can slow freight movement, damage goods in transit, decrease efficiency and negatively affect safety. A well-designed and maintained intermodal connector will allow freight to move efficiently to and from the terminal.
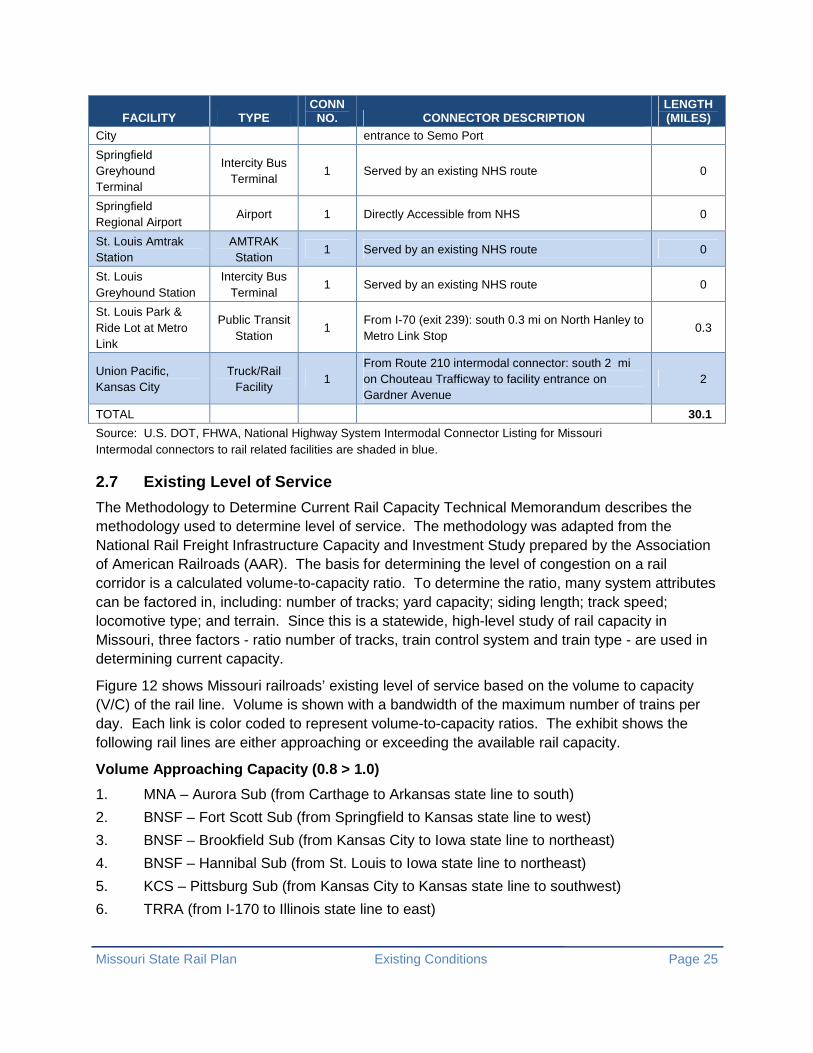
Intermodal connectors in Missouri are shown in Table 8. Intermodal connectors to rail-related facilities are shaded in blue. There are 21 identified Missouri intermodal connectors totaling 30.1 miles in length. Intermodal connectors to rail-related facilities make up 19.5 miles, or about 64.8 percent, of the total.
2.6 Port Facilities
Missouri has six ports located along the Mississippi River, and five more are currently in the development stage. The state has three ports along the Missouri River. The following ports have direct access to rail services:
• Pemiscot County Port Authority operates a slack-water harbor on the Mississippi River between Hayti and Caruthersville. A six mile rail spur between Hayti and the port was completed in 2010 to provide a direct connection with the BNSF.
• The Southeast Missouri Regional Port Authority operates the Semo Port in Scott City. The authority owns and operates the Semo Port Railroad, which provides switching service and connections with the UP and BNSF.
• The New Madrid County Port Authority is on the Mississippi River 175 miles south of St. Louis. The port has direct rail access to the UP.

Missouri State Rail Plan Existing Conditions Page 24
• The St. Louis Municipal River Terminal is served by the TRRA, providing direct access to BNSF, UP, NS and CSX.
• The Kansas City Port Authority operates a large port facility at the confluence of the Missouri and Kansas rivers. The terminal is served by UP and has extensive rail track at the facility for loading and unloading.
Table 8: Missouri National Highway System Intermoda l Connectors
FACILITY TYPE CONN
NO. CONNECTOR DESCRIPTION LENGTH (MILES)
Burlington Northern, Kansas City
Truck/Rail Facility
1 From I-29/35 (exit 6B): east 5.5 mi on Route 210 to 0
Burlington Northern, Kansas City
Truck/Rail Facility
2 From State Route 291: southwest 4.5 mi on 0
Kansas City Amtrak Station
AMTRAK Station
1 Served by an existing NHS route 0
Kansas City Greyhound Terminal
Intercity Bus Terminal
1 Served by an existing NHS route 0
Kansas City International Airport
Airport 1 From I-29/435 (exit 15): south 1.5 mi on Mexico City Ave to Air Cargo Facility on Paris Street
1.5
Kansas City Southern, Kansas City
Truck/Rail Facility
1 South on Chouteau Freeway from Route 210. 0
Lambert International Airport, St. Louis
Airport 1 Served by an existing NHS route 0
Multiple Ports on MS River, St. Louis
Port Terminal 1 Served by an existing NHS route 0
New Madrid County Port
Port Terminal 1
From I-55: east 0.54 mile on Route EE and 0.85 mile on Entrance Road, north 0.52 mile on Port Authority Access Road and 0.66 mile on Levee Road, and east 0.43 mile on County Road 406 to terminal.
3.0
Norfolk Southern/ Triple Crown, KC
Truck/Rail Facility
1 From I-29/35 (ex 6B): east 5.5 mi on Route 210 to Facility Entrance
5.5
Norfolk Southern/ Triple Crown, KC
Truck/Rail Facility
2 From State Route 291: southwest 4.5 mi on Route 210 to facility entrance
4.5
Norfolk Southern/ Triple Crown, St. Louis
Truck/Rail Facility
1 From I-70 (exit 247): northeast 0.3 mi on Grand, northwest 1.5 mi on Hall to intermodal facility
1.8
Norfolk Southern/ Triple Crown, St. Louis
Truck/Rail Facility
2 From I-270 (exit 34): southwest 5.7 mi on Riverdale Drive and continuing on Hall Street to terminal
5.7
Port of St. Louis #2 Port Terminal 1 7th Street (I-55/44 to I-55) 1.8
Semo Port, Scott Port Terminal 1 From I-55 (exit 91): Easterly 4.0 mi on Route AB to 4
Missouri State Rail Plan Existing Conditions Page 25
FACILITY TYPE CONN
NO. CONNECTOR DESCRIPTION LENGTH (MILES)
City entrance to Semo Port
Springfield Greyhound Terminal
Intercity Bus Terminal
1 Served by an existing NHS route 0
Springfield Regional Airport
Airport 1 Directly Accessible from NHS 0
St. Louis Amtrak Station
AMTRAK Station
1 Served by an existing NHS route 0
St. Louis Greyhound Station
Intercity Bus Terminal
1 Served by an existing NHS route 0
St. Louis Park & Ride Lot at Metro Link
Public Transit Station
1 From I-70 (exit 239): south 0.3 mi on North Hanley to Metro Link Stop
0.3
Union Pacific, Kansas City
Truck/Rail Facility
1 From Route 210 intermodal connector: south 2 mi on Chouteau Trafficway to facility entrance on Gardner Avenue
2
TOTAL 30.1
Source: U.S. DOT, FHWA, National Highway System Intermodal Connector Listing for Missouri Intermodal connectors to rail related facilities are shaded in blue.
2.7 Existing Level of Service
The Methodology to Determine Current Rail Capacity Technical Memorandum describes the methodology used to determine level of service. The methodology was adapted from the National Rail Freight Infrastructure Capacity and Investment Study prepared by the Association of American Railroads (AAR). The basis for determining the level of congestion on a rail corridor is a calculated volume-to-capacity ratio. To determine the ratio, many system attributes can be factored in, including: number of tracks; yard capacity; siding length; track speed; locomotive type; and terrain. Since this is a statewide, high-level study of rail capacity in Missouri, three factors - ratio number of tracks, train control system and train type - are used in determining current capacity.
Figure 12 shows Missouri railroads’ existing level of service based on the volume to capacity (V/C) of the rail line. Volume is shown with a bandwidth of the maximum number of trains per day. Each link is color coded to represent volume-to-capacity ratios. The exhibit shows the following rail lines are either approaching or exceeding the available rail capacity.
Volume Approaching Capacity (0.8 > 1.0)
1. MNA – Aurora Sub (from Carthage to Arkansas state line to south)
2. BNSF – Fort Scott Sub (from Springfield to Kansas state line to west)
3. BNSF – Brookfield Sub (from Kansas City to Iowa state line to northeast)
4. BNSF – Hannibal Sub (from St. Louis to Iowa state line to northeast)
5. KCS – Pittsburg Sub (from Kansas City to Kansas state line to southwest)
6. TRRA (from I-170 to Illinois state line to east)

Missouri State Rail Plan Existing Conditions Page 26
7. UP – Sedalia Sub (from I-435 to Kansas state line to west)
Volume Exceeding Capacity ( > 1.0)
1. BNSF – Thayer North Sub (from Springfield to Arkansas state line to south)
2. BNSF – St. Joseph Sub (from Kansas City to Nebraska state line to northwest)
3. UP – Chester Sub (from Dexter to Illinois state line to east)
4. UP – Hoxie Sub (from Dexter to Arkansas state line to south)
5. UP – River Sub (from Jefferson City to Kansas City)
6. NS – Kansas City District (from Moberly to Kansas City)
7. KCT (from I-435 to Kansas state line to west)

Missouri State Rail Plan Existing Conditions Page 27
Figure 1 7: Existing Levels of Service for Missouri’s Railroa ds
Joplin
Missouri State Rail Plan Existing Conditions Page 28
3.0 Abandonments
Due to poor track and market conditions, some rail lines still have the potential to become abandoned. Rail lines over which no local traffic has moved for two years without any formal complaint are exempt from the traditional process and can be abandoned simply by filing a notice with the Surface Transportation Board (STB).
Under the U.S. Interstate Commerce Commission’s (ICC) Termination Act of 1995, a railroad may abandon a line only with the permission of the STB. The STB must determine whether the "present or future public convenience and necessity require or permit" the abandonment. In making this determination, the STB balances two competing factors. The first is the need of local communities and shippers for continued service. This need is balanced against the public interest in releasing railroads from financial burdens which drain on their overall financial health and lessen their ability to operate economically elsewhere.
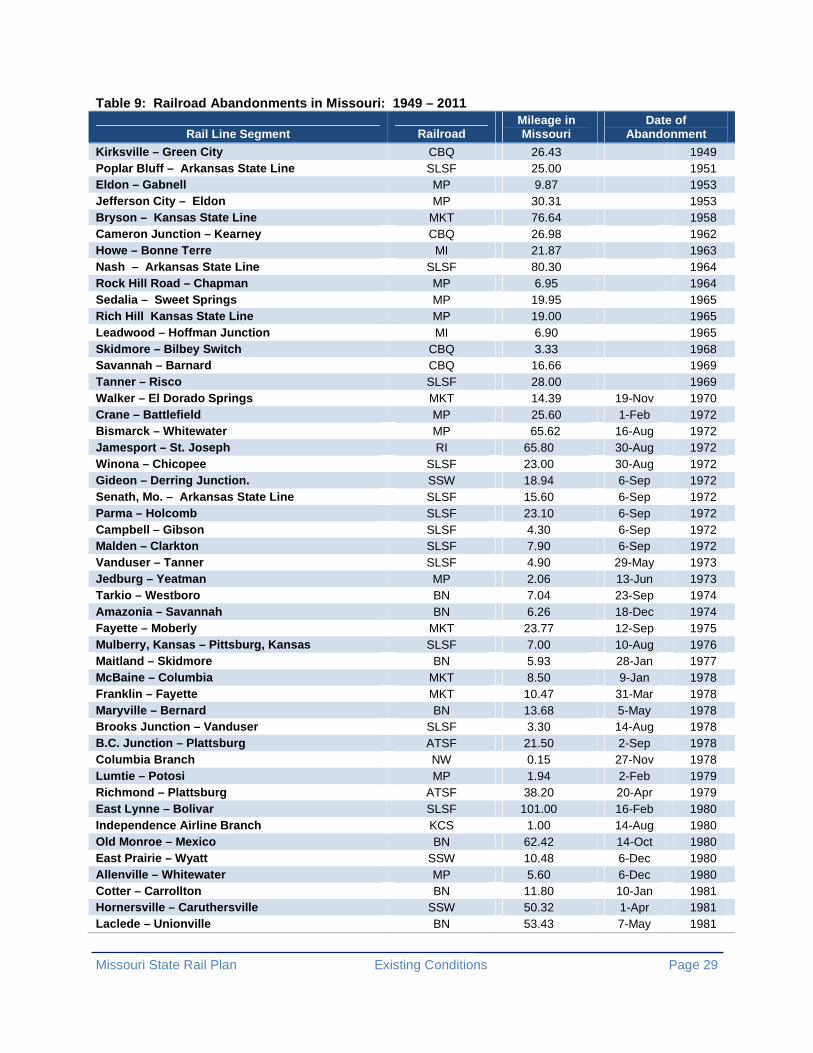
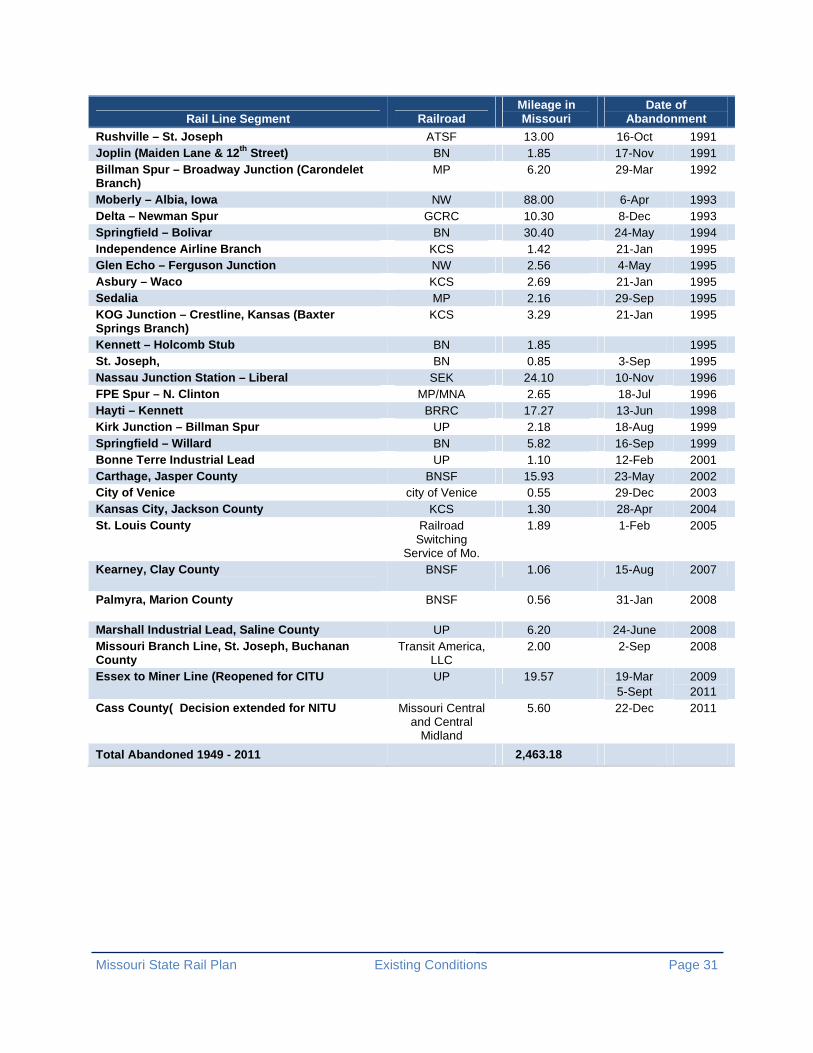
Since 1949, 124 separate Missouri rail-line abandonments have been approved by the Surface Transportation Board or its predecessor agency the Interstate Commerce Commission. Most abandonments have occurred since the 1980 passage of the Staggers Rail Act. This federal legislation removed many regulatory restraints on the rail industry, making it easier for railroads to abandon redundant or light-density lines.14 A complete list of Missouri railroad abandonments since 1949 is provided in Table 9.
14 http://www.fra.dot.gov/downloads/policy/staggers_rail_act_impact.pdf
Missouri State Rail Plan Existing Conditions Page 29
Table 9: Railroad Abandonments in Missouri: 1949 – 2011
Rail Line Segment Railroad Mileage in Missouri
Date of Abandonment
Kirksville – Green City CBQ 26.43 1949 Poplar Bluff – Arkansas State Line SLSF 25.00 1951 Eldon – Gabnell MP 9.87 1953 Jefferson City – Eldon MP 30.31 1953 Bryson – Kansas State Line MKT 76.64 1958 Cameron Junction – Kearney CBQ 26.98 1962 Howe – Bonne Terre MI 21.87 1963 Nash – Arkansas State Line SLSF 80.30 1964 Rock Hill Road – Chapman MP 6.95 1964 Sedalia – Sweet Springs MP 19.95 1965 Rich Hill Kansas State Line MP 19.00 1965 Leadwood – Hoffman Junction MI 6.90 1965 Skidmore – Bilbey Switch CBQ 3.33 1968 Savannah – Barnard CBQ 16.66 1969 Tanner – Risco SLSF 28.00 1969 Walker – El Dorado Springs MKT 14.39 19-Nov 1970 Crane – Battlefield MP 25.60 1-Feb 1972 Bismarck – Whitewater MP 65.62 16-Aug 1972 Jamesport – St. Joseph RI 65.80 30-Aug 1972 Winona – Chicopee SLSF 23.00 30-Aug 1972 Gideon – Derring Junction. SSW 18.94 6-Sep 1972 Senath, Mo. – Arkansas State Line SLSF 15.60 6-Sep 1972 Parma – Holcomb SLSF 23.10 6-Sep 1972 Campbell – Gibson SLSF 4.30 6-Sep 1972 Malden – Clarkton SLSF 7.90 6-Sep 1972 Vanduser – Tanner SLSF 4.90 29-May 1973 Jedburg – Yeatman MP 2.06 13-Jun 1973 Tarkio – Westboro BN 7.04 23-Sep 1974 Amazonia – Savannah BN 6.26 18-Dec 1974 Fayette – Moberly MKT 23.77 12-Sep 1975 Mulberry, Kansas – Pittsburg, Kansas SLSF 7.00 10-Aug 1976 Maitland – Skidmore BN 5.93 28-Jan 1977 McBaine – Columbia MKT 8.50 9-Jan 1978 Franklin – Fayette MKT 10.47 31-Mar 1978 Maryville – Bernard BN 13.68 5-May 1978 Brooks Junction – Vanduser SLSF 3.30 14-Aug 1978 B.C. Junction – Plattsburg ATSF 21.50 2-Sep 1978 Columbia Branch NW 0.15 27-Nov 1978 Lumtie – Potosi MP 1.94 2-Feb 1979 Richmond – Plattsburg ATSF 38.20 20-Apr 1979 East Lynne – Bolivar SLSF 101.00 16-Feb 1980 Independence Airline Branch KCS 1.00 14-Aug 1980 Old Monroe – Mexico BN 62.42 14-Oct 1980 East Prairie – Wyatt SSW 10.48 6-Dec 1980 Allenville – Whitewater MP 5.60 6-Dec 1980 Cotter – Carrollton BN 11.80 10-Jan 1981 Hornersville – Caruthersville SSW 50.32 1-Apr 1981 Laclede – Unionville BN 53.43 7-May 1981

Missouri State Rail Plan Existing Conditions Page 30
Rail Line Segment Railroad Mileage in Missouri
Date of Abandonment
West Quincy – Kirksville BN 67.40 20-May 1981 Coburn Junction – Jamesport RI 4.90 Sep 1981 St. Joseph – Iowa State Line BN 110.09 2-Oct 1981 Bigelow – Maitland BN 14.30 8-Nov 1981 Empire – Kansas State Line BN 1.40 7-Feb 1982 Alexandria – Iowa State Line BN 67.60 14-Feb 1982 Corning – Tarkio BN 15.50 25-Apr 1982 Lexington – Sweet Springs MP 33.50 29-Aug 1982 Kennett – Holcomb BN 9.60 24-Oct 1982 Maywood – Sugar Creek (Independence Airline Branch)
KCS 4.10 4-Nov 1982
Kennett – Senath BN 6.30 20-Nov 1982 Maryville – Creston, owaA BN 16.50 25-Nov 1982 Neelyville – Doniphan MP 19.60 13-Feb 1983 Horn – Joplin MKT 5.90 17-Mar 1983 Willow Springs – Winona BN 37.83 17-Jul 1983 Kissick – Ozark BN 7.50 14-Aug 1983 Henrietta – Richmond ATSF 5.60 15-Dec 1984 Lilbourn – East Prairie SSW 17.50 19-Feb 1984 Aurora – Mount Vemon BN 11.05 9-Jun 1984 Lead Jct. – Salem BN 26.63 12-Aug 1984 St. Joseph – Iowa State Line CNW 59.60 12-Oct 1984 Webb City – Red Plant BN 0.72 15-Nov 1984 Laclede – St. Joseph BN 91.82 25-Nov 1984 Carl Junction – J&G Junction BN 7.62 13-Feb 1985 Hayti – Caruthersville BN 8.00 18-May 1985 Malden – Gideon SSW 10.23 21-Jun 1985 Cape Girardeau Subdivision MP 3.30 11-Jul 1985 Chillicothe – Lock Springs NS/NM 13.20 21-Dec 1985 Burlington Junction – Iowa State Line NS/NM 6.30 21-Dec 1985 Kansas City, Kansas – St. Joseph CNW 62.50 23-Jan 1986 Newman Spur – Buckeye MP 29.80 16-Feb 1986 Kansas City – Kansas City, Kansas CNW 1.20 12-Jan 1987 East Leavenworth – Leavenworth, Kansas BN 2.16 8-Apr 1987 Sedalia – Machens MKT 199.92 27-May 1987 Freight House Lead Branch SSW 1.02 2-Oct 1987 Mineral Point– Lumtie MP 1.75 30-Dec 1987 St. Louis Railroad Tunnel (3 rd & Spruce Streets – city of St. Louis)
TRRA 1.20 16-Jun 1988
Wallis Spur MP 1.17 18-Mar 1989 BV Junction – East Lynne BN 41.32 1-Apr 1989 St. Joseph MP 0.91 5-Jul 1989 BC Junction – St. Joseph ATSF 6.05 12-Jul 1989 West Alton – Alton, Illinois BN 3.03 1-Aug 1989 St. Joseph ATSF 1.60 3-Oct 1989 Sedalia – North Clinton MKT 33.60 1-Nov 1989 Joplin J Line – J&G Junction (Perkins St.) BN 1.40 6-Sep 1990 Joplin – Webb City BN 4.37 18-Jan 1991 St. Joseph SJT 1.05 1-Feb 1991
Missouri State Rail Plan Existing Conditions Page 31
Rail Line Segment Railroad Mileage in Missouri
Date of Abandonment
Rushville – St. Joseph ATSF 13.00 16-Oct 1991 Joplin (Maiden Lane & 12 th Street) BN 1.85 17-Nov 1991 Billman Spur – Broadway Junction (Carondelet Branch)
MP 6.20 29-Mar 1992
Moberly – Albia, Iowa NW 88.00 6-Apr 1993 Delta – Newman Spur GCRC 10.30 8-Dec 1993 Springfield – Bolivar BN 30.40 24-May 1994 Independence Airline Branch KCS 1.42 21-Jan 1995 Glen Echo – Ferguson Junction NW 2.56 4-May 1995 Asbury – Waco KCS 2.69 21-Jan 1995 Sedalia MP 2.16 29-Sep 1995 KOG Junction – Crestline, Kansas (Baxter Springs Branch)
KCS 3.29 21-Jan 1995
Kennett – Holcomb Stub BN 1.85 1995 St. Joseph, BN 0.85 3-Sep 1995 Nassau Junction Station – Liberal SEK 24.10 10-Nov 1996 FPE Spur – N. Clinton MP/MNA 2.65 18-Jul 1996 Hayti – Kennett BRRC 17.27 13-Jun 1998 Kirk Junction – Billman Spur UP 2.18 18-Aug 1999 Springfield – Willard BN 5.82 16-Sep 1999 Bonne Terre Industrial Lead UP 1.10 12-Feb 2001 Carthage, Jasper County BNSF 15.93 23-May 2002 City of Venice city of Venice 0.55 29-Dec 2003 Kansas City, Jackson County KCS 1.30 28-Apr 2004 St. Louis County Railroad
Switching Service of Mo.
1.89 1-Feb 2005
Kearney, Clay County
BNSF 1.06 15-Aug 2007
Palmyra, Marion County
BNSF 0.56 31-Jan 2008
Marshall Industrial Lead, Saline County UP 6.20 24-June 2008 Missouri Branch Line, St. Joseph, Buchanan County
Transit America, LLC
2.00 2-Sep 2008
Essex to Miner Line (Reopened for CITU UP 19.57 19-Mar 5-Sept
2009 2011
Cass County( Decision extended for NITU Missouri Central and Central
Midland
5.60 22-Dec 2011
Total Abandoned 1949 - 2011 2,463.18

Missouri State Rail Plan Existing Conditions Page 32
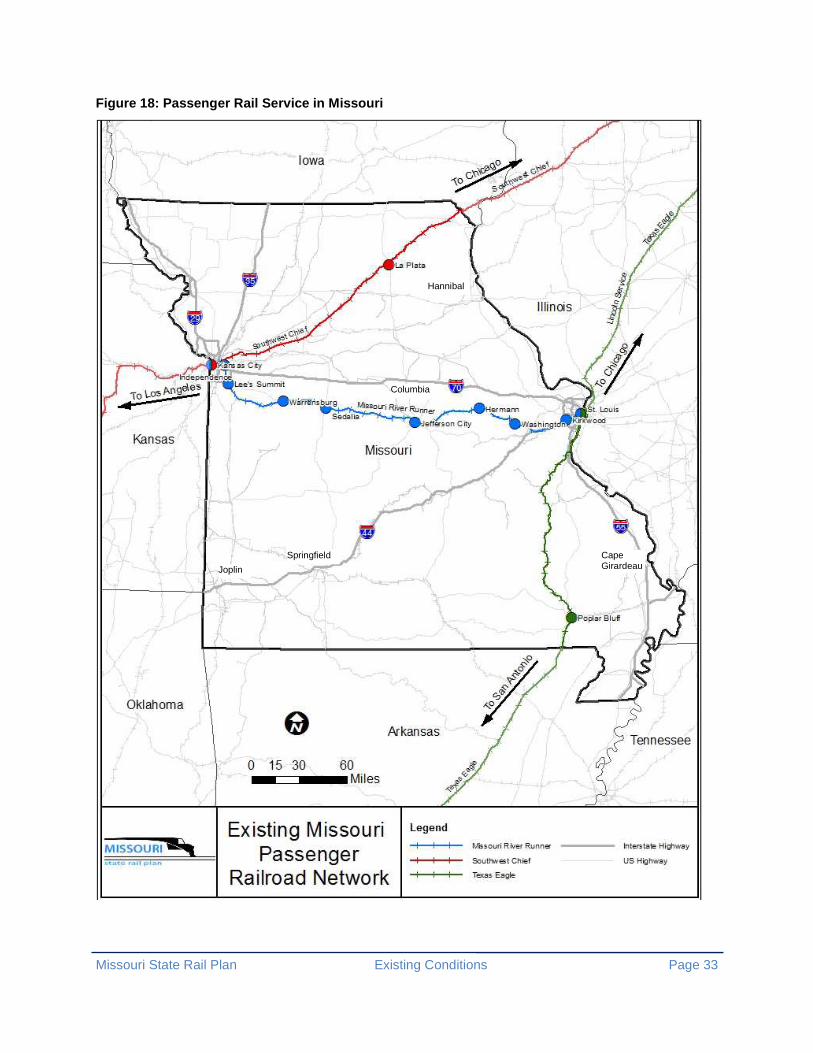
4.0 Passenger Rail in Missouri Intercity passenger rail service is provided in Missouri on four different routes operated by the National Railroad Passenger Corporation (Amtrak). Missouri is currently served by Amtrak passenger trains on two regional routes and two long-distance routes (Figure 18 shows Missouri routes and stops; Table 10 shows route stops outside of Missouri):
• The Missouri River Runner is supported by the state of Missouri and provides service between St. Louis to Kansas City on two round trips per day. Trains take approximately five hours and 40 minutes to travel the 283 miles between Missouri’s two largest cities.
• The Lincoln Service is an Illinois state-supported train which provides service on four daily round trips between St. Louis and Chicago. Trains currently take approximately five hours and 40 minutes to travel the 284 miles between these two cities. While a significant portion of the riders on these trains are coming from or going to St. Louis, Missouri does not provide any state subsidy for this service.
• The Southwest Chief is a long-distance train operating between Chicago and Los Angeles. The Chief stops at two stations in Missouri – La Plata and Kansas City.
• The Texas Eagle is a long-distance train operating on one round-trip per day between Chicago and San Antonio with stops in Missouri at St. Louis and Poplar Bluff.
Missouri State Rail Plan Existing Conditions Page 33
Figure 18: Passenger Rail Service in Missouri
Joplin
Columbia
Hannibal
Springfield Cape Girardeau

Missouri State Rail Plan Existing Conditions Page 34
Table 10: Current Amtrak Service Stops
Missouri River Runner Lincoln Service Southwest Chief Texas Eagle St. Louis Kirkwood Washington Hermann Jefferson City Sedalia Warrensburg Lee’s Summit Independence Kansas City
St. Louis Alton, Illinois Carlinville, Illinois Springfield, Illinois Lincoln, Illinois Bloomington – Normal Pontiac, Illinois Dwight, Illinois Joliet, Illinois Summit, Illinois Chicago, Illinois
Key Stops Include: Chicago Galesburg, Illinois La Plata, Missouri Kansas City, Missouri Fort Madison, Iowa Lawrence, Kansas Topeka, Kansas Hutchinson, Kansas Lamar, Colorado Lamy, New Mexico Albuquerque, New Mexico Gallup, New Mexico Winslow, Arizona Flagstaff, Arizona Williams Junction, Arizona
(Grand Canyon) Barstow, California San Bernardino, California Riverside, California Los Angeles
Key Stops Include: Chicago Joliet, Illinois Normal – Bloomington Springfield, Illinois St. Louis Poplar Bluff, Missouri Little Rock, Arkansas Arkadelphia, Arkansas Texarkana, Arkansas Dallas Fort Worth, Texas Austin, Texas San Antonio, Texas
Passenger can continue on the Sunset Limited at San Antonio and have service to the following stations:
El Paso, Texas Tucson, Arizona Yuma, Arizona Palm Springs, California Ontario, California
Los Angeles,
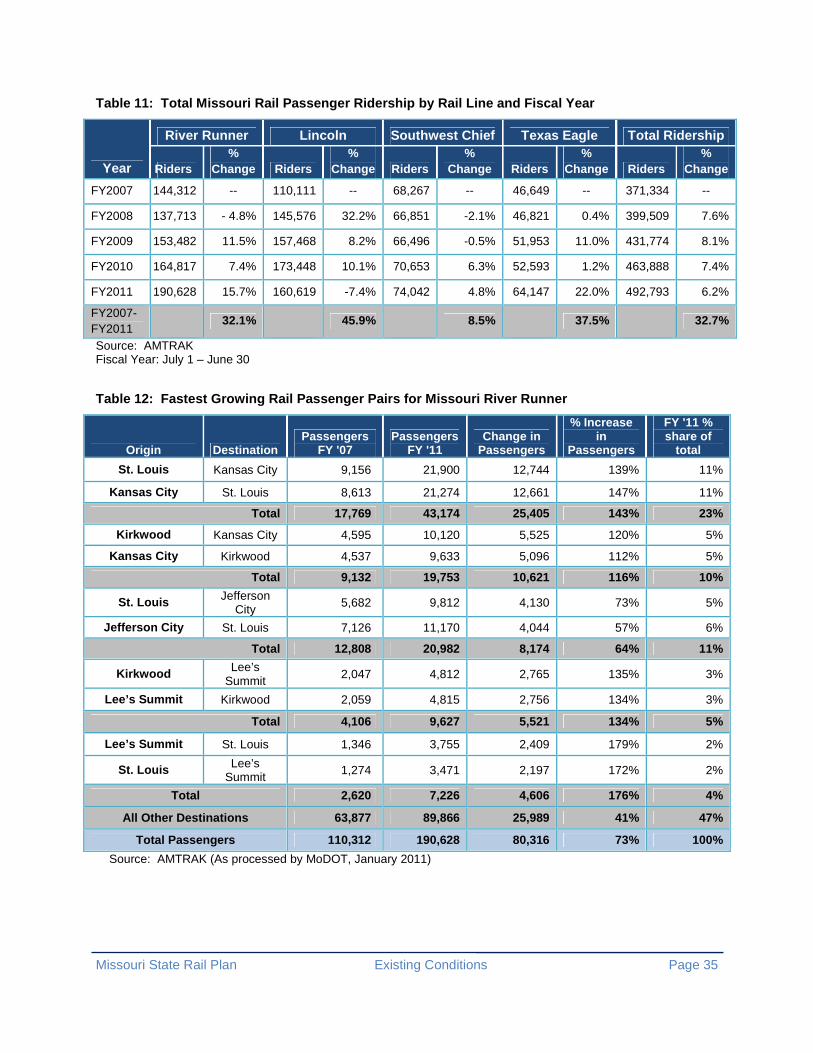
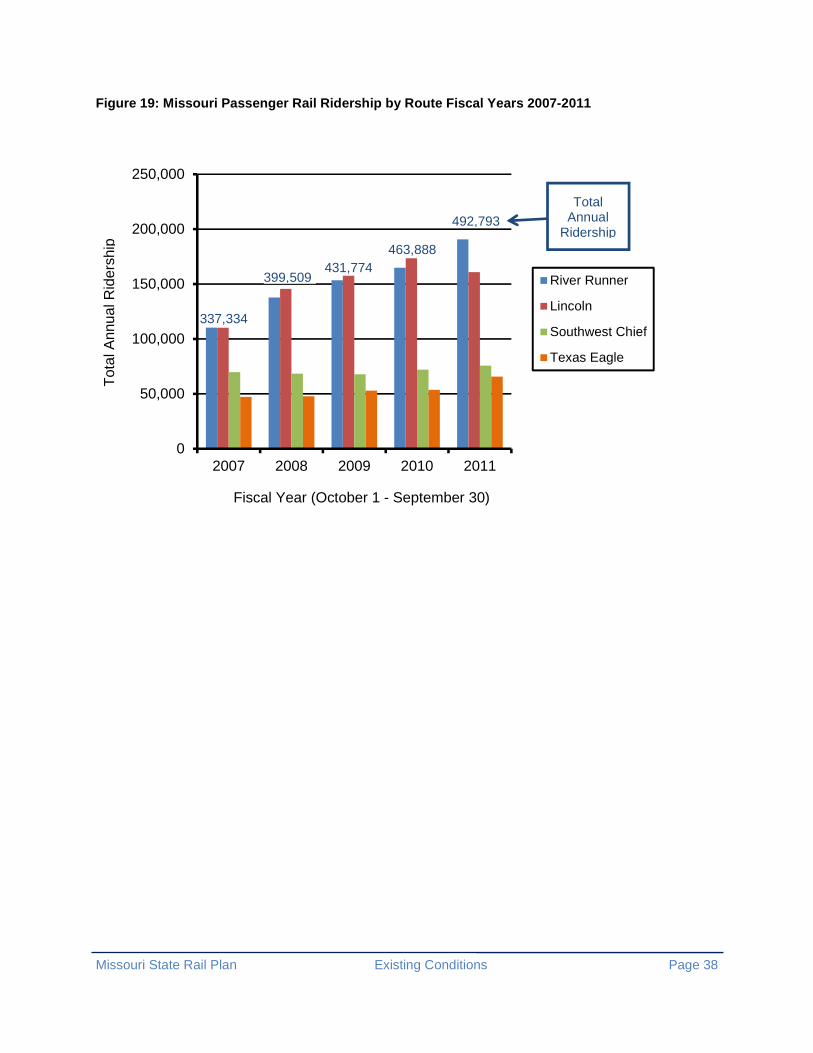
According to Amtrak statistics, intercity passenger rail ridership for stations in Missouri has increased 46 percent to 489,436 in FY 2011 from 335,339 in FY 2007 (Table 11).
The Missouri River Runner saw the largest growth in ridership, increasing more than 70 percent during the last five years. During the same period, ridership more than doubled between Kansas City and St. Louis, Kansas City and Kirkwood, St. Louis and Kirkwood, and Kirkwood and Lee’s Summit (Table 12).
The number of Missouri riders on the Lincoln Service increased more than 45 percent during the last five years. The Lincoln Service saw a loss of ridership during FY 2011, primarily as a result of delays and slow orders associated with the high-speed rail construction projects in Illinois. Once construction is completed, train speeds between St. Louis and Chicago will increase to a maximum of 110 mph from 79 mph and cut travel time by 90 minutes. This service improvement is expected to produce rapid ridership increases.
Missouri State Rail Plan Existing Conditions Page 35
Table 11: Total Missouri Rail Passenger Ridership by Rail Line and Fiscal Year
Year
River Runner Lincoln Southwest Chief Texas Eagle Total Ridership
Riders %
Change Riders %
Change Riders %
Change Riders %
Change Riders %
Change
FY2007 144,312 -- 110,111 -- 68,267 -- 46,649 -- 371,334 --
FY2008 137,713 - 4.8% 145,576 32.2% 66,851 -2.1% 46,821 0.4% 399,509 7.6%
FY2009 153,482 11.5% 157,468 8.2% 66,496 -0.5% 51,953 11.0% 431,774 8.1%
FY2010 164,817 7.4% 173,448 10.1% 70,653 6.3% 52,593 1.2% 463,888 7.4%
FY2011 190,628 15.7% 160,619 -7.4% 74,042 4.8% 64,147 22.0% 492,793 6.2%
FY2007- FY2011
32.1%
45.9%
8.5%
37.5%
32.7%
Source: AMTRAK Fiscal Year: July 1 – June 30
Table 12: Fastest Growing Rail Passenger Pairs for Missouri River Runner
Origin Destination Passengers
FY '07 Passengers
FY '11 Change in
Passengers
% Increase in
Passengers
FY '11 % share of
total
St. Louis Kansas City 9,156 21,900 12,744 139% 11%
Kansas City St. Louis 8,613 21,274 12,661 147% 11%
Total 17,769 43,174 25,405 143% 23%
Kirkwood Kansas City 4,595 10,120 5,525 120% 5%
Kansas City Kirkwood 4,537 9,633 5,096 112% 5%
Total 9,132 19,753 10,621 116% 10%
St. Louis Jefferson City 5,682 9,812 4,130 73% 5%
Jefferson City St. Louis 7,126 11,170 4,044 57% 6%
Total 12,808 20,982 8,174 64% 11%
Kirkwood Lee’s Summit 2,047 4,812 2,765 135% 3%
Lee’s Summit Kirkwood 2,059 4,815 2,756 134% 3%
Total 4,106 9,627 5,521 134% 5%
Lee’s Summit St. Louis 1,346 3,755 2,409 179% 2%
St. Louis Lee’s Summit 1,274 3,471 2,197 172% 2%
Total 2,620 7,226 4,606 176% 4%
All Other Destinations 63,877 89,866 25,989 41% 47%
Total Passengers 110,312 190,628 80,316 73% 100%
Source: AMTRAK (As processed by MoDOT, January 2011)
Missouri State Rail Plan Existing Conditions Page 36
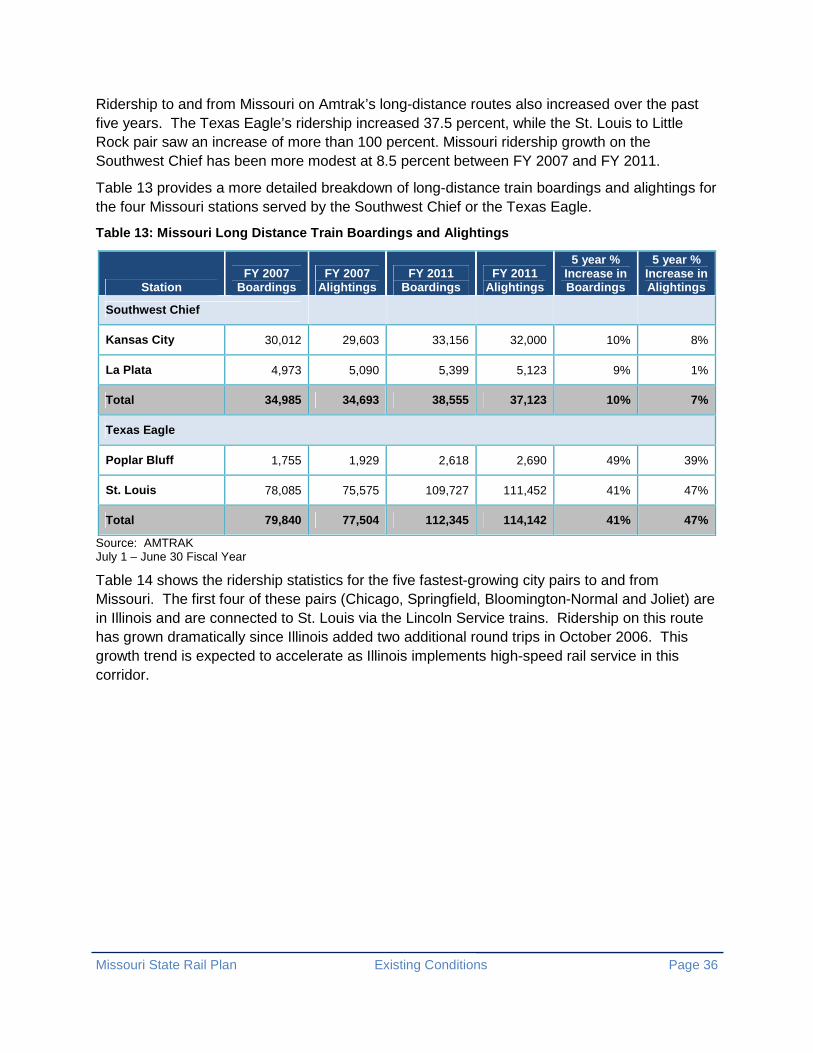
Ridership to and from Missouri on Amtrak’s long-distance routes also increased over the past five years. The Texas Eagle’s ridership increased 37.5 percent, while the St. Louis to Little Rock pair saw an increase of more than 100 percent. Missouri ridership growth on the Southwest Chief has been more modest at 8.5 percent between FY 2007 and FY 2011.
Table 13 provides a more detailed breakdown of long-distance train boardings and alightings for the four Missouri stations served by the Southwest Chief or the Texas Eagle.
Table 13: Missouri Long Distance Train Boardings an d Alightings
Station FY 2007
Boardings FY 2007
Alightings FY 2011
Boardings FY 2011
Alightings
5 year % Increase in Boardings
5 year % Increase in Alightings
Southwest Chief
Kansas City 30,012 29,603 33,156 32,000 10% 8%
La Plata 4,973 5,090 5,399 5,123 9% 1%
Total 34,985 34,693 38,555 37,123 10% 7%
Texas Eagle
Poplar Bluff 1,755 1,929 2,618 2,690 49% 39%
St. Louis 78,085 75,575 109,727 111,452 41% 47%
Total 79,840 77,504 112,345 114,142 41% 47%
Source: AMTRAK July 1 – June 30 Fiscal Year
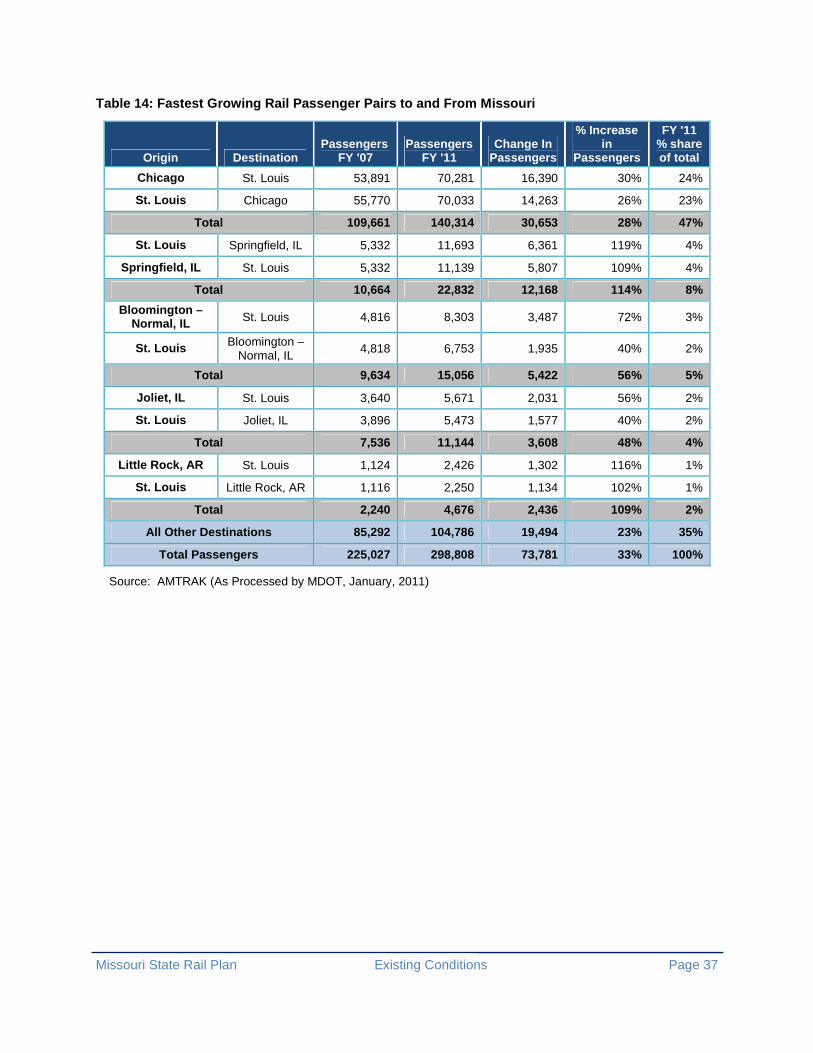
Table 14 shows the ridership statistics for the five fastest-growing city pairs to and from Missouri. The first four of these pairs (Chicago, Springfield, Bloomington-Normal and Joliet) are in Illinois and are connected to St. Louis via the Lincoln Service trains. Ridership on this route has grown dramatically since Illinois added two additional round trips in October 2006. This growth trend is expected to accelerate as Illinois implements high-speed rail service in this corridor.
Missouri State Rail Plan Existing Conditions Page 37
Table 14: Fastest Growing Rail Passenger Pairs to a nd From Missouri
Origin Destination Passengers
FY '07 Passengers
FY '11 Change In
Passengers
% Increase in
Passengers
FY '11 % share of total
Chicago St. Louis 53,891 70,281 16,390 30% 24%
St. Louis Chicago 55,770 70,033 14,263 26% 23%
Total 109,661 140,314 30,653 28% 47%
St. Louis Springfield, IL 5,332 11,693 6,361 119% 4%
Springfield, IL St. Louis 5,332 11,139 5,807 109% 4%
Total 10,664 22,832 12,168 114% 8%
Bloomington – Normal, IL St. Louis 4,816 8,303 3,487 72% 3%
St. Louis Bloomington – Normal, IL
4,818 6,753 1,935 40% 2%
Total 9,634 15,056 5,422 56% 5%
Joliet, IL St. Louis 3,640 5,671 2,031 56% 2%
St. Louis Joliet, IL 3,896 5,473 1,577 40% 2%
Total 7,536 11,144 3,608 48% 4%
Little Rock, AR St. Louis 1,124 2,426 1,302 116% 1%
St. Louis Little Rock, AR 1,116 2,250 1,134 102% 1%
Total 2,240 4,676 2,436 109% 2%
All Other Destinations 85,292 104,786 19,494 23% 35%
Total Passengers 225,027 298,808 73,781 33% 100%
Source: AMTRAK (As Processed by MDOT, January, 2011)
Missouri State Rail Plan Existing Conditions Page 38
Figure 19: Missouri Passenger Rail Ridership by Rou te Fiscal Years 2007-2011
0
50,000
100,000
150,000
200,000
250,000
2007 2008 2009 2010 2011
River Runner
Lincoln
Southwest Chief
Texas Eagle
Tot
al A
nnua
l Rid
ersh
ip
Fiscal Year (October 1 - September 30)
337,334
399,509 431,774
463,888
492,793
Total Annual
Ridership

Missouri State Rail Plan Existing Conditions Page 39
Figure 20: Missouri Total Train Accidents January 2000 to November 2011
5.0 Rail Safety America’s railroads are safer today than ever before, according to the Association of American Railroads (AAR). Even so, the challenge of safety is never-ending, prompting railroads to collaborate with their employees, suppliers, customers and policymakers in constantly developing and implementing new safety-enhancing technologies and operating practices. Examples of these efforts can be seen in such national rail safety initiatives as:
• Highway-rail grade crossings
• Hazardous materials transportation
• Positive train control
• Remote control locomotives
MoDOT and Missouri’s railroad operators understand and promote the importance of railroad safety. MoDOT’s website, for example, has rail safety information designed for schools, communities, commercial drivers, driver education programs and other interested parties. Here people can learn more about railroad grade crossing hazards and safety issues, while also learning more about how to avoid becoming involved in an accident.
Figure 20 illustrates total train accidents by county in Missouri from January 2000 to November 2011.15 A train accident can be defined as an event resulting in monetary damage to track and/or on-track rail equipment. This definition does not include lading, clearing costs and environmental damage. Total accidents/incidents generally represent the sum of train accidents, highway-rail incidents and other incidents. Other incidents include any event causing a death, an injury or an occupational illness to a railroad employee.
Most fatalities reported in this category are to trespassers. Highway/rail incidents are not reported in this graphic. Not surprisingly, as shown in the graphic, most train accidents reported occur near Kansas City and St. Louis, the nation’s second- and third- largest freight hubs respectively.
15 Federal Railroad Administration Office of Safety Analysis
http://safetydata.fra.dot.gov/OfficeofSafety/publicsite/crossing/crossing.aspx
Number of Accidents
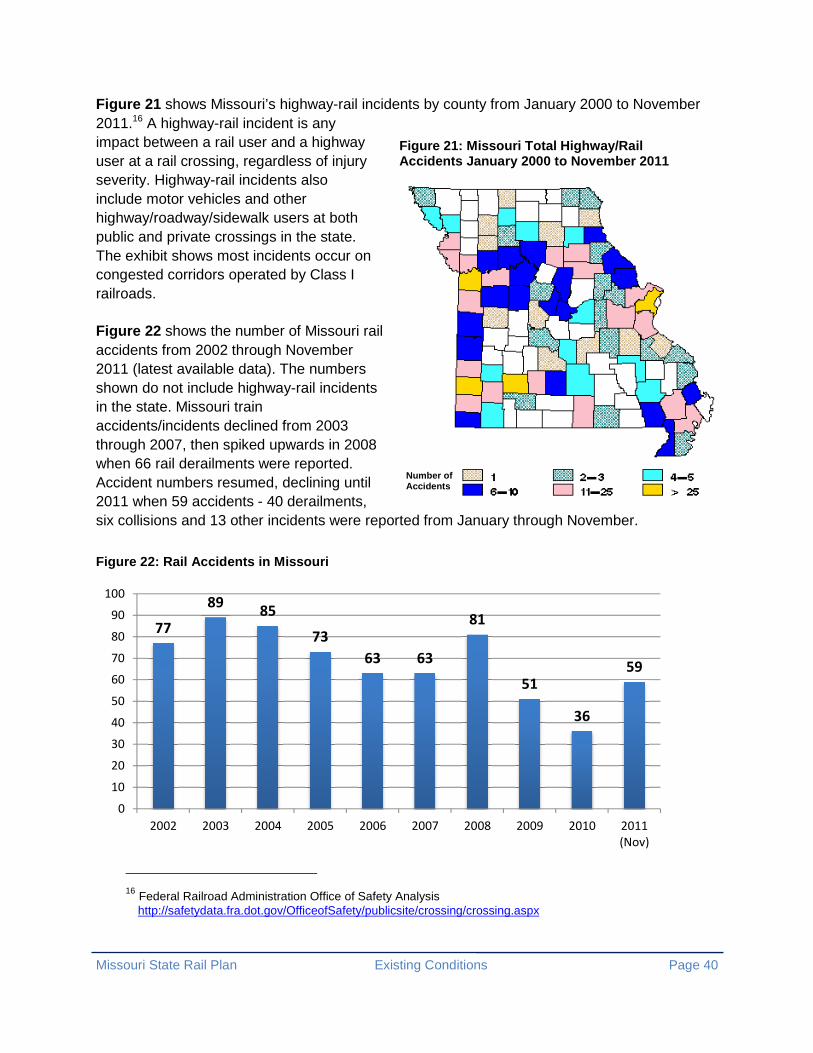
Missouri State Rail Plan Existing Conditions Page 40
Figure 21: Mis souri Total Highway/Rail Accidents January 2000 to November 2011
Figure 21 shows Missouri’s highway-rail incidents by county from January 2000 to November 2011.16 A highway-rail incident is any impact between a rail user and a highway user at a rail crossing, regardless of injury severity. Highway-rail incidents also include motor vehicles and other highway/roadway/sidewalk users at both public and private crossings in the state. The exhibit shows most incidents occur on congested corridors operated by Class I railroads.
Figure 22 shows the number of Missouri rail accidents from 2002 through November 2011 (latest available data). The numbers shown do not include highway-rail incidents in the state. Missouri train accidents/incidents declined from 2003 through 2007, then spiked upwards in 2008 when 66 rail derailments were reported. Accident numbers resumed, declining until 2011 when 59 accidents - 40 derailments, six collisions and 13 other incidents were reported from January through November.
Figure 22: Rail Accidents in Missouri
16 Federal Railroad Administration Office of Safety Analysis
http://safetydata.fra.dot.gov/OfficeofSafety/publicsite/crossing/crossing.aspx
77
8985
73
63 63
81
51
36
59
0
10
20
30
40
50
60
70
80
90
100
2002 2003 2004 2005 2006 2007 2008 2009 2010 2011
(Nov)
Number of Accidents

Missouri State Rail Plan Existing Conditions Page 41
Figure 23 shows the number of highway-rail crossing incidents (any impact involving a rail user and a highway user) reported in Missouri from 2008 through November 2011 (latest available data). There are 4,040 public and 2,783 private at grade railroad crossings in Missouri.17Highway-rail crossing and trespassing incidents account for the majority of all fatalities in highway-rail incidents in the state. In 2011, for example, 100 percent of the fatalities in highway-rail incidents were due to trespassing.
Figure 23: Missouri Highway/Rail Incidents
17 US DOT National Highway-Rail Crossing Inventory File. April 12, 2009.
http://www.fra.dot.gov/downloads/safety/SummaryInventoryDataCounts41209.pdf
46
39
52
43
0
10
20
30
40
50
60
2008 2009 2010 2011 (Nov)

Missouri State Rail Plan Existing Conditions Page 42
6.0 Previous Rail Studies and Reports Missouri and various local and regional governmental agencies have conducted numerous studies addressing the role of rail in the state’s transportation network. These studies focused on determining current and future rail needs and the benefits of investing in the state’s rail network. Studies range from comprehensive statewide policy development plans to individual studies designed to move rail projects forward to implementation. What follows are brief descriptions of each of the significant studies conducted since 1995.
6.1 Missouri Statewide Reports and Studies
6.1.1 Statewide Transportation Improvement Program (STIP) (Fiscal Years 2011 - 2015)
The Missouri Department of Transportation prepares the five-year Statewide Transportation Improvement Program (STIP) in accordance with state and federal law. The STIP is prepared annually and includes all projects proposed for funding under the Safe, Accountable, Flexible, Efficient Transportation Equity Act: A Legacy for Users (SAFETEA-LU) and state revenue. This document meets all state and federal requirements and is fiscally constrained. The STIP identifies specific highway, bridge, transit, aviation, rail, waterways, enhancements, and other transportation projects. It is a project-specific document which tells Missourians what improvements to expect on their transportation system during this period.
The Multimodal Operations Division of MoDOT performs statewide planning, grant administration and technical assistance in the areas of aviation, railroads, transit, freight development and waterways. In addition, MoDOT has regulatory responsibility over railroads.
Table 15 provides a summary of MoDOT’s Rail Program from the current STIP which covers the five year period from FY 2011 to FY 2015. See MoDOT’s website: http://www.modot.mo.gov for more information on rail projects identified in the STIP.
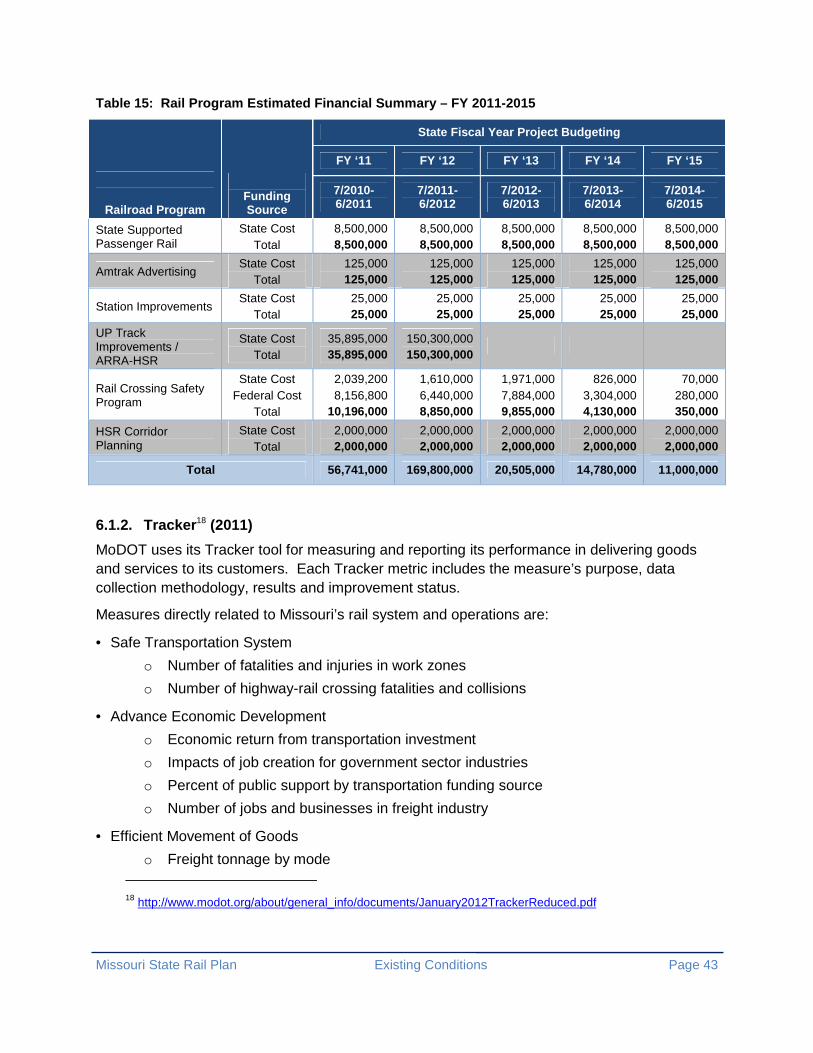
Missouri State Rail Plan Existing Conditions Page 43
Table 15: Rail Program Estimated Financial Summary – FY 2011-2015
Railroad Program
Funding Source
State Fiscal Year Project Budgeting
FY ‘11 FY ‘12 FY ‘13 FY ‘14 FY ‘15
7/2010-6/2011
7/2011-6/2012
7/2012-6/2013
7/2013-6/2014
7/2014-6/2015
State Supported Passenger Rail
State Cost Total
8,500,000 8,500,000
8,500,000 8,500,000
8,500,000 8,500,000
8,500,000 8,500,000
8,500,000 8,500,000
Amtrak Advertising State Cost
Total 125,000 125,000
125,000 125,000
125,000 125,000
125,000 125,000
125,000 125,000
Station Improvements State Cost
Total 25,000 25,000
25,000 25,000
25,000 25,000
25,000 25,000
25,000 25,000
UP Track Improvements / ARRA-HSR
State Cost Total
35,895,000 35,895,000
150,300,000 150,300,000
Rail Crossing Safety Program
State Cost Federal Cost
Total
2,039,200 8,156,800
10,196,000
1,610,000 6,440,000 8,850,000
1,971,000 7,884,000 9,855,000
826,000 3,304,000 4,130,000
70,000 280,000 350,000
HSR Corridor Planning
State Cost Total
2,000,000 2,000,000
2,000,000 2,000,000
2,000,000 2,000,000
2,000,000 2,000,000
2,000,000 2,000,000
Total 56,741,000 169,800,000 20,505,000 14,780,000 11,000,000
6.1.2. Tracker 18 (2011)
MoDOT uses its Tracker tool for measuring and reporting its performance in delivering goods and services to its customers. Each Tracker metric includes the measure’s purpose, data collection methodology, results and improvement status.
Measures directly related to Missouri’s rail system and operations are:
• Safe Transportation System
o Number of fatalities and injuries in work zones
o Number of highway-rail crossing fatalities and collisions
• Advance Economic Development
o Economic return from transportation investment
o Impacts of job creation for government sector industries
o Percent of public support by transportation funding source
o Number of jobs and businesses in freight industry
• Efficient Movement of Goods
o Freight tonnage by mode 18 http://www.modot.org/about/general_info/documents/January2012TrackerReduced.pdf

Missouri State Rail Plan Existing Conditions Page 44
• Easily Accessible Modal Choices
o Number of transit passengers
o Number of rail passengers
o State funding for multimodal programs
o Percent of customers satisfied with transportation options
o Number of claims and amount paid for general liability
6.1.3 Missouri Freight and Passenger Rail Analysis Phase 219 (2009)
The objective of this study was to develop a prioritized list of rail enhancements to address passenger and freight rail performance on the Union Pacific line between St. Louis and Kansas City in order to improve on-time passenger service and reduce freight delays.
The study analyzed Amtrak delay data for January 1, 2008 – June 30, 2009 to evaluate the sources and locations of delay. The study found the largest single cause of delay was freight train interference, which caused 53.38 percent of the delay minutes. Temporary speed restrictions caused 15.09 percent of the delay and passenger train interference caused 9.90 percent of the delay. These top three causes contribute to 78.17 percent of the overall Amtrak delay. In general, the delay profile for 2008 was the same as for 2005. However, there were significant differences in the first half of 2009 as freight train interference delays were reduced by almost 50 percent and overall delay minutes were reduced by 33 percent.
The study identified eight rail improvements which could help to further reduce Amtrak delays. Figure 24 illustrates the location of these improvements relative to the amount of Amtrak delay on the rail line. The study established a performance baseline of a full double track route from St. Louis to Kansas City is double track (implying the Sedalia subdivision is improved by double tracking it, and both the Gasconade and Osage bridges are double track). These eight rail projects had a significantly reduced the amount of delay minutes incurred by passenger trains. These improvement projects include:
1. Knob Noster Passing Siding Extension – $8,500,000. Extends the existing siding to 9,000 feet and breaks up a 27 mile segment with no usable siding.
2. Webster Universal Crossover - $4,400,000. Increases ability to sort freight and passenger trains into and out of St. Louis Area.
3. Osage River Bridge - $33,800,000. Uses new steel for bridge. Removes the last remaining one-track segment between St. Louis and Jefferson City.
4. Combination of Projects 2 and 3 - $38,200,000.
5. Combination of Projects 1, 2 and 3 - $46,700,000.
6. Build Passing Siding at Kingsville - $11,550,000. Builds a new 9,000-foot siding to the east of Kingsville. Breaks up a 25-mile segment with no passing siding.
19 http://library.modot.mo.gov/RDT/reports/Rd09049/or10004.pdf
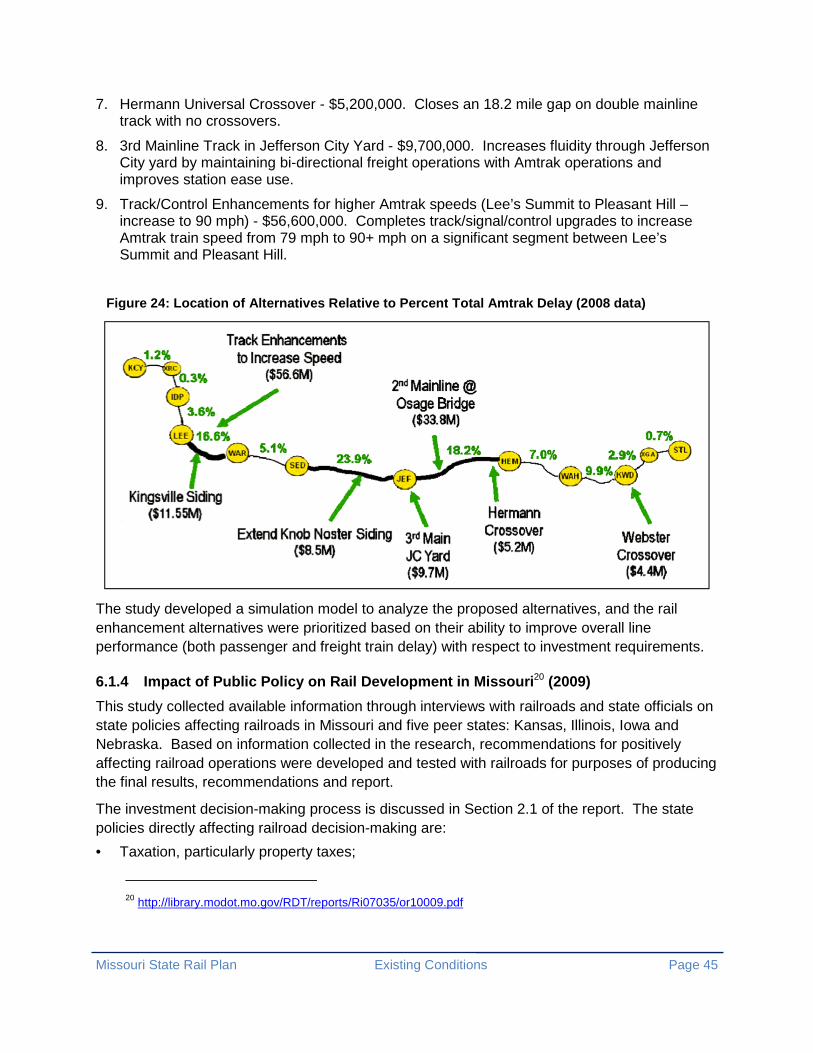
Missouri State Rail Plan Existing Conditions Page 45
7. Hermann Universal Crossover - $5,200,000. Closes an 18.2 mile gap on double mainline track with no crossovers.
8. 3rd Mainline Track in Jefferson City Yard - $9,700,000. Increases fluidity through Jefferson City yard by maintaining bi-directional freight operations with Amtrak operations and improves station ease use.
9. Track/Control Enhancements for higher Amtrak speeds (Lee’s Summit to Pleasant Hill – increase to 90 mph) - $56,600,000. Completes track/signal/control upgrades to increase Amtrak train speed from 79 mph to 90+ mph on a significant segment between Lee’s Summit and Pleasant Hill.
The study developed a simulation model to analyze the proposed alternatives, and the rail enhancement alternatives were prioritized based on their ability to improve overall line performance (both passenger and freight train delay) with respect to investment requirements.
6.1.4 Impact of Public Policy on Rail Development i n Missouri 20 (2009)
This study collected available information through interviews with railroads and state officials on state policies affecting railroads in Missouri and five peer states: Kansas, Illinois, Iowa and Nebraska. Based on information collected in the research, recommendations for positively affecting railroad operations were developed and tested with railroads for purposes of producing the final results, recommendations and report.
The investment decision-making process is discussed in Section 2.1 of the report. The state policies directly affecting railroad decision-making are:
• Taxation, particularly property taxes;
20 http://library.modot.mo.gov/RDT/reports/Ri07035/or10009.pdf
Figure 24: Location of Alternatives Relative to Percent Total Amtrak Delay ( 2008 data)

Missouri State Rail Plan Existing Conditions Page 46
• Highway-rail grade crossing programs;
• Rail safety enforcement; and
• Economic incentives for railroad investments.
Section 2.2 summarizes program information for Missouri and its peer states of Arkansas, Kansas, Illinois, Iowa and Nebraska. Findings from peer-state review indicate:
• Missouri state property tax policies are similar to peer states and do not adversely affect railroad projects;
• Other states have additional state resources applied to highway-rail grade crossings, stretching public and private resources; and
• Missouri has a strong state rail safety program.
Section 3.0 of the report outlines a series of national rail policy issues which can affect railroad development in Missouri, including:
• Logistics and Business Practices:
o Logistics – Current and future methods for moving freight by rail in Missouri
o Equipment – Trends in rail car purchasing and replacement
o Environment – Federal regulations affecting railroad operations
• Rail Policy:
o Infrastructure investment policy – Current and proposed federal programs and their effects on freight and passenger investments;
o Rail regulations – Statutory and regulatory constraints involving rail safety, financial and economic activities, and rail security.
Recommendations for consideration for MoDOT after the research study included:
1. Asking the state legislature to make additional appropriations into the MoDOT State Transportation Assistance Revolving Fund (STAR Fund) for the purpose of railroad and other multimodal improvements, perhaps targeted at regional and short-line railroads;
2. Authorizing an investment tax credit for railroad investments related to economic development; and
3. Proposing statutory exemption of all railroad equipment from state sales taxes.
6.1.5. Multimodal Operations Railroad Section 21 (2007)
The Missouri Department of Transportation’s Division of Multimodal Operations-Railroad Section prepared this report for use by the Missouri Highways and Transportation Commission, public authorities and others involved in improving railroad and highway safety efforts. The report contains information received from railroads operating within Missouri, the Missouri State Highway Patrol, the Federal Railroad Administration and data collected by the Railroad Section
21 http://www.modot.mo.gov/othertransportation/rail/documents/2007annualreport.pdf

Missouri State Rail Plan Existing Conditions Page 47
within MoDOT. This data is used by the Railroad Section to help evaluate crossings for possible upgrades and improve the overall transportation network in Missouri.
It also provides the 2008 overall business goals for the division in the areas of safety efforts, track inspections, grade crossing signals, operating practices inspection program, grade crossing upgrade/improvements, funding, Grade Crossing Safety Account, Section 130 Federal Funding, Amtrak service, coordination of highway construction projects with railroad involvement and the light rail safety oversight program.
6.1.6 Missouri Freight Transportation, Rail Freight 22 (2008)
This report addresses existing railroad conditions in 2008, examines rail as an economic driver and provides information on commodity flows in Missouri. The information provided, among other things, information about: trends in rail shipments between 2002 and 2007; shipment by weight; shipment by distance; Missouri’s rail shipments to other states; and Missouri’s rail shipments from other states.
6.1.7 Missouri Freight and Passenger Rail Capacity Analysis Phase 1 23 (2007)
The Phase 1 Capacity Analysis Report developed a prioritized list of rail enhancements, addressing current passenger and freight rail performance on the Union Pacific line between St. Louis and Kansas City in order to improve on-time passenger service and reduce freight delays. In this study, the key analysis issue is passenger and freight operations delays encountered respectively by Amtrak and Union Pacific.
The study used the following approach to identify capacity issues and potential solutions:
• The St. Louis-Kansas City UP rail line was assessed using the Theory of Constraints to determine key capacity restrictions and congestion factors.
• A simulation model was developed to examine candidate improvement alternatives.
• A set of rail enhancement alternatives were developed.
• Alternatives were analyzed and prioritized with respect to system performance improvement and capital investment requirements.
The study identified the following problem areas:
• High-level train loads, both from quantity and weight of trains to be a core problem.
• The corridor is handling 50-60 trains per day, which is the upper limit of capacity for a double-track line.
• From a train-weight perspective, this corridor handles a large percentage (50 percent) of heavy coal trains.
• This core problem has given rise to the following issues impacting the overall level of delay on the corridor.
22 http://www.missourieconomy.org/pdfs/rail.pdf 23 http://www.modot.mo.gov/newsandinfo/documents/MORailFinalReportJul07.pdf
Missouri State Rail Plan Existing Conditions Page 48
o Geographic Conditions – The double track in the Jefferson City Subdivision follows the Missouri River. The sub-grade of this line requires a substantial amount of maintenance in order to handle the heavy axle loads of a full coal train. Prior to maintenance there are an increased number of slow orders. During major maintenance activities all train traffic is affected due to reduced hours of operation.
o Maintenance Processes – As a result of the geographic conditions and the high train load level on the corridor, the task of scheduling both routine and major maintenance windows is significant. This is further complicated when combined with the scheduling of signal and track inspections.
o Crew Scheduling – Increased train load increases the crew scheduling task complexity and has the potential to increase corridor congestion when crews exceed their 12 hours of allowed service and become "dead on hours" before reaching their crew change locations.
o Amtrak Dispatching Priority – Increased freight load within a high maintenance and partially single track (with limited sidings) rail corridor makes it increasingly difficult to provide passenger train priority.
o An analysis of the 2005 Amtrak Delay Reports reveals the majority of train delay is caused by freight train interference (53.38 percent), temporary speed restrictions (15.09 percent), and passenger train interference (9.7 percent).
Examining the simulation results revealed two major trends:
• The Sedalia Subdivision alternatives provide more relative benefit with respect to reducing overall delay for Amtrak passenger trains (average benefit of Sedalia subdivision alternatives for Amtrak is 14.4 percent vs. 6.8 percent for UP), and
• The Jefferson City Subdivision alternatives provide more relative benefit for UP freight trains (average benefit of Jefferson City Subdivision alternatives for UP is 20.9 percent versus 5.0 percent for Amtrak).
Recommendations:
• Alternative S1 - Extend California Siding - option 2; Estimated cost = $4 million
• Alternative S3 - Connect Strasburg and Pleasant Hill Sidings; Estimated cost = $10.5 million
• Alternative J1 - 2nd Mainline on Osage Bridge; Estimated cost = $15-28 million
Current UP maintenance processes warrant further analysis as they could provide reduction in overall passenger train delay performance without significant investment. Therefore, it is recommended the scheduling of routine and major maintenance windows, and the scheduling of signal and track inspections, be further analyzed with respect to overall system delay performance.
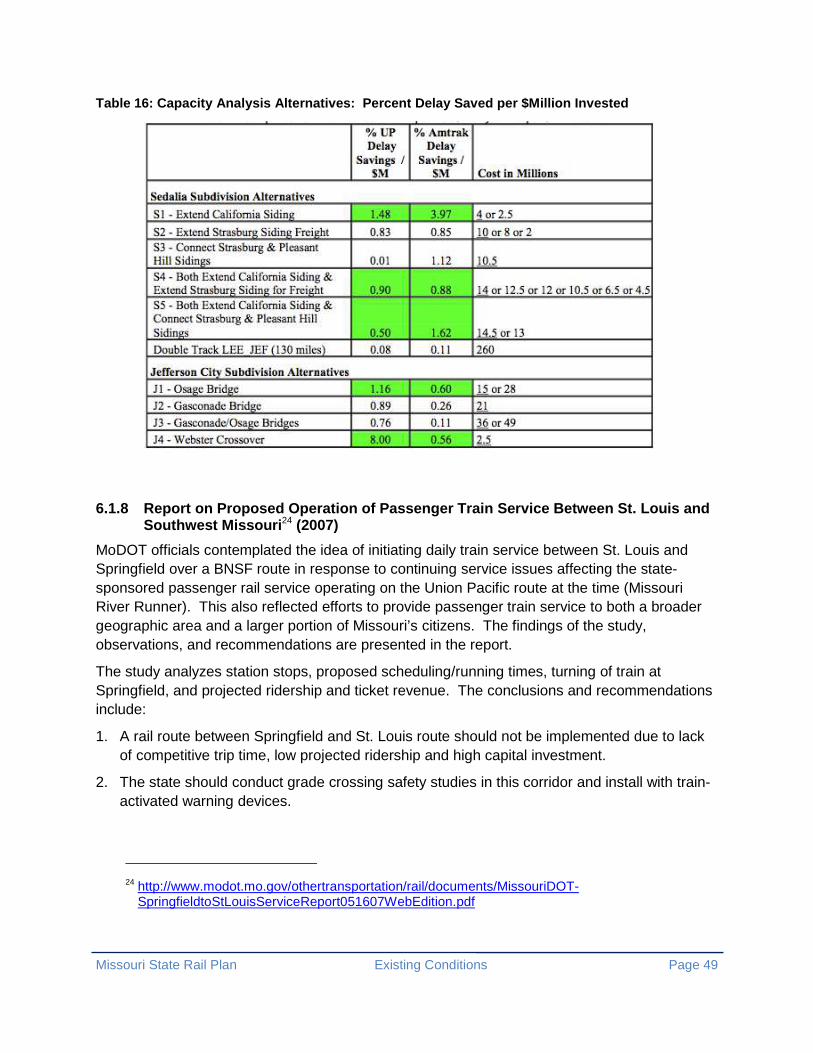
Missouri State Rail Plan Existing Conditions Page 49
Table 16: Capacity Analysis Alternatives: Percent Delay Saved per $Million Invested
6.1.8 Report on Proposed Operation of Passenger Tra in Service Between St. Louis and Southwest Missouri 24 (2007)
MoDOT officials contemplated the idea of initiating daily train service between St. Louis and Springfield over a BNSF route in response to continuing service issues affecting the state-sponsored passenger rail service operating on the Union Pacific route at the time (Missouri River Runner). This also reflected efforts to provide passenger train service to both a broader geographic area and a larger portion of Missouri’s citizens. The findings of the study, observations, and recommendations are presented in the report.
The study analyzes station stops, proposed scheduling/running times, turning of train at Springfield, and projected ridership and ticket revenue. The conclusions and recommendations include:
1. A rail route between Springfield and St. Louis route should not be implemented due to lack of competitive trip time, low projected ridership and high capital investment.
2. The state should conduct grade crossing safety studies in this corridor and install with train-activated warning devices.
24 http://www.modot.mo.gov/othertransportation/rail/documents/MissouriDOT-
SpringfieldtoStLouisServiceReport051607WebEdition.pdf

Missouri State Rail Plan Existing Conditions Page 50
3. The calculated travel time between Springfield and St. Louis is approximately 6 hours primarily due to curvature on the route. Significant improvements to the rail line will be required for passenger rail to run at competitive speeds.
4. Capital investments will also be required to construct platforms, shelters, and station buildings.
6.1.9 Capacity of Missouri Railroads 25 (2007)
Missouri plays an important role in the overall railroad transportation system of the United States as an agriculture and industrial state. The report analyzes the freight capacity on major freight lines in Missouri as well as the feasibility of railroad expansion on several inactive and abandoned lines in the state.
The study concludes traffic on freight lines in Missouri continues to increase while capacity on the lines decreases. The need for expansion and added infrastructure is warranted, but the use of inactive railroad lines is not justified.
6.1.10 Missouri’s Long-Range Transportation Plan 26 (2007)
Missouri Advance Planning (MAP) is the long-range transportation planning initiative of MoDOT.
The report characterizes Missouri’s current transportation systems and evaluates each mode drawing unique characteristics and challenges when looking 20 years into the future. An overview of the Transportation Trends and Conditions demonstrates: • Demands on the transportation system are changing; • Missouri’s transportation infrastructure is aging; • Increasing trade means more trucks on Missouri’s highways; • Missouri’s population is aging; and • Transportation revenues are inadequate to meet customer expectations, and project costs
are simultaneously increasing.
The stakeholder interview analysis revealed: • A majority of stakeholders feel current distribution of funds between rural and urban regions
are satisfactory; • Stakeholders are concerned about long term plans but want to address the shorter term
transportation issues first; and • Stakeholders were satisfied with MoDOT’s effort to involve the public in decision making
and also felt MoDOT should concentrate on efficient and uninterrupted traffic flow, projects advancing economic development opportunities, having smooth and unrestricted roads and bridges, and having a safe transportation system.
25 MoDOT Archive 26 http://www.modot.mo.gov/plansandprojects/documents/Map_000.pdf

Missouri State Rail Plan Existing Conditions Page 51
Regarding freight rail, MoDOT’s investment in the state’s rail system is limited to addressing rails intersecting state maintained highways. The statewide freight study made five recommendations, one of which suggested strengthening intermodal connections. This is also an expectation Missourians shared during the MAP process.
The passenger rail effort is an on-going effort to develop, improve, and expand the rail system in the Midwest. The service provides a new transportation option in the congested rail corridors, a time saving service for short to medium distance trips, and a transportation system for individuals who do not or cannot drive a motor vehicle.
6.1.11 Missouri Statewide Freight Study 27 (2005)
The study’s stated purpose is: “to study the movement of freight through all modes of Missouri’s transportation system in an effort to improve efficiency and safety throughout the system. This study will inventory the existing system, identify key components and needs, and identify current trends to forecast future needs. The study will serve as a starting point for developing a working model of Missouri’s freight transportation system.”
The five discrete tasks included in the study were:
• Inventory Existing Freight Facilities and Assets
• Analyze Current and Projected Commodity Flows
• Collect Industry/User Input
• Report Economic Impact/ Benefits of Intermodal Freight Activity
• Analyze Regional Advantages/Liabilities/Opportunities
The report provides a comprehensive study of all the freight transportation modes in Missouri and identifies the existing freight rail network in Missouri based on information obtained by FRA for the year 2001 from the STB’s 2001 Carload Waybill Sample. It also includes data regarding existing freight traffic in all the modes and the distribution of freight through these modes. Several exhibits of transportation modes are also presented because of their importance for a system’s perspective study.
6.1.12 Applications Submitted by MoDOT to FRA to S ecure Additional Stimulus Funding 28 (2011)
The following reports are the applications for FRA HSIPR FY 2011 Project funding for corridor projects filed by MoDOT on April 4, 2011 with the Federal Railroad Administration. These reports contain project readiness, transportation benefits, public benefits, project delivery approach, and sustainability of benefits information of the individual projects. They also contain current and future capacity projections of individual projects and the financial support requested by MoDOT from federal funds.
27 ftp://library.modot.mo.gov/lrteam/Freight/TechMemo1/TechMemo1_final.pdf 28 http://modot.mo.gov/othertransportation/rail/HighSpeedIntercityInfo.htm
Missouri State Rail Plan Existing Conditions Page 52
1. New Rail Cars (Approved). The purpose of this project is to purchase next generation pooled equipment to replace Amtrak owned equipment. This is a pooled procurement by four Midwestern states and includes rail cars for the following routes:
• Illinois: Chicago to Carbondale, Chicago to Quincy, Illinois, and one proposed service corridor (Chicago to Dubuque, Iowa).
• Michigan: Blue Water (Chicago to Port Huron, Michigan), Pere Marquette (Chicago to Grand Rapids), Wolverine (Chicago to Pontiac, Michigan).
• Missouri: River Runner (St. Louis to Kansas City)
• Wisconsin: Hiawatha (Chicago to Milwaukee, Wisconsin)
2. Bonnots Mill Crossover (Approved). This project is critically linked to the Osage River bridge project, and the overall goal of the project is to make the bridge a seamless entry into the Jefferson City area. This project will construct a universal crossover at Bonnots Mill and allow trains to cross from track to track in either direction. This project will improve on-time performance along the entire Union Pacific corridor in Missouri between St. Louis and Kansas City and will enhance the future provision of 90 mph to 110 mph service.
3. Knob Noster Siding (Approved). This project will improve the on-time performance along the entire Union Pacific corridor between St. Louis and Kansas City and will also enhance the future provision of 90 to 110 mph service. This project will extend an existing siding to a full 9,000 feet, which will allow freight and Amtrak trains to pass each other. The overall purpose of this project is to reduce Amtrak delays.
4. St. Louis Terminal Merchant’s Bridge (West Approach Approved). This project would replace the Merchant’s Bridge on the existing St. Louis to Chicago Amtrak corridor. The bridge was built in the 1890s and is in need of replacement. If it is not replaced, extreme measures of maintenance will be required to keep it in operational condition. There are currently two bridges used by Amtrak into St. Louis – the McArthur Bridge, which is the main artery used by Amtrak for its Chicago to St. Louis route (approximately 80 percent of the time currently) and this bridge, which is used as an alternate route. The overall plan for Chicago to St. Louis Amtrak routes will increase the number of trains using this bridge as train speeds increase and more frequencies are eventually added
5. Kansas City Terminal – Independence St. Bridge Replacement. The Kansas City Terminal’s (KCT’s) Independence Avenue rail bridge is part of two current Amtrak routes (Missouri River Runner and Southwest Chief) with six passenger trains daily and is expected to be a part of the future Kansas City to St. Louis high-speed passenger route. It is also a component of a significant east-west intercontinental rail freight network vital to the U.S. economy, national defense and emergency preparedness. The roadway clearance under the bridge is just 12 feet, and trucks traveling to Independence Avenue frequently strike the rail bridge, compromising its integrity. The proposed bridge replacement will provide approximately 100 years more useful bridge life, and will allow rail capacity expansion for future high-speed passenger service with the addition of a fourth main track and increase roadway vertical clearance of 15 feet.
Missouri State Rail Plan Existing Conditions Page 53
6. St. Louis Terminal – North Market Street to Biddle (Approved). The work includes construction of approximately 7, 800 feet of new track from the control point of North Market to the new control point at Biddle Street and associated new switches and signaling. Track work includes the installation of new full-depth rudder crossing panels at each of the seven highway grade crossings. Signal work includes installation of new train detection equipment, signal cable, and relocation of existing flashing light signals/gates to accommodate the installation of the new second main track.
7. Herrmann Crossover (Approved). This project will construct a universal crossover near Hermann and will allow trains to cross from track to track in either direction. This project will most greatly impact the current bottlenecks in the area; however, it will have an even greater impact on the route’s future.
8. Jefferson City 3rd Mainline. This project will increase fluidity through Jefferson City by maintaining two main lines for bi-directional freight trains when Amtrak is stopped at the Jefferson City station. This will extend the track number one by 1,400 feet and will essentially create a third main line, allowing Amtrak to easily access the Jefferson City station.
9. Lee’s Summit to Pleasant Hill (Approved). This project will connect two existing sidings between Lee’s Summit and Pleasant Hill in Jackson and Cass counties. It will also lay a second track next to the main line track to accommodate Amtrak trains operating at speeds up to 90 m.p.h.
10. Strasburg Grade Separation (Approved). This project will remove an at-grade state Route E crossing from the existing siding and main track in Strasburg in Cass County, and replace it with a grade separation approximately 0.1 mile to the west. MoDOT will purchase the right of way needed for the grade separation.
11. Jefferson City Station. The new station will be a new front door for Missouri’s capital city. The new station will be fully accessible to the disabled and able to handle student groups, both of which are now difficult to host in the current small station.
12. Pleasant Hill to Jefferson City. This project will connect two populous communities of Lee’s Summit and Pleasant Hill in Jackson and Cass counties with Jefferson City. It will also lay a second track next to the main line track to accommodate Amtrak trains operating at speeds up to 90 mph.
13. Kingsville Passing Siding (Approved). This project will construct a third siding in the Kingsville area and will complement two other sidings scheduled to be built on this same subdivision near California and Knob Noster. This 9,200 foot siding extension will be used mostly by directional freight trains.
14. New High Speed Corridor. This project will address the corridor feasibility and right of way procurement for a new high-speed dedicated corridor between Kansas City and St. Louis, which has been designated as capable of supporting operations of a 110 mph high-speed rail corridor and as a link in a critical network of the Obama Administration’s “High-Speed Rail in America” initiative. From the time the Federal Railroad Administration (FRA) approved the extension of the Chicago Hub corridor across Missouri and its inclusion as a

Missouri State Rail Plan Existing Conditions Page 54
key component in the Midwest Regional Rail System, there has been a flurry of planning activity to prepare the corridor concept for Phase Three: Preliminary Engineering (PE) and for satisfaction of the National Environmental and Protection Act (NEPA) requirements. Currently, the basic planning and development phases are complete and Phase Three is needed to address the most appropriate and feasible route for the corridor. Phase Four: Procurement of Right of Way along the appropriately selected corridor is also included in this application. Anticipated costs for a significant portion of Right of Way are $500 million.
6.2 Regional and Local Plans and Studies
6.2.1 Regional Transportation Plan 2040 29 (2011)
The Regional Transportation Plan (RTP) 2040 is the St. Louis region’s long-range transportation plan. The organization looked for ways to expand the range of issues framing the structure and scope of this document. Issues such as economic development, ecological principles and public involvement have been incorporated into the direction transportation investments will take over the course of the long-range plan.
The transportation investment plan establishes the region’s financial constraint, or its capacity to finance transportation improvements, involved projecting future revenues from federal, state, and local sources and then comparing those revenue streams to anticipated costs. Two assumptions were common to the modified financial projection of each agency. First, there would be a modest annual increase in federal funds throughout the planning period. Second, capital costs would inflate by three percent annually. It is anticipated regional transportation revenues will exceed $31 billion through 2040.
This document continues this effort by displaying the RTP 2040 in a visually accessible way for the general public to understand. These sections include:
• Principles and Strategies
o Support Public Transportation
o Provide More Transportation Choices
o Strengthen Intermodal Connections
• Planning Framework
• Assessment of Economic and Demographic Trends
• Financial Capacity Analysis
• Project Priorities and Corridor Improvements
• Air Quality Conformity
29 http://www.ewgateway.org/pdffiles/library/trans/rtp2040/lrtp2040.pdf
Missouri State Rail Plan Existing Conditions Page 55
Metro (the Metropolitan St. Louis Transit Agency):
• Metro’s baseline financial projection indicates the agency’s revenues will fall short of what is needed to sustain its current system.
• Last year’s voter approval of Proposition A imposed a 0.5 percent transit sales tax in St. Louis County.
• St. Louis County would place no restrictions on Metro’s use of Proposition A funds. Thus, funds could be used for capital or operating expenses as dictated by the system’s needs.
• An additional 0.25 percent sales tax would pass in the city of St. Louis. This increase would equalize the transit tax rate in the city and county.
• Metro will have an estimated $16.2 billion in capital and operating funds through 2040.
• The amount is adequate to maintain the current transit system, but is insufficient to pursue the bus rapid transit or light rail projects envisioned in the agency’s long-range plan.
• Metro will require an additional $50 million a year (escalating by inflation) in Missouri-based funding.
• MoDOT’s baseline financial projection indicates revenues below what is needed to adequately maintain its existing road and bridge system.
• Metro is anticipated to have insufficient state revenue support after 2016 to fully match federal funds.
• MoDOT’s future financial capacity was based on an assumption the state would always have sufficient revenues to match all federal transportation funds.
• Under this scenario, MoDOT willhave $7 billion available for projects in the region.
o $5.1 billion will be used for system preservation and operations
o $1.9 billion for major projects
• The 53 MoDOT projects proposed for plan inclusion cost almost $3.3 billion.
6.2.2 Regional Transit Implementation Plan – Commut er Corridors 30 (2010)
The Mid-America Regional Council (MARC), the Metropolitan Planning Organization for the bi-state Kansas City metro area, performed a number of studies exploring the possibility of rail transit in the Kansas City metropolitan area, including the Commuter Rail Feasibility Study, the I-35 Fixed Guideway Corridor Study and the I-70 Corridor Alternatives Analysis.
While none of these studies concluded the prospect for rail transit should be abandoned, neither did they conclude rail transit should be pursued immediately. In fact, along the I-35 south corridor in Johnson County, Kansas, the Alternatives Analysis selected Bus-on-Shoulder as the Locally Preferred Alternative (LPA). Even though the subject of rail transit has been previously studied, there are a number of reasons why it should be revisited:
30 http://www.kcsmartmoves.org/pdf/Implementation_CommuterCorridors_DRAFTREPORT_10-26-10.pdf
Missouri State Rail Plan Existing Conditions Page 56
• The Commuter Rail Feasibility Study (2002) limited the potential rail corridors to rail currently carrying freight traffic, several of which carry high volumes of freight.
• The 2002 study did not review dormant and abandoned lines, which could be utilized for transit without any conflict with freight traffic.
• The I-35 and I-70 studies looked at these two corridors in isolation with an emphasis on transit for commuters living in the suburbs and working in downtown Kansas City, Missouri. While this traditional commute is still prevalent, it by no means addresses the majority of commute patterns existing today.
• The Federal Transit Administration (FTA), a major potential funding source for a commuter rail system, is changing its criteria for its New Starts program. Mobility improvements and cost effectiveness had been the primary criteria used in the past and, accordingly, had been the focus of previous studies.
The goal of the new criteria is to promote more livable and sustainable communities. The urban and commuter services concept provides the opportunity for an integrated transit system. There is potential synergy between commuter services coming to a central hub and a complimentary downtown distribution service.
The Phase 2 Commuter Corridors report addresses the physical, operational and ownership components necessary to develop a commuter rail system in the Kansas City metropolitan area. In corridors where rail operations are deemed feasible, this report sets forth strategies for additional review of potential corridors and their initial system set up. The FTA New Starts program is a potential funding source for a commuter rail system. A new emphasis for these grants from the FTA includes economic development opportunities and environmental benefits. Finally, this report develops an implementation plan for the pursuit of commuter options along the various Commuter Corridors as defined by Smart Moves.
6.2.3 Northside Southside Study – Planning Transit Improvements for St. Louis City 31 (2008)
The city of St. Louis averaged a 12-percent decline in population between 1990 and 2000. Similar to other cities experiencing population decline within their urban cores, St. Louis has a disproportionate number of residents in poverty, a higher minority population and more zero- and one-car households. As a result, St. Louis City residents are typically more transit-dependent. Public transit needs in the city are served by Metro, which operates MetroBus and MetroLink. Implementation of additional Light Rail Transit (LRT) would serve the city’s transit-dependent population, as well as better connect city and county residents to the area’s employment and cultural centers. This report assesses the validity and feasibility of potential LRT alignment alternatives.
The goals and objectives of this alternative analysis were created to help guide the development and evaluation of alignment alternatives. Goals include enhancement of neighborhoods and
31 http://www.ewgateway.org/pdffiles/library/trans/metrolink/northsidesouthsidestudy-finalrpt-northside.pdf

Missouri State Rail Plan Existing Conditions Page 57
local sustainable development, preservation of existing communities and neighborhoods, improvement of access to opportunity within the study area, and development of cost-effective transportation improvements.
The study’s evaluation process built upon the assessment and screening methodology of the prior Major Transportation Investment Analyses (MTIA) and anticipates the requirements of subsequent decision-making at both regional and federal levels. The Federal Transit Administration requires alignment alternatives to be evaluated based on effectiveness, impact, cost-effectiveness, financial feasibility, and equity. It is anticipated federal funding would be used in the implementation of any transit improvement recommended by this study. As a result, these FTA requirements form the foundation for evaluation and screening. Assessment in this report is also informed by the prior MTIA evaluation framework, focus areas identified in East- West Gateway Council of Government’s (EWGCOG) Legacy 2030, problem evaluation contained in the study’s purpose and need statement, and extensive community engagement.
The East-West Gateway Council of Government’s approach to regional transportation planning and decision-making in the metropolitan St. Louis area is defined in its March 2005 plan, Legacy 2030: The Transportation Plan for the Gateway Region. Legacy 2030 is an update of previous regional plans, and it provides a guide for investing public funds through 2030. The plan re-emphasizes six focus areas serving as the evaluative framework for identifying and defining problems, developing and evaluating options, and selecting preferred alternatives in long- and short-range transportation planning studies. These focus areas also are used by EWGCOG to establish priorities in selecting projects for programming in the Transportation Improvement Program (TIP), and they provide reference points to ensure consistency in EWGCOG’s planning programs. Regional transportation goals and objectives are a foundation for the development of goals and objectives for the Northside study, but were evaluated as part of the study.
The six focus areas include:
1. Preservation of existing infrastructure
2. Safety and security in travel
3. Congestion
4. Access to opportunity
5. Sustainable development
6. Efficient movement of goods
The core objectives identified in the study are:
• Improve Efficiencies of Public Investment. Reduce environmental impact of the
transportation system; minimize the need for new, costly infrastructure investment; and improve access to jobs, services, and centers of trade.
• Support Individual Choices. Provide residents with choices in homes, schools, jobs,
recreation, and transportation within safe, quality cities, towns, and neighborhoods, creating a basis for equality of opportunities throughout the region.

Missouri State Rail Plan Existing Conditions Page 58
• Strengthen Communities. Nurture interaction, involvement, and responsibility, and provide
opportunities for citizens to come together informally in a safe, strong, stable, and healthy community of place.
6.2.4 Kansas City Region Commuter Rail Study – Impl ementation Strategy 32 (2002)
The purpose of this report is to build on the analysis conducted in prior studies, especially the Detailed Corridor Analysis, by prioritizing service implementation in various corridors and by charting actions to maintain the commuter rail option until the time is right, and lead to service implementation when the decision is made to proceed.
The study recommends prioritization and/or phased development of feasible corridors based on MARC's strategic goals and regional policies, as well as upon FTA New Starts Criteria and coordination with FTA. Specifically, the consultant team believes the following factors should be considered in developing a recommended corridor prioritization:
• Ridership
• Operating cost per corridor or per rider
• Capital cost per corridor or per rider
• New starts criteria data to the extent available
• Qualitative consideration of land use
• Consideration of MARC's strategic goals
The study recommends MARC and the region take the following steps to maintain passenger rail service as a viable future transportation option:
• Planning steps
• Railroad coordination
• Right-of-way preservation
In the future, the region will opt to implement commuter rail service. The following steps chart the path from study to start up:
• Feasibility planning (The Current Step: The 2002 Commuter Rail Study)
• Major corridor study
• Decision regarding implementation (funding and governance)
• Railroad negotiations preliminary engineering (PE) and environmental assessment (EA)
• Final engineering/design, construction and equipment acquisition
• Testing of equipment and training of staff
• Revenue operation
32 http://www.marc.org/transportation/commuterrail/pdf/Implementation.pdf

Missouri State Rail Plan Existing Conditions Page 59
The study presents the eight implementation factors listed below and, where applicable, makes specific recommendations:
• Financial planning
• Inter-jurisdictional service issues
• Recommended institutional arrangements
• Infrastructure/structural changes required
• Equipment options
• Coordination with freight rail service
• Modification to the multimodal feeder/distribution system
• Land use policies and possible zoning changes
6.2.5 Kansas City Region Commuter Rail Study – Deta iled Assessment of Feasible Corridors 33 (2001)
This study is part of the second phase of Regional Commuter Rail Feasibility Study. The major corridors identified in Phase 1 were:
• Corridor D – Odessa-Kansas City
• Corridor E – Warrensburg-Pleasant Hill-Kansas City
• Corridor H – Topeka-Lawrence-Kansas City
The second phase study involves detailed assessment of these feasible corridors based on identifying:
• Station locations
• Land use
• Feeder/distribution system
• Service plan
• Passenger equipment
• Layover facilities
• Track
• Rail/highway grade crossings
• Freight impact
• Infrastructure improvements
• Capacity improvements
• Capital cost estimates
• Operating costs and subsidy requirements
33 http://www.marc.org/transportation/commuterrail/pdf/Assessment1.pdf

Missouri State Rail Plan Existing Conditions Page 60
6.2.6 Kansas City Regional Commuter Rail Study: Ini tial Corridor Screening Part 1 & Part 2 34 (2001)
This report represents the first step in evaluating commuter rail’s potential role in the greater Kansas City region over a 20-year planning horizon. The study was sponsored by MARC and performed by a consultant team led by R.L. Banks & Associates, Inc. The study’s purpose determined whether existing rail corridors or rights of way could effectively serve the region’s needs, and identifies strategies to assess commuter rail feasibility and development and implementation steps, if warranted.
The Regional Commuter Study was divided in two phases, with the first phase addressing the evaluation of all potential corridors in the Kansas City region as to their potential for commuter rail service. In the second phase, the MARC and consultant team conduct a detailed evaluation of two or three corridors with greatest potential. The second phase also discusses a commuter rail implementation strategy for these corridors.
Eight commuter rail corridors containing 19 rail lines radiating from downtown Kansas City were identified. The corridors are analogous to markets and are defined in terms of the geographic area around rail lines from which potential commuter rail passengers might be attracted. Within each corridor, the line deemed to be the best prospect in terms of serving potential ridership generators was used to develop service, ridership and cost projections.
In order to assess ridership and costs, hypothetical commuter rail service was defined in each corridor, and conceptual station locations were identified. Stations, parking, layover and shop facilities and of course equipment comprise the passenger-related improvements necessary to operate commuter rail service. Sample schedules were produced for each corridor based upon running times after recommended track improvements. At least three trains each way daily were projected, the minimum offering riders a reasonable choice and spanning the periods of heaviest commute.
The team developed evaluation measures consistent with the Federal Transit Administration’s New Starts Criteria to the extent possible in a preliminary feasibility study. This approach was carried through the next phase to facilitate decision-making and assist in moving the project to the next stage, if warranted. The most difficult issues identified in the study are track capacity, cost of capacity improvements and the need to reach an agreement with the host railroads.
Operating cost per passenger is sensitive to corridor length as well as ridership. Corridors with more than three trains would achieve some economies of scale not reflected in these estimates. Capital costs increase as ridership rises, primarily due to outlays for locomotives, passenger cars and parking facilities. Capital cost per rider is more appropriate for making comparisons, although fiscal realities necessitate attention to the total figure as well.
34 http://www.marc.org/transportation/commuterrail/pdf/Screening1.pdf http://www.marc.org/transportation/commuterrail/pdf/Screening2.pdf http://www.marc.org/transportation/commuterrail/pdf/ScreeningAppA.pdf http://www.marc.org/transportation/commuterrail/pdf/ScreeningAppB.pdf

Missouri State Rail Plan Existing Conditions Page 61
6.3 Multi-State Studies and Reports
6.3.1 Feasibility Report of Proposed Amtrak Service (Kansas City – Oklahoma City – Fort Worth) 35 (2010)
The Kansas Department of Transportation (KDOT) requested Amtrak to conduct a feasibility study to determine the requirements to provide state sponsored intercity passenger rail service between Kansas City, Oklahoma City and Fort Worth.
Amtrak worked with BNSF railroad personnel to conduct a physical evaluation of portions of the Kansas City – Fort Worth route and assess general infrastructure conditions and capital needs. Also identified during discussions with BNSF were operational challenges on this route. BNSF analyzed the route using Rail Traffic Controller (RTC) computer modeling to determine the impact on existing passenger and freight operations. Revenue/ridership forecasts were determined based on recommended schedules, and estimates of cost to operate the service were also developed. The underlying assumption reflected the fact there was a desire to establish train service in the most expeditious and practical way possible. This study has concentrated on incremental improvements, including the possibility of raising the speeds on some of the route segments. No “high speed” scenarios were considered. The goal was to provide a high-level overview and objective report of the findings to KDOT for their further consideration.
The alternatives analyzed in this study are shown in Table 17 and include:
• Alternative 1: Newton, Kansas – Ft. Worth, Texas. This alternative extends existing Heartland Flyer service daily from Oklahoma City to Newton where it would terminate and connect with the eastbound and westbound Southwest Chief. The Southwest Chief operates daily between Chicago and Los Angeles. The existing Heartland Flyer schedule would be unchanged at stations currently served.
• Alternative 2: Kansas City, Missouri – Ft. Worth, Texas. This alternative extends the existing Heartland Flyer from Oklahoma City to Kansas City, thereby providing a new daily overnight service between Ft. Worth and Kansas City in both directions via Newton. The existing Heartland Flyer schedule would be unchanged at stations currently served.
• Alternative 3: Kansas City, Missouri – Ft. Worth, Texas. This alternative would be a new daily daytime service in both directions between Kansas City and Ft. Worth. It would be a stand-alone service not connecting with either the Southwest Chief or the Heartland Flyer. In this alternative, the existing Heartland Flyer continues to operate on its current schedule and the new train would provide a second daily frequency between Oklahoma City and Ft. Worth.
• Alternative 4: Kansas City, Missouri – Oklahoma Ci ty, Oklahoma. This alternative would be a new daily daytime service in both directions between Kansas City and Oklahoma City. It would be a stand-alone service without a connection to either the Southwest Chief or
35 http://www.ksdot.org/passrail/amtrak.asp

Missouri State Rail Plan Existing Conditions Page 62
the Heartland Flyer. In this alternative, the existing Heartland Flyer continues to operate on its current schedule at stations now served.
Table 17: Kansas City – Oklahoma City – Ft. Worth R oute Alternatives and Cost in 2009 Dollars
6.3.2 Chicago to St. Louis 220 m.p.h. High Speed Ra il Alternative Corridor Study – Volume 1 36 (2009)
In March 2009, the Midwest High Speed Rail Association (MHSRA) conducted a limited alternative corridor feasibility study for a high-speed passenger rail route from Chicago to St. Louis via the Illinois cities of Kankakee, Champaign, Decatur, and Springfield. In August 2009, MHSRA authorized enhancing the project corridor study area by extending it to Chicago’s O’Hare International Airport.
This volume consists of the following elements:
• A comparison of reasonable alternative alignments to the existing Union Pacific corridor between Chicago and St. Louis via Joliet and Springfield and a “fatal flaw” analysis of the proposed corridor via Champaign and Decatur.
• An evaluation of the proposed alignment via Champaign and Decatur examining the suitability of the existing railroad rights of way to support a high-speed rail operation (220 mph maximum speed) with an approximately two-hour schedule between Chicago and St. Louis.
• Development of expected train running times using a railroad operations simulator for the proposed corridor with expected running times for each of the intermediate segments.
36 http://www.midwesthsr.org/sites/default/files/pdf/MHSRA_Chicago_StLouis_HSR_Corridor_Study.pdf

Missouri State Rail Plan Existing Conditions Page 63
• Development of a conceptual level cost estimate for infrastructure improvements between O’Hare and St. Louis to allow for approximately two-hour service between downtown Chicago and St. Louis.
• A phasing plan showing the running time and capital costs for each logical segment.
This study generated the following key findings:
• No other suitable railroad corridor exists between Chicago and St. Louis other than the existing corridor via Joliet and Springfield and the proposed corridor via Champaign and Decatur. The proposed corridor does not contain any “fatal flaws” which would eliminate its use as a high-speed rail passenger line based on dividing the existing railroad rights of way. Any railroad property acquisition would of course be subject to negotiation and, if successful, expected payment of compensation to the owning carrier.
• The proposed corridor via Champaign and Decatur has the alignment and grade to support a 220 mph operating speed, with the addition of complete grade separation and fencing of the right of way. Between Springfield and St. Louis, a route using a combination of existing rail lines, which do not currently have passenger service, could be used instead of the existing Amtrak route (via the Union Pacific Railroad). The existing Amtrak route is constrained by numerous horizontal curves, which limit maximum speeds to approximately 70-90 mph. Additionally, the alternate corridor would provide for a shorter travel distance and a new, more centrally located station stop on the Illinois side of the Mississippi River.
• Simulation runs show express trains using the proposed corridor, stopping only at Champaign and Springfield, could operate between downtown Chicago and downtown St. Louis in 1 hour 52 minutes while operating at least once an hour in each direction. Trains stopping at McCormick Place, Kankakee, Champaign, Decatur, Springfield, and Metro East could complete the run in 2 hours 4 minutes.
• The infrastructure for the high-speed rail passenger line between Chicago O’Hare and St. Louis could be built for a cost of $12.6 billion (in 2012 dollars). This estimate includes the track, bridges, signals, electrification, grade separations, fencing and other civil work, as well as design and construction management fees and a contingency allowance. It does not include rolling stock, maintenance facilities, stations or other program costs.
• Potential phasing of a high-speed rail line from Chicago to St. Louis has been outlined. Segments, costs and running times are shown. If the phasing occurs over an extended period of time, the cost estimate would need to be adjusted for the expected construction costs during the proposed year of construction.

Missouri State Rail Plan Existing Conditions Page 64
6.3.3 Chicago to St. Louis 220 m.p.h. High Speed Ra il Alternative Corridor Study – Volume 2 37 (2009)
This companion to the Infrastructure and Cost Volume, completed earlier in Section 6.3.2., develops key statistics needed to evaluate the feasibility of constructing a high speed line along the corridor identified in Volume 1.
This section develops the basic statistics needed to understand the project and compare it to other similar transportation investments. Funding constraints limited the first phase to a conceptual level undertaking, but with a fully supportable basis for the conclusions.
The study documents:
• A sketch planning exercise to develop a ridership estimate sufficient to complete an initial calculation of project benefits and train fleet requirements needed to meet the estimated demand.
• An economic benefits analysis showing the economic impact of the proposed project.
• An environmental benefits analysis describing the general impacts of the proposed project on the environment along the corridor.
The first section develops a methodology to estimate modal split for high-speed rail ridership and to address potential induced ridership. A proposed fare table was developed to maximize ridership while maintaining positive revenue to operating cost ratio. A train-operating plan was used to develop operating train miles, which can be used to verify rider demand load factors. The summary provides estimated ridership, passenger miles, and other usage statistics.
The second section develops indirect societal benefits for the construction and operation of the high speed line. These savings are combined in the summary and compared to the infrastructure investment.
The third section develops preliminary environmental benefits, primarily air quality at this stage, which can be used to compare transportation investments.
Additional data was developed in Volume 3, which will compile fleet acquisition costs, fleet maintenance, crew costs, power costs, and other operating costs. These were then used to develop a preliminary business plan for potential Train Operating Companies (TOCs) to make proposals for service delivery. Programmatic costs for the development of the line, contract management, and maintenance of way will also be added to complete the plan for the full high-speed rail project.
37 http://www.midwesthsr.org/sites/default/files/pdf/MHSRA_Chicago_StLouis_HSR_Ridership_Study.pdf
Missouri State Rail Plan Existing Conditions Page 65
6.3.4 Midwest Regional Rail System 38 (2004)
The Midwest Regional Rail Initiative (MWRRI) is a cooperative, multi-agency effort began in 1996, involving nine Midwest states (Indiana, Illinois, Iowa, Michigan, Minnesota, Missouri, Nebraska, Ohio, and Wisconsin), as well as the Federal Railroad Administration. This collaboration forges an enhanced partnership between USDOT, FRA and the Midwestern states for planning and providing passenger rail service.
The Midwest Regional Rail System (MWRRS) Plan key elements include:
• Operation of a hub and spoke passenger rail system with Chicago hub (see Figure 25 below)
• Use of 3,000 miles of existing rail rights of way to connect rural, small urban, and major metropolitan areas and operate on eight corridors; connecting 100 cities in the Midwest and connecting 80 percent of the region’s 65 million residents
• Annual projected ridership: 13.6 million passengers
• Serving the ninety percent of the Midwest’s population living within an hour ride of a MWRRI rail station
• Introduction of modern train sets capable of operating at speeds up to 110 mph
• Provision of multi-modal connections to improve system access
• Introduction of a contracted rail operation to improve efficiency and reliability
• The 304 mile Chicago-Pontiac, Michigan Corridor
• Acquisition of 134-miles of the Norfolk Southern Rail Line, as NS has plans to downgrade this segment of the existing corridor to a FRA Class II railroad (25 mph freight and 30-40 mph passenger) unless an alternative agreement is reached
• Use of modern equipment; improved travel times and frequencies; competitive fares to maximize revenue yields; improved accessibility and reliability; and on-board and station amenities
Recommendations for St. Louis to Kansas City Corridor:
• Increase daily round trips between St. Louis and Kansas City from two to six when MWRRS is fully implemented;
• Add feeder bus services to extend the reach of the system to outlying areas;
• Implement MWRRS operating plan proposal for a time reduction of 1 hour and 26 minutes when fully implemented;
• Make corridor capital investments of $980 million (based on 2002 numbers); and
• Make recommended infrastructure improvements such as train control system, highway-railroad grade crossings and passenger stations.
38 http://www.modot.mo.gov/pdf/newsandinfo/railmidwest.pdf

Missouri State Rail Plan Existing Conditions Page 66
The goal of the initiative is to develop a passenger rail system offering business and leisure travelers shorter travel times, additional train frequencies, and connections between urban centers and smaller communities. The MWRRI will increase service and will cut travel time between destinations by 30 to 50 percent. In addition, new equipment with reduced maintenance requirements, an advanced train signaling and control system, and line capacity improvements will help to establish and sustain a high-level of on-time performance.
As a result of faster trip times, more frequent and higher quality on-time service, rail ridership in the routes encompassing the MWRRI will increase greatly. This increase in ridership will help reduce expected growth in automobile congestion on highways and reduce overcrowding and runway delays at regional airports. Other key project benefits include expanded regional mobility, increased attractiveness and popularity of intercity rail service, environmental improvements, derived economic and community benefits, and expanded commercial business opportunities.
Figure 2 5: Midwest Regional Rail System

Missouri State Rail Plan Existing Conditions Page 67
6.4 National Studies and Reports
6.4.1 Final Metrics and Standard for Intercity Pass enger Rail Service 39 (2010)
Section 207 of the Passenger Rail Investment and Improvement Act of 2008 (PRIIA) charged the Federal Railroad Administration and Amtrak jointly, and in consultation with other parties, with developing new or improving existing metrics and minimum standards for measuring the performance and service quality of intercity passenger train operations. In compliance with the statute, the FRA and Amtrak jointly drafted performance metrics and standards for intercity passenger rail service. The goal of this effort is to develop and improve existing metrics and minimum standards for measuring the performance and service quality of intercity passenger train operations, including:
• Cost recovery
• On-time performance/delay
• Ridership
• On-board services
• Stations, facility and equipment
• Operating costs and revenues
• Ridership per train-mile operated
• Measures of on-time performance and delays
• Measures of connectivity with other routes
• Transportation needs of underserved populations
6.4.2 Preliminary National Rail Plan 40 (2009)
The PRIIA directed the Administrator of the Federal Railroad Administration to develop a Preliminary National Rail Plan (PNRP or Preliminary Plan) to address the rail needs of the nation. The PRIIA also directed FRA to provide assistance to states in developing their state rail plans in order to ensure the federal long-range National Rail Plan is consistent with approved state rail plans. Subsequent to PRIIA, the American Recovery and Reinvestment Act of 2009 (Recovery Act) sets the framework for the development of true high-speed rail in the United States. This Preliminary Plan lays the groundwork for developing policies to improve the U.S. transportation system. Its goals are consistent with the top goals of the U.S. DOT: to improve safety, to foster livable communities, to increase the economic competitiveness of the United States, and to promote sustainable transportation.
This Preliminary Plan sets forth the FRA’s proposed approach to developing the long-range National Rail Plan, including goals and objectives for the greater inclusion of rail in the national transportation system. Although this Preliminary Plan does not generally offer specific
39 http://www.fra.dot.gov/downloads/Section_207_Metrics_and_Standards_2010-05-05_Final.pdf 40 http://www.fra.dot.gov/Downloads/RailPlanPrelim10-15.pdf
Missouri State Rail Plan Existing Conditions Page 68
recommendations, it identifies a number of issues the FRA believes should be considered in formulating the National Rail Plan. In short, it is designed to create a springboard for further discussion. The end focus is on the shippers and riders who use the rail system.
Background and Context: The department estimates tonnage on the railroad system will increase by 88 percent through 2035. Currently, there are more than 20 commuter rail systems serving 25 major metropolitan areas. During the 10 years between 1997 and 2007, annual commuter rail ridership increased by 28 percent or by almost 100 million riders. In 2007, these commuter rail systems operated 7,000 route-miles and carried approximately 1.7 million daily riders.
As commuter services grow and as high-speed intercity rail brings more passengers directly into city centers, the importance of easy access to local transit services will increase. The number of rail corridors reaching through metropolitan areas and into the heart of cities , is limited. Another important step in developing the long-range National Rail Plan is developing state rail plans which set policies for freight and passenger rail transportation, establish priorities and implementation strategies to enhance rail service in the public interest, and serve as the basis for federal and state rail investments within the state. State rail plans should use this National Plan as a framework for future development. At the same time, the National Plan must understand previous actions and goals of states and plan accordingly.
Long-term trends demonstrate the growth in intercity and commuter passenger rail services will continue.
Objectives for Rail:
• Increasing Passenger and Freight Rail Performance Will Improve National Transportation System Performance
• Integration of all Transportation Modes: a Complementary Transportation System
• Identify Projects of National Significance
• Provide Increased Public Awareness
National Rail Goals:
• Continue Development of Passenger High-speed Intercity Rail
• Improve Safety
• Improve Fuel Efficiency
• Foster Livable Communities
• Increase the Economic Competitiveness of the United States
• Better Understand and Integrate the Unique Economics of the Rail Industry
• Help Bolster the Domestic Passenger Rail Industry and Create Jobs
Important Considerations for State Rail Programs:
• Appropriateness of strategies of funding freight transportation investments
• Developing ways to assign costs and allocate resources equitably across all modes of freight transportation

Missouri State Rail Plan Existing Conditions Page 69
• Opportunities and greater efficiencies in multimodal transportation
• Identifying areas to continue to improve transportation safety
• Effectively meet defense and emergency transportation requirements
• Balancing the benefits of rail corridor development with local communities and commuter services
• Identify opportunities to improve energy use and the environment
6.4.3 Vision for High Speed Rail in America 41 (2009)
The U.S. Department of Transportation and Federal Railroad Administrations’ vision document provides a general framework for High-Speed Rail throughout America. This vision builds on the planning and construction of highway and aviation systems which transformed the U.S. in the 20th century - fueling unprecedented economic expansion, fostering new communities, and connecting cities, towns and regions. The vision statement identifies major transportation challenges requiring new transportation solutions met with large-scale visions. The document establishes the following strategic transportation goals:
• Ensure safe and efficient transportation choices
• Build a foundation for economic competitiveness
• Promote energy efficiency and environmental quality
• Support interconnected livable communities
The Obama administration is proposing an efficient, high-speed passenger rail network of 100 mile to 600 mile intercity corridors connecting communities across America – focusing on a clean, energy-efficient option. Even today’s modest intercity passenger rail system consumes one-third less energy per passenger-mile than automobiles.
The development of such a system requires a long-term commitment on both federal and state levels. The president has jump-started this process by providing $8 billion in the American Recovery and Reinvestment Act and a high-speed rail grant program.
The vision document identifies the following challenges to implementation:
• Lack of expertise and resources
• State fiscal constraints
• Partnerships with private railroads
• Multi-state partnerships
• Need for high-speed rail safety standards
Beginning in FY 2008, Congress established a new framework for intercity passenger rail development with the passage of four key pieces of legislation:
• The FY 2008 Appropriation Act
41 http://www.fra.dot.gov/downloads/research/finalfra_hsr_strat_plan.pdf
Missouri State Rail Plan Existing Conditions Page 70
• The Rail Safety Improvement Act of 2008 (RSIA).
• The Passenger Rail Investment and Improvement Act of 2008
• The American Recovery and Reinvestment Act of 2009 The Vision for High Speed Rail in America proposes the following funding approach:
• Projects. Provide grants to complete individual projects “ready to go” with preliminary engineering and environmental work completed.
• Corridor programs. Enter into cooperative agreements to develop entire phases or geographic sections of corridor programs with completed corridor plans and environmental documentation, and have a prioritized list of projects to meet the corridor objectives; this approach would involve additional federal oversight and support.
• Planning. Enter into cooperative agreements for planning activities using non-ARRA appropriations funds, in order to create the corridor program and project pipeline needed to fully develop a high-speed rail network.
This Strategic Plan is just the first of several steps intended to further refine and elaborate on this high-speed rail corridor vision – including the program guidance, the president’s detailed FY 2010 budget request, the National Rail Plan called for by Congress, and discussions over upcoming surface transportation legislation. The U.S. DOT intends to seek structured input from stakeholders and the public throughout the process of developing and implementing the strategy.
6.4.4 Financing Freight Improvements 42 (2007)
The FHWA’s Office of Freight Management and Operations and Office of Planning developed this guidebook as a resource for FHWA, states, metropolitan planning organizations (MPOs), and other parties involved in the identification of freight needs and the development of financing plans to fund projects designed to address these needs, as well as agencies involved in the actual delivery of eligible projects. Freight shipment tonnage moved by truck, rail, water, and air increased by 20 percent from 1993 to 2002, and is projected to increase by 65-70 percent by 2020. By 2020, trucks are expected to haul about 75 percent of the tonnage, followed by rail (about 15 percent), water (about 7 percent) and air (less than 1 percent).
Railroads are currently serving record volumes, despite the fact rail miles have continued to decline since their peak in the 1920s. Just a two-year comparison of statistics for the seven Class I railroads operating in the United States shows a decline in rail miles from 97,662 in 2004 to 95,830 in 2005, while tonnage increased from 1.84 billion in 2004 to 1.90 billion in 2005. Volumes in 2006 are up 2.8 percent over 2005 through the first 29 weeks of the year. Railroads have been reducing track through mergers and branch line rationalization in an effort to reduce costs.
Increased volumes are resulting in higher densities on mainlines, which has so far offset traffic lost through the reduction in rail miles. The result is railroads are currently operating at capacity
42 http://ops.fhwa.dot.gov/freight/publications/freightfinancing/freightfinancing.pdf

Missouri State Rail Plan Existing Conditions Page 71
in many parts of the country and have little ability to expand their role in freight transportation to more desirable levels. The AASHTO Freight Rail Bottom Line Report estimates shifting all freight rail to trucks would add 92 billion truck vehicle miles traveled, creating the need for an additional $64 billion in highway improvements over the next 20 years. Clearly, it is in the nation’s interest to keep the rail system operating effectively. Assuming rail maintains its current share of freight movements, annual capital for freight system needs were estimated between $5.3 and $11.2 billion.
Listed below are various financing programs/tools:
Federal-Aid Highway System and Federal-Aid Programs (also known as National Highway System (NHS) and established for roadways of national interest) – States and MPOs use these funds for a wide variety of highway program-related activities including planning, design, environmental studies, construction, reconstruction and improvements on the Federal-aid highway system authorized through legislation enacted by Congress. These include the:
• Federal Highway Funding Programs
• Highway Funding Core Programs
• Special Funding Programs
Other Federal Funding Programs identified in this guidebook include:
• U.S. Army Corps of Engineers (USACE) – Harbor Maintenance Trust Fund - for ports located along federal navigation channels.
• U.S. Department of Commerce – Economic Development Administration (USEDA) Funds - grants for projects in economically distressed industrial sites to promote job creation and/or retention. Eligible freight-related projects include: industrial access roads, port development/expansion, and railroad spurs and sidings.
• U.S. Department of Agriculture (USDA) – Community Facility Program - provides three funding mechanisms to fund construction, enlargement, extension, or improvement of community facilities, providing essential services in rural areas and towns with a population of 20,000 or less.
• U.S. Environmental Protection Agency (EPA) – Brownfield Revitalization Program - provides grants and loans for brownfield site cleanup.
The guidebook provides information on the following Discretionary and Other Programs:
• High-Priority Projects - $14.8 billion under SAFETEA-LU. The High-Priority Projects Program provides designated funding for specific projects identified in SAFETEA-LU, some of which affect freight mobility.
• Transportation Improvement Projects - $2.6 billion under SAFETEA-LU. The Transportation Improvement Projects provision in SAFETEA-LU provides approximately $2.6 billion for 466 earmarked projects designated under Section 1934. Some of these projects are freight-related and/or may affect freight mobility, including funding allocations for major freight corridor projects

Missouri State Rail Plan Existing Conditions Page 72
• Projects of National and Regional Significance - $1.8 billion under SAFETEA-LU. The Projects of National and Regional Significance program provides funding for high-cost projects which are expected to have national and regional benefits, including: 1) improving economic productivity by facilitating international trade; 2) relieving congestion; and 3) improving transportation safety and security by facilitating passenger and freight movement.
• National Corridor Infrastructure Improvement Program - $1.9 billion under SAFETEA-LU. The National Corridor Infrastructure Improvement Program is a discretionary program to provide funding for construction of 33 earmarked projects in highway corridors of national significance to promote economic growth and international or interregional trade, including major freight corridors.
• Freight Intermodal Distribution Grant Program - $30 million under SAFETEA-LU. The Freight Intermodal Distribution Grant Program is a pilot program providing funding for intermodal freight transportation and distribution facilities at inland ports and intermodal freight facilities. Projects are intended to relieve congestion, improve safety, facilitate international trade, and encourage public-private partnerships.
• Ferry Boat Discretionary Program - $285 million under SAFETEA-LU. The Ferry Boat Discretionary Program provides funds for the construction of ferry boats and ferry terminal facilities connecting to the NHS.
Federal financing tools include:
• Loans - a project sponsor borrows federal highway funds directly from a state DOT or the federal government.
• Credit Enhancement - a state DOT or the federal government makes federal funds available on a contingent (or standby) basis. Credit enhancement helps reduce risk to investors and thus allows the project sponsor to borrow at lower interest rates.
• Debt financing through Grant Anticipation Revenue Vehicles (GARVEE) bonds - a state DOT can pledge a share of future federal highway funding toward debt service on a long-term bond issue.
• Special Experimental Project Number 15 (SEP-15) - allows the Secretary of Transportation to waive the requirements and regulations under Title 23 on a case-by-case basis. SEP-15 allows FHWA to experiment in four major areas of project delivery – contracting, right of way acquisition, project finance, and compliance with the NEPA and other environmental requirements.
Other funding tools and sources discussed in the guidebook include:
• User Fees/Tolls - User Fees/Tolls provide a dedicated stream of revenue to repay the loans or bonds issued to support freight investments.
• Dedicated Taxes - Taxes at a state and local level for transportation investments.
• Special Taxing and Assessing Districts - Residents and/or business owners agree to pay additional property taxes which are allocated for specific improvements.
• Equity and In-Kind Contributions - Private sector funding for freight improvements could be in the form of cash or in-kind contributions.
Missouri State Rail Plan Existing Conditions Page 73
• Public Debt - In the case of bonds issued by public entities there are two broad classifications of debt: 1) tax-supported bonds; and 2) revenue bonds. General obligation bonds are backed by the full faith and credit of a state or local government and are usually the highest-rated debt of a state or locality.
• Tax-Exempt Facility Bonds/Private Activity Bonds - Tax-exempt facility bonds have been extensively used to finance port and airport capital projects. SAFETEA-LU amended the IRS code to allow these types of bonds for highway and freight transfer facilities.
• Joint Development - any formal arrangement between a public authority and a private organization (beyond just ports) involving either private sector payments to the public authority, or the private sector sharing project capital costs.
• Public-Private Partnerships for Freight Investments - Public-private partnerships (PPP) refer to contractual agreements formed between a public agency and private sector entity allowing for private sector participation in the delivery of transportation projects.
• Tax Exempt Corporations - The creation of tax-exempt corporations allows for the issuance of debt at lower interest rates, reducing the financing costs of the project.
6.4.5 Vision for the Future – U.S. Intercity Passen ger Rail Network Through 2050 43 (2007)
The Passenger Rail Research Working Group (PRWG) considered the historical role of intercity passenger rail in the United States, looked at today’s passenger rail network, examined the costs and benefits of an expanded system, and developed a cost-estimate for its vision. In addition, the PRWG made federal funding recommendations and suggested a governance structure for program development.
The group used an overlay approach to develop its vision map, consisting of:
• Base layer: Current intercity passenger rail routes;
• Second layer: Federally designated rail corridors;
• Third layer: Corridors in planning or development stages; and
• Final layer: Potential future routes
The vision map provides an estimate of the investment level needed to implement the PRWG’s vision of expanded intercity passenger rail in the United States. The map is illustrative and does not necessarily constitute the exact routes to be included in the passenger rail network by 2050. The PRWG included some of the potential future routes because they are currently under consideration; they added others because they link major urban areas not currently served by intercity passenger rail. The PRWG believes a national passenger rail network requires connections to major population centers, with service to rural areas along the way, much like the Interstate Highway System. Implementation of the PRWG’s vision would ultimately provide passenger rail service to all 48 contiguous states.
43 http://www.miprc.org/Portals/0/pdfs/PRWG_Exec_Summary_Final_112807_V4.pdf
Missouri State Rail Plan Existing Conditions Page 74
The PRWG developed cost estimates for its national intercity passenger rail vision, with estimates segmented as follows:
• 2007-2015 (immediate needs)
• 2016-2030 (mid-term needs)
• 2031-2050 (long-term needs)
The estimates include the costs and timeframes of establishing new service as well as those for upgrading service (higher speeds, more frequencies) and for upgrading the current system to a state of good repair. The estimated costs are reported by time period in the aggregate and as annualized numbers.
Through creation of this model, the PRWG seeks to provide the commission with a better sense of potential national system costs, more so than any other data set developed to date. The model provides a broad perspective and should not be relied upon to provide specific detailed information about any one corridor.
The commission’s vision is to “create the preeminent transportation system in the world.” For the last 50 years, the United States has had no vision for intercity passenger rail. In many areas of the nation, rail lines have been abandoned. The nation’s federal funding policy emphasis has been on the highway and aviation systems, which are now congested. The commission is taking stock of what needs to occur over the next 50 years. The PRWG believes it is time to rebuild a vibrant, intercity national passenger rail network. A balanced transportation system, including passenger rail, is critical for the nation’s future. The PRWG makes five specific recommendations:
1. Identify the national passenger rail network
2. Fund construction of the passenger rail system
3. Implement the passenger rail network
4. Create a national rail strategy
5. Invest in data collection to support multi-modal transportation planning
6.4.6 Railroad Corridor Transportation Plans: A Gui dance Manual 44 (2005)
This manual provides guidance for the planning of new or improved high-speed intercity rail services or systems. The Federal Railroad Administration makes this paper available to suggest the level of analysis and planning necessary to progress a program or project of this type. In the past, the Federal Railroad Administration and Amtrak have collaborated on a number of occasions to prepare a long range-planning document for various rail corridors called master plans or transportation plans. These studies attempt to take into full account the plans of intercity rail passenger service, local commuter rail services, and the rail freight operators over a relatively long period of 20 years. The relatively independent plans of these various operators
44 http://www.fra.dot.gov/Downloads/RRdev/corridor_planning.pdf

Missouri State Rail Plan Existing Conditions Page 75
are synthesized into one long-range plan so many incremental projects planned by each party over this 20-year period will collectively provide the infrastructure to permit the various services to coexist without degrading the various operations.
Proponents of a high-speed rail project also need to consider any federal funding or federal approval of a new or upgraded intercity rail passenger corridor would require preparation of appropriate environmental documentation. Clearances have to be obtained for a project under the requirements of the National Environmental Protection Act and the National Historical Preservation Act, Section 4(f) of the DOT Act of 1966, the Clean Water Act, and others. All these acts require site-specific information (square footage of wetlands to be filled or detailed modifications to be made to an historic building, for instance) in order to prepare the documents and obtain approvals. A clear and complete understanding of all project elements, reached through sound engineering and railroad planning, is needed to complete these documents.
The Federal Railroad Administration has found railroad corridor programs or projects lend themselves to tiered environmental documentation. Since funding design and construction of improvements to railroad corridors generally extends over decades, a programmatic Tier I Environmental Impact Statement (EIS) is usually the appropriate form of documentation. This allows for identification of the full scope of projected improvements or modifications and either full analysis of defined elements or deferral of site-specific clearance of elements to later documentation. Typically, a long-range transportation plan is necessary to identify all project elements and for preparation of the initial environmental document. It is possible the Tier I EIS may categorically exclude work which does not impact environmentally or historically sensitive resources (for example: installing welded rail, replacing ties, installing a new signal system, or reinstalling track on an old roadbed) and may also identify other elements for separate environmental documentation (such as new stations, curve eliminations, new maintenance shops, and so forth). This type of documentation can incorporate by reference many elements of a corridor transportation plan and thus simplify the clearance process.
The balance of this document outlines parameters used and various factors usually requiring analysis and study in preparing a corridor transportation plan. The document further discusses in some detail the analysis usually found to be the most critical to a transportation plan, but it should be emphasized each corridor will most likely have unique conditions or circumstances which will have to be addressed individually. Additional information concerning these studies may be found in Chapter 17 of the American Railway Engineering and Maintenance Association manual of recommended practices.

Missouri State Rail Plan Existing Conditions Page 76
6.5 Federal and State Regulations
6.5.1 Code of Federal Regulations, Title 49, Parts 200 to 29945 (2000s)
The Code of Federal Regulations provides information on rules and regulations relating to transportation and is published by the Federal Railroad Administration, U.S. Department of Transportation. It contains informal and formal rules of practice for passenger service, railroad operating rules and practices, passenger and freight carrier regulations, safety standards for various railroad related equipment, and employee related measures.
6.5.2 Missouri Revised Statutes, Chapter 622, Divis ion of Motor Carrier and Railroad Safety 46 (2010)
This statute provides information on regulations and statutes of railroad corporations in Missouri and it establishes the financial responsibilities of the division. The Motor Carrier Division was abolished in 2002 and these duties were transferred to the Missouri Department of Transportation. (See Section 226.008)
6.5.3 Missouri Revised Statutes, Chapter 680, Trans portation Services 47 (2010)
This statute provides information on State Rail Preservation Act pertaining to duties of the department, financial responsibilities, cooperation with other states, and the Midwest interstate passenger rail compact.
6.5.4 Missouri Revised Statutes, Chapter 389, Regul ation of Railroad Corporations 48 (2010)
This statute provides information on regulation of railroad corporations and describes various functions of the freight railroad and the rules and the regulations to which the railroads must adhere.
6.5.5 Code of State Regulations, State Railroad Re gulations 49 (2010)
The Code of State Regulations provides regulatory enforcement and planning for safety improvements of railroads and street railroads. It includes regulatory information on various subjects such as accidents, signs, transportation of employees, structural clearances, grade crossing safety account, etc.
45U.S. Government Printing Office, http://www.access.gpo.gov/nara/cfr/waisidx_04/49cfrv4_04.html 46 http://www.moga.mo.gov/statutes/chapters/chap622.htm 47 http://www.moga.mo.gov/statutes/c680.htm 48 http://www.moga.mo.gov/statutes/chapters/chap389.htm 49 http://www.sos.mo.gov/adrules/csr/current/4csr/4c265-8.pdf