GOOG Exhibit 99.1 Q4 2015 - abc.xyz · Title: GOOG Exhibit 99.1 Q4 2015 Created Date: 20160211229

EXHIBIT 99.1
News Release
Exxon Mobil Corporation
5959 Las Colinas Boulevard
Irving, TX 75039
972 940 6007 Telephone
972 940 6143 Facsimile
FOR IMMEDIATE RELEASE
FRIDAY, OCTOBER 30, 2020
ExxonMobil Reports Results for Third Quarter 2020
• Third quarter results improved by $400 million from the second quarter, primarily driven by early stages of demand recovery; excluding identified items, results improved by $2.2 billion
• On track to exceed reduction targets for 2020 capital and cash expenses; further reductions anticipated in 2021
• Continued Guyana progress with third major deepwater development approval and two new discoveries
Second
Third Quarter Quarter First Nine Months
2020 2019 2020 2020 2019
Results Summary (Dollars in mill ions, except per share data)
Earnings/(Loss) (U.S. GAAP) (680) 3,170 (1,080) (2,370) 8,650
Earnings/(Loss) Per Common Share
Assuming Dilution (0.15) 0.75 (0.26) (0.55) 2.03
Identified Items Per Common Share
Assuming Dilution 0.03 0.07 0.44 (0.20) 0.19
Earnings/(Loss) Excluding Identified Items
Per Common Share Assuming Dilution (0.18) 0.68 (0.70) (0.35) 1.84
Capital and Exploration Expenditures 4,133 7,719 5,327 16,603 22,688
IRVING, Texas – October 30, 2020 – Exxon Mobil Corporation today announced an estimated third quarter 2020 loss of $680 million, or $0.15 per share assuming dilution. Third quarter capital and exploration expenditures were
$4.1 billion, bringing year-to-date spending to $16.6 billion, more than $6 billion lower than the prior year period.
Oil-equivalent production was 3.7 million barrels per day, up 1 percent from the second quarter of 2020. Production continued to reflect COVID-19 demand impacts, including economic and government mandated curtailments.
Excluding entitlement effects, divestments, and government mandates, liquids production increased 2 percent, while natural gas volumes decreased 1 percent.
“We remain confident in our long-term strategy and the fundamentals of our business, and are taking the necessary actions to preserve value while protecting the balance sheet and dividend,” said Darren W. Woods, chairman and
chief executive officer. “We are on pace to achieve our 2020 cost-reduction targets and are progressing additional savings next year as we manage through this unprecedented down cycle.”

2
The company’s preliminary 2021 capital program, which will be reviewed by the board of directors in the fourth quarter, is expected to be in the range of $16 billion to $19 billion, a reduction from the 2020 target of $23 billion
announced in April. The company expects to identify further structural eff iciencies as it continues previously announced country-by-country reviews.
Third Quarter 2020 Business Highlights Upstream
• Average third quarter realizations for crude oil improved significantly, as market prices increased following the
second quarter's challenging environment. Natural gas realizations declined, primarily due to a lag in crude-linked LNG contract pricing.
• Improved market conditions enabled full recovery of production impacted by economic curtailments. Government mandated curtailments negatively impacted third quarter results and are anticipated to continue in the fourth quarter.
Downstream
• Supply chain optimization, higher product sales due to increased demand, and higher marketing margins more than offset lower industry fuels margins driven by market oversupply and high product inventory levels.
• Third quarter saw the best reliability and process performance in the last 10 years, while average refinery
utilization increased about 6 percent from the second quarter on demand recovery. Refining capacity sparing
decreased to about 25 percent.
Chemical
▪ Chemical sales volumes were higher than second quarter, benefiting from resilient packaging demand and recovering automotive and construction markets. Chemical margins were negatively impacted by higher feed
costs.
▪ The company's Corpus Christi chemical complex joint venture is approximately 80 percent complete, with
start-up activities expected to commence in the fourth quarter of 2021.
Strengthening the Portfolio
• During the quarter, production volumes in the Permian averaged 401,000 oil-equivalent barrels per day which
included full recovery of volumes curtailed in the prior quarter. Full year 2020 production is anticipated to be approximately 360,000 oil-equivalent barrels per day. Focus remains on lowering overall development costs through efficiency gains and technology applications. Compared to 2019, drilling and completion costs
decreased more than 20 percent, while drilling rates (lateral feet per day) and fracturing rates (stages per day) both increased more than 30 percent. Rig count reductions continue, with 10-15 rigs expected to be operating by year-end.
• ExxonMobil continues to improve its industry-leading development opportunities, as illustrated by the growth
of the recoverable resource base in Guyana to nearly 9 billion barrels of oil equivalent, and other high -value
assets in the U.S. Permian Basin, Mozambique, Papua New Guinea and Brazil. Given the high quality opportunities in ExxonMobil's portfolio and the constraints of the current market environment, the corporation is assessing its full portfolio to prioritize assets with the highest value potential within its broad range of
available opportunities. This effort includes an ongoing re-assessment of North American dry gas assets currently included in the corporation’s development plan. Depending on the outcome of the planning process,
▪ ExxonMobil announced that it has funded the Payara development offshore Guyana, following government
and regulatory approvals. The third major project in the Stabroek Block will have the capacity to produce up
to 220,000 oil-equivalent barrels per day after expected startup in 2024. The company also made its 17th and
18th discoveries at the Yellowtail-2 and Redtail-1 wells, respectively, increasing the estimated recoverable
resource to nearly 9 billion oil-equivalent barrels on the Stabroek block.
3
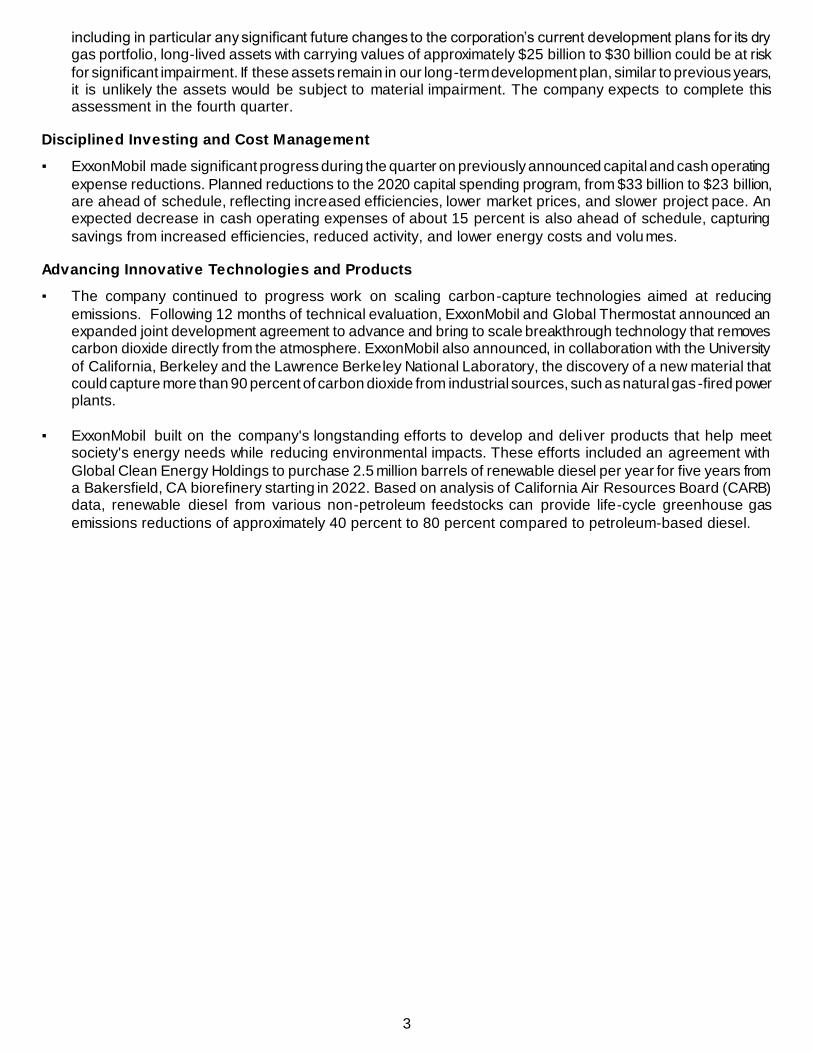
including in particular any significant future changes to the corporation’s current development plans for its dry gas portfolio, long-lived assets with carrying values of approximately $25 billion to $30 billion could be at risk
for significant impairment. If these assets remain in our long-term development plan, similar to previous years, it is unlikely the assets would be subject to material impairment. The company expects to complete this assessment in the fourth quarter.
Disciplined Investing and Cost Management
▪ ExxonMobil made significant progress during the quarter on previously announced capital and cash operating
expense reductions. Planned reductions to the 2020 capital spending program, from $33 billion to $23 billion, are ahead of schedule, reflecting increased efficiencies, lower market prices, and slower project pace. An expected decrease in cash operating expenses of about 15 percent is also ahead of schedule, capturing
savings from increased efficiencies, reduced activity, and lower energy costs and volumes.
Advancing Innovative Technologies and Products
▪ The company continued to progress work on scaling carbon-capture technologies aimed at reducing
emissions. Following 12 months of technical evaluation, ExxonMobil and Global Thermostat announced an expanded joint development agreement to advance and bring to scale breakthrough technology that removes carbon dioxide directly from the atmosphere. ExxonMobil also announced, in collaboration with the University
of California, Berkeley and the Lawrence Berkeley National Laboratory, the discovery of a new material that could capture more than 90 percent of carbon dioxide from industrial sources, such as natural gas -fired power plants.
▪ ExxonMobil built on the company's longstanding efforts to develop and deliver products that help meet
society's energy needs while reducing environmental impacts. These efforts included an agreement with
Global Clean Energy Holdings to purchase 2.5 million barrels of renewable diesel per year for five years from a Bakersfield, CA biorefinery starting in 2022. Based on analysis of California Air Resources Board (CARB) data, renewable diesel from various non-petroleum feedstocks can provide life-cycle greenhouse gas
emissions reductions of approximately 40 percent to 80 percent compared to petroleum-based diesel.

4
Results and Volume Summary
Millions of Dollars 3Q 3Q
(unless noted) 2020 2019 Change Comments
Upstream
U.S.
(681)
37
-718
Lower prices partly offset by reduced expenses
Non-U.S.
298
2,131
-1,833
Lower prices and one-time tax items, partly offset by reduced expenses
Total
(383)
2,168
-2,551
Prices -2,630, volume -60, expenses +500, other -350, identified item -10
Production (koebd)
3,672
3,899
-227
Liquids -106 kbd: higher entitlements, lower downtime/maintenance, and growth, more than offset by government mandates, divestments, and lower demand including economic curtailments Gas -729 mcfd: higher entitlements more than offset by divestments, higher downtime/maintenance, and decline
Downstream
U.S.
(136)
673
-809
Lower margins on weaker industry refining conditions, partly offset by reduced expenses and improved manufacturing
Non-U.S.
(95)
557
-652
Lower margins on weaker industry refining conditions and lower market demand, partly offset by reduced expenses and improved manufacturing
Total
(231)
1,230
-1,461
Margins -1,880, market demand -80, expenses +360, other +140
Petroleum Product Sales (kbd) 5,023 5,504 -481
Chemical U.S.
357
53
+304
Higher margins and lower expenses; favorable identified item (noncash inventory valuation +29)
Non-U.S.
304
188
+116
Lower margins more than offset by lower expenses and favorable identified item (noncash inventory valuation +86)
Total
661
241
+420
Margins +70, volumes +30, expenses +170, identified items +120, forex/other +30
Prime Product Sales (kt)
6,624
6,476
+148
Corporate and financing
(727)
(469)
-258
Absence of prior year identified item (-307, tax)

5
Results and Volume Summary
Millions of Dollars 3Q 2Q
(unless noted) 2020 2020 Change Comments
Upstream
U.S.
(681)
(1,197)
+516
Higher liquids prices and lower expenses; unfavorable identified item (noncash inventory valuation -45)
Non-U.S.
298
(454)
+752
Higher liquids prices partly offset by lower LNG prices; favorable volume/mix and lower expenses; unfavorable identified item (noncash inventory valuation -179)
Total
(383)
(1,651)
+1,268
Prices +1,390, volume +140, expenses +110, identified items -220, other -150
Production (koebd)
3,672
3,638
+34
Liquids -20 kbd: higher demand including reduced economic curtailments, more than offset by higher downtime/maintenance, lower entitlements and decline Gas +326 mcfd: higher entitlements and demand including reduced economic curtailments, partly offset by decline
Downstream U.S.
(136)
(101)
-35
Higher margins with favorable trading activity more than offsetting weaker industry refining conditions, higher market demand, and improved manufacturing more than offset by unfavorable identified item (noncash inventory valuation -401)
Non-U.S.
(95)
1,077
-1,172
Lower margins on weaker industry refining conditions more than offset by higher market demand and lower expenses; unfavorable forex and unfavorable identified item (noncash inventory valuation -1,184)
Total
(231)
976
-1,207
Margins +70, market demand +300, expenses +60, identified items -1,580, other -60
Petroleum Product Sales (kbd) 5,023 4,437 +586 Chemical U.S.
357
171
+186
Higher volumes; favorable identified item (noncash inventory valuation +58)
Non-U.S.
304
296
+8
Lower margins more than offset by higher volumes and lower expenses; unfavorable identified item (noncash inventory valuation -58)
Total
661
467
+194
Margins -80, volumes +220, expenses +40, forex/other +10
Prime Product Sales (kt) 6,624 5,945 +679 Corporate and financing
(727)
(872)
+145
Lower financing and corporate costs

6
Results and Volume Summary
Millions of Dollars YTD YTD (unless noted) 2020 2019 Change Comments
Upstream
U.S.
(2,582)
468
-3,050
Lower prices partly offset by reduced expenses; unfavorable identified item (impairment -315)
Non-U.S.
1,084
7,837
-6,753
Lower prices and volumes, partly offset by reduced expenses and favorable foreign exchange effects; unfavorable identified items (noncash inventory valuation -61, impairment -41, prior year tax item -487)
Total
(1,498)
8,305
-9,803
Prices -9,050, volume -320, expenses +630, identified items -900, other -160
Production (koebd)
3,785
3,929
-144
Liquids -12 kbd: growth, higher entitlements, and lower downtime/maintenance, more than offset by divestments, government mandates, and lower demand including economic curtailments Gas -794 mcfd: higher entitlements and growth, more than offset by divestments and lower demand including economic curtailments
Downstream
U.S.
(338)
822
-1,160
Lower margins on weaker industry refining conditions and reduced market demand partly offset by lower expenses and improved manufacturing
Non-U.S.
472
603
-131
Lower margins on weaker industry refining conditions and reduced market demand partly offset by improved manufacturing and lower expenses; unfavorable identified items (-326, mainly impairment)
Total
134
1,425
-1,291
Margins -2,260, market demand -520, manufacturing +920, expenses +860, other +40, identified items -330
Petroleum Product Sales (kbd) 4,916 5,443 -527 Chemical
U.S.
816
208
+608
Higher margins partly offset by lower volumes; lower expenses; unfavorable identified item (-90, impairment)
Non-U.S.
456
739
-283
Lower margins and volumes partly offset by lower expenses
Total
1,272
947
+325
Margins +190, volumes -220, expenses +380, identified items -90, forex/other +60
Prime Product Sales (kt) 18,806 19,947 -1,141
Corporate and financing
(2,278)
(2,027)
-251
Absence of prior year identified items (-332, tax) and higher financing costs partly offset by lower corporate costs

7
Cash Flow from Operations and Asset Sales excluding Working Capital
Millions of Dollars 3Q
2020 Comments
Net income (loss) including noncontrolling interests (709) Including ($29) million noncontrolling interests
Depreciation 4,983
Noncash inventory adjustment
(115)
Including ($2) million noncontrolling interests
Changes in operational working capital
863
Mainly inventory draw
Other (633) Includes changes in deferred income taxes
Cash Flow from Operating 4,389
Activities (U.S. GAAP)
Asset sales 100
Cash Flow from Operations 4,489
and Asset Sales
Changes in operational working capital (863)
Cash Flow from Operations 3,626
and Asset Sales excluding Working Capital
Millions of Dollars YTD
2020 Comments
Net income (loss) including noncontrolling interests
(2,648)
Including ($278) million noncontrolling interests
Depreciation 15,718 Including impairment impacts
Noncash inventory adjustment 61
Changes in operational working capital (1,539) Mainly unfavorable payables
Other (929) Includes changes in deferred income taxes
Cash Flow from Operating 10,663
Activities (U.S. GAAP)
Asset sales 229
Cash Flow from Operations 10,892
and Asset Sales
Changes in operational working capital 1,539
Cash Flow from Operations 12,431
and Asset Sales excluding Working Capital
First Nine Months 2020 Financial Updates
During the first nine months of 2020, Exxon Mobil Corporation purchased 6 million shares of its common stock for the treasury at a gross cost of $305 million. These shares were acquired to offset dilution in conjunction with the company’s benefit plans and programs. The corporation will continue to acquire shares to offset dilution in conjunction with its benefit plans and programs.
8
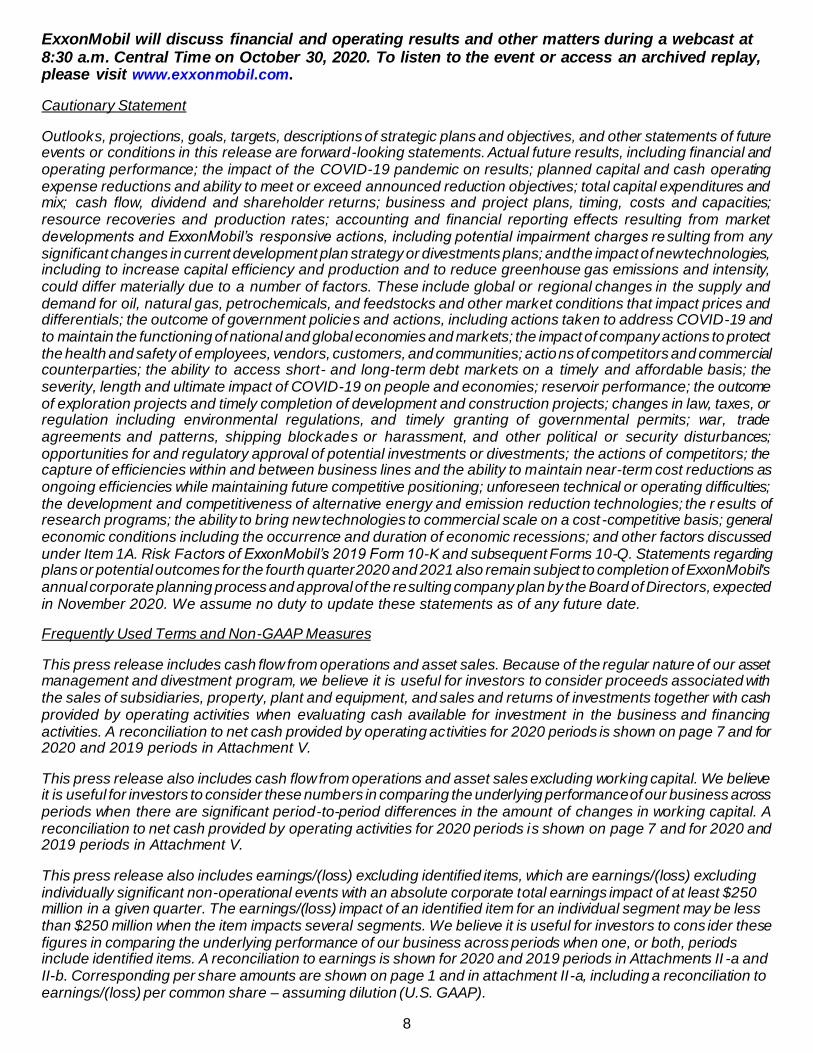
ExxonMobil will discuss financial and operating results and other matters during a webcast at 8:30 a.m. Central Time on October 30, 2020. To listen to the event or access an archived replay, please visit www.exxonmobil.com.
Cautionary Statement
Outlooks, projections, goals, targets, descriptions of strategic plans and objectives, and other statements of future events or conditions in this release are forward-looking statements. Actual future results, including financial and operating performance; the impact of the COVID-19 pandemic on results; planned capital and cash operating expense reductions and ability to meet or exceed announced reduction objectives; total capital expenditures and mix; cash flow, dividend and shareholder returns; business and project plans, timing, costs and capacities; resource recoveries and production rates; accounting and financial reporting effects resulting from market developments and ExxonMobil’s responsive actions, including potential impairment charges re sulting from any significant changes in current development plan strategy or divestments plans; and the impact of new technologies, including to increase capital efficiency and production and to reduce greenhouse gas emissions and intensity, could differ materially due to a number of factors. These include global or regional changes in the supply and demand for oil, natural gas, petrochemicals, and feedstocks and other market conditions that impact prices and differentials; the outcome of government policies and actions, including actions taken to address COVID-19 and to maintain the functioning of national and global economies and markets; the impact of company actions to protect the health and safety of employees, vendors, customers, and communities; actions of competitors and commercial counterparties; the ability to access short- and long-term debt markets on a timely and affordable basis; the severity, length and ultimate impact of COVID-19 on people and economies; reservoir performance; the outcome of exploration projects and timely completion of development and construction projects; changes in law, taxes, or regulation including environmental regulations, and timely granting of governmental permits; war, trade agreements and patterns, shipping blockades or harassment, and other political or security disturbances; opportunities for and regulatory approval of potential investments or divestments; the actions of competitors; the capture of efficiencies within and between business lines and the ability to maintain near-term cost reductions as ongoing efficiencies while maintaining future competitive positioning; unforeseen technical or operating difficulties; the development and competitiveness of alternative energy and emission reduction technologies; the r esults of research programs; the ability to bring new technologies to commercial scale on a cost -competitive basis; general economic conditions including the occurrence and duration of economic recessions; and other factors discussed under Item 1A. Risk Factors of ExxonMobil’s 2019 Form 10-K and subsequent Forms 10-Q. Statements regarding plans or potential outcomes for the fourth quarter 2020 and 2021 also remain subject to completion of ExxonMobil's annual corporate planning process and approval of the resulting company plan by the Board of Directors, expected in November 2020. We assume no duty to update these statements as of any future date.
Frequently Used Terms and Non-GAAP Measures
This press release includes cash flow from operations and asset sales. Because of the regular nature of our asset management and divestment program, we believe it is useful for investors to consider proceeds associated with the sales of subsidiaries, property, plant and equipment, and sales and returns of investments together with cash provided by operating activities when evaluating cash available for investment in the business and financing activities. A reconciliation to net cash provided by operating activities for 2020 periods is shown on page 7 and for 2020 and 2019 periods in Attachment V.
This press release also includes cash flow from operations and asset sales excluding working capital. We believe it is useful for investors to consider these numbers in comparing the underlying performance of our business across periods when there are significant period-to-period differences in the amount of changes in working capital. A reconciliation to net cash provided by operating activities for 2020 periods is shown on page 7 and for 2020 and 2019 periods in Attachment V.
This press release also includes earnings/(loss) excluding identified items, which are earnings/(loss) excluding individually significant non-operational events with an absolute corporate total earnings impact of at least $250 million in a given quarter. The earnings/(loss) impact of an identified item for an individual segment may be less than $250 million when the item impacts several segments. We believe it is useful for investors to cons ider these figures in comparing the underlying performance of our business across periods when one, or both, periods include identified items. A reconciliation to earnings is shown for 2020 and 2019 periods in Attachments II -a and II-b. Corresponding per share amounts are shown on page 1 and in attachment II-a, including a reconciliation to earnings/(loss) per common share – assuming dilution (U.S. GAAP).

9
This press release also includes total taxes including sales-based taxes. This is a broader indicator of the total tax burden on the corporation’s products and earnings, including certain sales and value -added taxes imposed on and concurrent with revenue-producing transactions with customers and collected on behalf of governmental authorities (“sales-based taxes”). It combines “Income taxes” and “Total other taxes and duties” with sales‑ based taxes, which are reported net in the income statement. We believe it is useful for the corporation and its investors to understand the total tax burden imposed on the corporation’s products and earnings. A reconciliation to total taxes is shown as part of the Estimated Key Financial and Operating Data in Attachment I.
References to the resource base and other quantities of oil, natural gas or condensate may include est imated amounts that are not yet classified as “proved reserves” under SEC definitions, but which are expected to be ultimately recoverable. The term “project” as used in this release can refer to a variety of different activities and does not necessarily have the same meaning as in any government payment transparency reports. Further information on ExxonMobil’s frequently used financial and operating measures and other terms including “Cash flow from operations and asset sales”, and “Total taxes including sales-based taxes” is contained under the heading “Frequently Used Terms” available through the “Investors” section of our website at www.exxonmobil.com.
LIFO Inventory
Crude oil, products and merchandise inventories are carried at the lower of current market value or cost, generally determined under the last-in first-out method (LIFO). The corporation’s results for the first quarter of 2020 included an after-tax earnings charge of $2,096 million from writing down the book value of inventories to their mar ket value at the end of the period. The corporation’s results for the second and third quarters of 2020 included after -tax earnings benefits of $1,922 million and $113 million, respectively, mainly reflecting reversals of the majority of the first quarter charge due to rising commodity prices. The earnings impact may be adjusted in the fourth quarter based on prevailing market prices at that time. At year-end, any required adjustment is considered permanent and is incorporated into the LIFO carrying value of the inventory.
Reference to Earnings
References to corporate earnings mean net income attributable to ExxonMobil (U.S. GAAP) from the consolidated income statement. Unless otherwise indicated, references to earnings, Upstream, Downstream, Chemical and Corporate and financing segment earnings, and earnings per share are ExxonMobil’s share after excluding amounts attributable to noncontrolling interests.
Exxon Mobil Corporation has numerous affiliates, many with names that include ExxonMobil, Exxon, Mobi l, Esso, and XTO. For convenience and simplicity, those terms and terms such as corporation, company, our, we, and its are sometimes used as abbreviated references to specific affiliates or affiliate groups. Similarly, ExxonMobil has business relationships with thousands of customers, suppliers, governments, and others. For convenience and simplicity, words such as venture, joint venture, partnership, co-venturer, and partner are used to indicate business and other relationships involving common activities and interests, and those words may not indicate precise legal relationships.

10
Estimated Key Financial and Operating Data Attachment I
Exxon Mobil Corporation Third Quarter 2020
(millions of dollars, unless noted)
Second
Third Quarter Quarter First Nine Months
2020 2019 2020 2020 2019
Earnings (Loss) / Earnings (Loss) Per Share
Total revenues and other income 46,199 65,049 32,605 134,962 197,765
Total costs and other deductions 46,571 60,328 34,245 137,232 184,123
Income (loss) before income taxes (372) 4,721 (1,640) (2,270) 13,642
Income taxes 337 1,474 (471) 378 4,598
Net income (loss) including noncontrolling interests (709) 3,247 (1,169) (2,648) 9,044
Net income (loss) attributable to noncontrolling interests (29) 77 (89) (278) 394
Net income (loss) attributable to ExxonMobil (U.S. GAAP) (680) 3,170 (1,080) (2,370) 8,650
Earnings (loss) per common share (dollars) (0.15) 0.75 (0.26) (0.55) 2.03
Earnings (loss) per common share
- assuming dilution (dollars) (0.15) 0.75 (0.26) (0.55) 2.03
Exploration expenses, including dry holes 188 299 214 690 912
Other Financial Data
Dividends on common stock
Total 3,716 3,716 3,715 11,150 10,936
Per common share (dollars) 0.87 0.87 0.87 2.61 2.56
Millions of common shares outstanding
At period end 4,228 4,231
Average - assuming dilution 4,271 4,271 4,271 4,270 4,270
ExxonMobil share of equity at period end 177,400 189,915
ExxonMobil share of capital employed at period end 248,485 239,653
Income taxes 337 1,474 (471) 378 4,598
Total other taxes and duties 7,901 8,317 5,683 21,081 24,770
Total taxes 8,238 9,791 5,212 21,459 29,368
Sales-based taxes 4,303 5,228 3,129 11,917 15,474
Total taxes including sales-based taxes 12,541 15,019 8,341 33,376 44,842
ExxonMobil share of income taxes of
equity companies 134 426 (18) 576 1,776

11
Attachment II-a Exxon Mobil Corporation
Third Quarter 2020
Second
$ Millions Third Quarter Quarter First Nine Months
2020 2019 2020 2020 2019
Earnings/(Loss) (U.S. GAAP) (680) 3,170 (1,080) (2,370) 8,650
Identified Items Included in Earnings/(Loss)
Noncash inventory valuation - lower of cost or market 113 — 1,922 (61) —
Impairment — — — (787) —
Tax items — 307 — — 812
Corporate total 113 307 1,922 (848) 812
Earnings/(Loss) Excluding Identified Items (793) 2,863 (3,002) (1,522) 7,838
$ Per Common Share1
Earnings/(Loss) Per Common Share
Assuming Dilution (U.S. GAAP) (0.15) 0.75 (0.26) (0.55) 2.03
Identified Items Included in Earnings/(Loss) Per Common Share Assuming Dilution
Noncash inventory valuation - lower of cost or market 0.03 — 0.44 (0.02) —
Impairment — — — (0.18) —
Tax items — 0.07 — — 0.19
Corporate total 0.03 0.07 0.44 (0.20) 0.19
Earnings/(Loss) Excluding Identified Items
Per Common Share Assuming Dilution (0.18) 0.68 (0.70) (0.35) 1.84
1 Computed using the average number of shares outstanding during each period.

12
Attachment II-b Exxon Mobil Corporation
Third Quarter 2020 (millions of dollars)
Second Third Quarter Quarter First Nine Months 2020 2019 2020 2020 2019 Earnings/(Loss) (U.S. GAAP) Upstream
United States (681) 37 (1,197) (2,582) 468 Non-U.S. 298 2,131 (454) 1,084 7,837
Downstream United States (136) 673 (101) (338) 822 Non-U.S. (95) 557 1,077 472 603
Chemical United States 357 53 171 816 208 Non-U.S. 304 188 296 456 739
Corporate and financing (727) (469) (872) (2,278) (2,027) Net income (loss) attributable to ExxonMobil (680) 3,170 (1,080) (2,370) 8,650 Identified Items Included in Earnings/(Loss) U.S. Upstream
Other Items (Inventory valuation, Impairment) — — 45 (315) — Non-U.S. Upstream
Tax Items — — — — 487 Other Items (Inventory valuation, Impairment) (11) — 168 (102) —
U.S. Downstream Other Items (Inventory valuation, Impairment) 3 — 404 (4) —
Non-U.S. Downstream Tax Items — — — — (9) Other Items (Inventory valuation, Impairment) 6 — 1,190 (335) —
U.S. Chemical Other Items (Inventory valuation, Impairment) 29 — (29) (90) —
Non-U.S. Chemical Tax Items — — — — 2 Other Items (Inventory valuation, Impairment) 86 — 144 (2) —
Corporate and financing Tax Items — 307 — — 332
Corporate total 113 307 1,922 (848) 812 Earnings/(Loss) Excluding Identified Items Upstream
United States (681) 37 (1,242) (2,267) 468 Non-U.S. 309 2,131 (622) 1,186 7,350
Downstream United States (139) 673 (505) (334) 822 Non-U.S. (101) 557 (113) 807 612
Chemical United States 328 53 200 906 208 Non-U.S. 218 188 152 458 737
Corporate and financing (727) (776) (872) (2,278) (2,359) Corporate total (793) 2,863 (3,002) (1,522) 7,838
13
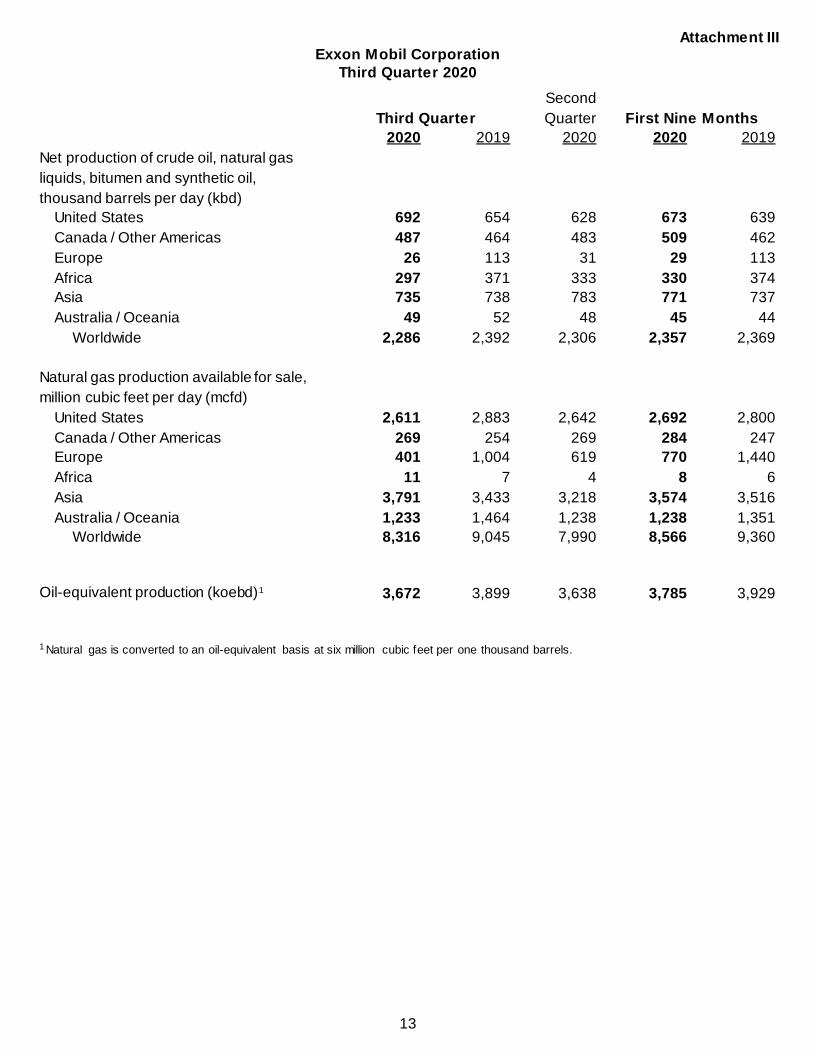
Attachment III Exxon Mobil Corporation
Third Quarter 2020
Second
Third Quarter Quarter First Nine Months
2020 2019 2020 2020 2019
Net production of crude oil, natural gas
liquids, bitumen and synthetic oil,
thousand barrels per day (kbd)
United States 692 654 628 673 639
Canada / Other Americas 487 464 483 509 462
Europe 26 113 31 29 113
Africa 297 371 333 330 374
Asia 735 738 783 771 737
Australia / Oceania 49 52 48 45 44
Worldwide 2,286 2,392 2,306 2,357 2,369
Natural gas production available for sale,
million cubic feet per day (mcfd)
United States 2,611 2,883 2,642 2,692 2,800
Canada / Other Americas 269 254 269 284 247
Europe 401 1,004 619 770 1,440
Africa 11 7 4 8 6
Asia 3,791 3,433 3,218 3,574 3,516
Australia / Oceania 1,233 1,464 1,238 1,238 1,351
Worldwide 8,316 9,045 7,990 8,566 9,360
Oil-equivalent production (koebd)1 3,672 3,899 3,638 3,785 3,929
1 Natural gas is converted to an oil-equivalent basis at six million cubic feet per one thousand barrels.

14
Attachment IV Exxon Mobil Corporation
Third Quarter 2020
Second
Third Quarter Quarter First Nine Months
2020 2019 2020 2020 2019
Refinery throughput (kbd)
United States 1,601 1,647 1,440 1,533 1,484
Canada 341 363 278 334 363
Europe 1,183 1,325 1,085 1,187 1,322
Asia Pacific 486 532 568 564 608
Other 148 185 145 161 180
Worldwide 3,759 4,052 3,516 3,779 3,957
Petroleum product sales (kbd)
United States 2,297 2,336 1,959 2,163 2,270
Canada 446 492 353 418 486
Europe 1,253 1,508 1,130 1,262 1,487
Asia Pacific 614 700 640 654 741
Other 413 468 355 419 459
Worldwide 5,023 5,504 4,437 4,916 5,443
Gasolines, naphthas 2,077 2,255 1,736 1,978 2,201
Heating oils, kerosene, diesel 1,750 1,833 1,649 1,755 1,855
Aviation fuels 152 445 147 227 408
Heavy fuels 242 261 262 255 289
Specialty products 802 710 643 701 690
Worldwide 5,023 5,504 4,437 4,916 5,443
Chemical prime product sales,
thousand metric tons (kt)
United States 2,363 2,216 1,985 6,543 6,833
Non-U.S. 4,261 4,260 3,960 12,263 13,114
Worldwide 6,624 6,476 5,945 18,806 19,947

15
Attachment V Exxon Mobil Corporation
Third Quarter 2020 (millions of dollars)
Second
Third Quarter Quarter First Nine Months
2020 2019 2020 2020 2019
Capital and Exploration Expenditures
Upstream
United States 1,260 3,002 1,637 5,695 8,805
Non-U.S. 1,534 2,789 1,940 5,802 8,589
Total 2,794 5,791 3,577 11,497 17,394
Downstream United States 390 590 719 1,856 1,628
Non-U.S. 382 479 334 1,203 1,383
Total 772 1,069 1,053 3,059 3,011
Chemical
United States 407 656 563 1,567 1,761
Non-U.S. 157 196 132 474 505
Total 564 852 695 2,041 2,266
Other 3 7 2 6 17
Worldwide 4,133 7,719 5,327 16,603 22,688
Cash flow from operations and asset sales excluding working capital Net cash provided by operating activities (U.S. GAAP) 4,389 9,079 — 10,663 23,364
Proceeds associated with asset sales 100 460 43 229 600
Cash flow from operations and asset sales 4,489 9,539 43 10,892 23,964
Changes in operational working capital (863) (1,550) 1,460 1,539 (2,564)
Cash flow from operations and asset sales 3,626 7,989 1,503 12,431 21,400
excluding working capital

16
Attachment VI Exxon Mobil Corporation
Earnings/(Loss)
$ Millions $ Per Common Share1
2016
First Quarter 1,810 0.43
Second Quarter 1,700 0.41
Third Quarter 2,650 0.63 Fourth Quarter 1,680 0.41
Year 7,840 1.88
2017 First Quarter 4,010 0.95
Second Quarter 3,350 0.78
Third Quarter 3,970 0.93
Fourth Quarter 8,380 1.97 Year 19,710 4.63
2018
First Quarter 4,650 1.09 Second Quarter 3,950 0.92
Third Quarter 6,240 1.46
Fourth Quarter 6,000 1.41
Year 20,840 4.88
2019
First Quarter 2,350 0.55
Second Quarter 3,130 0.73 Third Quarter 3,170 0.75
Fourth Quarter 5,690 1.33
Year 14,340 3.36
2020
First Quarter (610) (0.14)
Second Quarter (1,080) (0.26)
Third Quarter (680) (0.15)
1 Computed using the average number of shares outstanding during each period.