
EXFO CIBC Conference May 2016
18
1 © 2016 EXFO Inc. All rights reserved. CIBC EMERGING TECHNOLOGIES CONFERENCE Germain Lamonde Chairman, President & CEO May 9-10, 2016
-
Upload
exfo-inc -
Category
Investor Relations
-
view
298 -
download
0
Transcript of EXFO CIBC Conference May 2016
1© 2016 EXFO Inc. All rights reserved.
CIBC EMERGING TECHNOLOGIES CONFERENCE
Germain LamondeChairman, President & CEOMay 9-10, 2016
2© 2016 EXFO Inc. All rights reserved.
Certain statements in this presentation, or given in response to your questions, may constituteforward-looking statements within the meaning of the Securities Act of 1934. The PrivateSecurities Litigation Reform Act of 1995 provides “safe-harbors” for such forward-lookingstatements and we intend that any forward-looking statements made today be subject to the safeharbors. We caution you that any forward-looking statements are just predictions. They are notguarantees of future performance and involve risks and uncertainties. Actual results may differmaterially from those projected in forward-looking statements and we invite you to review thecompany’s most recent filings with the Securities and Exchange Commission or Canadiansecurities commissions for a discussion of the factors at risk. These forward-looking statementsspeak only as of the date of this presentation and, unless required by law or applicableregulations, we will not be reviewing or updating the material that is contained herein.
For a reconciliation of adjusted EBITDA to net earnings, refer to the Q2 2016 press release or the“Non-IFRS Measures” section on EXFO’s website.
All amounts in millions of US dollars, except otherwise noted.
FORWARD-LOOKING STATEMENTS
3© 2016 EXFO Inc. All rights reserved.
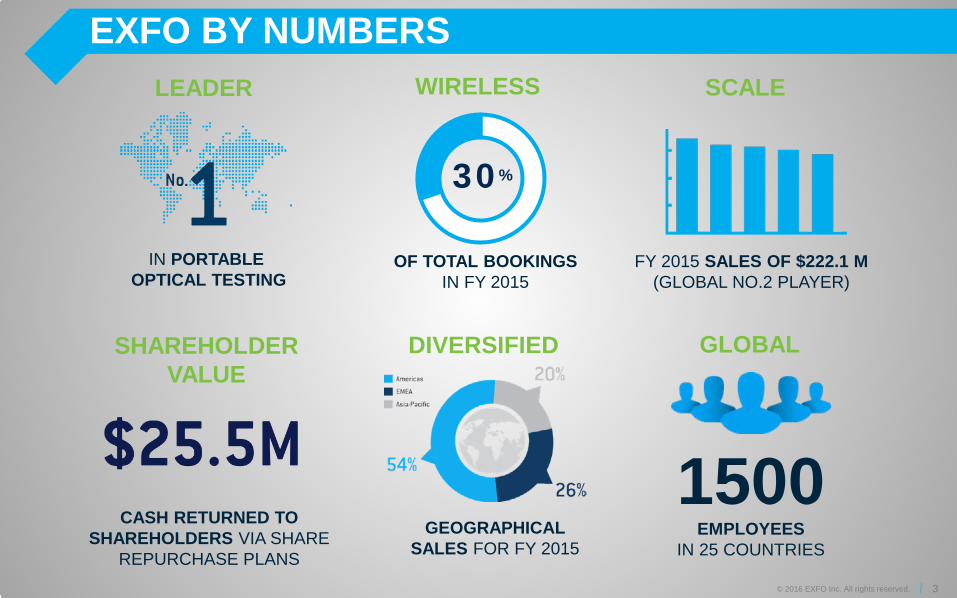
EXFO BY NUMBERS
IN PORTABLEOPTICAL TESTING
LEADER
FY 2015 SALES OF $222.1 M(GLOBAL NO.2 PLAYER)
SCALE
GEOGRAPHICAL SALES FOR FY 2015
DIVERSIFIED
1500EMPLOYEES
IN 25 COUNTRIES
GLOBAL
OF TOTAL BOOKINGSIN FY 2015
WIRELESS
30%
CASH RETURNED TO SHAREHOLDERS VIA SHARE
REPURCHASE PLANS
SHAREHOLDER VALUE
4© 2014 EXFO Inc. All rights reserved. 4© 2016 EXFO Inc. All rights reserved.
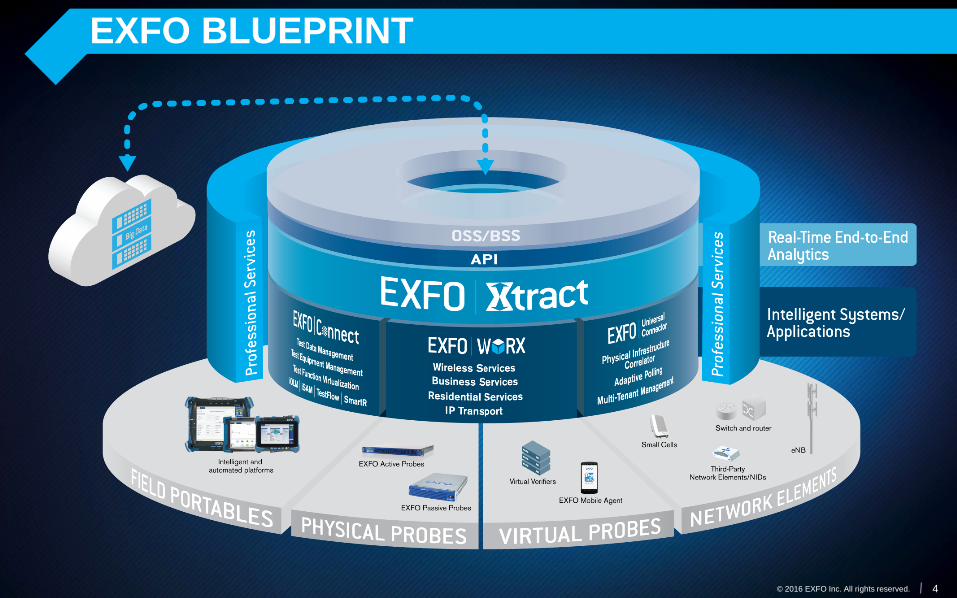
EXFO BLUEPRINT
5© 2014 EXFO Inc. All rights reserved. 5© 2016 EXFO Inc. All rights reserved.
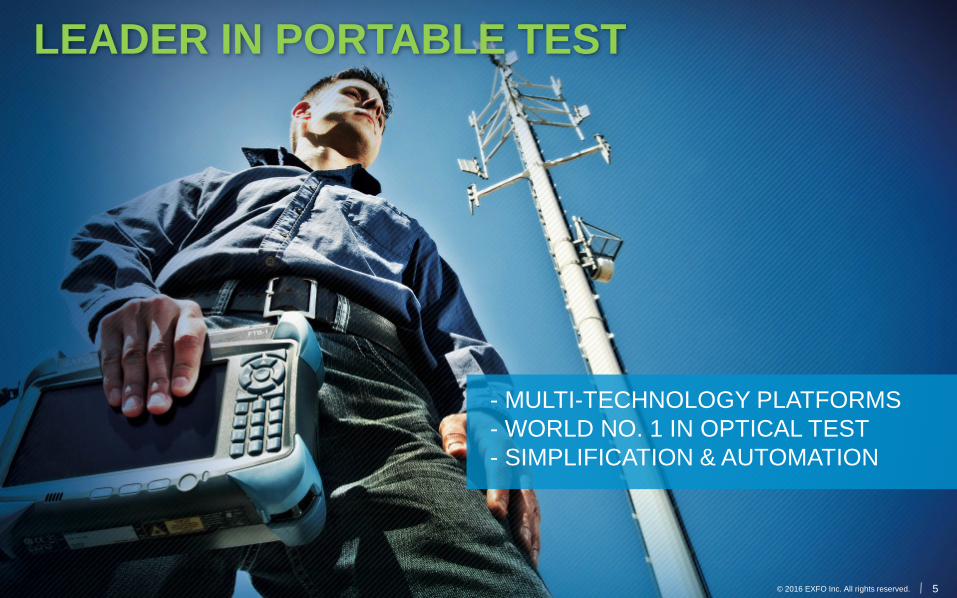
LEADER IN PORTABLE TEST
- MULTI-TECHNOLOGY PLATFORMS- WORLD NO. 1 IN OPTICAL TEST- SIMPLIFICATION & AUTOMATION
6© 2014 EXFO Inc. All rights reserved. 6© 2016 EXFO Inc. All rights reserved.
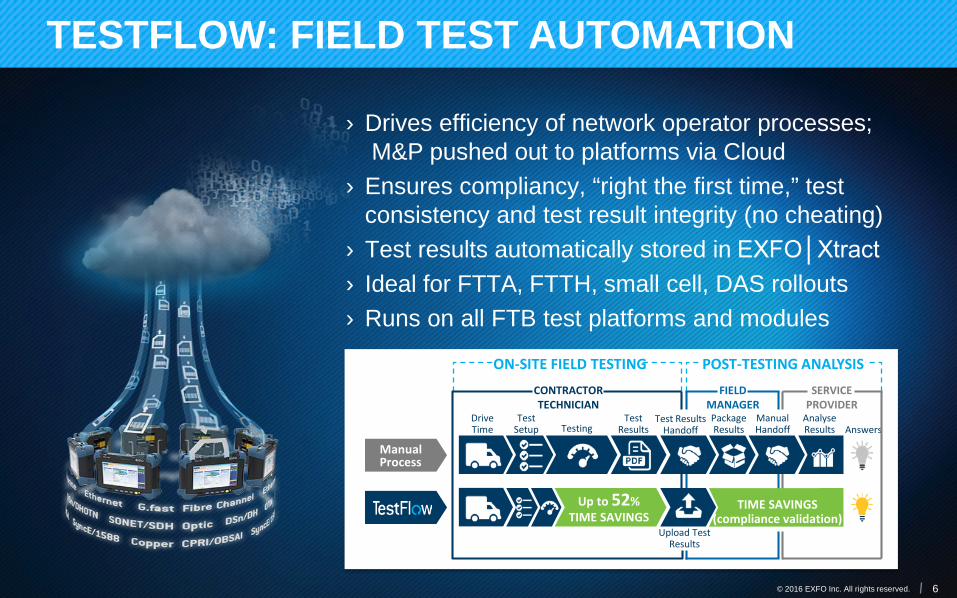
TESTFLOW: FIELD TEST AUTOMATION
› Drives efficiency of network operator processes;M&P pushed out to platforms via Cloud
› Ensures compliancy, “right the first time,” test consistency and test result integrity (no cheating)
› Test results automatically stored in EXFO│Xtract› Ideal for FTTA, FTTH, small cell, DAS rollouts› Runs on all FTB test platforms and modules
CONTRACTORTECHNICIAN
FIELDMANAGER
SERVICEPROVIDER
POST-TESTING ANALYSISON-SITE FIELD TESTING
DriveTime
TestSetup Testing
Test ResultsAdmin
Test ResultsHandoff
PackageResults
ManualHandoff
AnalyseResults Answers
Upload TestResults
ManualProcess
Up to 52%TIME SAVINGS
TIME SAVINGS(compliance validation)

7© 2014 EXFO Inc. All rights reserved. 7© 2016 EXFO Inc. All rights reserved.
LEADER IN SERVICE ASSURANCE
- FULL END-TO-END SOLUTION PORTFOLIO- CONVERGED & VIRTUALIZED IP SERVICES- OVER 100 DEPLOYMENTS WORLDWIDE
8© 2016 EXFO Inc. All rights reserved.
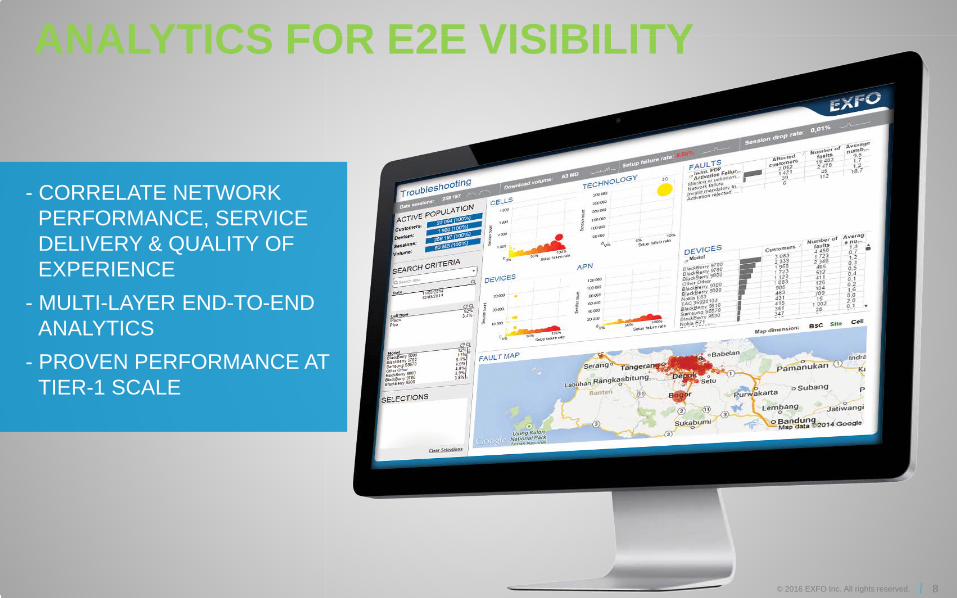
ANALYTICS FOR E2E VISIBILITY
- CORRELATE NETWORK PERFORMANCE, SERVICE DELIVERY & QUALITY OF EXPERIENCE
- MULTI-LAYER END-TO-END ANALYTICS
- PROVEN PERFORMANCE AT TIER-1 SCALE
9© 2016 EXFO Inc. All rights reserved.
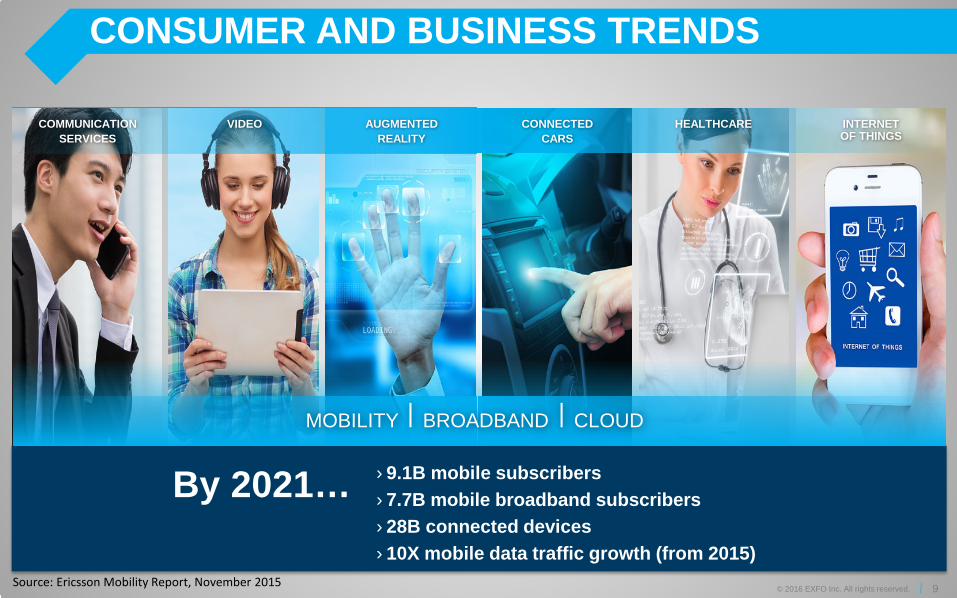
CONSUMER AND BUSINESS TRENDS
By 2021…
COMMUNICATIONSERVICES
VIDEO AUGMENTEDREALITY
CONNECTEDCARS
HEALTHCARE INTERNETOF THINGS
MOBILITY ⎪ BROADBAND ⎪ CLOUD
Source: Ericsson Mobility Report, November 2015
› 9.1B mobile subscribers› 7.7B mobile broadband subscribers› 28B connected devices › 10X mobile data traffic growth (from 2015)
10© 2014 EXFO Inc. All rights reserved. 10© 2016 EXFO Inc. All rights reserved.
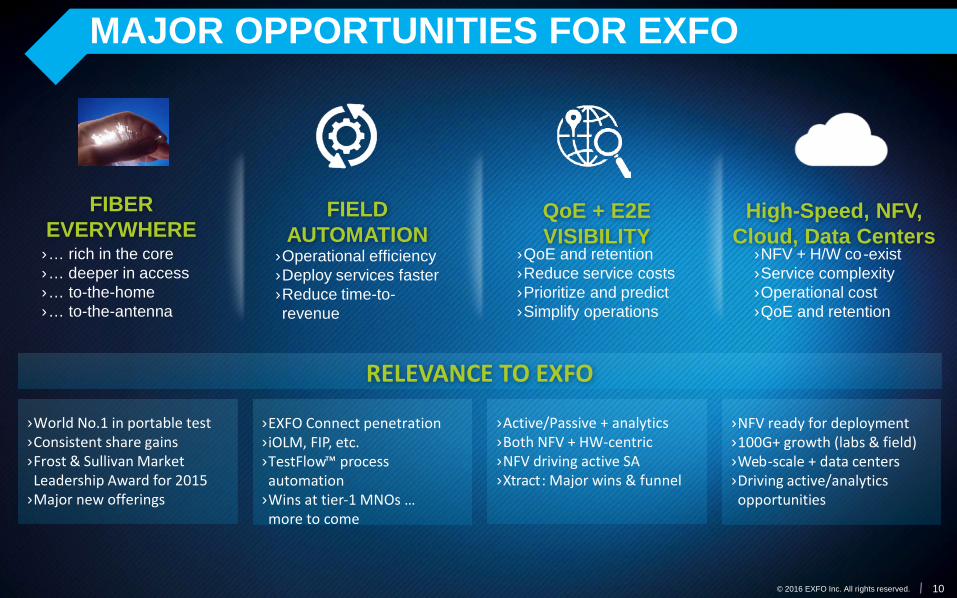
MAJOR OPPORTUNITIES FOR EXFO
FIELDAUTOMATION
›Operational efficiency›Deploy services faster›Reduce time-to-revenue
QoE + E2EVISIBILITY
›QoE and retention›Reduce service costs›Prioritize and predict›Simplify operations
FIBEREVERYWHERE
›… rich in the core›… deeper in access›… to-the-home›… to-the-antenna
High-Speed, NFV,Cloud, Data Centers
›NFV + H/W co-exist›Service complexity›Operational cost›QoE and retention
›World No.1 in portable test›Consistent share gains›Frost & Sullivan Market Leadership Award for 2015
›Major new offerings
›EXFO Connect penetration›iOLM, FIP, etc.›TestFlow™ process automation
›Wins at tier-1 MNOs … more to come
›Active/Passive + analytics›Both NFV + HW-centric›NFV driving active SA›Xtract: Major wins & funnel
›NFV ready for deployment›100G+ growth (labs & field)›Web-scale + data centers›Driving active/analytics opportunities
RELEVANCE TO EXFO
11© 2016 EXFO Inc. All rights reserved.
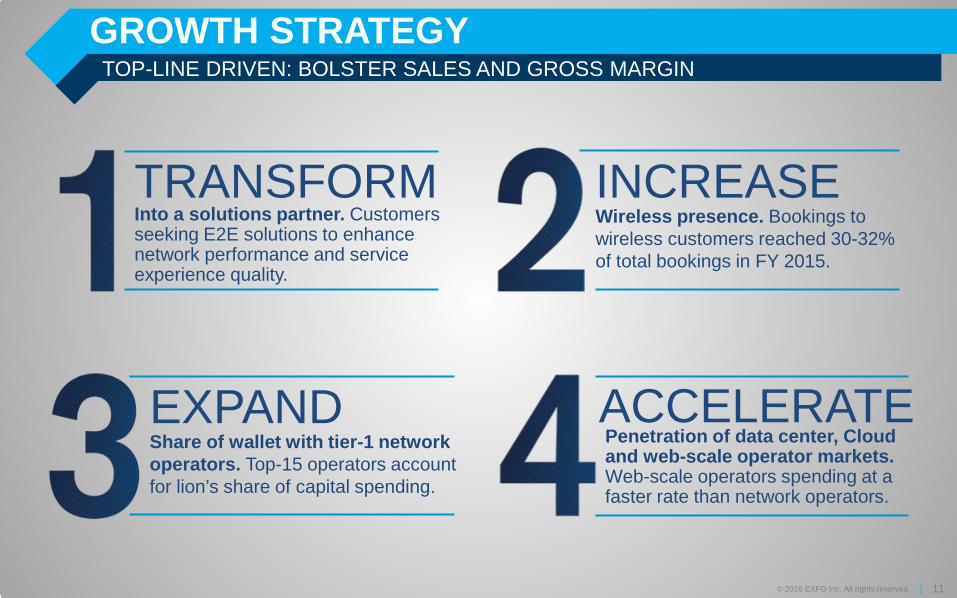
TOP-LINE DRIVEN: BOLSTER SALES AND GROSS MARGINGROWTH STRATEGY
TRANSFORMInto a solutions partner. Customers seeking E2E solutions to enhance network performance and service experience quality.
EXPANDShare of wallet with tier-1 network operators. Top-15 operators account for lion’s share of capital spending.
ACCELERATEPenetration of data center, Cloud and web-scale operator markets. Web-scale operators spending at a faster rate than network operators.
INCREASEWireless presence. Bookings to wireless customers reached 30-32% of total bookings in FY 2015.
12© 2014 EXFO Inc. All rights reserved. 12© 2016 EXFO Inc. All rights reserved.
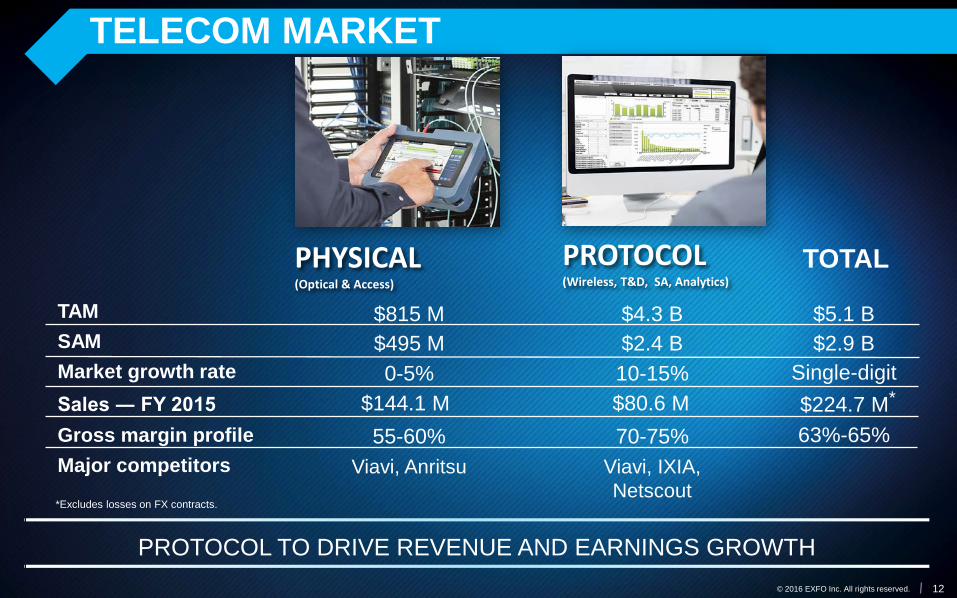
TELECOM MARKET
PROTOCOL(Wireless, T&D, SA, Analytics)
PHYSICAL(Optical & Access)
TAMSAM
Major competitors
Market growth rateSales ― FY 2015Gross margin profile
$815 M$495 M
Viavi, Anritsu
0-5%$144.1 M55-60%
$4.3 B$2.4 B
Viavi, IXIA, Netscout
10-15%$80.6 M70-75%
PROTOCOL TO DRIVE REVENUE AND EARNINGS GROWTH
*Excludes losses on FX contracts.
$5.1 B$2.9 B
Single-digit$224.7 M*
63%-65%
TOTAL
13© 2014 EXFO Inc. All rights reserved. 13© 2016 EXFO Inc. All rights reserved.
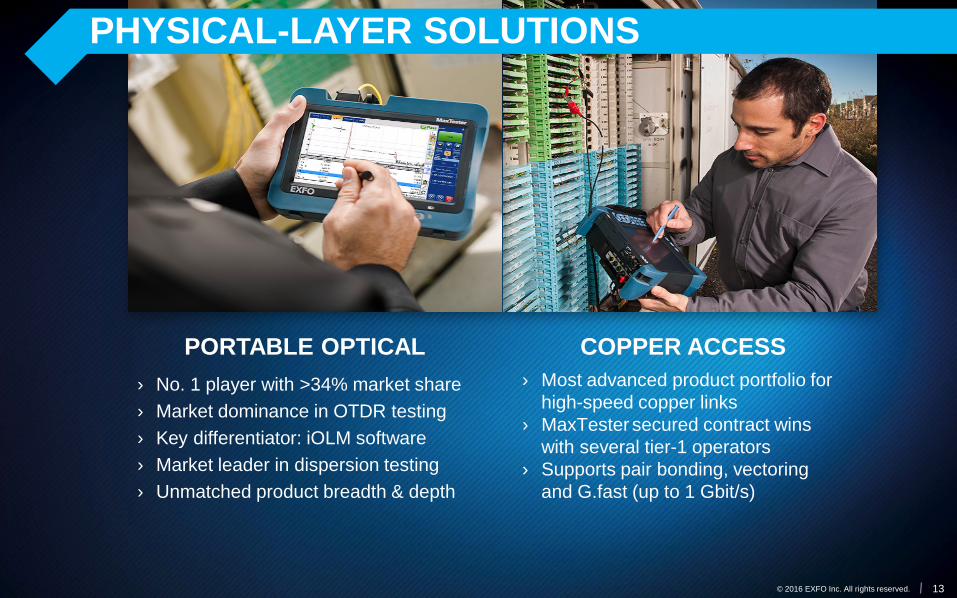
COPPER ACCESS› Most advanced product portfolio for
high-speed copper links› MaxTester secured contract wins
with several tier-1 operators› Supports pair bonding, vectoring
and G.fast (up to 1 Gbit/s)
PORTABLE OPTICAL› No. 1 player with >34% market share› Market dominance in OTDR testing› Key differentiator: iOLM software› Market leader in dispersion testing› Unmatched product breadth & depth
PHYSICAL-LAYER SOLUTIONS
14© 2014 EXFO Inc. All rights reserved. 14© 2016 EXFO Inc. All rights reserved.
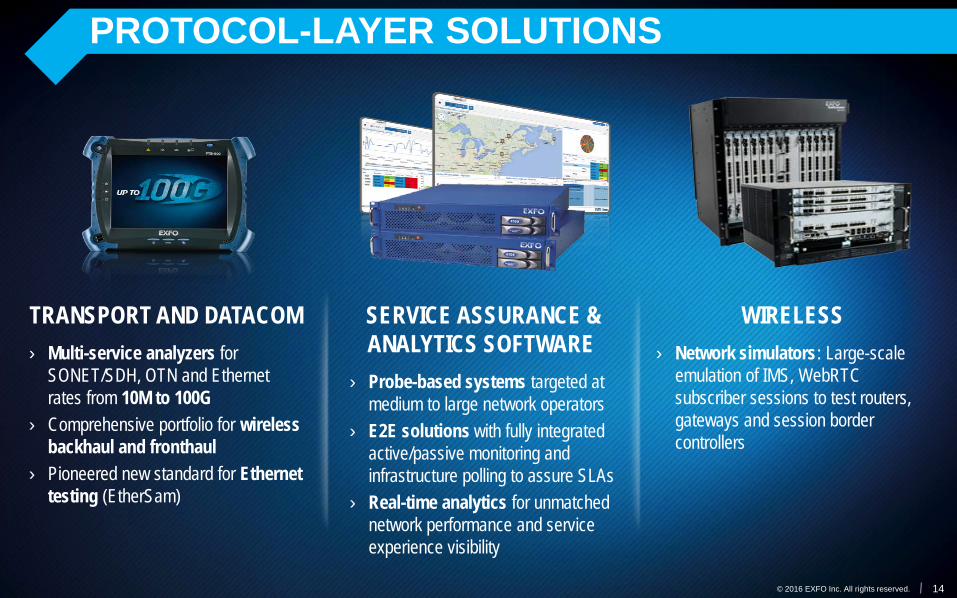
PROTOCOL-LAYER SOLUTIONS
SERVICE ASSURANCE & ANALYTICS SOFTWARE
› Probe-based systems targeted at medium to large network operators
› E2E solutions with fully integrated active/passive monitoring and infrastructure polling to assure SLAs
› Real-time analytics for unmatchednetwork performance and service experience visibility
TRANSPORT AND DATACOM› Multi-service analyzers for
SONET/SDH, OTN and Ethernet rates from 10M to 100G
› Comprehensive portfolio for wireless backhaul and fronthaul
› Pioneered new standard for Ethernet testing (EtherSam)
WIRELESS› Network simulators: Large-scale
emulation of IMS, WebRTCsubscriber sessions to test routers, gateways and session border controllers
15© 2014 EXFO Inc. All rights reserved. 15© 2016 EXFO Inc. All rights reserved.
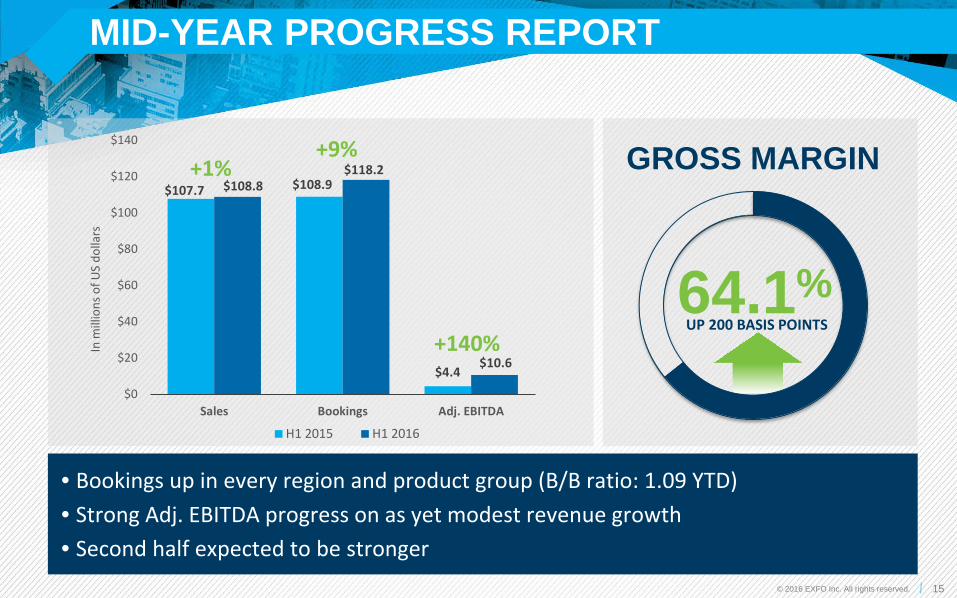
MID-YEAR PROGRESS REPORT
$107.7 $108.9
$4.4
$108.8$118.2
$10.6
$0
$20
$40
$60
$80
$100
$120
$140
Sales Bookings Adj. EBITDA
H1 2015 H1 2016
+1%+9%
+140%In m
illio
ns o
f US
dolla
rs
UP 200 BASIS POINTS64.1%
GROSS MARGIN
• Bookings up in every region and product group (B/B ratio: 1.09 YTD)• Strong Adj. EBITDA progress on as yet modest revenue growth• Second half expected to be stronger
16© 2014 EXFO Inc. All rights reserved. 16© 2016 EXFO Inc. All rights reserved.
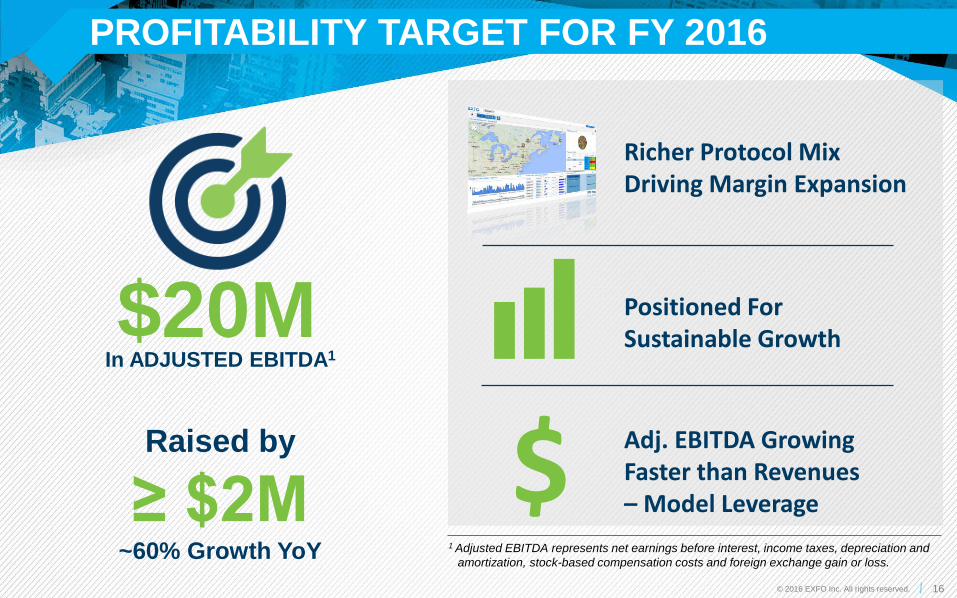
PROFITABILITY TARGET FOR FY 2016
Raised by
≥ $2M~60% Growth YoY
$20M In ADJUSTED EBITDA1
1 Adjusted EBITDA represents net earnings before interest, income taxes, depreciation and amortization, stock-based compensation costs and foreign exchange gain or loss.
Richer Protocol Mix Driving Margin Expansion
Adj. EBITDA Growing Faster than Revenues – Model Leverage
Positioned For Sustainable Growth
$
17© 2016 EXFO Inc. All rights reserved.
Q2 2016 HIGHLIGHTS
› Sales increased 5.1% YoY to $53.6 M › Bookings improved 9.2% YoY to $59.7 M, B/B ratio of 1.11
› Gross margin1 reached 64.7%, highest level in 4 years
› Adjusted EBITDA2 amounted to $5.3 M, 9.9% of sales
› Cash flows from operating activities totaled $15.3 M
› Cash position attained $44.4 M and no debt
1Gross margin before depreciation and amortization is a non-IFRS measure and represents sales less cost of sales, excluding depreciationand amortization.
2Adjusted EBITDA represents net earnings before interest, income taxes, depreciation and amortization, stock-based compensation costsand foreign exchange gain.
18© 2014 EXFO Inc. All rights reserved. 18© 2016 EXFO Inc. All rights reserved.
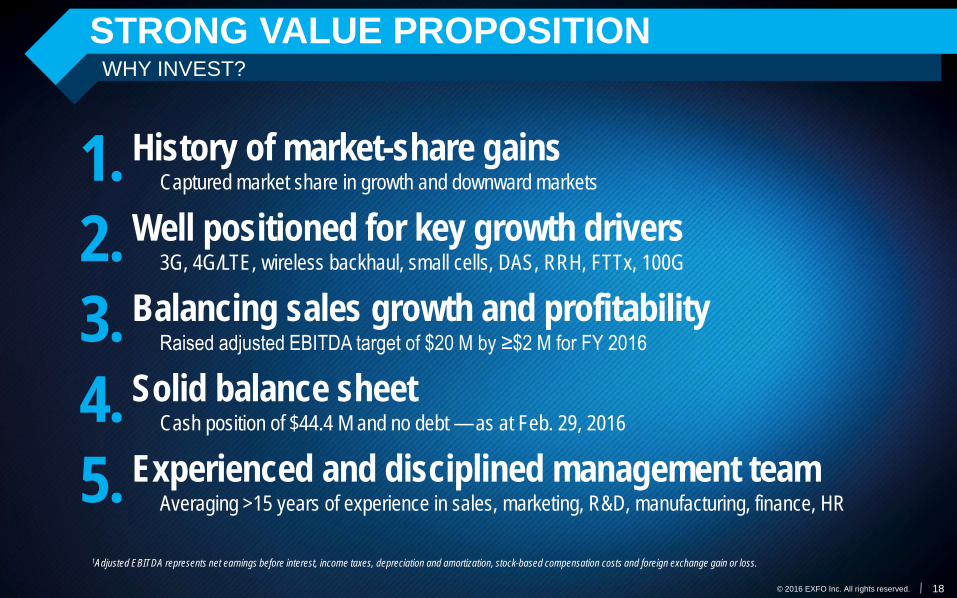
WHY INVEST?STRONG VALUE PROPOSITION
1. History of market-share gainsCaptured market share in growth and downward markets
2. Well positioned for key growth drivers3G, 4G/LTE, wireless backhaul, small cells, DAS, RRH, FTTx, 100G
3. Balancing sales growth and profitabilityRaised adjusted EBITDA target of $20 M by ≥$2 M for FY 2016
4. Solid balance sheet Cash position of $44.4 M and no debt — as at Feb. 29, 2016
5. Experienced and disciplined management teamAveraging >15 years of experience in sales, marketing, R&D, manufacturing, finance, HR
1Adjusted EBITDA represents net earnings before interest, income taxes, depreciation and amortization, stock-based compensation costs and foreign exchange gain or loss.