EXFO Annual General Meeting January 2016
16
2015 Annual Meeting VALUE CREATION AND TRANSFORMATION Germain Lamonde Chairman, President and CEO January 7, 2016
-
Upload
exfo-inc -
Category
Investor Relations
-
view
245 -
download
0
Transcript of EXFO Annual General Meeting January 2016
2015 Annual Meeting
VALUE CREATION AND VALUE CREATION AND VALUE CREATION AN TRANSFORMATION
Germain Lamonde Chairman, President and CEO January 7, 2016

2 © 2016 EXFO Inc. All rights reserved..
Certain statements in this presentation, or given in response to your questions, may constitute
forward-looking statements within the meaning of the Securities Act of 1934. The Private
Securities Litigation Reform Act of 1995 provides “safe-harbors” for such forward-looking
statements and we intend that any forward-looking statements made today be subject to the
safe harbors. We caution you that any forward-looking statements are just predictions. They are not guarantees of future performance and involve risks and uncertainties. Actual results may
differ materially from those projected in forward-looking statements and we invite you to review
the company’s most recent filings with the Securities and Exchange Commission or Canadian
securities commissions for a discussion of the factors at risk. These forward-looking statements
speak only as of the date of this presentation and, unless required by law or applicable
regulations, we will not be reviewing or updating the material that is contained herein.
For a reconciliation of adjusted EBITDA to net earnings, refer to the Q1 2016 press release or
the “Non-IFRS Measures” section on EXFO’s website.
All amounts in millions of US dollars, except otherwise noted.
FORWARD-LOOKING STATEMENTS
3 © 2016 EXFO Inc. All rights reserved..
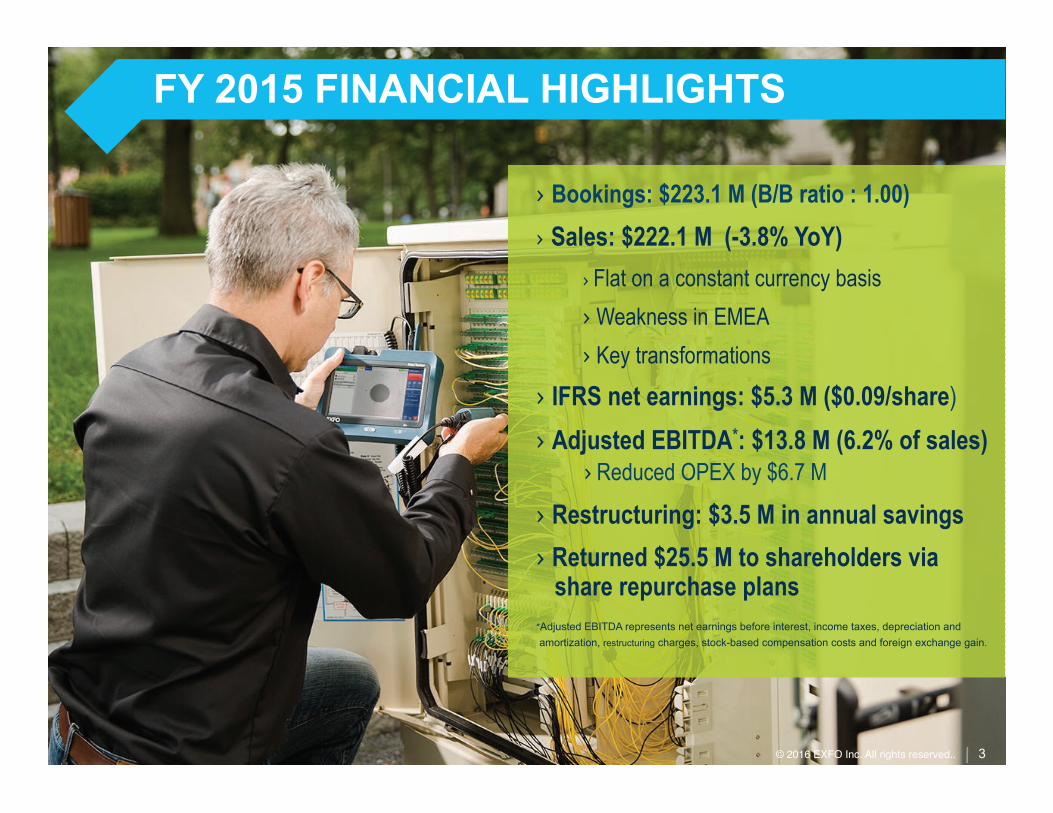
FY 2015 FINANCIAL HIGHLIGHTS
› Bookings: $223.1 M (B/B ratio : 1.00)
› Sales: $222.1 M (-3.8% YoY) › Flat on a constant currency basis › Weakness in EMEA › Key transformations
› IFRS net earnings: $5.3 M ($0.09/share)
› Adjusted EBITDA*: $13.8 M (6.2% of sales) › Reduced OPEX by $6.7 M
› Restructuring: $3.5 M in annual savings › Returned $25.5 M to shareholders via share repurchase plans *Adjusted EBITDA represents net earnings before interest, income taxes, depreciation and
amortization, restructuring charges, stock-based compensation costs and foreign exchange gain.
3 © 2016 EXFO Inc. All rights reserved..
4 © 2016 EXFO Inc. All rights reserved..
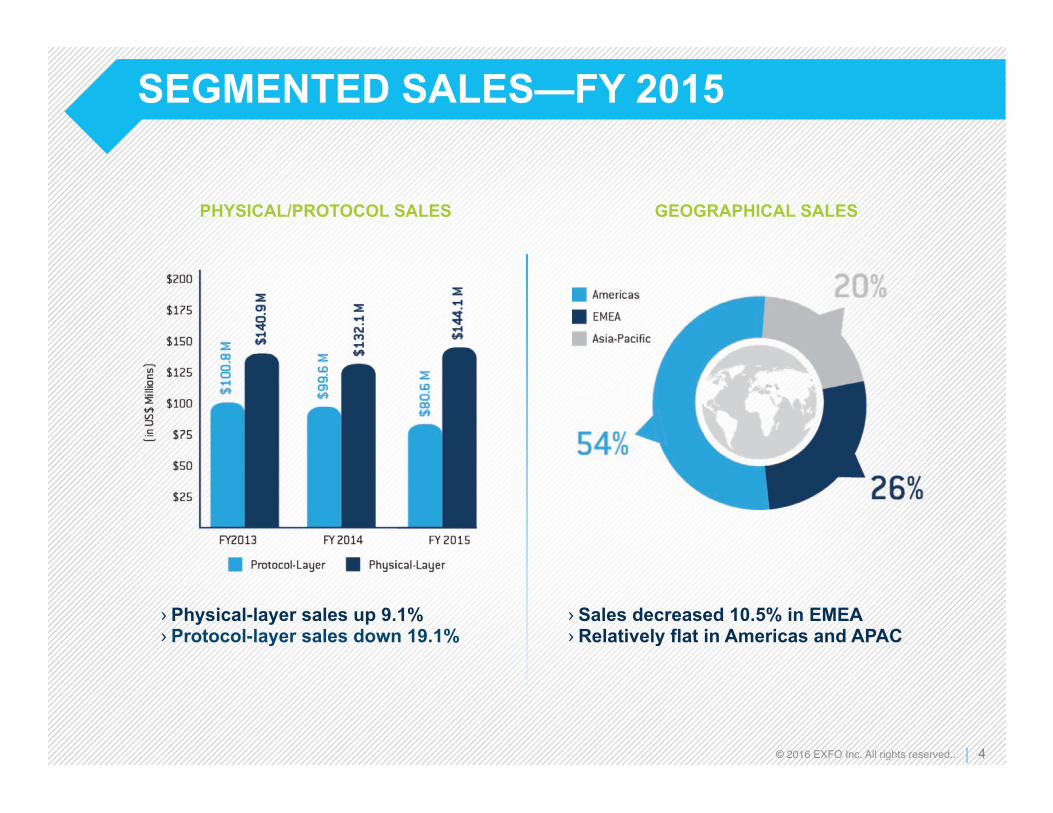
SEGMENTED SALES—FY 2015
› Physical-layer sales up 9.1% › Protocol-layer sales down 19.1%
PHYSICAL/PROTOCOL SALES
› Sales decreased 10.5% in EMEA › Relatively flat in Americas and APAC
GEOGRAPHICAL SALES
5 © 2016 EXFO Inc. All rights reserved..
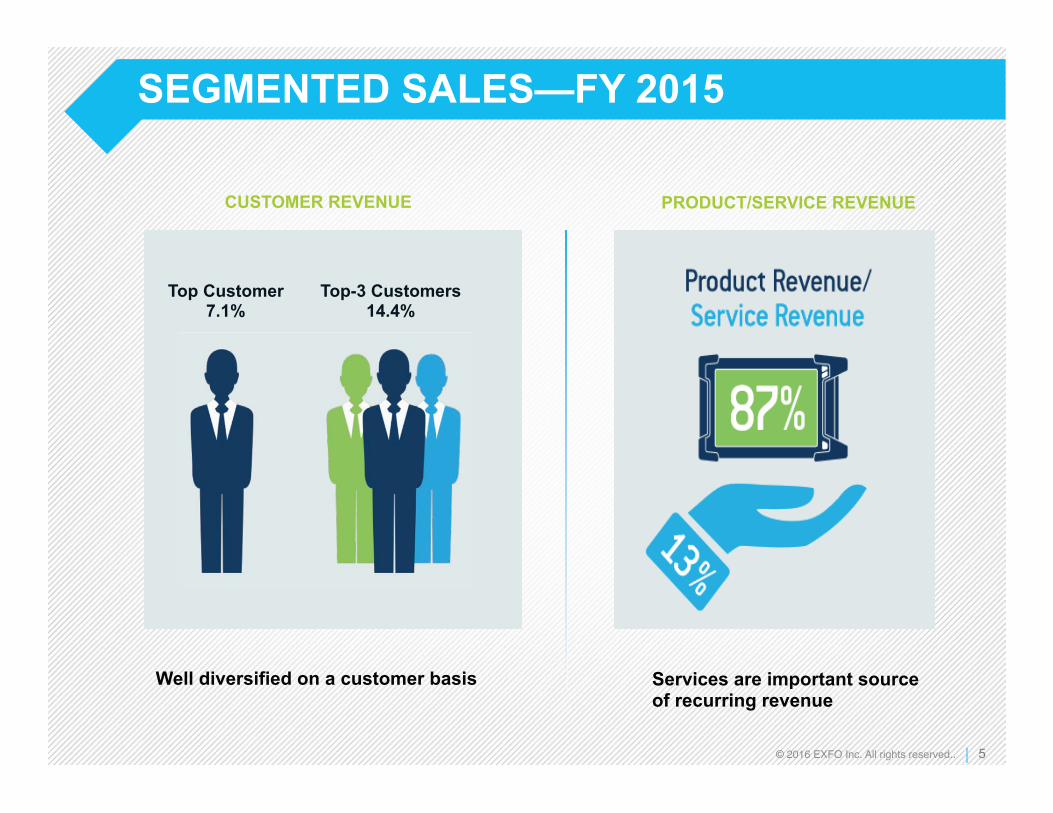
SEGMENTED SALES—FY 2015
Services are important source of recurring revenue
PRODUCT/SERVICE REVENUE
Well diversified on a customer basis
CUSTOMER REVENUE
Top Customer 7.1%
Top-3 Customers 14.4%

6 © 2016 EXFO Inc. All rights reserved.
E2E ANALYTICS SOLUTION
FULLY INTEGRATED ACTIVE/PASSIVE SA
UNIFIED SOFTWARE ARCHITECTURE
6
KEY TRANSFORMATIONS
© 2016 EXFO Inc. All rights reserved..
7 © 2016 EXFO Inc. All rights reserved. 7 © 2016 EXFO Inc. All rights reserved.
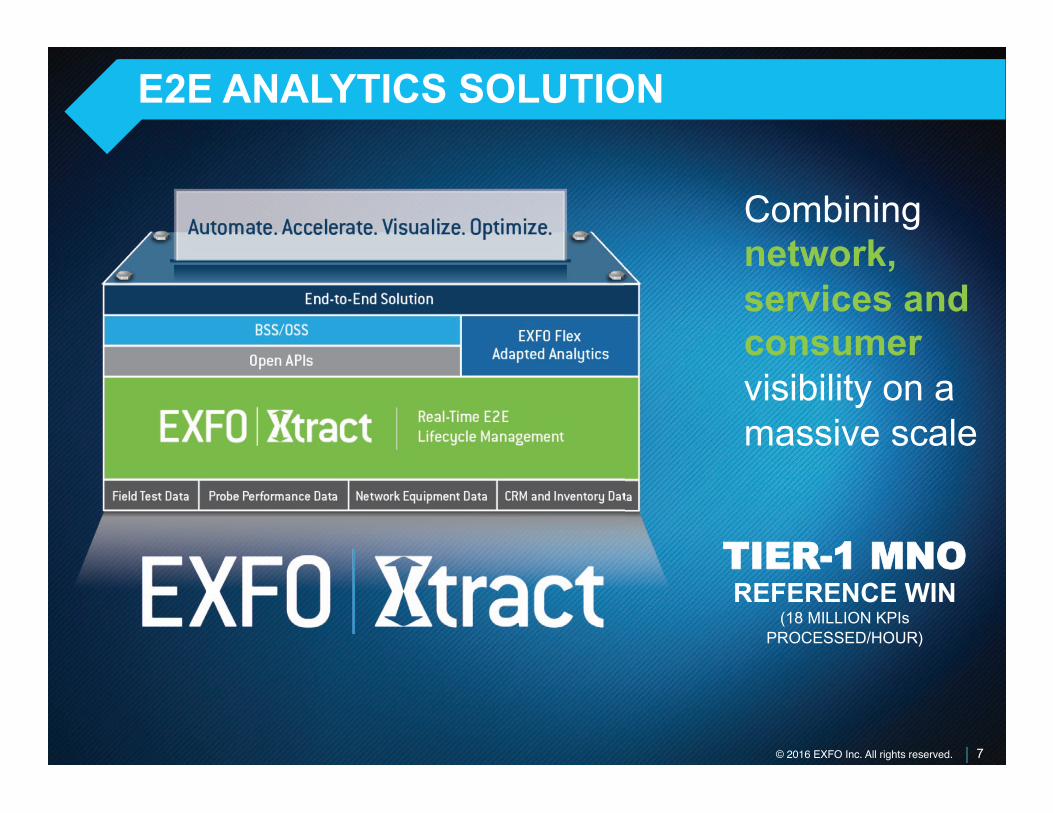
TTIIEERR--11 MMNNOO REFERENCE WIN
(18 MILLION KPIs PROCESSED/HOUR)
Combining network, services and consumer visibility on a massive scale
E2E ANALYTICS SOLUTION

8 © 2016 EXFO Inc. All rights reserved..
STRENGTHENING MANAGEMENT TEAM
Philippe Morin
› Former Ciena and Nortel executive
› Joined EXFO as COO in November
› Global sales, Mar/Com and product strategy
Objectives
› Enhance sales and go-to-market strategies
› Accelerate executive selling of solutions
› Develop market-specific strategies
› Sustain long-term direction and succession planning
8© 2016 EXFO Inc. All rights reserved..© ©
s
n

9 © 2016 EXFO Inc. All rights reserved..
CONSUMER AND BUSINESS TRENDS
By 2021…
COMMUNICATION SERVICES
VIDEO AUGMENTED REALITY
CONNECTED CARS
HEALTHCARE INTERNET OF THINGS
MOBILITY | BROADBAND | CLOUD
Source: Ericsson Mobility Report, November 2015
› 9.1B mobile subscribers
› 7.7B mobile broadband subscribers
› 28B connected devices
› 10X mobile data traffic growth (from 2015)

10 © 2016 EXFO Inc. All rights reserved..
NETWORK OPERATORS’ MULTIPLE CHALLENGES
“The No. 1 reason a customer leaves is because of network quality, No. 2 is price.”
Source: VZW CFO
“Quality is having access to the network anytime, anywhere. The provider is responsible for this.”

11 © 2016 EXFO Inc. All rights reserved. 11 © 2016 EXFO Inc. All rights reserved.
NETWORK OPERATORS’ MULTIPLE CHALLENGES R
EV
EN
UE
S
OP
EX
& C
AP
EX
User Aware
Secure ure
Faster
NFV & DC
ter
Content

12 © 2016 EXFO Inc. All rights reserved. 12 © 2016 EXFO Inc. All rights reserved.
MAJOR OPPORTUNITIES FOR EXFO
FIELD AUTOMATION › Operational efficiency › Deploy services faster › Reduce time-to-revenue
QoE + E2E VISIBILITY
› QoE and retention › Reduce service costs › Prioritize and predict › Simplify operations
FIBER EVERYWHERE
› … rich in the core › … deeper in access › … to-the-home › … to-the-antenna
High-Speed, NFV, Cloud, Data Centers › NFV + H/W co-exist › Service complexity › Operational cost › QoE and retention
› World No.1 in portable test › Consistent share gains › Frost & Sullivan Market Leadership Award for 2015 › Major new offerings
› EXFO Connect penetration › iOLM, FIP, etc. › TestFlow™ process automation › Wins at tier-1 MNO … more to come
› Active/Passive + analytics › Both NFV + HW-centric › NFV driving active SA › Xtract: Major wins & funnel
› NFV ready for deployment › 100G+ growth (labs & field) › Web-scale + data centers › Driving active/analytics opportunities
RELEVANCE TO EXFO

13 © 2016 EXFO Inc. All rights reserved. 13 © 2016 EXFO Inc. All rights reserved..
GROWTH STRATEGY TOP-LINE DRIVEN: BOLSTER SALES AND GROSS MARGIN
TRANSFORM Into a solutions partner. Customers seeking E2E solutions to enhance network performance and service experience quality.
EXPAND Share of wallet with tier-1 network operators. Top-15 operators account for lion’s share of capital spending.
ACCELERATE Penetration of data center, Cloud and web-scale operator markets. Web-scale operators spending at a faster rate than network operators.
INCREASE Wireless presence. Bookings to wireless customers reached 30-32% of total bookings in FY 2015.

14 © 2016 EXFO Inc. All rights reserved..
PROFITABILITY TARGET
1 Adjusted EBITDA represents net earnings before interest, income taxes, deprecia<on and amor<za<on, stock-‐based compensa<on costs and foreign exchange gain or loss.
REDUCED OPEX FROM RESTRUCTURING AND CURRENCY TRENDS
$3.5M
BETTER PRODUCT AND GEOGRAPHICAL MIX
ADJUSTED EBITDA1
>40% Growth YoY
$20M
FY 2016
REQUIRES ~3% YoY REVENUE GROWTH
GOOD START IN Q1/16. ADJ. EBITDA TYPICALLY STRONGER IN H2.
$5.3M
15 © 2016 EXFO Inc. All rights reserved..
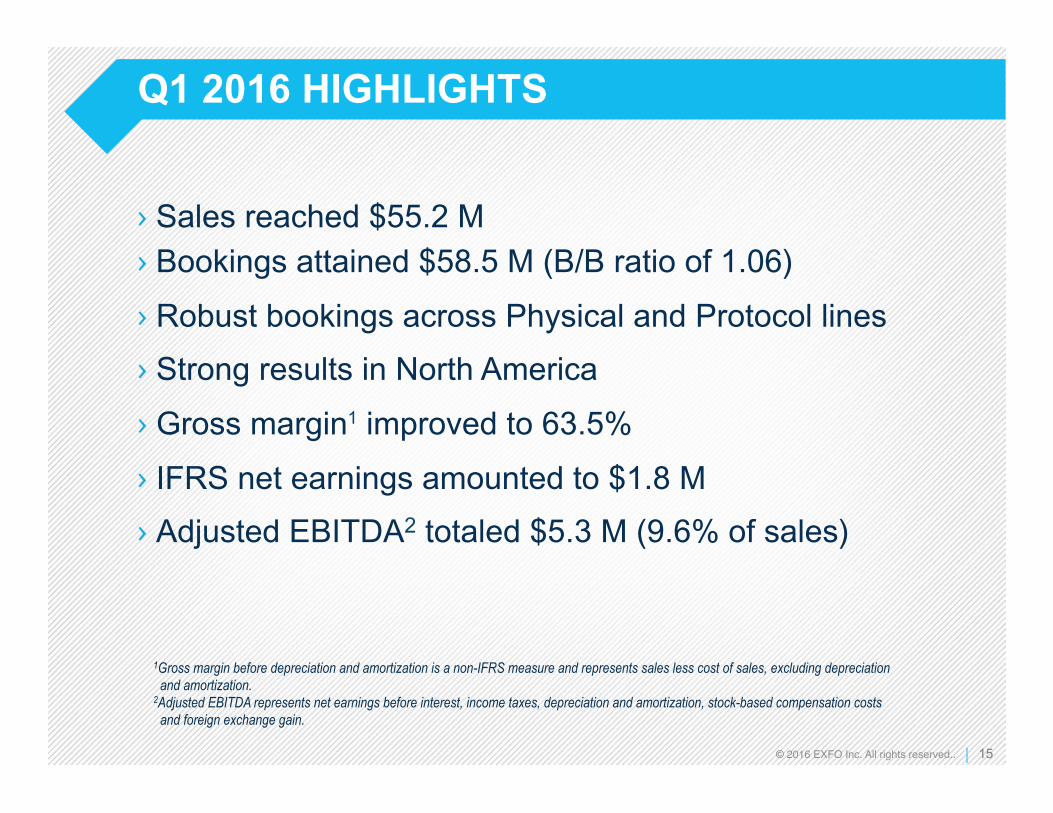
Q1 2016 HIGHLIGHTS
› Sales reached $55.2 M
› Bookings attained $58.5 M (B/B ratio of 1.06)
› Robust bookings across Physical and Protocol lines
› Strong results in North America
› Gross margin1 improved to 63.5%
› IFRS net earnings amounted to $1.8 M
› Adjusted EBITDA2 totaled $5.3 M (9.6% of sales)
1Gross margin before depreciation and amortization is a non-IFRS measure and represents sales less cost of sales, excluding depreciation and amortization. 2Adjusted EBITDA represents net earnings before interest, income taxes, depreciation and amortization, stock-based compensation costs and foreign exchange gain.

16 © 2016 EXFO Inc. All rights reserved. 16 © 2016 EXFO Inc. All rights reserved.
QUESTIONS?