Exercise Stress Testing: Cardiovascular or Respiratory ... Stress Testing - NRRCC 2007.pdf ·...
48
Exercise Stress Testing: Cardiovascular or Respiratory Limitation? Marshall B. Dunning III, Ph.D., M.S. Professor of Medicine & Physiology Medical College of Wisconsin
Transcript of Exercise Stress Testing: Cardiovascular or Respiratory ... Stress Testing - NRRCC 2007.pdf ·...

Exercise Stress Testing:Cardiovascular or Respiratory Limitation?
Marshall B. Dunning III, Ph.D., M.S.Professor of Medicine & Physiology
Medical College of Wisconsin
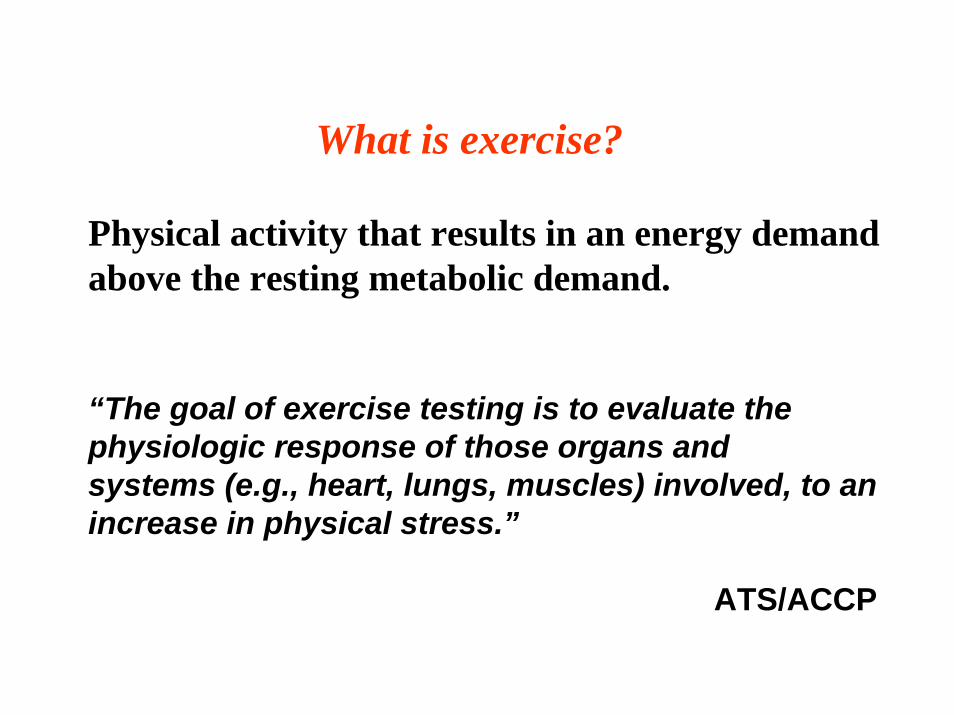
What is exercise?
Physical activity that results in an energy demandabove the resting metabolic demand.
“The goal of exercise testing is to evaluate thephysiologic response of those organs andsystems (e.g., heart, lungs, muscles) involved, to anincrease in physical stress.”
ATS/ACCP

“Clinical exercise testing is plagued by a lackof standardization.
…..there is a lack of agreement as to how anexercise test should be carried out, whatmeasurements should be made, how to interpretthe results, and what clinical use can be madeof them.”
Norman L. Jones, M.D.McMaster UniversityHamilton, Ontario
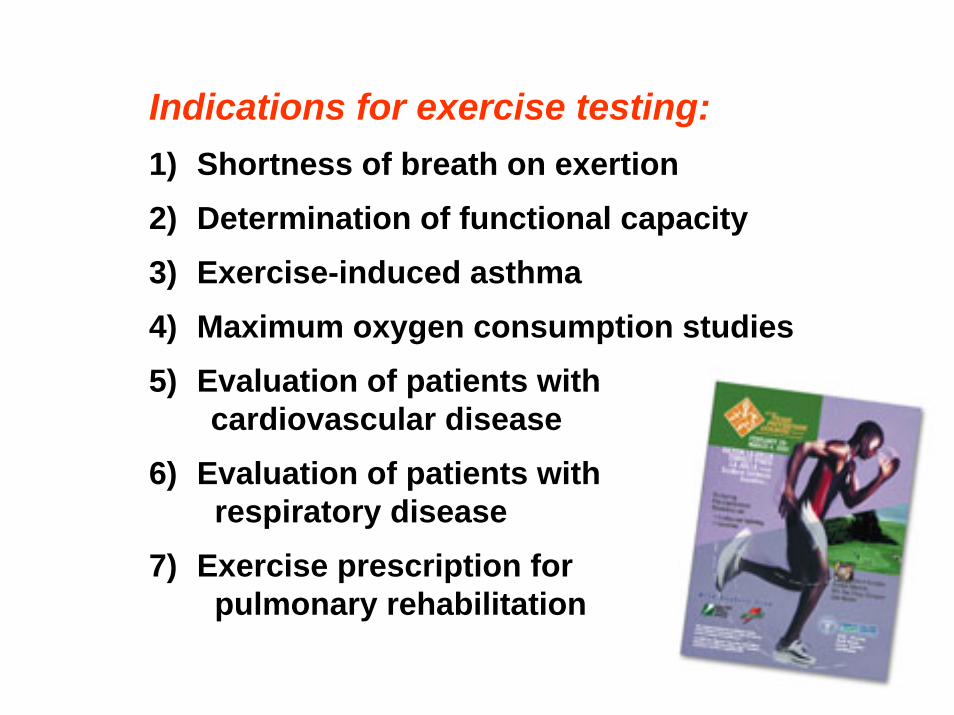
Indications for exercise testing:1) Shortness of breath on exertion2) Determination of functional capacity3) Exercise-induced asthma4) Maximum oxygen consumption studies5) Evaluation of patients with
cardiovascular disease6) Evaluation of patients with
respiratory disease7) Exercise prescription for
pulmonary rehabilitation

EXERCISE MODALITIES• Stair Climbing• Master Two-Step Test• 6 Minute Walk Test• Treadmill• Cycle Ergometer• Shuttle Walking
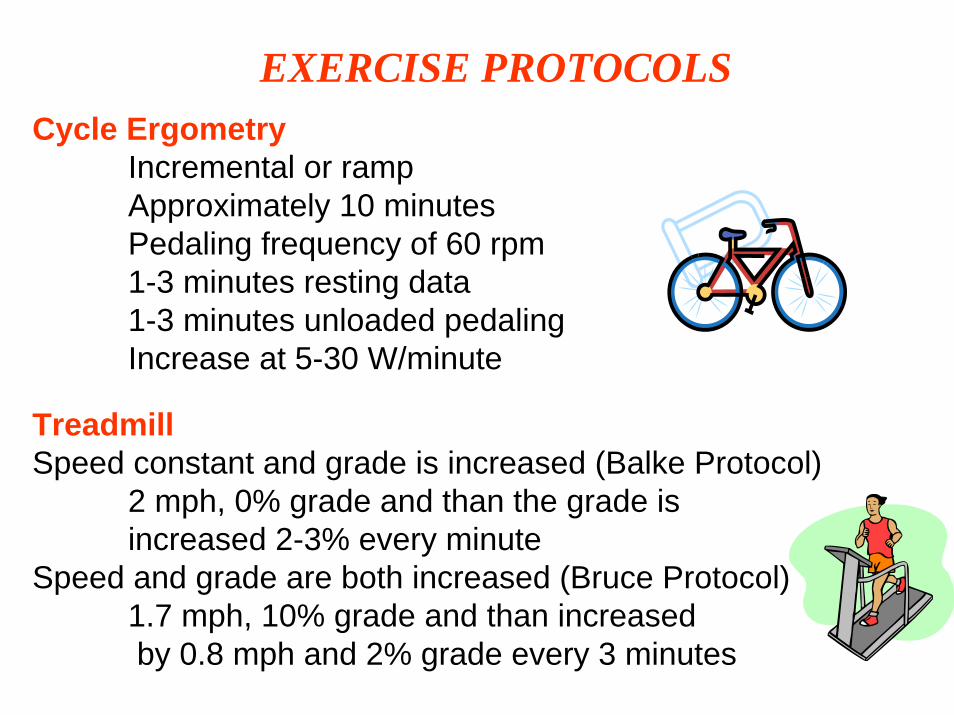
EXERCISE PROTOCOLSCycle Ergometry
Incremental or rampApproximately 10 minutesPedaling frequency of 60 rpm1-3 minutes resting data1-3 minutes unloaded pedalingIncrease at 5-30 W/minute
Treadmill Speed constant and grade is increased (Balke Protocol)
2 mph, 0% grade and than the grade is increased 2-3% every minute
Speed and grade are both increased (Bruce Protocol)1.7 mph, 10% grade and than increasedby 0.8 mph and 2% grade every 3 minutes

Comparison of Cycle versus Treadmill
Cycle Treadmill.VO2 max lower higherLeg muscle fatigue often limits less limitingWork rate quantification yes estimationWeight bearing in obese less moreNoise and artifacts less moreSafety issues less more

During exercise there are increases in:Heart rateOxygen extractionCardiac outputOxygen uptakeCarbon dioxide outputArterial blood pressureMinute ventilationAlveolar ventilationOxygen pulseRQ and RERMETS
During exercise there are decreases in:VD/VT

Respiratory response to incremental work or exercise (Source: Physiology Secrets, 2nd ed., Raff H, Hanley & Belfus, Inc., Philadelphia, 2003)
Watts
f and VT increase to about 70-80% of peak exercise, thereafter f
VT plateaus at 50-60% of VC

Maximal Oxygen Uptake (VO2max)Represents the highest VO2 reached for a given form of exercise, as evidenced by a failure for VO2 to increase further despite an increase in work rate. VO2max is best index of aerobic capacity and gold standard for cardiopulmonary fitness.
Maximum Oxygen Uptake (VO2peak)Represents the highest VO2 reached for a given, presumed maximalexercise effort.
Generally VO2max and VO2peak areused interchangeably.

Oxygen Consumption: the amount of oxygen used perminute
250 mL/min at rest (3.5 mL/min/kg)5,000 mL/min at strenuous exercise (>70 mL/min/kg)
Cost of Ventilation: that portion of total oxygenconsumption utilized by the respiratory muscles.
2-5% of VO2 at rest.>30% of VO2 during exercise
“Respiratory steal” phenomenon

Effect of exercise on oxygen consumption and ventilatory rate. (Redrawn from Gray JS: Pulmonary Ventilation and Its Physiological Regulation. Springfield, IL: Charles C Thomas, 1950. Figure 84-6, Guyton, pg. 1061
Ventilatory Equivalents. . . .VE/VO2 VE/VCO2

ANAEROBIC THRESHOLD“Exercise VO2 that marks the transition between no change orlittle change in arterial lactate concentration and the sustained increase in concentration of lactate.”
ATS/ACCPLactate ThresholdLactic Acid ThresholdGas Exchange ThresholdVentilatory Threshold
Estimates the onset of metabolic acidosis caused predominantly by the increased rate of arterial lactate during exercise.

Fig 2-2. Gas Exchange During Aerobic and Anaerobic Exercise (Source: Principles of ExerciseTesting and Interpretation, Wasserman et al, Lea & Febiger Publishers, Philadelphia, 1994)

ANAEROBIC THRESHOLD (AT)
Blood lactate concentration as a function of incremental exercise (Source: Physiology Secrets, 2nd ed., Raff H, Hanley & Belfus, Inc., Philadelphia, 2003)
AT is generally referenced to the VO2 at which the change occurs, i.e., the rate of change in arterial lactate rapidly rises.
Normal:.
50-60% of VO2 (35-80% range)

V-Slope Method
VO2 at which the change in slope of therelationship of VCO2 to VO2 occurs
S1 = VCO2 increases as arelatively linear functionof VO2
S2 = increase in CO2 dueto buffering of lactic acid

Respiratory Quotient (RQ)-ratio of CO2 production to oxygen consumption-used to estimate ‘fuels’ used for metabolic processes
RQ = 1.0 primarily carbohydratesRQ = 0.7 carbohydrates and fatRQ = 0.8 carbohydrates and protein
Respiratory Exchange Ratio (RER)-ratio of CO2 output by the lungs to O2 uptake-in homeostasis will equal RQ

.RQ = CO2 production = VCO2 .
O2 consumption VO2
RQ = 0.20 L/min = 0.800.25 L/min
RQ = 3.85 L/min = 1.123.45 L/min
RER = CO2 outputO2 uptake

METS
Metabolic equivalent: used to estimate the metaboliccost of physical activity
1 MET = 3.5 mL of O2 uptake/min/kg
1 MET rest4 METS housework, bowling6 METS farming, tennis8 METS heavy manual labor, skiing12 METS hockey18 METS rowing, swimming
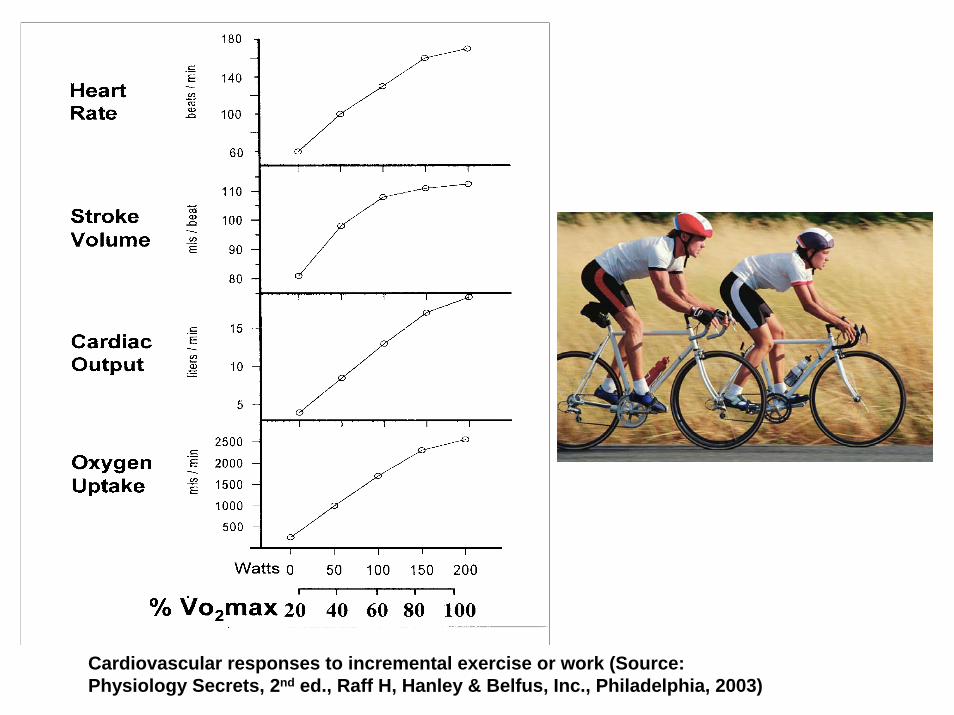
Cardiovascular responses to incremental exercise or work (Source: Physiology Secrets, 2nd ed., Raff H, Hanley & Belfus, Inc., Philadelphia, 2003)

OXYGEN PULSE
. O2 pulse = VO2 = 250 mL/min = 3.5 mL O2/beat
HR 72 bpm .
O2 pulse = VO2 = 3450 mL/min = 20.9 mL O2/beatHR 165 bpm
Used to ‘estimate’ stroke volume

Fig 2-29. Breath-by-Breath Measurements During Exercise (Source: Principles of ExerciseTesting and Interpretation, 4th ed., Wasserman et al, LWW Publishers, Philadelphia, 2005)

VENTILATORY LIMITATIONVE (70-80%)f (<60)BR (20-30%)
CARDIOVASCULAR LIMITATIONECGBlood pressure responseO2 pulse
GAS EXCHANGE LIMITATIONSaO2 or SpO2 (<4%)PaO2 (<10 mmHg)A-a gradient (<35 mmHg)

Maximal or submaximal stress test?
Subjective;Chest painFatigueShortness of breath
Objective;Heart rate (>90% of predicted)RQ (>1.15)

Did patient reach AT????
Direct:•increase in lactate >4 mmol/L or mEq/L
Indirect:•decrease in HCO3 >4 mmol/L or mEq/L
•V-slope
•RER (RQ) >1.1

Heart Rate Reserve
HRR (bpm) = Pred HRmax – HR at max
HRR (%) = Pred HRmax – HR at max X 100Pred HRmax
Predicted Heart Rate = 185HR at maximum exercise = 165
HRR (bpm) = 185 – 165 = 20 bpm
HRR (%) = 185 – 165 X 100 = 11% 185
(Normal = 0)

Breathing Reserve
BR (L/min) = MVV – VE
BR = 125 – 100 = 25 L/min
BR (%) = MVV – VE X 100MVV
BR = 125 –100 X 100 = 20%125
(Normal = 20-30%)

Variable Normal Clinical SignificanceVO2 max (peak) >84% Decreased in heart failure, COPD, ILD,
obesity, pulmonary vascular disease, and deconditioned.
AT >40% VO2max Decreased in heart failure, COPD, ILD, pulmonary vascular disease, and deconditioned.Normal in obesity.
Heart Rate
Heart Rate Reserve
>90%
<15 beats/min
Decreased in COPD, obesity, pulmonary vascular disease, and deconditioned.Normal in heart failure.
Oxygen Pulse >80% Decreased in heart failure, COPD, ILD, pulmonary vascular disease, and deconditioned.Normal in obesity.
VE max
Frequency
Ventilatory or Breathing Reserve
70 – 80%
<60 bpm
20 – 30%
Increased or normal in heart failure, COPD, ILD, obesity, pulmonary vascular disease, and deconditioned.

Variable Normal Clinical SignificanceSaO2 >95%
<4% decrease
Decreased in ILD and pulmonary vascular disease.Normal in heart failure, obesity and deconditioned.
PaO2 >80 mmHg
<10 mmHg fall
Decreased in ILD and pulmonary vascular diseaseNormal in heart failure, obesity and deconditioned.
P(A-a)O2 <35 mmHg Increased in COPD, ILD, and pulmonary vascular disease.Normal in heart failure and deconditioned.
VD/VT <0.28 Increased in heart failure, COPD, ILD, pulmonary vascular disease, and normal in obesity and deconditioned.
VE/VCO2 (at AT) <34 Increased in heart failure, COPD, ILD, and pulmonary vascular disease.Normal in obesity and deconditioned.

American Thoracic Society/American College of Chest Physicians: Statement on cardiopulmonary exercise testing. Am J Respir Crit Care Med 167:211-277, 2003.
CASE STUDY #1
Normal Exercise Limitation: normal VO2, HR, O2 pulse, VE, fR, VE/VCO2,and SpO2

American Thoracic Society/American College of Chest Physicians: Statement on cardiopulmonary exercise testing. Am J Respir Crit Care Med 167:211-277, 2003.
CASE STUDY #2
Cardiovascular Exercise Limitation: decreased VO2 and O2 pulse, normal VE and fR, increased VE/VCO2 at AT (i.e., V/Q mismatch)

American Thoracic Society/American College of Chest Physicians: Statement on cardiopulmonary exercise testing. Am J Respir Crit Care Med 167:211-277, 2003.
CASE STUDY #3
Ventilatory Exercise Limitation: decreased VO2, increased VE (i.e., noventilatory reserve) with normal fR, increased VE/VCO2 at AT (i.e., V/Q mismatch), decreased SaO2 and PaO2 with exercise

American Thoracic Society/American College of Chest Physicians: Statement on cardiopulmonary exercise testing. Am J Respir Crit Care Med 167:211-277, 2003.
CASE STUDY #4
Ventilatory Exercise Limitation: decreased VO2, increased VE (i.e., 7%ventilatory reserve) with normal fR, increased VE/VCO2 at AT (i.e., V/Q mismatch), decreased SaO2 and PaO2 with exercise

American Thoracic Society/American College of Chest Physicians: Statement on cardiopulmonary exercise testing. Am J Respir Crit Care Med 167:211-277, 2003.
Cardiovascular with Borderline Ventilatory Exercise Limitation:decreased VO2 and O2 pulse, normal VE with increased fR, increased VE/VCO2 at AT (i.e., V/Q mismatch), borderline decrease in SaO2 and PaO2
CASE STUDY #5
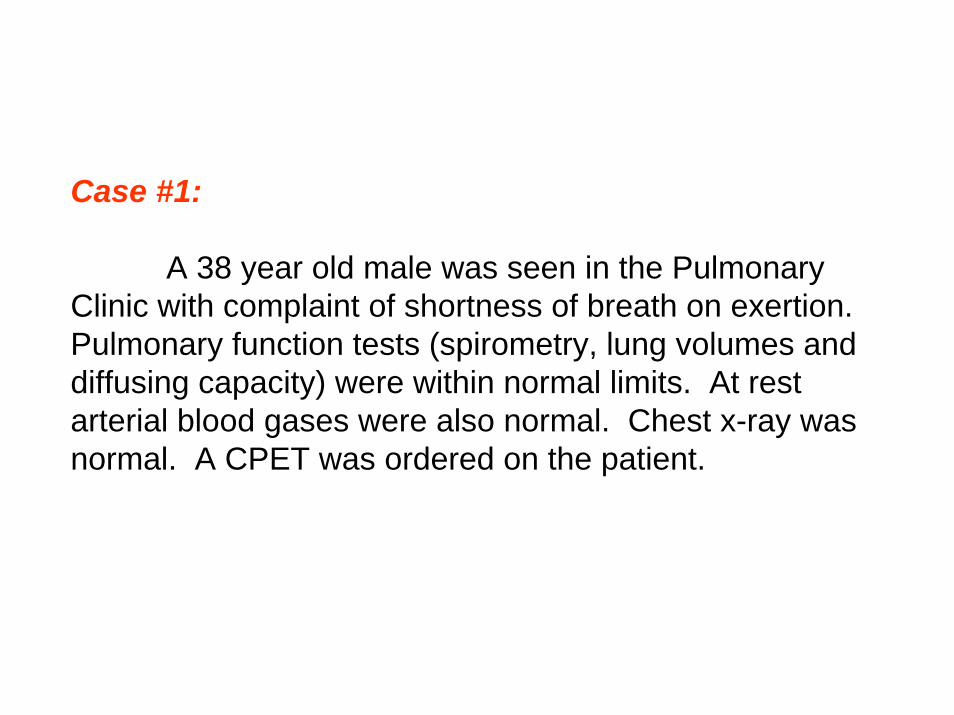
Case #1:
A 38 year old male was seen in the Pulmonary Clinic with complaint of shortness of breath on exertion. Pulmonary function tests (spirometry, lung volumes and diffusing capacity) were within normal limits. At rest arterial blood gases were also normal. Chest x-ray was normal. A CPET was ordered on the patient.


VO2 at AT = 77%

The results of the CPET:1) are within normal limits2) reveal a ventilatory limitation to exercise3) reveal a cardiovascular limitation to exercise4) reveal a gas exchange abnormality

CPET is within normal limits:VE 70-80% (75%) SaO2 <4% decrease (96.1 to 95.2)RR or respiratory rate <60 (49) PaO2 <10 mmHg decrease (92.9 to 88.6)BR 20-30% (25) A-a gradient <35 mmHg (19.4)O2 pulse >10 mL O2/beat (14.1)

Case #2:
A 29 year old male was seen in the Asthma/Allergy Clinic complaining of recent shortness of breath on exertion. Pulmonary function tests revealed normal spirometry and lung volumes, with a mild decrease in the diffusing capacity. At rest arterial blood gases on room air were normal. Chest x-ray was normal. A CPET was ordered on the patient.

The results of the CPET:1) are within normal limits2) reveal a ventilatory limitation to exercise3) reveal a cardiovascular limitation to exercise4) reveal a gas exchange abnormality
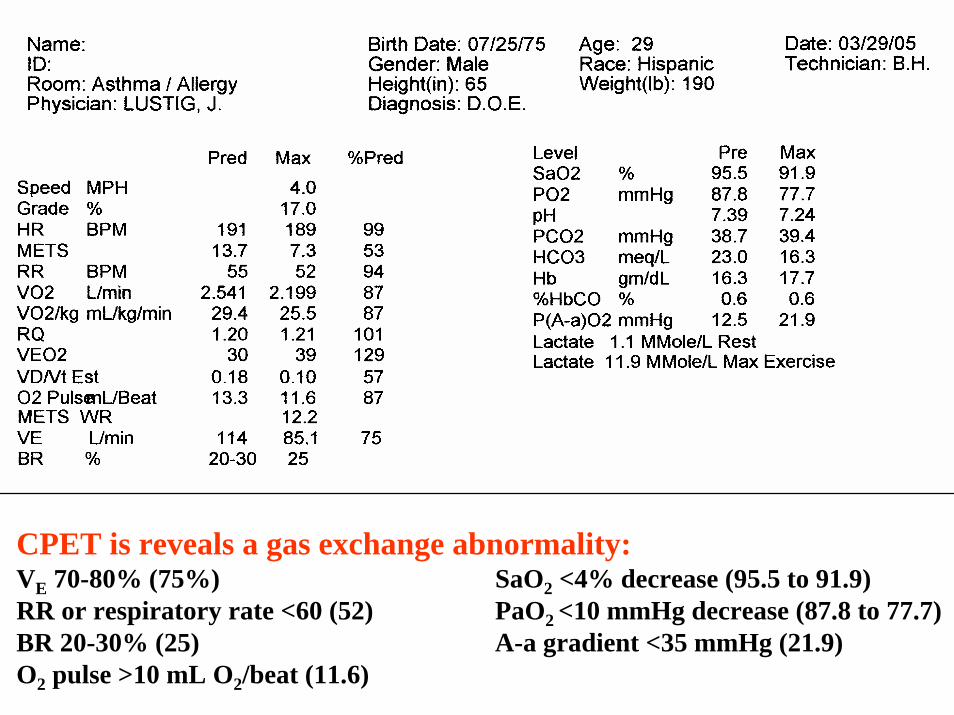
CPET is reveals a gas exchange abnormality:VE 70-80% (75%) SaO2 <4% decrease (95.5 to 91.9)RR or respiratory rate <60 (52) PaO2 <10 mmHg decrease (87.8 to 77.7)BR 20-30% (25) A-a gradient <35 mmHg (21.9)O2 pulse >10 mL O2/beat (11.6)

Case #3:
A 76 year old female was seen in the Pulmonary Hypertension Clinic with complaints of shortness of breath with mild exertion for at least 6 months. Negative smoking history. Pulmonary function tests revealed mild airflow obstruction on spirometry, normal lung volumes, and a mild decrease in the diffusing capacity. A 6-minute walk test was normal with no desaturation. At rest arterial blood gases on room air revealed slight hypoxemia with normal acid-base status. A CPET was ordered on the patient.

The results of the CPET:1) are within normal limits2) reveal a ventilatory limitation to exercise3) reveal a cardiovascular limitation to exercise4) reveal a gas exchange abnormality

CPET is reveals a cardiovascular limitation to exercise:VE 70-80% (52%) SaO2 <4% decrease (95.1 to 95.6)RR or respiratory rate <60 (36) PaO2 <10 mmHg decrease (78.7 to 87.6)BR 20-30% (48) A-a gradient <35 mmHg (20.0)O2 pulse >10 mL O2/beat (5.5)

REFERENCES
1) American Thoracic Society/American College of ChestPhysicians: Statement on cardiopulmonary exercise testing.Am J Respir Crit Care Med 167:211-277, 2003.2) Jones NL: Clinical exercise testing. Philadelphia, WBSaunders Co., 19883) Wasserman K, Hansen JE, Sue DY, Stringer WW, WhippBJ: Principles of exercise testing and interpretation. 4th ed,Philadelphia, LWW, 2005.4) Weisman IM, Zeballos RJ: Clinical exercise testing. Basel,Karger, 2002.