Ceramic Ultrafiltration Membranes with ... - Nanostone Water
R e p r i n t e d f r o m G a l l i k S . , C e l l B i o l o g y O L M P a g e | 1
Copyright © 2011, 2012 by Stephen Gallik, Ph. D. Licensed under a Creative Commons Attribution-NonCommercial-NoDerivs 3.0 Unported License. All text falls under this copyright and license. The only figures that fall under this copyright and license are those sourced to Stephen Gallik, Ph. D. Other figures may be copyrighted by others. Go to the on-line lab manual for image attribution & copyright information. Contact author at [email protected] .
Exercise 4. Determination of the Presence of Water Channels in Mammalian Red Blood Cell Plasma Membrane
A. Introduction
The lipid bilayer is moderately permeable to water, and for many membranes the water permeability of the lipid bilayer is sufficient to meet the water transport demands of the cell. However, for some biological membranes, the water permeability of the lipid bilayer is not high enough to meet water transport needs of the cell. This is particularly true of the plasma membranes of the epithelial cells that line many of the tubules of the kidney. Kidney epithelial cells are specialized for very rapid water transport, and their plasma membranes are ultra-permeable to water, far more permeable than the lipid bilayer. To achieve this high degree of water permeability, their plasma membranes are equipped with special proteins that form water channels, allowing the extremely rapid movement of water across the membrane.
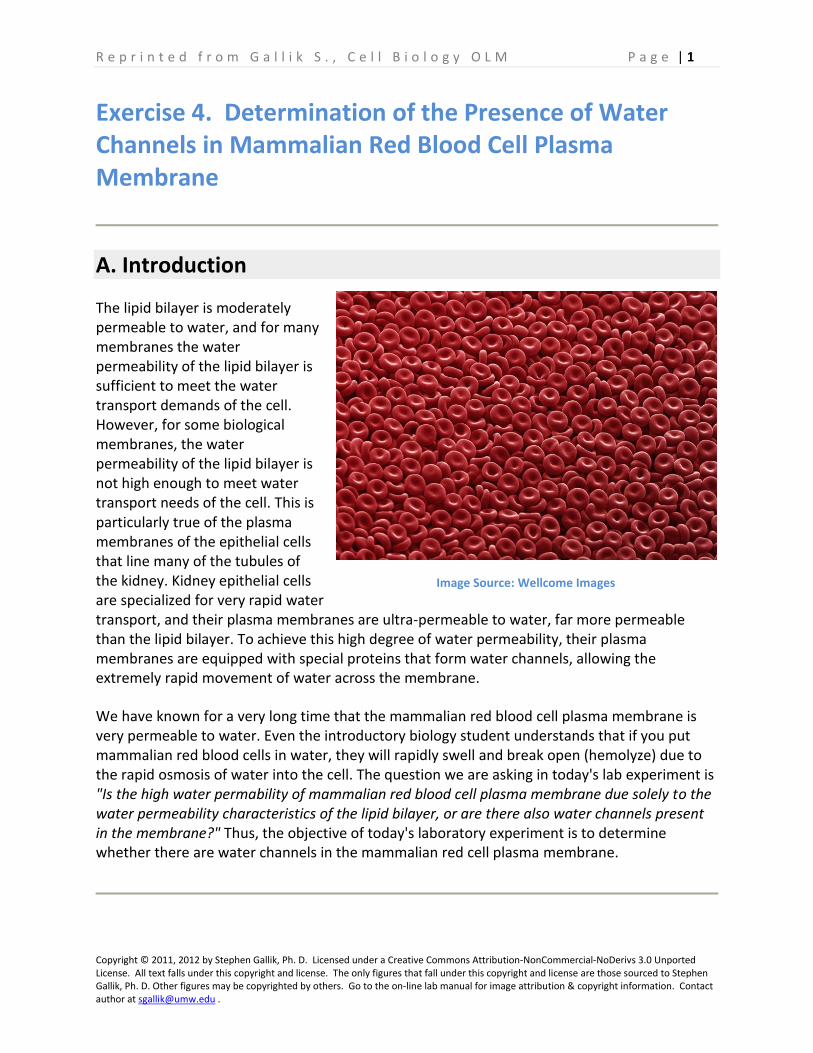
We have known for a very long time that the mammalian red blood cell plasma membrane is very permeable to water. Even the introductory biology student understands that if you put mammalian red blood cells in water, they will rapidly swell and break open (hemolyze) due to the rapid osmosis of water into the cell. The question we are asking in today's lab experiment is "Is the high water permability of mammalian red blood cell plasma membrane due solely to the water permeability characteristics of the lipid bilayer, or are there also water channels present in the membrane?" Thus, the objective of today's laboratory experiment is to determine whether there are water channels in the mammalian red cell plasma membrane.
Image Source: Wellcome Images
R e p r i n t e d f r o m G a l l i k S . , C e l l B i o l o g y O L M P a g e | 2
Copyright © 2011, 2012 by Stephen Gallik, Ph. D. Licensed under a Creative Commons Attribution-NonCommercial-NoDerivs 3.0 Unported License. All text falls under this copyright and license. The only figures that fall under this copyright and license are those sourced to Stephen Gallik, Ph. D. Other figures may be copyrighted by others. Go to the on-line lab manual for image attribution & copyright information. Contact author at [email protected] .
B. Osmosis Across Biological Membranes
Osmotic Equilibrium Across Biological Membranes
Biological membranes are inherently semipermeable. That is, they are permeable to water and other substances, but impermeable to certain water-soluble solutes, including all charged molecules (ions), such as Na+, K+, Cl- and Ca++, just to name a few.
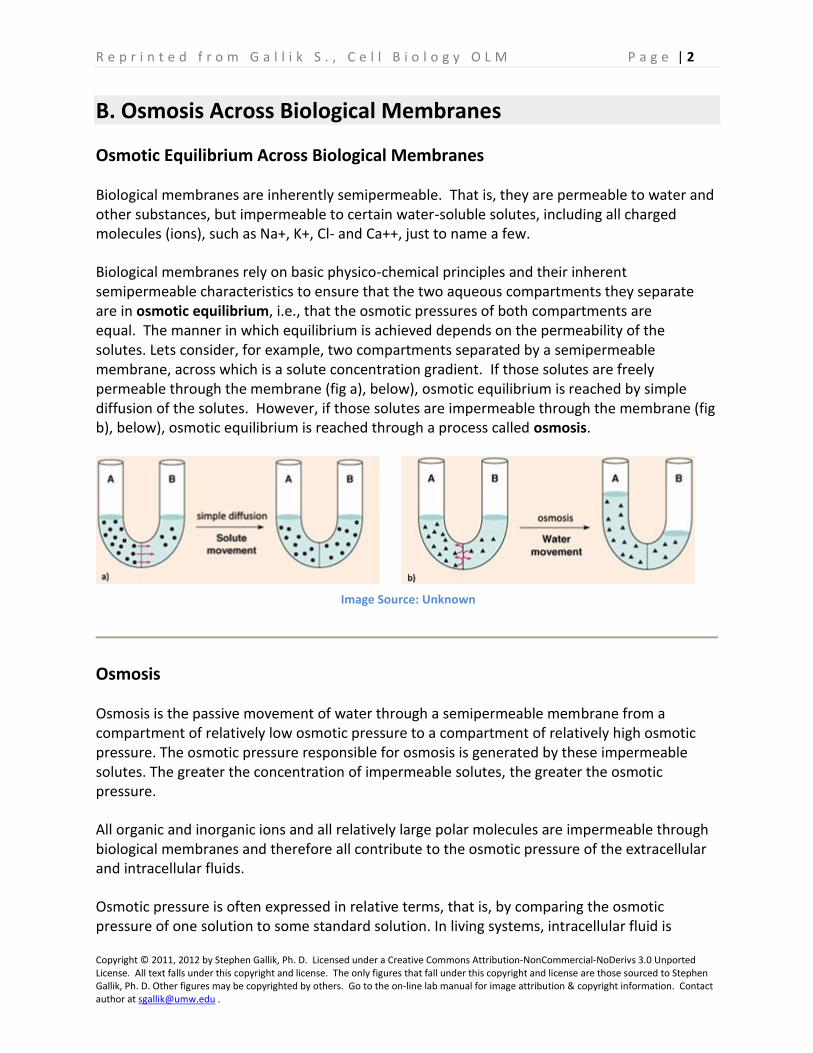
Biological membranes rely on basic physico-chemical principles and their inherent semipermeable characteristics to ensure that the two aqueous compartments they separate are in osmotic equilibrium, i.e., that the osmotic pressures of both compartments are equal. The manner in which equilibrium is achieved depends on the permeability of the solutes. Lets consider, for example, two compartments separated by a semipermeable membrane, across which is a solute concentration gradient. If those solutes are freely permeable through the membrane (fig a), below), osmotic equilibrium is reached by simple diffusion of the solutes. However, if those solutes are impermeable through the membrane (fig b), below), osmotic equilibrium is reached through a process called osmosis.
Osmosis
Osmosis is the passive movement of water through a semipermeable membrane from a compartment of relatively low osmotic pressure to a compartment of relatively high osmotic pressure. The osmotic pressure responsible for osmosis is generated by these impermeable solutes. The greater the concentration of impermeable solutes, the greater the osmotic pressure.
All organic and inorganic ions and all relatively large polar molecules are impermeable through biological membranes and therefore all contribute to the osmotic pressure of the extracellular and intracellular fluids.
Osmotic pressure is often expressed in relative terms, that is, by comparing the osmotic pressure of one solution to some standard solution. In living systems, intracellular fluid is
Image Source: Unknown
R e p r i n t e d f r o m G a l l i k S . , C e l l B i o l o g y O L M P a g e | 3
Copyright © 2011, 2012 by Stephen Gallik, Ph. D. Licensed under a Creative Commons Attribution-NonCommercial-NoDerivs 3.0 Unported License. All text falls under this copyright and license. The only figures that fall under this copyright and license are those sourced to Stephen Gallik, Ph. D. Other figures may be copyrighted by others. Go to the on-line lab manual for image attribution & copyright information. Contact author at [email protected] .
generally considered the standard by which all other biological fluids are compared. Solutions that have an osmotic pressure equal to that of intracellular fluid are said to be isotonic. Hypotonic fluids have an osmotic pressure less than that of cellular fluids, and hypertonic fluids have an osmotic pressure greater than that of cellular fluids.
NaCl solutions can be formulated to meet these definitions. For example, a 0.85% NaCl solution is isotonic to mammalian cells. Any NaCl solution that has a NaCl concentration significantly less than 0.85% is considered hypotonic, and any NaCl solution that has a NaCl concentration significantly greater than 0.85% is considered hypertonic.
Osmotic Equilibrium Across the Red Blood Cell Plasma Membrane
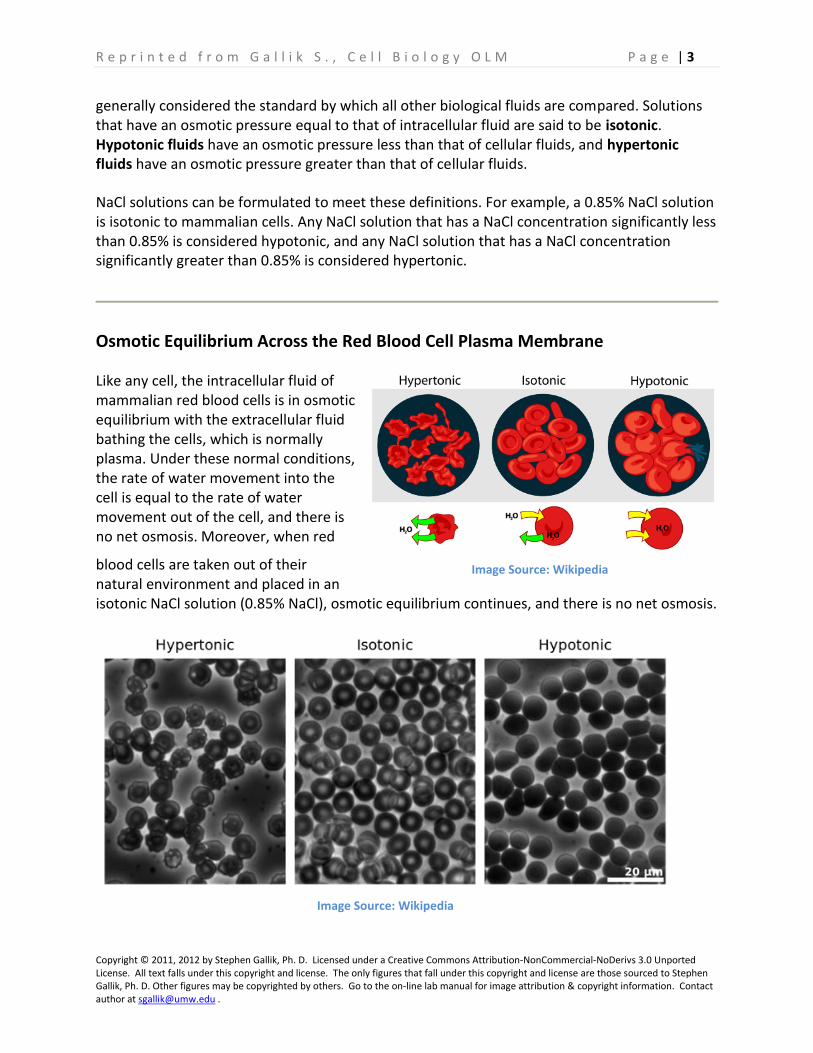
Like any cell, the intracellular fluid of mammalian red blood cells is in osmotic equilibrium with the extracellular fluid bathing the cells, which is normally plasma. Under these normal conditions, the rate of water movement into the cell is equal to the rate of water movement out of the cell, and there is no net osmosis. Moreover, when red
blood cells are taken out of their natural environment and placed in an isotonic NaCl solution (0.85% NaCl), osmotic equilibrium continues, and there is no net osmosis.
Image Source: Wikipedia
Image Source: Wikipedia
R e p r i n t e d f r o m G a l l i k S . , C e l l B i o l o g y O L M P a g e | 4
Copyright © 2011, 2012 by Stephen Gallik, Ph. D. Licensed under a Creative Commons Attribution-NonCommercial-NoDerivs 3.0 Unported License. All text falls under this copyright and license. The only figures that fall under this copyright and license are those sourced to Stephen Gallik, Ph. D. Other figures may be copyrighted by others. Go to the on-line lab manual for image attribution & copyright information. Contact author at [email protected] .
However, when red blood cells are placed in a sufficiently-strong hypertonic fluid (e.g. NaCl solution >> 0.85% NaCl), since Na+ and Cl- are impermeable through the membranes, osmotic equilibrium is achieved through osmosis - there is a net outward osmosis and the cells shrink (see figure). Conversely, when red blood cells are placed in a sufficiently-strong hypotonic fluid (e.g. NaCl solution << 0.85% NaCl), there is an uncontrolled net inward osmosis, resulting in the continuous uncontrolled swelling of the cells. Depending on how hypotonic the fluid, a certain percentage of the cells will swell until they break open, a process known as hemolysis (the lysis of red blood cells).
Hemolysis in Hypotonic NaCl Solutions
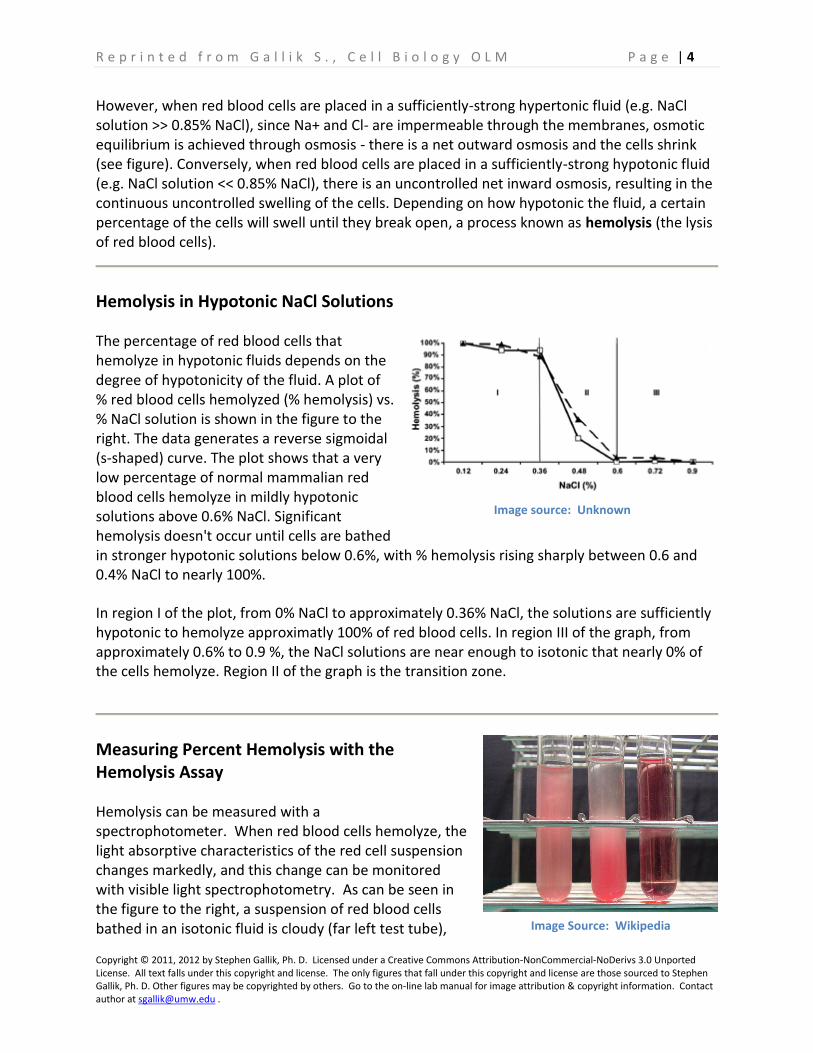
The percentage of red blood cells that hemolyze in hypotonic fluids depends on the degree of hypotonicity of the fluid. A plot of % red blood cells hemolyzed (% hemolysis) vs. % NaCl solution is shown in the figure to the right. The data generates a reverse sigmoidal (s-shaped) curve. The plot shows that a very low percentage of normal mammalian red blood cells hemolyze in mildly hypotonic solutions above 0.6% NaCl. Significant hemolysis doesn't occur until cells are bathed in stronger hypotonic solutions below 0.6%, with % hemolysis rising sharply between 0.6 and 0.4% NaCl to nearly 100%.
In region I of the plot, from 0% NaCl to approximately 0.36% NaCl, the solutions are sufficiently hypotonic to hemolyze approximatly 100% of red blood cells. In region III of the graph, from approximately 0.6% to 0.9 %, the NaCl solutions are near enough to isotonic that nearly 0% of the cells hemolyze. Region II of the graph is the transition zone.
Measuring Percent Hemolysis with the Hemolysis Assay
Hemolysis can be measured with a spectrophotometer. When red blood cells hemolyze, the light absorptive characteristics of the red cell suspension changes markedly, and this change can be monitored with visible light spectrophotometry. As can be seen in the figure to the right, a suspension of red blood cells bathed in an isotonic fluid is cloudy (far left test tube),
Image source: Unknown
Image Source: Wikipedia

R e p r i n t e d f r o m G a l l i k S . , C e l l B i o l o g y O L M P a g e | 5
Copyright © 2011, 2012 by Stephen Gallik, Ph. D. Licensed under a Creative Commons Attribution-NonCommercial-NoDerivs 3.0 Unported License. All text falls under this copyright and license. The only figures that fall under this copyright and license are those sourced to Stephen Gallik, Ph. D. Other figures may be copyrighted by others. Go to the on-line lab manual for image attribution & copyright information. Contact author at [email protected] .
due to the fact that the intact red cells diffuse light as light passes through the tube. Hemolyzed cells do not diffuse light. Therefore, when red blood cells are placed in a strongly hypotonic fluid, however, the solution turns a clear red (far right test tube).
C. Molecular Basis of Water Permeability through Biological Membranes
Water Permeability of the Lipid Bilayer
The components of biological membrane that are are water permeable form the so-called water permeability pathway of the membrane. The lipid bilayer component of all biological membranes is moderately permeable to water and is a universal component of the water permeability pathway in all biological membranes. The fact that the lipid bilayer is moderately permeable to water might surprise some, given the fact that water solubility in lipid is so very low. But despite water's low solubility in lipid, it has been reported that as many as 220,000 water molecules can pass each membrane phospholipid molecule each second. While the physical basis for this moderate water permeability is not clear and continues to be the subject of active debate, the relatively small size of the water molecule along with its uncharged nature undoubtedly are factors.
Water Permeability of Water Channels
While water can pass through the lipid bilayer at a reasonable rate, for some membranes the permeability of the lipid bilayer is not good enough. For example, it is not fast enough for the plasma membrane of cells that specialize in rapid water transport, such as the plasma membrane of kidney epithelial cells. Kidney epithelial cells are responsible for the kidney's ability to conserve water when the body is dehydrated and for the kidney's
Image Source: Wikipedia
Image Source: Wikipedia
R e p r i n t e d f r o m G a l l i k S . , C e l l B i o l o g y O L M P a g e | 6
Copyright © 2011, 2012 by Stephen Gallik, Ph. D. Licensed under a Creative Commons Attribution-NonCommercial-NoDerivs 3.0 Unported License. All text falls under this copyright and license. The only figures that fall under this copyright and license are those sourced to Stephen Gallik, Ph. D. Other figures may be copyrighted by others. Go to the on-line lab manual for image attribution & copyright information. Contact author at [email protected] .
ability to excrete large amounts of water when the body is overly hydrated. Research has shown that the plasma membranes of these cells are far more permeable than the average membrane.
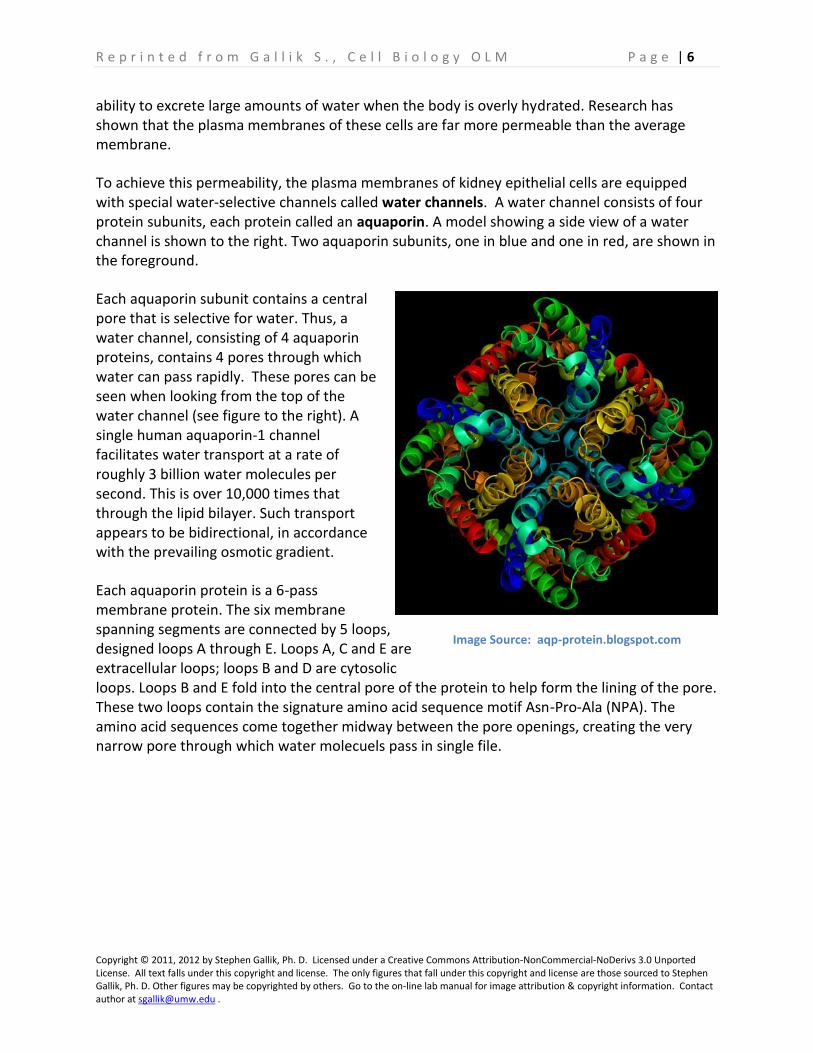
To achieve this permeability, the plasma membranes of kidney epithelial cells are equipped with special water-selective channels called water channels. A water channel consists of four protein subunits, each protein called an aquaporin. A model showing a side view of a water channel is shown to the right. Two aquaporin subunits, one in blue and one in red, are shown in the foreground.
Each aquaporin subunit contains a central pore that is selective for water. Thus, a water channel, consisting of 4 aquaporin proteins, contains 4 pores through which water can pass rapidly. These pores can be seen when looking from the top of the water channel (see figure to the right). A single human aquaporin-1 channel facilitates water transport at a rate of roughly 3 billion water molecules per second. This is over 10,000 times that through the lipid bilayer. Such transport appears to be bidirectional, in accordance with the prevailing osmotic gradient.
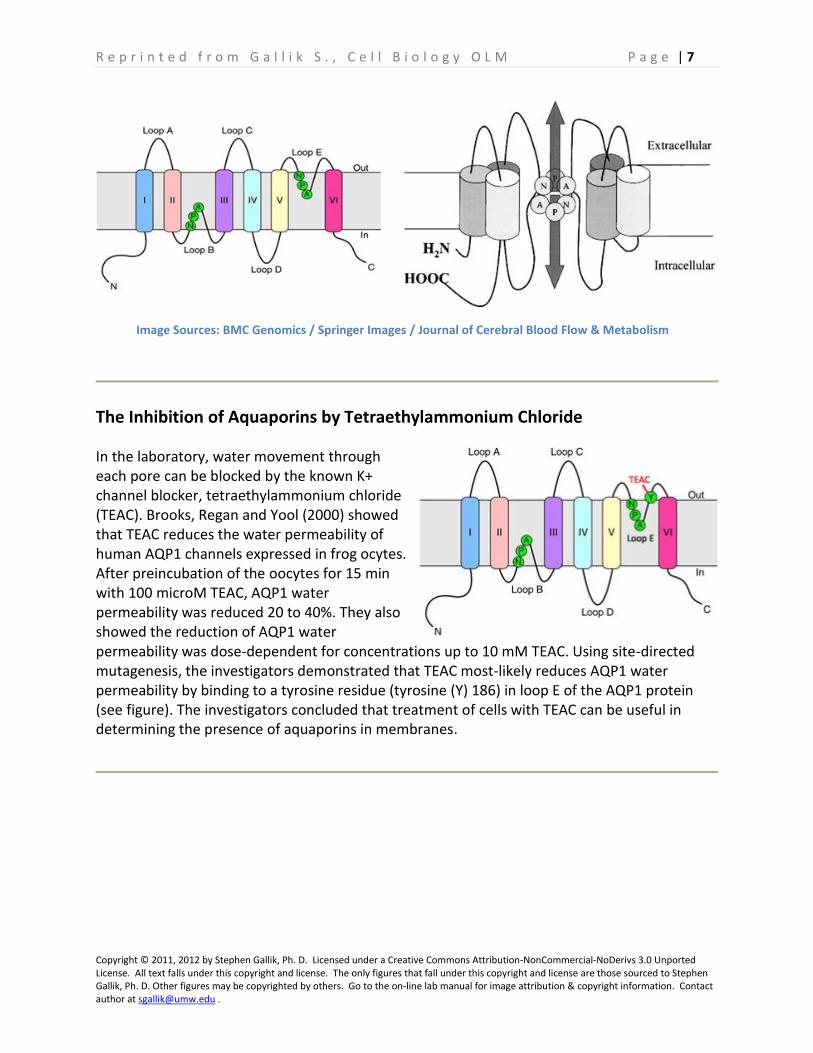
Each aquaporin protein is a 6-pass membrane protein. The six membrane spanning segments are connected by 5 loops, designed loops A through E. Loops A, C and E are extracellular loops; loops B and D are cytosolic loops. Loops B and E fold into the central pore of the protein to help form the lining of the pore. These two loops contain the signature amino acid sequence motif Asn-Pro-Ala (NPA). The amino acid sequences come together midway between the pore openings, creating the very narrow pore through which water molecuels pass in single file.
Image Source: aqp-protein.blogspot.com
R e p r i n t e d f r o m G a l l i k S . , C e l l B i o l o g y O L M P a g e | 7
Copyright © 2011, 2012 by Stephen Gallik, Ph. D. Licensed under a Creative Commons Attribution-NonCommercial-NoDerivs 3.0 Unported License. All text falls under this copyright and license. The only figures that fall under this copyright and license are those sourced to Stephen Gallik, Ph. D. Other figures may be copyrighted by others. Go to the on-line lab manual for image attribution & copyright information. Contact author at [email protected] .
The Inhibition of Aquaporins by Tetraethylammonium Chloride
In the laboratory, water movement through each pore can be blocked by the known K+ channel blocker, tetraethylammonium chloride (TEAC). Brooks, Regan and Yool (2000) showed that TEAC reduces the water permeability of human AQP1 channels expressed in frog ocytes. After preincubation of the oocytes for 15 min with 100 microM TEAC, AQP1 water permeability was reduced 20 to 40%. They also showed the reduction of AQP1 water permeability was dose-dependent for concentrations up to 10 mM TEAC. Using site-directed mutagenesis, the investigators demonstrated that TEAC most-likely reduces AQP1 water permeability by binding to a tyrosine residue (tyrosine (Y) 186) in loop E of the AQP1 protein (see figure). The investigators concluded that treatment of cells with TEAC can be useful in determining the presence of aquaporins in membranes.
Image Sources: BMC Genomics / Springer Images / Journal of Cerebral Blood Flow & Metabolism

R e p r i n t e d f r o m G a l l i k S . , C e l l B i o l o g y O L M P a g e | 8
Copyright © 2011, 2012 by Stephen Gallik, Ph. D. Licensed under a Creative Commons Attribution-NonCommercial-NoDerivs 3.0 Unported License. All text falls under this copyright and license. The only figures that fall under this copyright and license are those sourced to Stephen Gallik, Ph. D. Other figures may be copyrighted by others. Go to the on-line lab manual for image attribution & copyright information. Contact author at [email protected] .
D. This Week’s Experiment
Introduction, The Question Being Asked and The Hypothesis
We have known for a very long time that the mammalian red blood cell plasma membrane is very permeable to water. Even the introductory biology student understands that if you put mammalian red blood cells in water, they will rapidly swell and break open (hemolyze) due to the rapid osmosis of water into the cell. The experimental question we are asking in today's lab experiment is "Is the high water permability of mammalian red blood cell plasma membrane due solely to the lipid bilayer, or are there water channels present in the membrane?"
Hypothesis: Water channels are present in the red blood cell plasma membrane.
Specific Objective of the Experiment and Predictions
The specific objective of today's experiment is determine whether the water permeability of mammalian red blood cell plasma membrane can be inhibited by tetraethylammonium chloride. Inhibition of membrane water permeability is evidence of the presence of water channels in the membrane.
Predictions: The students are asked to write down the predictions prior to lab.
Experimental Design
Each pair of students will receive a volume of sheep whole blood to be divided into an experimental aliquot and a control aliquot. The experimental aliquot will be treated with a small volume of tetraethylammonium chloride (in de-ionized water) for 30 minutes, while the control aliquot will be treated with an equal volume of de-ionized water for 30 minutes.
Image Source: Wikipedia

R e p r i n t e d f r o m G a l l i k S . , C e l l B i o l o g y O L M P a g e | 9
Copyright © 2011, 2012 by Stephen Gallik, Ph. D. Licensed under a Creative Commons Attribution-NonCommercial-NoDerivs 3.0 Unported License. All text falls under this copyright and license. The only figures that fall under this copyright and license are those sourced to Stephen Gallik, Ph. D. Other figures may be copyrighted by others. Go to the on-line lab manual for image attribution & copyright information. Contact author at [email protected] .
Triplicate samples of each aliquot will then be assayed for hemolysis in each of 7 NaCl solutions ranging from 0.2% NaCl to 0.8% NaCl using a standard 60 second hemolysis assay. The mean percent hemolysis of triplicate samples will be calculated.
Equipment & Materials
Sheep whole blood adjusted to 10% hematocrit with 0.85% (isotonic) NaCl. Seven NaCl solutions (ranging from 0.2% NaCl to 0.8% NaCl). Tetraethylammonium choride (TEA) dissolved in water. A supply of disposable plastic cuvettes. Two test tubes. A variety of pipettes. Genesys 20D Spectrophotometer set at 625 nm.
Experimental Protocol
Preparation
A. Turn on the spectrophotometer and allow it to warm up.
1. Before the start of the experiment, make sure the spectrophotometer is turned on. Allow the spectrophotometer to warm-up for at least 30 minutes before using it.
Note: A spectrophotometer should always be turned on 30 minutes before its use. The lamp that serves as the source of incident light must warm up to produce a stable incident light.
2. Set the measurement mode of the instrument to transmittance.
3. Set the wavelength to 625 nm.
B. Treat the blood samples.
1. Obtain 2 test tubes. Label one “control”. Label the other “TEAC”.
2. With a 5 ml graduated-transfer pipet, transfer 5 ml 10% hct whole sheep blood to each of the test tubes.
R e p r i n t e d f r o m G a l l i k S . , C e l l B i o l o g y O L M P a g e | 10
Copyright © 2011, 2012 by Stephen Gallik, Ph. D. Licensed under a Creative Commons Attribution-NonCommercial-NoDerivs 3.0 Unported License. All text falls under this copyright and license. The only figures that fall under this copyright and license are those sourced to Stephen Gallik, Ph. D. Other figures may be copyrighted by others. Go to the on-line lab manual for image attribution & copyright information. Contact author at [email protected] .
3. Add 250 µl deioniozed water to the control blood and invert 4X to mix.
4. Add 250 µl TEAC to the TEAC blood and invert 4X to mix.
5. Incubate both test tubes for at least 30 minutes at room temperature.
C. Prepare the assay cuvettes.
1. While the blood is incubating, gather 21 disposable spectrophotometer cuvettes and arrange them in seven groups of 3. These cuvettes will be used to assay the control blood.
2. Gather an additional 21 cuvettes and arrange similarly in seven groups of 3. These cuvettes will be used to assay the TEAC-treated blood.
3. Label the control cuvettes and the TEAC-treated cuvettes according to the scheme shown in the table below. Then fill each cuvette with 1 ml of the designated NaCl solution.
D. Prepare two blanks
1. When the 30-minute incubation period is over, prepare a control blank according to the following instructions:
1a. Label a single fresh cuvette to indicate it as the control blank.
1b. Add 1.0 ml of deionized water (0.00% NaCl) to the cuvette.
1c. Next, add 100 µl of the control blood to the same cuvette. Invert 4X to mix. When you do this, 100% of the control red blood cells added to the water will hemolyze. Later you will use this blank to calibrate the machine to 100 %T when assaying controls. For now, set it aside until needed.
2. When the 30-minute incubation period is over, prepare a TEAC blank according to the following instructions:
2a. Label a single fresh cuvette to indicate it as the TEAC blank.
2b. Add 1.0 ml of deionized water (0.00% NaCl) to the cuvette.
2c. Next, add 100 µl of the TEAC-treated blood to the same cuvette. Invert 4X to mix. When you do this, 100% of the control red blood cells added to the water will hemolyze. Later you will use this blank to calibrate the machine to 100 %T when assaying TEA-treated blood. For now, set it aside until needed.
R e p r i n t e d f r o m G a l l i k S . , C e l l B i o l o g y O L M P a g e | 11
Copyright © 2011, 2012 by Stephen Gallik, Ph. D. Licensed under a Creative Commons Attribution-NonCommercial-NoDerivs 3.0 Unported License. All text falls under this copyright and license. The only figures that fall under this copyright and license are those sourced to Stephen Gallik, Ph. D. Other figures may be copyrighted by others. Go to the on-line lab manual for image attribution & copyright information. Contact author at [email protected] .
Experimental Protocol: The Hemolytic Assay
The experimental protocol is outlined below. Please read it carefully and make sure you understand it.
Perform the following assay on each of the control and TEAC-treated cuvettes.
1. Calibrate the spectrophotometer with the appropriate blank (either the control blank or the TEAC blank).
2. Perform the following steps rapidly and carefully on each cuvette individually.
a. With a pipettor, add 100 µl of the appropriate blood sample (either control or TEAC-treated blood) to one of the cuvettes containing one of the hypotonic salt solutions, immediately invert the cuvette 2X to mix, immediately place the cuvette in the spectrophotometer and close the cuvette holder. (Timer: Be sure to start the timer at the second inversion.)
b. Record the %T of 625 nm light at 60 seconds.
c. Repeat steps a. and b. on all cuvettes until finished. Be sure you are adding the correct blood sample, control or TEAC-treated, to the cuvette. You should re-calibrate the spectrophotometer every so-often (perhaps every time you work with a new set of triplicates).
Examine Your Results & Save your Excel© Tables
Now that you have collected your raw data, examine the results. When all of the data have been collected & recorded, save the Microsoft Excel© spreadsheet to your computer.
Homework Assignment
Your instructor will likely follow today's work with a homework assignment. Make sure you understand the assignment before you leave lab today.
Clean Up
Once you saved the Excel table to you computer and entered your data in the instructor's computer, today's experiment is complete. Before you shut down, you should make sure the Excel file is saved to your computer. You can logout of the lab manual. Before you leave you must clean up your place so it looks the way it did when you walked into lab today.
R e p r i n t e d f r o m G a l l i k S . , C e l l B i o l o g y O L M P a g e | 12
Copyright © 2011, 2012 by Stephen Gallik, Ph. D. Licensed under a Creative Commons Attribution-NonCommercial-NoDerivs 3.0 Unported License. All text falls under this copyright and license. The only figures that fall under this copyright and license are those sourced to Stephen Gallik, Ph. D. Other figures may be copyrighted by others. Go to the on-line lab manual for image attribution & copyright information. Contact author at [email protected] .
E. Bibliography
Agre P, Preston GM, Smith BL, Jung JS, Raina S, Moon C, Guggino WB, Nielsen S (1993). Aquaporin CHIP: the archetypal molecular water channel. Am. J. Physiol. 265. F463–76.
Brooks HL, Regan JW and Yool AJ.(2000) Inhibition of Aquaporin-1 Water Permeability byTetraethylammonium: Involvement of the Loop E Pore Region. Molecular Pharmacology 57:1021–1026.
de Groot BL, Grubmüller H (2001). Water permeation across biological membranes: mechanism and dynamics of aquaporin-1 and GlpF. Science 294 (5550): 2353–2357.
Detmers F, de Groot BL, Muller EM, Hinton A, Konings I, Sze M, Flitsch SL, Grubmuller H, and Deen P. Quaternary Ammonium Compounds as Water Channel Blockers. The Journal of Biological Chemistry. 281, pp. 14207–14214, 2006.
Mitsuoka K, Murata K, Walz T, Hirai T, Agre P, Heymann JB, Engel A, Fujiyoshi Y (1999). The structure of aquaporin-1 at 4.5-A resolution reveals short alpha-helices in the center of the monomer. J. Struct. Biol. 128 (1): 34–43.
Nielsen S, Frøkiaer J, Marples D, Kwon TH, Agre P, Knepper MA (2002). Aquaporins in the kidney: from molecules to medicine. Physiol. Rev. 82 (1): 205–44.
Wikipedia. Aquaporin. http://en.wikipedia.org/wiki/Aquaporin