Executive Summary - Santa Clara County, California Executive Summary Results Overview The June 7,...
10
1 Executive Summary Results Overview T he June 7, 2016, Presidential Primary Election saw the largest voter turnout in a presidential primary election since 2008, the last presidential election year when there was no presidential incumbent. Out of 788,063 registered voters, a total of 430,779 cast valid ballots for a total turnout rate of 54.7%. This rate, as well as the turnout rate for vote-by- mail voters, was higher than in the 2012 presidential primary election. Polling place voters turned out at a rate of more than double that of 2012. One unique feature of the presidential primary is the participation of crossover vot- ers. In the June 7, 2016, Presidential Primary Election, more than one-third of voters registered without a party affiliation opted to vote a Democratic ballot. While more than 63% of voters registered without a party preference voted nonpartisan ballots, 2.8% and 0.4% chose to vote American Independent and Libertarian ballots, respectively. Being a countywide election, the June 7, 2016, Presidential Pri- mary also took longer to tally than the most recent smaller elections held in Santa Clara County. Due to the high volume of ballots, extended ballot receipt deadlines, and ballot processing procedures, the Registrar of Voters’ office did not finish tallying the polling place ballots until June 23, 16 days after Election Day. This report compares the June 7, 2016, Presidential Primary Election with similar pri- maries and the presidential general elections held in 2012 and 2008. Presidential primaries also offer a unique view of voter behavior by political party. In 2008, California split its presi- dential primary election from the other primaries, holding two primary elections that year – the presiden- tial primary held on February 5, 2008, and a statewide primary held on June 3, 2008. The charts and graphs in this post-election report include both of these primaries for comparison purposes. 689,052 715,492 788,821 755,117 817,837 788,063 457,692 250,512 678,033 292,713 653,239 430,779 0 100,000 200,000 300,000 400,000 500,000 600,000 700,000 800,000 900,000 Total Registration and Turnout Past Presidential Elections 2/5/2008 Presidential Primary 6/3/2008 Statewide Primary 11/4/2008 Presidential General 6/5/2012 Presidential Primary 11/6/2012 Presidential General Total Registration Total Turnout 6/7/2016 Presidential Primary Voter turnout for primary elections is generally lower than in presidential general elections. As in the 2008 presidential pri- mary, the June 7, 2016, Presidential Primary Election saw a voter turnout rate of between 50% and 60%, while the presidential general elections in 2008 and 2012 saw a much higher turnout rate. By contrast, the 2008 statewide primary had the lowest turnout rate among pres- idential-year elections in the past eight years. FAQ Q: Why were there two primaries in 2008? A: California had always held its presidential primary in June until 1996, when the election was moved up to March with the goal of having a greater effect nationally on presidential races. By 2005, California lawmakers viewed the large gap between the March primary and the November general election as contributing to increasing campaign costs, so the primary was moved back to June. As the 2008 presidential election approached, however, many still wanted California to have a greater impact on the presidential race, so a law was passed splitting the primaries in 2008, with the presidential primary held in February – the earliest ever in California. The primaries were recombined to be held together in June beginning in 2012. June 7, 2016 Presidential Primary Santa Clara County Registrar of Voters Post-Election Report Published: August 2, 2016
-
Upload
vuongthien -
Category
Documents
-
view
215 -
download
0
Transcript of Executive Summary - Santa Clara County, California Executive Summary Results Overview The June 7,...

1
Executive Summary
Results Overview
The June 7, 2016, Presidential Primary Election saw the largest voter turnout in a presidential primary election since
2008, the last presidential election year when there was no presidential incumbent. Out of 788,063 registered voters, a total of 430,779 cast valid ballots for a total turnout rate of 54.7%. This rate, as well as the turnout rate for vote-by-mail voters, was higher than in the 2012 presidential primary election. Polling place voters turned out at a rate of more than double that of 2012.One unique feature of the presidential primary is the participation of crossover vot-ers. In the June 7, 2016, Presidential Primary Election, more than one-third of voters registered without a party affiliation opted to vote a Democratic ballot. While more than 63% of voters registered without a party preference voted nonpartisan ballots, 2.8% and 0.4% chose to vote American Independent and Libertarian ballots, respectively.
Being a countywide election, the June 7, 2016, Presidential Pri-mary also took longer to tally than the most recent smaller
elections held in Santa Clara County. Due to the high volume of ballots, extended ballot receipt
deadlines, and ballot processing procedures, the Registrar of Voters’ office did not finish tallying the polling place ballots until June 23, 16 days after Election Day.This report compares the June 7, 2016, Presidential Primary Election with similar pri-maries and the presidential general elections
held in 2012 and 2008. Presidential primaries also offer a unique view of voter behavior by
political party. In 2008, California split its presi-dential primary election from the other primaries,
holding two primary elections that year – the presiden-tial primary held on February 5, 2008, and a statewide primary
held on June 3, 2008. The charts and graphs in this post-election report include both of these primaries for comparison purposes.
6/7/2016Presidential
Primary
689,052715,492
788,821755,117
817,837788,063
457,692
250,512
678,033
292,713
653,239
430,779
0
100,000
200,000
300,000
400,000
500,000
600,000
700,000
800,000
900,000
1 2 3 4 5 6Total Reg Total TO
Total Registration and TurnoutPast Presidential Elections
2/5/2008Presidential
Primary
6/3/2008StatewidePrimary
11/4/2008Presidential
General
6/5/2012Presidential
Primary
11/6/2012Presidential
General
Total Registration Total Turnout
6/7/2016Presidential
Primary
Voter turnout for primary elections is generally lower than in presidential general elections. As in the 2008 presidential pri-mary, the June 7, 2016, Presidential Primary Election saw a voter turnout rate of between 50% and 60%, while the presidential general elections in 2008 and 2012 saw a much higher turnout rate. By contrast, the 2008 statewide primary had the lowest turnout rate among pres-idential-year elections in the past eight years.
FAQQ: Why were there two primaries in 2008?A: California had always held its presidential primary in June until 1996, when the election was moved up to March with the goal of having a
greater effect nationally on presidential races. By 2005, California lawmakers viewed the large gap between the March primary and the November general election as contributing to increasing campaign costs, so the primary was moved back to June. As the 2008 presidential election approached, however, many still wanted California to have a greater impact on the presidential race, so a law was passed splitting the primaries in 2008, with the presidential primary held in February – the earliest ever in California. The primaries were recombined to be held together in June beginning in 2012.
June 7, 2016 Presidential PrimarySanta Clara County Registrar of Voters Post-Election Report
Published: August 2, 2016

2
6/7/2016Presidential
Primary
2/5/2008Presidential
Primary
6/3/2008StatewidePrimary
11/4/2008Presidential
General
6/5/2012Presidential
Primary
11/6/2012Presidential
General
Total Vote-by-Mail Registration Total Vote-by-Mail Turnout
401,134434,868
490,238514,630
559,361 573,999
281,817
170,649
467,916
237,195
457,885
319,803
0
100,000
200,000
300,000
400,000
500,000
600,000
700,000
1 2 3 4 5 6VBM Reg VBM TO
Vote-by-Mail Registration and TurnoutPast Presidential Elections
6/7/2016Presidential
Primary
2/5/2008Presidential
Primary
6/3/2008StatewidePrimary
11/4/2008Presidential
General
6/5/2012Presidential
Primary
11/6/2012Presidential
General
Total Polling Place Voter Registration Total Polling Place Voter Turnout
Polling Place Voter Registration and TurnoutPast Presidential Elections
287,918 280,624298,583
240,487258,476
214,064
175,875
79,863
210,137
55,518
195,354
110,976
0
50,000
100,000
150,000
200,000
250,000
300,000
350,000
1 2 3 4 5 6PP Reg PP TO
FAQQ: What is the difference between vote-by-mail (VBM) and polling place voters?A: VBM voters are voters who have registered to permanently vote by mail, meaning that for every
election, these voters receive their ballot in the mail. Polling place voters are voters who typically vote at the polls and do not usually receive a ballot by mail. Sometimes, due to how precincts are drawn, polling place voters can be assigned to mail ballot precincts. These voters may alternatively cast their ballot at a polling place if they wish.
In 2001, the California Legislature passed a law to allow residents to become permanent vote-by-mail voters. Since the law went into effect the following year, the percentage of vote-by-mail voters in Santa Clara County has trended upward. On the other hand, vote-by-mail turnout, and turn-
out in general, depends on a number of factors, including voter interest in the election and whether an incumbent is up for re-election. These charts reveal a stark contrast between presidential primary and general election turnout for both voting methods.

3
6/7/2016Presidential
Primary
2/5/2008Presidential
Primary
6/3/2008StatewidePrimary
11/4/2008Presidential
General
6/5/2012Presidential
Primary
11/6/2012Presidential
General
Total Turnout % % Turnout of Vote-by-Mail Voters
66.4%
35.0%
86.0%
38.8%
79.9%
54.7%
70.3%
39.2%
95.4%
46.1%
81.9%
55.7%61.1%
28.5%
70.4%
23.1%
75.6%
51.8%
0%
20%
40%
60%
80%
100%
2008 Pres Pri 2008 S/W Pri 11/4/08 Gen 6/5/12 Pri 11/6/12 Gen 6/7/16 Pri
TO % VBM TO %PP TO %
Voter Turnout PercentagesPast Presidential Elections
% Turnout of Polling Place Voters
Peace and Freedom
Party
DemocraticParty
RepublicanParty
American Independent
Party
GreenParty
Libertarian Party
Total Party Registration Total Party Turnout
370,161
166,599
15,7122,932 4,635 1,805
226,219242,968
89,955
6,903 1,312 2,230 484
86,927
0
100,000
200,000
300,000
400,000
1 2 3 4 5 6 7Series1 Series2
No Party Preference/
Other
Historically, a higher percentage of vote-by-mail voters have voted in presidential-year elections than have polling place voters. In the June 7, 2016, Presidential Primary, only the Democratic and Republican parties saw a majority of their voters cast a ballot.
Voter Turnout by PartyJune 7, 2016, Presidential Primary Election
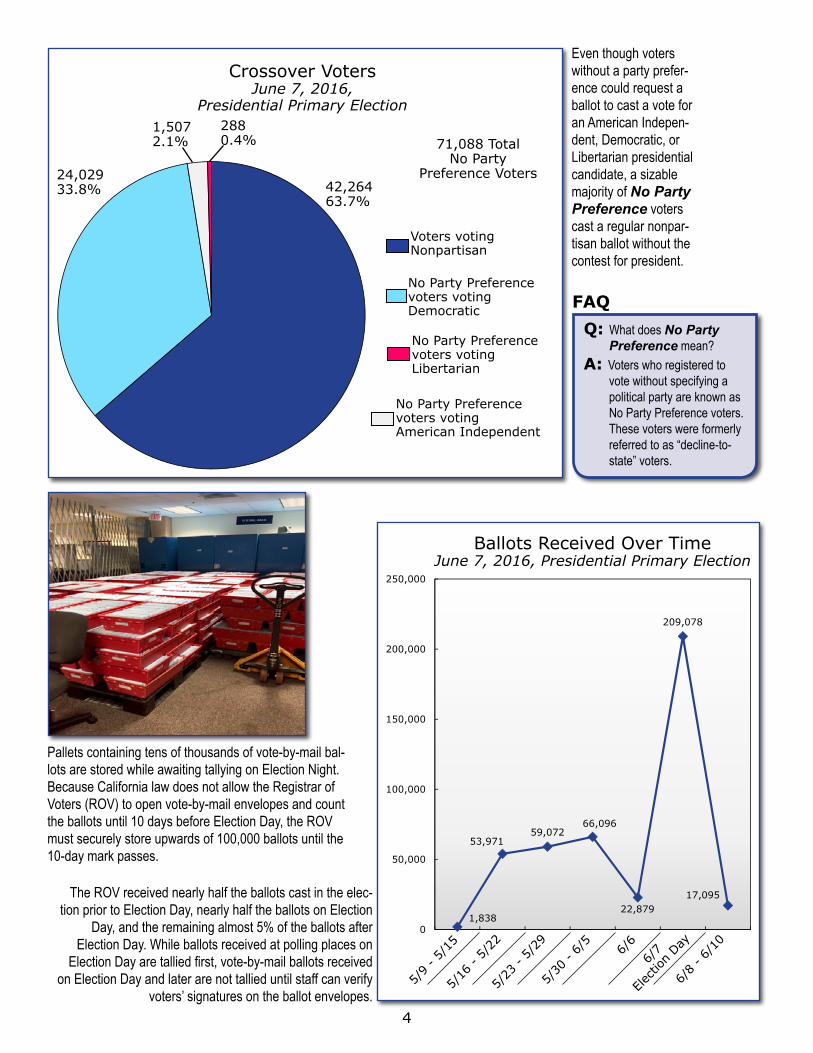
Chart Title
1 2 3 4
Voters votingNonpartisan
No Party Preference voters voting Democratic
Crossover VotersJune 7, 2016,
Presidential Primary Election
No Party Preference voters voting Libertarian
No Party Preference voters voting American Independent
42,26463.7%
24,02933.8%
1,5072.1%
2880.4% 71,088 Total
No Party Preference Voters
Ballots Received Over TimeJune 7, 2016, Presidential Primary Election
5/9 - 5
/15
1,838
53,97159,072
66,096
22,879
209,078
17,095
0
50,000
100,000
150,000
200,000
250,000
1 2 3 4 5 6 7
Chart Title
5/16
- 5/
22
5/23
- 5/
29
5/30
- 6/
56/
66/
7
Electi
on D
ay
6/8 - 6
/10
Even though voters without a party prefer-ence could request a ballot to cast a vote for an American Indepen-dent, Democratic, or Libertarian presidential candidate, a sizable majority of No Party Preference voters cast a regular nonpar-tisan ballot without the contest for president.
The ROV received nearly half the ballots cast in the elec-tion prior to Election Day, nearly half the ballots on Election
Day, and the remaining almost 5% of the ballots after Election Day. While ballots received at polling places on
Election Day are tallied first, vote-by-mail ballots received on Election Day and later are not tallied until staff can verify
voters’ signatures on the ballot envelopes.
Pallets containing tens of thousands of vote-by-mail bal-lots are stored while awaiting tallying on Election Night. Because California law does not allow the Registrar of Voters (ROV) to open vote-by-mail envelopes and count the ballots until 10 days before Election Day, the ROV must securely store upwards of 100,000 ballots until the 10-day mark passes.
4
FAQQ: What does No Party
Preference mean?A: Voters who registered to
vote without specifying a political party are known as No Party Preference voters. These voters were formerly referred to as “decline-to-state” voters.

Ballots Tallied Over TimeJune 7, 2016, Presidential Primary Election
12,635 16,344 40,193
86,620 86,620 87,205 88,398 91,191 99,860 110,976 110,976
189,407
189,407 195,769 195,769 195,769
213,839
279,924
312,216 319,240 319,731 319,799 319,803
-
50,000
100,000
150,000
200,000
250,000
300,000
350,000
1 2 3 4 5 6 7 8 9 10 11 12 13 14 15 16 17 18 19 20 21 22 23 24 25 26 27 28 29 30
Chart Title
Precinct Ballots Tallied VBM Ballots Tallied
6/7Election Day 6/8 6/9 6/10 6/11
6/13
6/14
6/15
6/16
6/17
6/18
6/20
6/21
6/22
6/23
6/24
6/27
8 p.m.
8:45
p.m
.
9:45
p.m
.
10:1
5 p.m.
11 p.m
.
11:4
5 p.m.
12:4
5 a.m.
1:45
a.m
.
2:30
a.m
.
3:30
a.m
.a.m.p.m.a.m.
p.m.a.m.p.m.a.m.p.m.
Polling Place Ballots Tallied Vote-by-Mail Ballots Tallied
% Ballots Tallied Over TimeJune 7, 2016, Presidential Primary Election
0.0%
11.4%14.7%
36.2%
78.1% 78.1%
78.6%
79.7% 82.2%90.0%
100.0% 100.0%
59.2%
59.2%61.2% 61.2%
61.2%66.9%
87.5%
97.6% 99.8% 100.0% 100.0% 100.0%
0%
20%
40%
60%
80%
100%
120%
1 2 3 4 5 6 7 8 9 10 11 12 13 14 15 16 17 18 19 20 21 22 23 24 25 26 27 28 29 30
Chart Title
% Precinct Ballots Tallied % VBM Ballots Tallied
% Polling Place Ballots Tallied % Vote-by-Mail Ballots Tallied
Starting 10 days before the election, all of the vote-by-mail ballots received prior to Election Day are processed and tallied before 8 p.m. State law, however, does not allow the Registrar of Voters to release the first results until the polls close. The first point on each of these graphs – showing the percentage tallied as of 8 p.m. on Election Day – represents the VBM ballots that were tallied in the days prior to Election Day. The second point at 8:45
p.m. on Election Day represents the tallied polling place ballots that were retrieved during Election Day as part of the midday pickup program. The polling place ballots tallied last in the graph are mostly provisional ballots, which need to be verified for voter and contest eligibility. In some cases, these ballots must be fur-ther processed to ensure that provisional voters only cast votes in contests for which they were eligible to vote.
6/12
6/7Election Day 6/8 6/9 6/10 6/11
6/13
6/14
6/15
6/16
6/17
6/18
6/20
6/21
6/22
6/23
6/24
6/27
8 p.m.
8:45
p.m
.
9:45
p.m
.
10:1
5 p.m.
11 p.m
.
11:4
5 p.m.
12:4
5 a.m.
1:45
a.m
.
2:30
a.m
.
3:30
a.m
.a.m.p.m.a.m.
p.m.a.m.p.m.a.m.p.m.
6/12
5

Percent
Jill Stein Darryl Cherney William Kreml Kent Mesplay Sedinam Moyowasifsa‐Curry
Percent
Robert Ornelas Alan Spears Wiley Drake James Hedges Thomas Hoefling Arthur Harris J.R. Myers
Percent
Donald Trump Ben Carson Ted Cruz John R. Kasich Jim Gilmore
Percent
Bernie Sanders Hillary Clinton Other Cands
Democratic PartyPresidential Primary
June 7, 2016, Presidential Primary Election
Hillary ClintonBernie SandersAll other candidates
116,39041.9%
1,8470.7%
278,018 Total Votes
159,78157.5%
Republican PartyPresidential Primary
June 7, 2016, Presidential Primary Election
Donald TrumpBen CarsonTed Cruz
3,2784.1%
9,01611.4%
79,210 Total Votes
49,86063.0%
John R. KasichJim Gilmore
16,04920.3%
1,0031.3%
Not included in graph: 4 votes for other candidates
American Independent PartyPresidential Primary
June 7, 2016, Presidential Primary Election
Robert OrnelasAlan SpearsWiley Drake
23110.9%
22410.6%
2,121 Total Votes
43520.5%
James Hedges
Thomas Hoefling
39610.7%
32315.2%
22910.8%
28313.3%
Arthur HarrisJ.R. Myers
Green PartyPresidential Primary
June 7, 2016, Presidential Primary Election
Jill SteinDarryl CherneyWilliam Kreml
688.4%
394.8%
806 Total Votes
62076.9%
303.7%
496.1%
Kent Mesplay
Sedinam Moyowasifsa-Curry
6

Chart Title
Gloria Estela La Riva Lynn S. Kahn Monica Moorehead
Percent
Gary Johnson John McAfee Austin Petersen Rhett White Feather Smith Joy Waymire Other Cands
Libertarian PartyPresidential Primary
June 7, 2016, Presidential Primary Election
Gary JohnsonJohn McAfeeAustin Petersen
98462.2%
20613.0%
1,583 Total Votes
613.9%
Rhett WhiteFeather SmithJoy Waymire
634.0%
19512.3%
744.7%
All other candidates
Peace and Freedom PartyPresidential Primary
June 7, 2016, Presidential Primary Election
Gloria Estela La RivaLynn S. KahnMonica Moorhead
5021.3%
8234.9%
235 Total Votes
10343.8%
The sequence of contests on the ballot is determined by state law, with the presidential contest always appearing first. The sequence of candidates for a given contest, on the other hand, is determined by a randomized alphabet drawing overseen by the California Sec-retary of State 82 days before the election. In conducting the randomized alphabet drawing for the June 7, 2016, Presidential Primary Election, the Secretary of State drew the letter “H” before the letter “D” and drew “E” before “A,” as illustrated above by the image of the American Independent presidential contest as appearing on the Sample Ballot and Voter Information Pamphlet for that party. The letter sequence applies not only to the first letters of the candidates’ surnames, but to each additional letter in their names, which is why James Hedges appears above Arthur Harris.
Sample Ballot and Voter Information Pamphlets (SBVIPs) are prepared for mailing to voters. For the June 7, 2016, Presi-dential Primary Election, each voter received an SBVIP that correlated with the voter’s party preference. This was the case because in a presidential primary election, the voter’s party affiliation determines what kind of ballot the voter receives.
7
SAMPLE

80,868
118,110 119,531
154,257
144,205
92,126
78,239
33,896
51,096 54,092
80,017
89,721
66,788
55,770
20,516
32,62437,462
58,573
68,658
55,05148,602
13,38018,472 16,565
21,444 21,063
11,7377,168
0
30,000
60,000
90,000
120,000
150,000
180,000
18-24 25-34 35-44 45-54 55-64 65-74 75+
Registration Total TO
VBM Vote Polling Place Vote
18-24Registration Total Turnout
Voter Turnout by Age GroupJune 7, 2016, Presidential Primary Election
Vote-by-Mail Turnout25-34 35-44 45-54 55-64 65-74 75+
Polling Place Turnout
41.9% 43.3% 45.3%
51.9%
62.2%
72.5% 71.3%
0%
20%
40%
60%
80%
100%
1 2 3 4 5 6 71 2 3 4 5 6 7
Voter Turnout by Age GroupJune 7, 2016, Presidential Primary Election
18-24 25-34 35-44 45-54 55-64 65-74 75+
Generally, no matter the voting method, the higher the age group, the higher the turnout in the June 7, 2016, Presidential Primary Election. The rate of turnout by age group rises and crests at 72.5% among voters between 65 and 74, before decreasing slightly among voters at least 75.
Voters complete
their ballots at a polling
place in Santa Clara
County.
8

Challenges ResolvedDue to a combination of factors ranging from the size and scope
of the election to legally mandated deadlines, the June 7, 2016, Presidential Primary Election presented several unanticipated challenges that the Registrar of Voters (ROV) resolved throughout the election preparation process. Below are some of the issues that were solved by the ROV’s dedicated staff behind the scenes to prevent these issues from affecting voters’ experiences at the polls.State Initiative PetitionsWhat happened?
In addition to conducting elections, the ROV reviews the signa-tures on petitions for state initiatives to ensure that all signors are registered voters from the county. According to state law, these signatures must be checked within a certain timeframe after being received.
Why was this challenging?This year, the state has received an extraordinarily high number of petitions. Additionally, the deadlines and workload involved fell right in the middle of the ROV’s preparations for the June 7, 2016, Presidential Primary Election. As a result, the ROV was required to review about 1 million signatures in addition to this workload.
How was this solved?Team members from less-impacted ROV divisions worked over-time to meet the state deadlines, and the State Legislature also approved one-time funding to cover these additional costs.
Widely Contested U.S. Senate SeatWhat happened?
The contest to replace a retiring U.S. senator drew 34 candi-dates, an unusually large number of candidates for a contest.
Why was this challenging?The U.S. senate contest usually appears on the front of the first ballot card along with information about the election and the presidential race. However, the large number of candidates running for U.S. senator would have required the ROV to place all the candidates in two columns. This could cause voter con-fusion if voters mistook the two columns for two separate races and accidentally voted for too many candidates.
How was this solved?The ROV moved the U.S. senate contest to the back of the first ballot card, where it could be designed using a single column to prevent voter confusion. Although this caused some ballots to have no contests appear on the front of the first ballot card, it likely prevented many voter mistakes.
Midday Ballot PickupWhat happened?
A new law now allows voted ballots to be retrieved from polling places before the polls close in order to relieve the burden of a high volume of returns on Election Night.
Why was this challenging?The law requires specific procedures to ensure ballot security and uniform processing of ballots.
How was this solved?The ROV drafted new procedures, created a video to inform the public of the midday pickup process, and trained all elec-tion officers and ballot couriers in the proper procedures. See page 49 for more about the midday pickup program.
Automatic Recount for City of San Jose ContestWhat happened?
As part of a pilot program approved by the Santa Clara County Board of Supervisors, the ROV conducted an automatic recount for the City of San Jose District 4 Councilmember contest, a close race with a margin of victory within 0.5%.
Why was this challenging?Due to the high voter turnout, the ROV could not begin the recount until after the election results were finalized and sent to the Secretary of State. The ROV counted every vote in the open, where each candidate could verify the count’s accuracy. After the ROV completed its manual tally, a voter requested a second recount on behalf of one candidate. The second recount concluded on August 2.
How was this solved?The ROV closely monitored all contests that could trigger an automatic recount and alerted the candidates for City of San Jose District 4 Councilmember of the upcoming recount as early as possible. The ROV also mobilized a team of dedicated workers to focus solely on the recount efforts in order to com-plete it as efficiently and accurately as possible.
Postal Service UpgradesWhat happened?
The U.S. Postal Service (USPS) upgraded its software, caus-ing some vote-by-mail ballots in other counties to be returned to the voters rather than delivered to the elections office.
Why was this challenging?Ballots not received by the elections office within a specified deadline cannot be counted, pursuant to state law.
How was this solved?The ROV worked with the local USPS to ensure all ballots were delivered to the ROV. As a result, there were no reports of ballots returned to voters in Santa Clara County.
Temporary Worker RegulationsWhat happened?
New rules for hiring temporary workers created challenges in recruiting sufficient election workers due to changes resulting from the Affordable Care Act, IRS regulations, and County collective bargaining agreements.
Why was this challenging?The ROV heavily relies on thousands of short-term temporary workers and paid volunteers to process all ballots and election materials on Election Night.
How was this solved?The County adopted a new volunteer policy for election volun-teers, and the ROV found creative solutions for recruitment, including the use of social media.
9

Takeaways
10
For an election encompassing nearly 800,000 voters, more than 800 polling places, and more than 430,000 ballots cast, the June 7, 2016, Presidential Primary Election went as smoothly as could have been hoped. Thousands of Registrar of Voters (ROV) staff
members, election officers, and Election Day volunteers worked tirelessly to prepare for, conduct, and verify the election.This experience has provided numerous key facts and lessons to keep in mind for future elections:
• Despite several prominent candidates dropping out of the running early on, and one major party arriving at a presump-tive nominee the day before Election Day, turnout in Santa Clara County was higher than in many peer counties, the statewide average, and the national average. Extensive voter outreach through advertising and the wealth of voting opportunities – including early voting sites, drive-thru locations, drop-off boxes, and postage paid envelopes – likely contributed to this higher turnout.
• While the ROV has increased early voting opportunities, approximately 70,000 vote-by-mail (VBM) vot-ers, or about 22% of participating VBM voters, dropped off their completed VBM ballots on Election Day rather than mailing them in early. Addition-ally, a higher than average number of VBM voters voted provisionally at the polls.
• Although more than 60% of No Party Preference voters voted a nonpartisan ballot, more than 25,000 such voters crossed over to vote party ballots, including just over 24,000 votes cast on limited Democratic ballots.
• New laws extending the time during which the ROV can accept VBM ballots likely have contributed to a late influx of VBM ballots as voters become increasingly aware of the later deadlines. Nearly 17,000 valid VBM ballots were received after Election Day, more than triple the amount of ballots received after Election Day in the most recent high-turnout presidential election.
• A new law allowing midday pickups of voted ballots at polling places enabled the ROV to retrieve about 15% of the polling place ballots cast and tally them early, which reduced the burden of tallying more than 100,000 polling place ballots after the polls close.
• Although the ROV augmented its vote-tallying operations by purchasing additional vote-tallying machines, conducting 24-hour processing of VBM ballots, and conducting midday pickups – all of which ultimately led to faster ballot counting than in past elections – Santa Clara County still trails similarly sized counties with respect to reporting times. Santa Clara County is currently in the process of replacing its aging voting system with a modern one, which would significantly increase tallying efficiency.
• A county-initiated automatic recount of a San Jose City Council contest confirmed the
outcome reported by the ROV. A voter-initiated recount conducted after the automatic recount also confirmed the contest’s outcome.
• Voters registering to vote and updating their registration information online now exceed those using paper forms, with more than 60% of registration documents submitted over the internet.
• Party turnout varies depending on the election, with only voters registered without a party preference turning out to vote in increasingly higher numbers since the 2008 Presidential Primary Election.
• The turnout among polling place voters was more than double the rate in the 2012 pres-idential primary, and was the closest to the overall countywide turnout in any presidential-year election since prior to 2008.
• The rate of voters voting provisionally was similar to that of the 2008 presidential primary, which also saw high turnout numbers. Of the provisional voters in the June 7, 2016, Presidential Primary Election, 70% were VBM voters who could not produce the original VBM ballot mailed to them.
Orange ballot bags and precinct sup-plies await shipment to polling places.