Executive Summary · Executive Summary Note: ... KMTA) of para-xylene (PX) and 133 KMTA of benzene...
45
Executive Summary Note: The codes in parentheses denote the title codes used in the report body (Body) of the REPORT hereinafter. 1. Process-facility Configuration (Chapter 3 and Chapter 4) (1) Aromatics Project is located in the Aryrau Refinery, to produce 496,000 MT/Y (= 496 KMTA) of para-xylene (PX) and 133 KMTA of benzene (BZ) from the Reformate supplied from the CCR Project, in which their capacity figures have been instructed by KMG (Figure S-1-1). Out of the PX, 250 KMTA would be exported overseas, while the PX remainder and the BZ would be sent to Petrochemical Complex. (2) Petrochemical Complex is located in Karabatan, to produce and ship 188 KMTA of PTA, 200 KMTA of PET, 179 KMTA of EB and 200 KMTA of PVC, in which 246 KMTA of the PX, and the BZ (133 KMTA) would be used as the raw-material (Figure S-1-2 to 3). (3) Production processes used in the above-mentioned projects (Projects) are briefly explained in the Chapter 3 of the Body. 2. Market Study of the Products (Chapter 1) The markets at the year of 2012 are analyzed each in the Body with the related statistical data represented by the UN’s. 2-1. Aromatics Project Eastern and Western Europe, and China are named as the targeted markets of PX in view of the balance between the consumption and the production capacity. Poland and Lithuania out of Eastern Europe, and Belgium, Germany, and Spain out of Western Europe are the candidates (Figure S-2-1 to 3). Table S-2-1: Candidates for PX Exports (KMTA) Forecasts for 2012 Eastern Europe Western Europe China PX consumptions (A) 1,179 2,560 10,710 PX production capacities (B) 886 2,335 8,045 Balance (A)-(B) 293 225 2,665
Transcript of Executive Summary · Executive Summary Note: ... KMTA) of para-xylene (PX) and 133 KMTA of benzene...

Executive Summary
Note: The codes in parentheses denote the title codes used in the report body (Body) of the
REPORT hereinafter.
1. Process-facility Configuration (Chapter 3 and Chapter 4)
(1) Aromatics Project is located in the Aryrau Refinery, to produce 496,000 MT/Y (= 496
KMTA) of para-xylene (PX) and 133 KMTA of benzene (BZ) from the Reformate supplied
from the CCR Project, in which their capacity figures have been instructed by KMG (Figure
S-1-1). Out of the PX, 250 KMTA would be exported overseas, while the PX remainder
and the BZ would be sent to Petrochemical Complex.
(2) Petrochemical Complex is located in Karabatan, to produce and ship 188 KMTA of PTA,
200 KMTA of PET, 179 KMTA of EB and 200 KMTA of PVC, in which 246 KMTA of the
PX, and the BZ (133 KMTA) would be used as the raw-material (Figure S-1-2 to 3).
(3) Production processes used in the above-mentioned projects (Projects) are briefly explained
in the Chapter 3 of the Body.
2. Market Study of the Products (Chapter 1)
The markets at the year of 2012 are analyzed each in the Body with the related statistical data
represented by the UN’s.
2-1. Aromatics Project
Eastern and Western Europe, and China are named as the targeted markets of PX in view of the
balance between the consumption and the production capacity. Poland and Lithuania out of
Eastern Europe, and Belgium, Germany, and Spain out of Western Europe are the candidates
(Figure S-2-1 to 3).
Table S-2-1: Candidates for PX Exports (KMTA)
Forecasts for 2012 Eastern Europe Western Europe China
PX consumptions (A) 1,179 2,560 10,710
PX production capacities (B) 886 2,335 8,045
Balance (A)-(B) 293 225 2,665

Reformer
Deh
epta
nize
r
Liquid Extraction
Xyle
neSp
litte
r
Benzen & TolueneColumn
PX Recovery
PX Isomerization
TolueneTransalkylation
Xyle
neR
erun
C5+889
C7-336
BTX286
HDTNAPHTHA
1,000
BENZENE
RAFFINATE
LPG
FG4
C8+553
C8+1,153
C8A2,288
PX
C8A1,719
C8A1,785
C8+599
C6+885
C9+584
T7T7
T421
T428
FG19
BT32
H23BT 81
H219
C9541
FG71
FG
HEAVIES
H251
43
95
496
133
149
33Product StreamFG Fuel Gas StreamH2 Hydrogen Stream
Figure S-1-1: Process Flow of Aromatics Project (The Reformer is out of the scope of the Project)
S-2

Karabatan SitePetrochemical Complex Project
Atyrau Refinery Site
Aromatics Project
CCR Project1,000 CCR Reformate 889
149
Naphtha
43
PX Plant 496 Raffinate
Heavies
PX 246 BZ 133
KPI Project
Olefin Plant
Ethylene 41
48
Oxygen 40
EO/EG Plant
EG 68
PTA
PTA Plant 362
174
PET Plant 200
EB 179
PTA Export 188
179EB
Aktau ProjectSM Plant
PS Plant PS 300 PET 200
250PX Exports
Figure S-1-2: Process Flow of Petrochemical Complex (200 KMTA of PET, 188 KMTA of PTA and 179 KMTA of EB)
S-3

S-4
171
Caustic Soda 125
Rock Salt
KPI Project
Olefin Plant
Electrolysis Plant
Chlorine 117
EDC*536
EDC Plant
VCM Plant
VCM 202
PVC Plant
PVC 200
Ethylene 94
Petrochemical Complex (@Karabatan)
Oxygene 28
Figure S-1-3: Process Flow of Petrochemical Complex (200 KMTA of PVC)
Note: *536 KMTA of EDC is recycled in the VCM production of the balanced process.

S-5
-300
-200
-100
0
100
200
300
400
2003 2004 2005 2006 2007 2008 2009 2010 2011 2012
PX
Bal
ance
(KM
TA)
CalculatedExperienced Figure S-2-1: PX Balance* in East Europe
*Balance = (Production capacity) - (Inventory Charge) + (Imports) - (Exports)
-300
-200
-100
0
100
2003 2004 2005 2006 2007 2008 2009 2010 2011 2012
PX B
alan
ce (K
MTA
)
CalculateExperienced
Figure S-2-2: PX Balance* in West Europe
*Balance = (Production capacity) - (Inventory Charge) + (Imports) - (Exports)
-3,000
-2,500
-2,000
-1,500
-1,000
-500
02003 2004 2005 2006 2007 2008 2009 2010 2011 2012
PX Balance (KMTA)
Experienceed Calculated
Figure S-2-3: PX Balance* in China
*Balance = (Production Capacity) - (Consumption)

S-6
2-2. Petrochemical Complex
2-2-1. PET and PVC
The following markets are named as the candidate for the sales of the PET and the PVC:
Table S-2-2: Candidates for Sales of PET and PVC (KMTA)
Candidates PET PVC
Kazakhstan 44 KMTA 52 KMTA
Other Central Asian Countries 34 KMTA 29 KMTA
Russia 82 KMTA 65 KMTA
Other Countries 40 KMTA (Bulgaria, Romania, Serbia)
54 KMTA (Turkey, etc.)
Total 200 KMTA 200 KMTA
(1) Central Asian Countries represented by Kazakhstan, as the targeted market for PTE and PVC
We assume that their demand per head would follow those in Russia (Figure S-2-4 to 7).
Table S-2-3: Sales of PET and PVC in Central Asian Countries (KMTA)
Products Markets GDP Per capita
Annual PETDemands per head
Population Sales by Project (2012)
Kazakhstan $5,700 2.8 kg 15 MM 44 KMTA PET
Other CAC $1,000 0.73 kg 46 MM 34 KMTA
Kazakhstan $ 5,700 3.4 kg 15 MM 52 KMTA PVC
Other CAC $ 1,000 0.63 kg 46 MM 29 KMTA
0.0
0.5
1.0
1.5
2.0
2.5
3.0
3.5
4.0
0 2,000 4,000 6,000 8,000GDP per capita (US$)
PET use per head (kg)
Kazakhstan (2003)
Russia (2005)
Russia (2012)
Expectationin Russia
Kazakhstan (2006)
Figure S-2-4: PET use per head versus GDP per capita in Russia and Kazakhstan

S-7
0.0
0.5
1.0
1.5
2.0
2.5
3.0
3.5
4.0
0 2,000 4,000 6,000 8,000
GDP per capita (US$)
PET use per head (kg)
Russia (2005)
Russia (2012)
Expectation in Russia
CAC (2006)Kazakhstan (2003)
Kazakhstan (2006)
CAC (2003)
Fig S-2-5: PET use per head versus GDP per capita in
Russia and Central Asian Countries (CAC)
0.0
1.0
2.0
3.0
4.0
5.0
6.0
7.0
8.0
9.0
2,000 3,000 4,000 5,000 6,000 7,000 8,000
GDP per capita (US$)
PV
C u
se p
er h
ead
(kg)
Russia (2003)
Russia (2006)
ExpectedRussia (2007)
ExpectedRussia (2012)
Expectation
Kazakhstan (2006)
Kazakhstan (2003)
ExpectedKazakhstan (2012)
Max. Case
Min. Case
Figure S-2-6: PVC Demand per head in Kazakhstan
0.0
0.1
0.2
0.3
0.4
0.5
0.6
0.7
0.8
0.9
1.0
0 500 1,000 1,500 2,000 2,500 3,000 3,500 4,000
GDP per capita (US$)
PV
C u
se p
er h
ead
(kg)
Kazakhstan (2006)
Kazakhstan (2003)CAC (2006)
CAC (2003)
ExpectedCAC (2012)
ExpectedCAC
RussianExperience
Figure S-2-7: PVC Demand per head in Central Asian Countries (CAC)

S-8
(2) Russia
1) Russia might be a targeted market for the PET because large magnitude capacities of projects
are scheduled to be completed their facility construction at 2008 (Figure S-2-8), in which 82
KMTA from the Project might enter the market. At 2006, Korea, China, Thailand accounted
for about 94 % of the total import value at 452 MM US$ by Russia.
0
100
200
300
400
500
600
700
2003 2004 2005 2006 2007 2008 2009 2010 2011 2012
(KMTA)
0
100
200
300
400
500
600
Capacity
Demands
Figure S-2-8 Demands and Productions of PET in Russia
2) At 2012, PVC would be imported at 270 KMTA to Russia where 65 KMTA from the Project
might occupy the PVC imports (Figure S-2-9).
655
40 30 20 10 10 10 10
269
885885
655640576568546492
1,1641,079
1,000
486583
738796
885950
113122
335
184285250250210150116
0
200
400
600
800
1,000
1,200
1,400
2004 2005 2006 2007 2008 2009 2010 2011 2012Year
(KMTA)
Production
Demand
Export
Import
Figure S-2-9: PVC Supply-demands in Russia

S-9
(3) Other markets
1) Bulgaria, Romania and Serbia out of the Eastern Europe would be targeted as the PET market
because the countries do not have a plan to produce PET and large quantities of the PET have
been imported from Asia.
Table S-2-4: PET Imports by Eastern Europe from Asian at 2006 (KMTA)
Exporters and their exports at 2006 (KMTA)
Importers China Korea Malaysia Thailand Total
Bulgaria 22 3 1 0 26
Czech 0 0 7 0 7
Romania 52 16 2 9 80
Serbia 7 1 1 0 8
Slovakia 0 0 0 0 0
Total 81 19 11 9 121
2) It is expected that at 2012, the Eastern Europe would be of PVC importers. Poland, Ukraine
and Turkey are named as the candidate out of the importer, and they imported from Asia at a
large quantity of PVC at 2006.
Table S-2-5: PVC Imports by Eastern Europe at 2006 (KMTA) PVC exports from Asia and Americas to East European Countries (2006) (KMTA)
Asia-Pacific Region China Korea Taiwan Other
Asians Total Latin
America United States
Poland 0.76 0.01 0.00 0.00 0.77 0.00 0.61
Ukraine 8.36 17.55 4.31 0.10 30.32 1.04 1.03
Turkey 118.34 22.50 26.44 69.97 238.26 41.42 1.71
2-2-2. PTA
Russia, Middle East and China are named as the targeted markets of PTA in view of the
balance between the consumption and the production capacity. (Figure S-2-11 to 13).
Table S-2-6: Candidates for PTA Exports
Forecasts for 2012 Russia Middle East China
PTA consumptions (A) 518 KMTA 1,915 KMTA 22,074 KMTA
PTA production capacities (B) 230 KMTA 1,470 KMTA 17,280 KMTA
Balance (A)-(B) 288 KMTA 445 KMTA 4,814 KMTA

S-10
0
100
200
300
400
500
600
2003 2004 2005 2006 2007 2008 2009 2010 2011 2012
(KMTA)
Experienced Expected
Figure S-2-10: PTA Balance* in Russia
*(Balance) = (Production) – (Inventory Charge) + (Import) – (Export))
-500
-400
-300
-200
-100
0
100
2003 2004 2005 2006 2007 2008 2009 2010 2011 2012
(KMTA)
Experienced Expected
Figure S-2-11: PTA Balance* in Middle East {* = (Production Capacity) – (Consumption)}
-7,000
-6,000
-5,000
-4,000
-3,000
-2,000
-1,000
0
2003 2004 2005 2006 2007 2008 2009 2010 2011 2012
(KMTA)
Experienced Expected
Figure S-2-12: PTA Balance* in China {* = (Production Capacity) – (Consumption)}

S-11
3. Product Prices and Raw-material Unit Cost (Chapter 2)
3-1. Ex-factory prices of the Products
(1) Calculation Conditions
The ex-factory prices are calculated as follows:
(Ex-factory Price) = (Referred Price) – (Allowance) – (Tariff)
- The referred prices are set applying the latest-year figures of contract prices such as EUCP or
the trade unit value gotten with the calculation dividing the trade value by the quantity
thereof based on the trading statistic data such as “UN Comtrade”. In the Body of the report
such referred prices are explained with the statistic data.
- The allowance of 10 % is applied to the calculation considering that the said latest-year
figures are located at the highest level in the price history.
- The tariffs are calculated each referring to those indicated by KMG as follows:
Table S-3-1: Tariffs informed by KMG for train transportation Distance Tariff Origin Place Destination Purpose
(km) (KZT/MT) (US$/MT)
Atyrau Karabatan Domestic Transportation 40 298.3 2.32
Atyrau Novorossiysk Export 54.97
Atyrau Dostyk Export 3,218 13,609.40 106.03
Karabatan Aktau Domestic Transportation 798 1,052.20 8.2
Karabatan Aksaraiskayo II Export 363 2,295.70 17.89
Karabatan Dostyk Export 3,258 13,609.40 106.03
(2) Summary
1) Aromatics Project
Table S-3-2: Ex-factory prices of Products made by Aromatics Project
Products Volumes Ex-factory
Prices Remarks
Raffinate 149 KMTA 342 US$/MT = 43,860 KTZ/MT (@ 0.0077912 US$/KZT)
BZ 133 KMTA 738 US$/MT
PX 496 KMTA 962 US$/MT
Heavies 43 KMTA 468 US$/MT = 60,018 KTZ/MT (@ 0.0077912 US$/KZT)
Total 821 KMTA

S-12
2) Petrochemical Complex
Table S-3-3: Ex-factory prices of Products made by Petrochemical Complex
Products Volumes Ex-factory Prices
PET + EB + PVC PET + EB PVC
PTA 189 KMTA 693 US$/MT Yes Yes
PET 200 KMTA 1,009 US$/MT Yes Yes
EB 179 KMTA 893 US$/MT Yes Yes
PVC 200 KMTA 940 US$/MT Yes Yes
NaOH 126 KMTA 289 US$/MT Yes Yes
Total 894 KMTA
(3) Calculation of ex-factory prices
Table S-3-4: EX-factory prices of PX produced in Project
Destination Volumes(KMTA)
Referred Prices
(US$/MT) (A)
Allowance(B)
(A) x 10%
Tariff (US$/MT)
(C)
Ex-factoryPrices
(A)-(B)-(C)Karabatan (for PTA production) 246 1,140
(China TUV) 114 2 1,024
Western Europe (Belgium, Germany, Spain)
20 1,150 (EUCP) 115 85 950
Eastern Europe (Poland, Lithuania) 120 1,150
(EUCP) 115 75 960
China 110 1,140 (China TUV) 114 200 826
Total 496 *TUV =Trade Unit Value Average 962
Table S-3-5: EX-factory prices of BZ produced in Project
Destination Volumes(KMTA)
Referred Prices
(US$/MT) (A)
Allowance(B)
(A) x 10%
Tariff (US$/MT)
(C)
Ex-factoryPrices
(A)-(B)-(C)Karabatan (for EB production) 133 822
(China TUV) 82 2 738
Total 133 *TUV =Trade Unit Value Average 738
Table S-3-6: EX-factory prices of PET produced in Project
Destination Volumes(KMTA)
Referred Prices
(US$/MT) (A)
Allowance(B)
(A) x 10%
Tariff (US$/MT)
(C)
Ex-factoryPrices
(A)-(B)-(C)Kazakhstan 44 1,200* 120 15 1,065 Other Central Asian Countries 34 1,200* 120 140 940
Russia 82 1,200* 120 70 1,010 Eastern Europe Countries (Bulgaria, Romania, etc.) 40 1,200* 120 75 1,005
Total 200 * Trade Unit Value Average 1,009
S-13
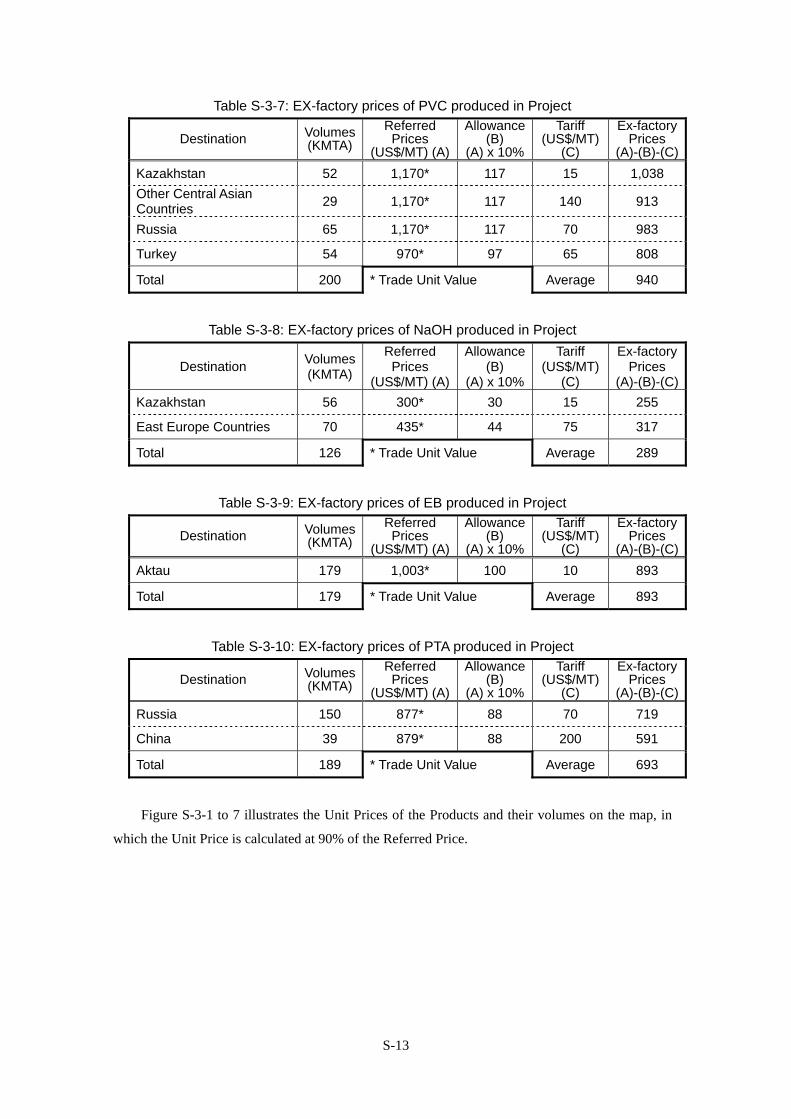
Table S-3-7: EX-factory prices of PVC produced in Project
Destination Volumes(KMTA)
Referred Prices
(US$/MT) (A)
Allowance(B)
(A) x 10%
Tariff (US$/MT)
(C)
Ex-factoryPrices
(A)-(B)-(C)Kazakhstan 52 1,170* 117 15 1,038 Other Central Asian Countries 29 1,170* 117 140 913
Russia 65 1,170* 117 70 983
Turkey 54 970* 97 65 808
Total 200 * Trade Unit Value Average 940
Table S-3-8: EX-factory prices of NaOH produced in Project
Destination Volumes(KMTA)
Referred Prices
(US$/MT) (A)
Allowance(B)
(A) x 10%
Tariff (US$/MT)
(C)
Ex-factoryPrices
(A)-(B)-(C)Kazakhstan 56 300* 30 15 255
East Europe Countries 70 435* 44 75 317
Total 126 * Trade Unit Value Average 289
Table S-3-9: EX-factory prices of EB produced in Project
Destination Volumes(KMTA)
Referred Prices
(US$/MT) (A)
Allowance(B)
(A) x 10%
Tariff (US$/MT)
(C)
Ex-factoryPrices
(A)-(B)-(C)Aktau 179 1,003* 100 10 893
Total 179 * Trade Unit Value Average 893
Table S-3-10: EX-factory prices of PTA produced in Project
Destination Volumes(KMTA)
Referred Prices
(US$/MT) (A)
Allowance(B)
(A) x 10%
Tariff (US$/MT)
(C)
Ex-factoryPrices
(A)-(B)-(C)Russia 150 877* 88 70 719
China 39 879* 88 200 591
Total 189 * Trade Unit Value Average 693
Figure S-3-1 to 7 illustrates the Unit Prices of the Products and their volumes on the map, in
which the Unit Price is calculated at 90% of the Referred Price.

Figure S-3-1 : Product PX : Targeted Markets (Unit Price x Volume) and Tariffs
Note: (Ex-factory price) = (Unit Price) – (Tariff), (Unit Price) = (Refereed Price) x 90%
Western Europe(Belgium, Germany, Spain)
1,035 $/T x 20 KMTA
Eastern Europe(Poland, Lithuania)
1,035 $/T x 120 KMTA
China1,026 $/T x 110 KMTA
Karabatan(PTA-production use)1,026 $/T x 246 KMTA Tariff: 2 $/T
Tariff: 200 $/T
Tariff: 85 $/T
Tariff: 75 $/T
S-14

Figure S-3-2: Product BZ : Targeted Markets (Unit Price x Volume) and Tariffs
Note: (Ex-factory price) = (Unit Price) – (Tariff), (Unit Price) = (Refereed Price) x 90%
Tariff: 2 $/TKarabatan(EB-production use)740 $/T x 133 KMTA
Tariff: 2 $/T
S-15
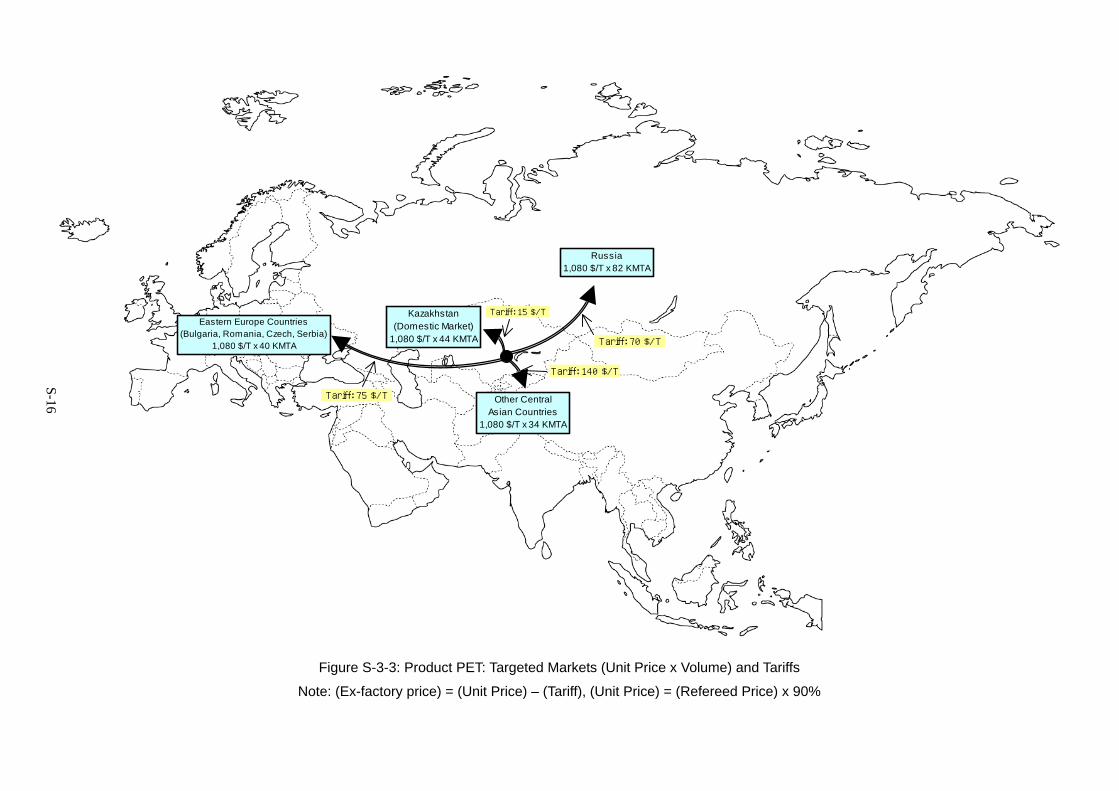
Figure S-3-3: Product PET: Targeted Markets (Unit Price x Volume) and Tariffs
Note: (Ex-factory price) = (Unit Price) – (Tariff), (Unit Price) = (Refereed Price) x 90%
Eastern Europe Countries(Bulgaria, Romania, Czech, Serbia)
1,080 $/T x 40 KMTA
Tariff: 75 $/T
Kazakhstan(Domestic Market)
1,080 $/T x 44 KMTA
Tariff: 15 $/T
Russia1,080 $/T x 82 KMTA
Tariff: 70 $/T
Other CentralAsian Countries
1,080 $/T x 34 KMTA
Tariff: 140 $/T
S-16

Figure S-3-4: Product PVC: Targeted Markets (Unit Price x Volume) and Tariffs
Note: (Ex-factory price) = (Unit Price) – (Tariff), (Unit Price) = (Refereed Price) x 90%
Eastern Europe Countries(Bulgaria, Romania, Czech, Serbia)
873 $/T x 0 KMTA
Tariff: 75 $/T
Russia1,053 $/T x 65 KMTA
Tariff: 70 $/T
Tariff: 15 $/T
Kazakhstan(Domestic Market)
1,053 $/T x 52 KMTA
Turkey873 $/T x 54 KMTA
Tariff: 65 $/T
Tariff: 140 $/T
Other CentralAsian Countries
1,053 $/T x 29 KMTA
S-17

Figure S-3-5: Product NaOH (caustic soda): Targeted Markets (Unit Price x Volume) and Tariffs
Note: (Ex-factory price) = (Unit Price) – (Tariff), (Unit Price) = (Refereed Price) x 90%
Eastern Europe Countries391 $/T x 70 KMTA
Tariff: 75 $/TTariff: 15 $/T
Kazakhstan(Domestic Market)270 $/T x 56 KMTA
S-18

Figure S-3-6: Product EB: Targeted Markets (Unit Price x Volume) and Tariffs
Note: (Ex-factory price) = (Unit Price) – (Tariff), (Unit Price) = (Refereed Price) x 90%
Aktau(SM/PS Plant)
903 $/T x 179 KMTA
Tariff: 10 $/T
S-19

Figure S-3-7: Product PTA: Targeted Markets (Unit Price x Volume) and Tariffs
Note: (Ex-factory price) = (Unit Price) – (Tariff), (Unit Price) = (Refereed Price) x 90%
Russia789 $/T x 150 KMTA
China791 $/T x 39 KMTA
Tariff: 70 $/T
Tariff: 200 $/T
S-20

S-21
3-2. Prices of Raw-materials to be procured
(1) Summary
1) Aromatics Project
Table S-3-11: Reformate Price
Feeds Volumes Unit Costs Remarks
Reformate 889 KMTA 342 US$/MT = 43,860 KTZ/MT (@ 0.0077912 US$/KZT)
2) Petrochemical Complex
Table S-3-12: Raw-material Prices Study Cases Products Volumes Unit Costs
All PET + EB PVC
PX 246 KMTA 1,026 US$/MT (= 1,024 + 2)* Yes Yes
BZ 133 KMTA 740 US$/MT (= 738 + 2)* Yes Yes
Ethylene See Right Columns
927 US$/MT (= 1,030 x 90%)**
Yes 183 KMTA
Yes 89 KMTA
Yes 94 KMTA
Acetic Acid 22 KMTA 376 US$/MT (= 418 x 90%)** Yes Yes
Salt Rock 172 KMTA 30 US$/MT Yes Yes
Total 756 KMTA
*: (Ex-factory Price) + (Tariff), ** (Trade Unit Value) x 90 %
(2) PX and BZ
It is necessary to adjust both the PX and BZ prices in view of the profitability between the two
projects of the Aromatics Project and the Petrochemical Complex.
(3) Ethylene
1) The Project refers to the data of sales prices of 1,030 US$/MT experienced among Germany,
Belgium, Netherlands and France at the year of 2006 in view of land business and not maritime
one
2) It is noted that the production cost of ethylene that is produced from ethane, ranges from
110$/MT to 200$/MT in the cases of Saudi Arabia, Qatar and Iran.
3) It is necessary to minimize the procurement cost in order to increase the profitability of the
Petrochemical Complex.

S-22
4. Utility and Offsite Facilities (Chapter 5)
4-1. Aromatics Project in Atyrau Oil Refinery
(1) Utility Requirement
Table S-4-1: Utility Requirement for BZ and PX Production
(BZ; 133 KMTA PX; 496 KMTA)
Utilities Unit Consumption Utilities Unit Consumption
HP STM t/h 92.5 Electric Power kW 10,705
MP STM t/h -31.0 Fuel Gas (C) MMkcal/h 195.5
LP STM t/h 2.8 Fuel Gas (P) MMkcal/h -128.9
Condensate t/h -96.4 Nitrogen Nm3/h 30
BFW t/h 40.7 Instrument Air Nm3/h 500
Cooling Water M3/h 3,338 Refinery Air Nm3/h 9
(C); Consumption, (P); Production
(2) Utility Facility Plan
Because BZ and PX Production facilities require is no special utility for which is scarcely
utilized for general oil refining process, the most of utility will be supplied from existing Atyrau Oil
Refinery by the cost and fee basis payment. However, the existing Oil Refinery has not a high
pressure steam source to supply to BZ and PX Production facilities. Also, as for electricity and
cooling water it has not surplus capacity to supply them to BZ and PX Production facilities.
Accordingly, the utility facility plan including consumption by OSBL facilities for BZ and PX
Production might be one as shown bellow.
- Boilers 75 t/h×2 sets at 42 ata, and 420 ℃
- Demineralizers 50 t/h×2 sets
- Cooling Water System 5,000 t/h×1 sets
- Substation to receive and Distribute Electricity 15,000 KW
(3) Offsite Facility Plan
1) Railway Facilities
Modification of existing railway system might be required for transportation of BZ and PX
from BTX extraction unit to Karabatan aromatics plant. In order to mitigate the congestion of
railway operation at Karabatan, the possibility of tank lorry application for BZ and PX
transportation is simultaneously under study.

S-23
2) Loading Facilities for BZ and PX
The closed type loading facility, provided with vapor recovery system, is planed for shipping
of BZ and PX respectively without harmful vapor emission into the air. BZ will be shipped by 3
sets of loading arm and PX by 12 sets.
3) Storage Tanks
For BZ, 3 sets of each 1,500 Kl tank, provided with steam coil jacket and vapor recovery and
nitrogen blanket system, will be installed.
For PX, 4 sets of each 3,000 Kl tank, provided with steam coil jacket and vapor recovery and
nitrogen blanket system, will be installed.
4) Miscellaneous
As well as in case of utility facility plan, it is envisaged that following miscellaneous offsite
facilities might be integrated into that of existing facilities in Atyrau Oil Refinery. Needless to
say the expense to operate these facilities shall be shared by BZ and PX production faciliyies in
proportion to its utilization.
- Flare Stack
- Waste Water Treating Facilities
- Warehouse for consumable subsidiary
materials and maintenance materials
- Repair Shop
- Gateman Substation
- Hangar for Fire Fighting Materials and
Vehicles
- Laboratory
- Administrative Building
4-2. Petrochemical Complex in Karabatan Site
(1) Utility Requirement
Table S-4-2 Utility Requirement for Aromatic Complex in Karabatan
EB (179KMTA), PTA (362KMTA), PET (200KMTA) and PVC (200 KMTA)
Utilities EB PTA PET PVC Total
HP-STM t/h
MP-STM t/h 55 55
LP-STM t/h -31 123 -2 90
Cooling Water m3/h 28 16,000 3,948 5,397 19,565
Process Water m3/h 122 180
BFW m3/h 35 8 43

S-24
Table S-4-2 Utility Requirement for Petrochemical Complex in Karabatan (Continued)
EB (179KMTA), PTA (362KMTA), PET (200KMTA) and PVC (200 KMTA)
Utilities EB PTA PET PVC Total
BFW m3/h 35 8 43
Potable Water m3/h 10
Electricity KW 205 18,000 7,987 56,000 82,192
Fuel Gas MMkcal/h 22,000 13,700 18,000 53,700
Nitrogen Nm3/h 800 800
Instrument Air Nm3/h 100 300 300 300 1,000
Refinery Air Nm3/h 1,500
(2) Utility Facility Plan of Petrochemical Complex
In this Study, the Petrochemical Complex will be self-sufficient for all utilities excluding fuel
gas and industrial water. However, it should be noted that joint possessing and operating the
utility facilities with the nearby Olefin and Polyolefin Complex will be more preferable to cut both
of the construction cost and operating cost. It is recommendable to adjust the utility facility plan
with that of Olefin and Polyolefin Complex.
1) Steam and Power Generation System
Judging from small demand of steam and enormous demand of electricity, cogeneration
system of steam and power by gas turbine will be the most recommendable for Petrochemical
Complex in Karabatan Site. In comparison with gas turbine cogeneration system of steam and
power, BTG cogeneration system requires more fuel and cooling water.
- Gas Turbine; 33,000 KW x 3 sets
- Heat Recovery Boiler; 42 ata x 420 ℃ x 60 t/h x 3 sets
- Steam Turbine Generator; 9,000 KW x 1set (Extraction type)
- Fuel Consumption; 340 MMkcal /h
- Cooling Water Requirement; 3,000 m3/h
2) Water Treating System
- Clarifier/Filter 500 m3/h x 2 sets with 2 sets of 2,000 Kl tanks
- Demineralizing Unit 150 m3/h x 3 sets with 2 sets of 2,000 Kl tanks
- Silica Polisher 150 m3/h x 2 sets with 2 sets of 2,000 kl tanks
- Potable Water System 10 m3/h x 2 sets with 2 sets of 100 Kl tanks
S-25
3) Cooling Water System
- Cooling Tower 10,000 m3/h x 4 sets (Induced Draft Type)
- Circulation Pump 10,000 m3/h x 30 m x 6 sets
- Side Stream Filter 1,000 m3/h x 1 set
- Cooling Water Make-up 850 m3/h (Incl. make-up for 180 m3/h blow)
4) Fuel Gas System
- Sphere holder 500 m3 x 1 set
- Fuel Gas Compressor 30,000 Nm3/h (≑ 20 ata.) x 1 set
5) Compressed Air System
- Air Compressor 1,500 Nm3/h 2 sets (2 stage compression)
- Drier 1,500 Nm3/h 1 set
- Compressed Air Holder 500 m3 x 1 set for instrument air
6) Fire Fighting System
- F.F.W. Pump 600 m3/h x 120m x 2 sets of (One diesel engine driven)
- Foam Maker for Flannable Material Storage Tank
(3) Offsite Facility Plan
As well as utility facility plan, offsite facility plan of Petrochemical Complex should be also
adjusted with that of Olefin and Polyolefin’s one for rationalization in construction and operation.
Especially, shipping facilities including the functional structure of freight terminal and operational
management of the freight cars should be carefully studied with Olefin and Polyolefin Complex in
order to mitigate the congestion in products shipping facilities.
1) Railway Extension
At a minimum requirement, excluding that of Olefin and Polyolefin Complex, double track
railway of 3 km distance between Karabatan station and Petrochemical Complex might be
necessary
2) Loading/Unloading Facilities for Liquid Feedstock and Product
Unloading System; The closed type unloading facilities for BZ and PX with nitrogen

S-26
blanketing system shall be respectively installed.
Loading System; The closed type loading facility for EB with vapor recovery system shall
be installed.
3) Unloading Facility for Solid Feedstock
Unloading system; Solid unloading system for rock salt, which consist of dumping pit,
conveyors and storages, shall be installed.
4) Unloading Facilities for PET and PVC Products
Each unloading system for PET and PVC products will include following components
- Pellet Weighing System with Pneumatic Transportation Apparatus
- Pellet Silos with Pneumatic Transportation Apparatus
- Pellet Bagging System
- Bag Palletizing System
- Warehouse for Product bag Pallets (See item (7) in details)
- Container Yard for Product Shipping
5) Storage Tanks
Storage tanks for feedstock and products shall be installed
- Benzene Tank 1,000 Kl×3 sets with steam coil jacket and vapor recovery and nitrogen
blanket system
- PX Tank 3,000 Kl×3 sets with steam coil jacket and vapor recovery and nitrogen
blanket system
- EB Tank 1,000 Kl×3 sets with vapor recovery and nitrogen blanket system
- Fuel Oil Tank 2,000 Kl×3 sets with steam coil jacket
6) Flare Stack;
One elevated flare stack provided with accessories including seal drum
7) Waste Water Treating Facilities
After harmless treatment such as neutralization of acids and alkalis within the each process
unit, waste water finally goes into settling basin for biological stabilization. Harmless waste

S-27
water without salt such as blow out water of cooling tower might be utilized for irrigation.
8) Warehouse;
- Product Warehouse Automated warehouse for PTA; 20mw×70ml×20mh
Automated warehouse for PET; 20mw×70ml×20mh
Automated warehouse for PVC; 20mw×70ml×20mh
- Common Warehouse Warehouse for consumable subsidiary materials such as catalysts and
lube oil and maintenance materials including spare parts;
20mw×50ml ×6mh
9) Repair Shop; Equipped with fundamental machine tools, testing equipment and overhead
crane; 30mw×50ml×15mh
10) Gateman Substation;
For security of the plant, gate has to be managed by full time shift gatemen and daytime
gatemen
11) Hangar for Fire Fighting Materials and Vehicles; 15mw ×12ml×8mh
Fire fighting materials and vehicles might be jointly managed neighboring plants including
olefin and polyolefin complex to share the preparatory expense against the accidental fire.
12) Laboratory
The members responsible for laboratory consist of both daily and shift staffs for quality
control of feed stocks, intermediate and final products. 15mw 25ml 2 floors
13) Administrative Building;
Total floor space of 4,500 m2 for preliminarily estimated 200 daytime employees.
25mw×60ml×3 floors
5. Economic Conditions (Chapter 6)
5-1. Project Costs
The project costs are currently calculated at an accuracy of 40 % at the maximum, which has
been agreed with KMG.

S-28
5-1-1. Aromatics Project
The construction period of the ISBL and OSBL is estimated at 36 months in a normal state;
however, it might extend to 48 months in the case where such a tight state would continue.
Table S-5-1: Project Costs for Aromatics Project
Production-cost Item (MM US$) Note
- Onsite Portion of EPC (ISBL) 600 Including royalty & catalyst charge.
- Offsite Portion of EPC (OSBL) 360 Utility and offsite facilities
EPC Cost 960
Preproduction Expenditures 30 3 % of EPC Cost
Initial Working Capital 10
Interest during Construction (IDC) Later
Project Cost 1,000 + IDC
5-1-2. Petrochemical Complex
The construction period of the ISBL and OSBL is estimated at 42 months in a normal state;
however, it might extend to 48 months in the case where such a tight state would continue.
Table S-5-2: Project Costs for Petrochemical Complex
(MM US$)
Production-cost Item Case 1
All Case 2
PET + EB Case 3
PVC
- Onsite Portion of EPC (ISBL) 1,020 600 430
- Offsite Portion of EPC (OSBL) 610 360 260
EPC Cost 1,630 960 690
Preproduction Expenditures 50 30 20
Initial Working Capital 10 10 10
Interest during Construction (IDC) Later Later Later
Project Cost 1,690 + IDC 1,000 + IDC 720 + IDC

S-29
5-2. Balance between Product Revenues and Raw-material Costs
Note: Here, the “Unit Price” means the ex-factory price for the Product, and the purchasing
price for the Feed.
5-2-1. Aromatics Project
Table S-5-3-1: Expected Revenues and Raw-material Costs of Aromatics Project
Volumes (KMTA)
Unit Prices (US$/MT)
Revenue / Cost (MM$)
Feed Reformate(C5+) 889 342 304
Cost Total 889 304
Products Raffinate 149 342 51
BZ 133 738 98
PX 496 962 477
Heavies 43 468 20
Revenue Total 821 646
Product Revenue – Feed Cost 342
5-2-2. Petrochemical Complex
Table S-5-3-2: Expected Revenues and Raw-material Costs of Petrochemical Complex
Case 1: PET + EB + PVC
Feed PX 246 1,026 252BZ 133 740 98Ethylene 183 927 170Acetic Acid 22 376 8Salt Rock 171 30 5Cost Total 755 533
Product PTA 189 693 131PET 200 1,009 202EB 179 893 160PVC 200 940 188NaOH 125 289 36Revenue Total 893 717
Revenue - Feed 184
Feed andProduct
Volumes(KMTA)
Ex-factory Price(US$/MT)
Revenues or Costs(MM$)

S-30
Case 2: PET + EB
Feed PX 246 1,026 252BZ 133 740 98Ethylene 89 927 83Acetic Acid 22 376 8Cost Total 490 441
Product PTA 189 693 131PET 200 1,009 202EB 179 893 160Revenue Total 568 493
Revenue - Feed 52
Revenues or Costs(MM$)
Feed andProduct
Ex-factory Price(US$/MT)
Volumes(KMTA)
Case 3: PVC
Feed Ethylene 94 927 87Salt Rock 171 30 5Cost Total 265 92
Product PVC 200 940 188NaOH 125 289 36Revenue Total 326 224
Revenue - Feed 132
Ex-factory Price(US$/MT)
Feed andProduct
Ex-factory Price(US$/MT)
Volumes(KMTA)
The profitability of the Petrochemical Complex is much worse than that of the Aromatics
Project. In order to improve the profitability it is necessary to make studies including reduction of
the costs for raw-material such as PX, BZ and ethylene.
5-3. Utilities Quantities and Costs
(1) Aromatics Project
Table S-5-4 Utility Requirements and Costs for Aromatics Project
Item of Expense Description
Electricity 0.06 $/KWH 11,000 KW 5,280 Totally purchasedHigh Pressure Steam 6.2 $/ton 93 ton/H 4,613Middle Pressure Steam 6.2 $/ton -31 ton/H -1,538Low Pressure Steam 6.2 $/ton 3 ton/H 149Cooling Water 0.06 $/ton 3,300 ton/H 1,584Condensate 2.22 1,000$/Y -96 ton/H -1,705Process Water/BFW 2.22 1,000$/Y 41 ton/H 728
Fuel Gas (Natural Gas) 0.004 $/MMcal 67 MMcal/H 2 Balance betweenConsumption and Production
Inert Gas 0.02 $/Nm3 30 $/Nm3 5Instrument Air 0.006 $/Nm3 500 $/Nm3 24Refinery Air
Total 9,142
Cost(1,000$/Y)Unit Price Consumption
Nil.

S-31
(2) Petrochemical Complex
Table S-5-5-1: 362 KMTA -PTA Production: Utility Requirements and Costs
Item of Expense Description
Electricity 0.06 $/KWH 18,000 KW 8,640 Totally purchasedHigh Pressure Steam 6.2 $/ton 0 ton/H 0Middle Pressure Steam 6.2 $/ton 0 ton/H 0Low Pressure Steam 6.2 $/ton 120 ton/H 5,952Cooling Water 0.06 $/ton 16,000 ton/H 7,680Process Water/BFW 2.22 1,000$/Y 0 ton/H 0Fuel Gas 0.004 $/MMcal 0 MMcal/H 0Natural Gas 0.004 $/MMcal 22,000 MMcal/H 704
Inert Gas 0.02 $/Nm3 0 Byproduct of oxygen production
Instrument Air 0.006 $/Nm3 300 $/Nm3 14Refinery Air 0Vehicle Fuel 1,000 $/Kl 33 Kl/Y 33 Forklift
Total 23,023
Nil.
Cost(1,000$/Y)Unit Price Consumption
Nil.
Table S-5-5-2: 200 KMTA -PET Production: Utility Requirements and Costs
Item of Expense Description
Electricity 0.06 $/KWH 8,000 KW 3,840 Totally purchasedHigh Pressure Steam 6.2 $/ton 0 ton/H 0Middle Pressure Steam 6.2 $/ton -2 ton/H -99Low Pressure Steam 6.2 $/ton 0 ton/H 0Cooling Water 0.06 $/ton 4,000 ton/H 1,920Process Water/BFW 2.22 1,000$/Y 0 ton/H 0Fuel Gas 0.004 $/MMcal 0 MMcal/H 0Natural Gas 0.004 $/MMcal 13,700 MMcal/H 438
Inert Gas 0.02 $/Nm3 0 Byproduct of oxygen production
Instrument Air 0.006 $/Nm3 300 $/Nm3 14Refinery Air 0Vehicle Fuel 1,000 $/Kl 33 Kl/Y 33 Forklift
Total 6,146
Nil.
Cost(1,000$/Y)Unit Price Consumption
Nil.
Table S-5-5-3: 179 KMTA -EB Production: Utility Requirements and Costs
Item of Expense Description
Electricity 0.06 $/KWH 200 KW 96 Totally purchasedHigh Pressure Steam 6.2 $/ton 0 ton/H 0Middle Pressure Steam 6.2 $/ton 0 ton/H 0Low Pressure Steam 6.2 $/ton -31 ton/H -1,538Cooling Water 0.06 $/ton 28 ton/H 13Process Water/BFW 2.22 1,000$/Y 35 ton/H 622Fuel Gas 0.004 $/MMcal 0 MMcal/H 0Natural Gas 0.004 $/MMcal 0 MMcal/H 0Inert Gas 0.02 $/Nm3 0 Byproduct of oxygen productionInstrument Air 0.006 $/Nm3 100 Nm3/H 5Refinery Air 0Vehicle Fuel 1,000 $/Kl 0 Kl/Y 0 Forklift
Total -802
Nil.
Cost(1,000$/Y)Unit Price Consumption
Nil.

S-32
Table S-5-5-4: 200 KMTA -PVC Production: Utility Requirements and Costs
Item of Expense Description
Electricity 0.06 $/KWH 56,000 KW 26,880 Totally purchasedHigh Pressure Steam 6.2 $/ton 0 ton/H 0Middle Pressure Steam 6.2 $/ton 55 ton/H 2,728Low Pressure Steam 6.2 $/ton 0 ton/H 0Cooling Water 0.06 $/ton 5,400 ton/H 2,592Process Water/BFW 2.22 1,000$/Y 120 ton/H 2,131
Fuel Gas 0.004 $/MMcal 18,000 MMcal/H 576 Balance between consumptionand production
Natural Gas 0.004 $/MMcal 0 MMcal/H 0Inert Gas 0.02 $/Nm3 800 Nm3/H 0 Byproduct of oxygen productionInstrument Air 0.006 $/Nm3 300 Nm3/H 14Refinery Air 0Vehicle Fuel 1,000 $/Kl 33 Kl/Y 33 Forklift
Total 34,954
Nil.
Cost(1,000$/Y)Unit Price Consumption
5-4. Manpower Required
We calculate the manpower required for running the Projects. The Petrochemical Complex
might establish a company of the Special Purpose Company (SPC). It is necessary to confirm the
manpower payment especially for the home-office listed in Table 5-6-3.
Table S-5-6-1: Manpower required for Aromatics Project
Required
Administrative Personnel 20 Production Section
- Production Manager / Sub-manager 2
- Production Control 2
- Operation Staff 3
- Shift Operator (4 shifts x 10) 40
Subtotal 47
Technical / Maintenance Section
- Manager / Sub-manager / Secretary 3
- Process Engineer 2
- Mechanical Engineer 4
- Maintenance Technician 27
Subtotal 36
Total 103

S-33
Table S-5-6-2: Manpower required for Petrochemical Complex
Production PET EB PVC Total
Administrative Personnel 12 5 16 33 Production Section
- Shift Operator (4 shifts) 88 12 72 172
- ProductionManagement 9 3 9 21
- Shipping Management 10 3 10 23 Subtotal 107 18 91 216 Technical / Maintenance Section
- Manager / Sub-manager / Secretary 3 1 4 8
- Process Engineer 2 1 2 5
- Mechanical Engineer 3 1 4 8
- Maintenance Technician 26 6 32 64 Subtotal 34 9 42 85
Total 153 32 149 334
Table S-5-6-3: Manpower for Head Office
(Company for Petrochemical-complex Project)
President 1
Auditor 1
Director 3
General Affairs 10
Personnel Affair 2
Accountant 2
Sales 6
Total 25
6. Project Economy (Chapter 7)
KMG can settle the following parameters in order to improve the profitability:
(1) The unit costs for purchasing of PX and BZ as the raw-materials;
(2) The volume of PTA to be exported, and;
(3) The volumes of PET and PVC to be produced.
6-1. Unit costs for purchasing of PX and BZ
We calculate for the following cases the internal rate of return (IRR) of the Project in a
preliminary cash flow:

S-34
Table S-6-1: Explanation of Cases for Petrochemical Complex
Outline of Schemes Unit costs
for purchasing of PX and BZ Case 1A A scheme integrated with the Aromatics
Project to produce PET, PVC and EB. Both the Aromatics Project and the Petrochemical Complex have the same rate of IRR.
Case 2A A scheme integrated with the Aromatics Project to produce PET and EB.
Both the Aromatics Project and the Petrochemical Complex have the same rate of IRR.
Case 3 A scheme, of standing alone, to produce PVC.
The scheme has no relation between PX and BZ.
Table S-6-2: Products and Feeds made in Petrochemical Complex
Case 1A: PET + EB + PVC (integrated with Aromatics Project)
Feed Reformate (C5+) 889 342 304Ethylene 183 927 170Acetic Acid 22 387 8Salt Rock 171 30 5Cost Total 1,265 487
Product PX (Exporting) 250 900 225Raffinate 149 342 51Heavies 43 468 20PTA 189 693 131PET 200 1,009 202EB 179 893 160PVC 200 940 188NaOH 125 222 28Revenue Total 1,335 1,005
Revenue - Feed 518
Volumes(KMTA)
Unit Price(US$/MT)
Revenues or Costs(MM$)Products
Case 2A: PET + EB (integrated with Aromatics Project)
Feed Reformate (C5+) 889 342 304Ethylene 89 927 83Acetic Acid 22 376 8Cost Total 1,000 395
Product PX (Exporting) 250 900 225Raffinate 149 342 51Heavies 43 468 20PTA 189 693 131PET 200 1,009 202EB 179 903 160Revenue Total 1,010 789
Revenue - Feed 394
Revenues or Costs(MM$)Products Unit Price
(US$/MT)Volumes(KMTA)
Case3: PVC (Standing alone)
Feed Ethylene 94 927 87Salt Rock 171 30 5Cost Total 265 92
Product PVC 200 940 188NaOH 125 222 28Revenue Total 326 216
Revenue - Feed 124
Revenues or Costs(MM$)Products Unit Price
(US$/MT)Volumes(KMTA)

S-35
Table S-6-3 illustrates the profitability for the cases, in which the PVC production of the Case
3 makes the profitability worse.
Table S-6-3: Profitability of Case 1 A, Case 2A and Case 3, before tax
IRR NPV @ 10.5% Equity Payout Remarks
(%) (MM$) (years) Figures of Body
Case 1A 1.7 -1,766 11 Table 7-3
Case 2A 2.7 -1,192 11 Table 7-4
Case 3 -0.9% -590 12 Table 7-5
PX and BZ would have the prices respectively, 567$/T and 409$/T in the case where the
Petrochemical Complex of standing alone has the rate of 2.7% as the IRR (Case 4, of Table 7-8).
Table S-6-4: Profitability of Case 4, before tax
IRR NPV @ 10.5% Equity Payout Remarks
(%) (MM$) (years) Figures of Body
Case 4 2.7 -599 11 Table 7-8
6-2. Volume of PTA to be exported
The profitability of Case 4 would be at the best in the case where the PTA is not exported.
Table S-6-5: Changing of Profitability (Case4)
corresponding to reducing of PTA exports, before tax
PTA ProductionPTA Production Capacity KMTA 362 290 217 173PTA Exporting KMTA 189 117 44 0Russia (719$/T) KMTA 150 117 44 0China (591$/T) KMTA 39 0 0 0
PTA-exporting Unit Price $/T 693 719 719
PX Comsumption (567$/T) KMTA 246 197 147 117
EPC Cost MMUS$ 960 880 780 720Other Project Costs MMUS$ 160 150 120 110Project Cost MMUS$ 1,120 1,030 900 830Equity MMUS$ 170 150 130 120Loan MMUS$ 950 880 770 710
IRR %NPV at discount rate of 10.5% MMUS$ -599 -551 -462 -420Equity Payout Period year 11 11 10 10
ー
47.7%100% 80% 60%
2.7% 2.9% 3.1% 3.3%

S-36
6-3. Volume of PET to be produced
The profitability of Case 4 would be better in the case where the PET is produced at a smaller
volume.
Table S-6-6: Changing of Profitability corresponding to reducing of PET production
PET ProductionPET Production Capacity KMTA 200 160 120 100Kazakhstan (1,065$/T) KMTA 44 44 44 44Russia (1,010$/T) KMTA 82 82 76 56Eastern Europe (1,005$/T) KMTA 40 40 0 0Other Central Asian Countries (940$/T) KMTA 34 14 0 0
PET Unit Price $/T 1,009 1,024 1,030 1,034
PTA Production Capacity KMTA 362 328 293 276PTA Exporting KMTA 189 189 189 189
PX Comsumption (567$/T) KMTA 246 223 199 187
EPC Cost MMUS$ 960 860 770 720Other Project Costs MMUS$ 160 140 120 110Project Cost MMUS$ 1,120 1,000 890 830Equity MMUS$ 170 150 130 120Loan MMUS$ 950 850 760 710
IRR %NPV at discount rate of 10.5% MMUS$ -599 -507 -440 -397Equity Payout Period year 11 10 10 9
2.7% 3.2% 3.4% 4.0%
50%100% 80% 60%
6-4. Case with PET production at 100KMTA and without exporting of PTA (Case 5)
Table S-6-7 illustrates the cash flow in the case where in the Case 4 the PET would be
produced at 100 KMTA but the PTA would not be exported, which the Study name Case 5.

S-37
Table S-6-7: Preliminary Cash Flow before Tax (Case 5: PET at 100KMTA, without PTA) (MMUS$)
-4 -3 -2 -1 1 2 3 10 11-20Operation Rate 85% 95% 100% 100% 100%
Sales Revenue (A)- PTA (0KMTA x 719$/T) 0 0 0 0 0- PET (100KMTA x 1,034$/T) 88 98 103 103 103- EB (179KMTA x 893$/T) 136 152 160 160 160Sub-total (A) 224 250 263 263 263
Feed Costs- PX (59KMTA x 567$/T) -28 -31 -33 -33 -33- BZ (133KMTA x 409$/T) -46 -51 -54 -54 -54- Ethylene (68KMTA x 927$/T) -54 -60 -63 -63 -63- Acetic Acid (5KMTA x 376$/T) -2 -2 -2 -2 -2Sub-total (B) -130 -144 -152 -152 -152
Utility Costs- PTA Production (87KMTA) -5 -6 -6 -6 -6- PET Production (100KMTA) -3 -3 -3 -3 -3- EB Production (179KMTA) 1 1 1 1 1Sub-total (C) -8 -9 -9 -9 -9
Catalyst & Chemicals- PTA Production (87KMTA) -2 -2 -2 -2 -2- PET Production (100KMTA) 0 0 0 0 0- EB Production (179KMTA) -1 -1 -1 -1 -1Sub-total (D) -3 -3 -3 -3 -3
Direct Fixed Cost- Manpower (Average20,000*$/Y x 185Psns) -4 -4 -4 -4 -4- Overheads (Manpower 4MM$ x 12%) 0 0 0 0 0- Maintenance (EPC Cost 450MM$ x 2%) -9 -9 -9 -9 -9- Insurance (EPC Cost 450MM$ x 0.1%) 0 0 0 0 0Sub-total (F) -13 -13 -13 -13 -13
- Loan Repayment (440**MM$ x 10Years) -44 -44 -44 -44 0- Loan Interest (440**MM$ x 8%) -35 -32 -28 -4 0** including IDC: 50MM$
Sub-total (G) -79 -76 -72 -48 0
Project Costs (H)- Project Costs other than IDC: 470MM$ -80 -130 -130 -130(Equity: 80MM$, 15% of Project Cost: 520MM$)
Grand Total (A)~(H) -80 -130 -130 -130 -9 5 14 38 86
Note: *Operators: 1.63MMKTZ x 60% + Engineers: 2.71MMKTZ x 30% + Managers: 8.16MMKTZ x 10%
Net Present Value (before tax) (MMUS$)Discount Rates -4 -3 -2 -1 1 2 3 10 Total***
5.7% -80 -123 -116 -110 -7 4 10 19 010.5% -80 -118 -106 -96 -6 3 8 10 -185
Equity-payout-period Calculation (MMUS$)Equity to be returned: (paid out at 6th year) -20 -40 -60 -80 -80 -75 -61 paid out*** Totaling NPVs from the Project commencement to the 20th year.
Project Year
PET ProductionPET Production Capacity KMTA 100Kazakhstan (1,065$/T) KMTA 44Russia (1,010$/T) KMTA 56Eastern Europe (1,005$/T) KMTA 0Other Central Asian Countries (940$/T) KMTA 0
PET Unit Price $/T 1,034
PTA Production Capacity KMTA 87PTA Exporting KMTA 0
PX Comsumption (567$/T) KMTA 59
EPC Cost MMUS$ 450Other Project Costs MMUS$ 70Project Cost MMUS$ 520Equity MMUS$ 80Loan MMUS$ 440
IRR %NPV at discount rate of 10.5% MMUS$ -185Equity Payout Period year 6
50%
5.7%
S-38
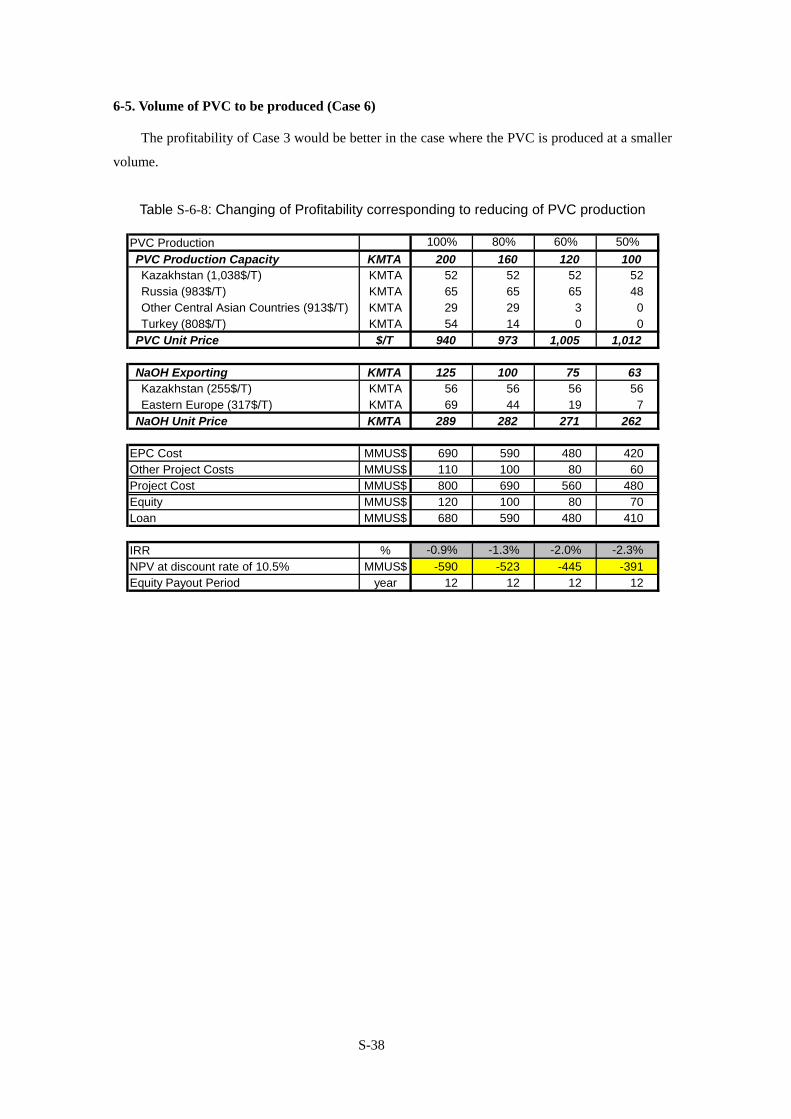
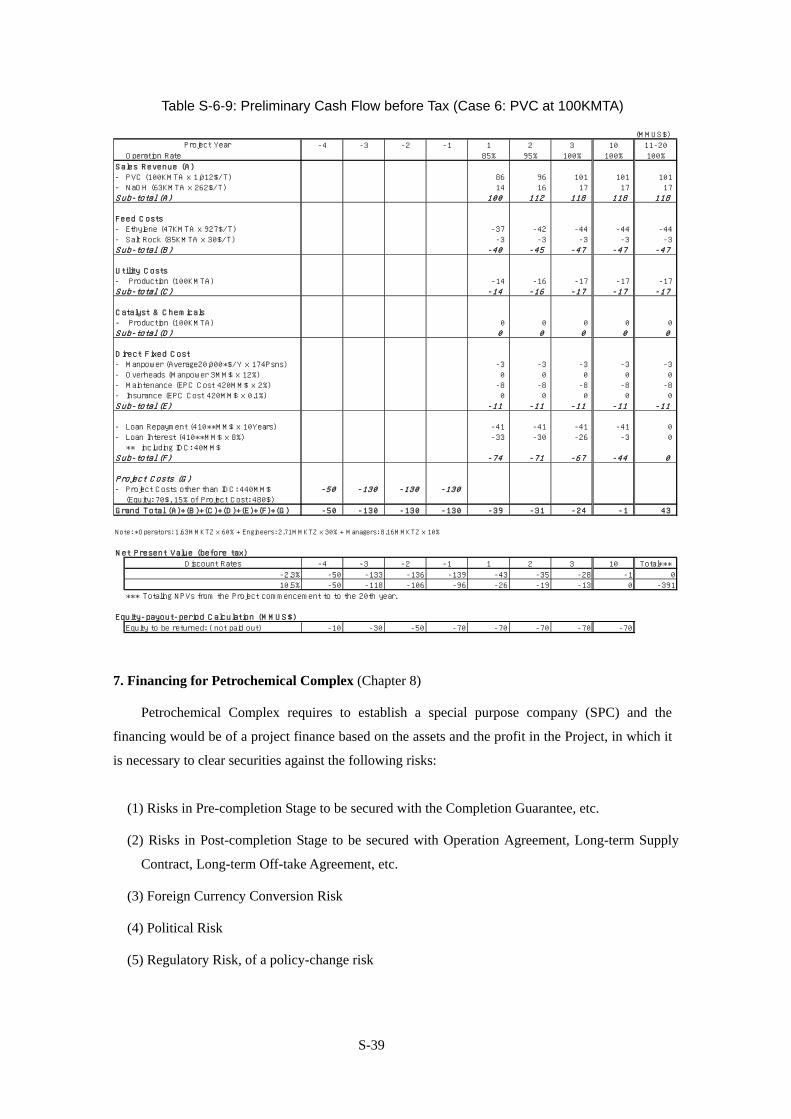
6-5. Volume of PVC to be produced (Case 6)
The profitability of Case 3 would be better in the case where the PVC is produced at a smaller
volume.
Table S-6-8: Changing of Profitability corresponding to reducing of PVC production
PVC ProductionPVC Production Capacity KMTA 200 160 120 100Kazakhstan (1,038$/T) KMTA 52 52 52 52Russia (983$/T) KMTA 65 65 65 48Other Central Asian Countries (913$/T) KMTA 29 29 3 0Turkey (808$/T) KMTA 54 14 0 0
PVC Unit Price $/T 940 973 1,005 1,012
NaOH Exporting KMTA 125 100 75 63Kazakhstan (255$/T) KMTA 56 56 56 56Eastern Europe (317$/T) KMTA 69 44 19 7
NaOH Unit Price KMTA 289 282 271 262
EPC Cost MMUS$ 690 590 480 420Other Project Costs MMUS$ 110 100 80 60Project Cost MMUS$ 800 690 560 480Equity MMUS$ 120 100 80 70Loan MMUS$ 680 590 480 410
IRR %NPV at discount rate of 10.5% MMUS$ -590 -523 -445 -391Equity Payout Period year 12 12 12 12
50%100% 80% 60%
-0.9% -1.3% -2.0% -2.3%
S-39
Table S-6-9: Preliminary Cash Flow before Tax (Case 6: PVC at 100KMTA)
(MMUS$)
-4 -3 -2 -1 1 2 3 10 11-20Operation Rate 85% 95% 100% 100% 100%
Sales Revenue (A)- PVC (100KMTA x 1,012$/T) 86 96 101 101 101- NaOH (63KMTA x 262$/T) 14 16 17 17 17Sub-total (A) 100 112 118 118 118
Feed Costs- Ethylene (47KMTA x 927$/T) -37 -42 -44 -44 -44- Salt Rock (85KMTA x 30$/T) -3 -3 -3 -3 -3Sub-total (B) -40 -45 -47 -47 -47
Utility Costs- Production (100KMTA) -14 -16 -17 -17 -17Sub-total (C) -14 -16 -17 -17 -17
Catalyst & Chemicals- Production (100KMTA) 0 0 0 0 0Sub-total (D) 0 0 0 0 0
Direct Fixed Cost- Manpower (Average20,000*$/Y x 174Psns) -3 -3 -3 -3 -3- Overheads (Manpower 3MM$ x 12%) 0 0 0 0 0- Maintenance (EPC Cost 420MM$ x 2%) -8 -8 -8 -8 -8- Insurance (EPC Cost 420MM$ x 0.1%) 0 0 0 0 0Sub-total (E) -11 -11 -11 -11 -11
- Loan Repayment (410**MM$ x 10Years) -41 -41 -41 -41 0- Loan Interest (410**MM$ x 8%) -33 -30 -26 -3 0** including IDC: 40MM$
Sub-total (F) -74 -71 -67 -44 0
Project Costs (G)- Project Costs other than IDC: 440MM$ -50 -130 -130 -130(Equity: 70$, 15% of Project Cost: 480$)
Grand Total (A)+(B)+(C)+(D)+(E)+(F)+(G) -50 -130 -130 -130 -39 -31 -24 -1 43
Note: *Operators: 1.63MMKTZ x 60% + Engineers: 2.71MMKTZ x 30% + Managers: 8.16MMKTZ x 10%
Net Present Value (before tax)
Discount Rates -4 -3 -2 -1 1 2 3 10 Total***
-2.3% -50 -133 -136 -139 -43 -35 -28 -1 010.5% -50 -118 -106 -96 -26 -19 -13 0 -391
*** Totaling NPVs from the Project commencement to to the 20th year.
Equity-payout-period Calculation (MMUS$)
Equity to be returned: ( not paid out) -10 -30 -50 -70 -70 -70 -70 -70
Project Year
7. Financing for Petrochemical Complex (Chapter 8)
Petrochemical Complex requires to establish a special purpose company (SPC) and the
financing would be of a project finance based on the assets and the profit in the Project, in which it
is necessary to clear securities against the following risks:
(1) Risks in Pre-completion Stage to be secured with the Completion Guarantee, etc.
(2) Risks in Post-completion Stage to be secured with Operation Agreement, Long-term Supply
Contract, Long-term Off-take Agreement, etc.
(3) Foreign Currency Conversion Risk
(4) Political Risk
(5) Regulatory Risk, of a policy-change risk

S-40
8. Environmental and Social Impact (Chapter 10)
Excluding PVC production of which subsidiary raw material is harmful chlorine, the
fundamental raw materials are clean aromatics extracted from reformate and ethylene comes from
ethane in the associated gas. Accordingly, the project is environmentally mild one.
8-1. Impact on Atmospheric Environment
The Atyrau Oil Refinery has been recently promoting the introduction of advanced oil refining
processes to upgrade its oil products. The upstream CCR process of this project is included in the
series of oil product upgrading. In general, advanced oil refining process additionally produces
light hydrocarbon components consumed as fuel gas in the refinery to decrease sulfur containing
fuel oil consumption and air pollutants emission. Actually, the pattern of fuel consumption in the
Atyrau Oil Refinery, which has recently promoted advanced oil refining processes, has converted
from the fuel oil major one to the fuel gas major one. The trend of fuel gas major in fuel
consumption might make it possible to operate high efficient steam and power cogeneration
facilities utilizing gas turbine power generators and heat recovery steam generators. In other
words, the project has a possibility of air quality improvement in Atyrau territory in the future not
causes negative impact on air quality.
In the Karabatan Site, the major part of fuel is consumed for power generation to supply
enormous power to PVC production plant. In order to generate low cost power the application of
gas turbine cogeneration system might be indispensably required. As a result of natural gas
consumption in GTG cogeneration system, the impact of the project implementation on the air
quality will be minimal. Although enormous quantity of harmful chlorine is handled in PVC
production plant, the technologies for prevention of chlorine leakage from enclosure and the
process for harmlessness of chlorine has worldwide developed and utilized. With such reliable
technologies and processes, there will be scarce possibility of serious impact on environmental
issues caused by the PVC production plant.
8-2. Impact on Water Environment
The water utilized in Atyrau Oil Refinery comes from the Ural River, while it is prohibited to
discharge the industrial effluents into the Ural River or the Caspian Sea in order not to damage the
water qualities of them. The Atyrau Oil Refinery utilizes the evaporation pounds for waste water
treatment. With enormous land area and scarce rainfall in Kazakhstan, it is rather general
procedure to utilize the evaporation ponds for waste water treatment and dispose of remaining
wastes in the landfill without inhabitants. Assuming that not only the Atyrau Oil Refinery but
Karabatan Site of the project applies the same procedure of waste water disposal, the project will
not bring serious impact on the qualities of water basins.

S-41
8-3. Industrial Wastes
The major wastes of the project might be waste catalysts and waste polymers. As for waste
catalysts, the recovery system to return them to the suppliers has worldwide firmly established, it
will not be serious issues for project owner. The polymer wastes are substantially stable not to
cause environmental damages, if left as they are. The polymer wastes are sometimes utilized as
off-specification grade or, excluding PVC which includes harmful chlorine, they are burnt in the
incinerator.
As the major raw materials of the project are clean aromatics and ethylene, which do not
contain harmful components such as heavy metals, there will be scarce possibility of serious
environmental issues.
8-4. Noise and Vibration
Because the Atyrau Oil Refinery is situated in the exclusively industrialized zone far from
residential zone, there will be scarce possibility of noise and vibration impact to the inhabitants by
the project implementation. Karabatan Site is situated in the desert area without inhabitant
approximate five (5) km far from neighboring village and there will be scarce possibility of noise
and vibration emitted by the project will not cause any environmental issues.
8-5. Landscape
The Atyrau Oil Refinery is situated in the exclusively industrialized zone not to damage the
landscape by the project implementation. The Karabatan Site is situated in the desert area with
almost no vegetation or artificial structure not to damage the landscape by the project
implementation.
8-6. Social Impact
The project sites of the project are Atyrau Oil Refinery and Karabatan newly developed
industrial zone. The former is in the existing oil refinery, while the later is in the remote desert
zone with no inhabitant. Accordingly, no migration of inhabitant is necessary for the project
implementation in both project sites and the social impact by the project implementation will be
minimal.
The logistic quantities of materials of the project will be 700 KMTA for the Atyrau Oil
Refinery and 1,200 KMTA for the Aromatic Complex in Karabatan Site. The logistic quantities of
materials will not so much change after the project realization in the Atyrau Oil Refinery. For the
Karabatan site with almost no logistic quantities of materials at present, the local traffic impact
caused by the project implementation looks as if quite serious. However, there are few inhabitants
to be affected by the increase in logistic quantities of materials and the social impact by the increase

S-42
in traffic for the project might be minimal in the Karabatan Site.
The increase in employment by the project implementation is expected to be approximately
2,000 employees in total of the Atyrau Oil Refinery and the Karabatan Site during three (3) year
construction phase. The increase in direct employment by the Atyrau Oil Refinery and Aromatics
Complex in Karabatan during commercial operation is expected to be about 300 employees totally.
In addition to the increase of direct employment, the increase in indirect employees of residential
contractors in Atyrau Oil Refinery and Karabatan Site will be approximate 100 employees in total.
Accordingly, the positive social impact by the project implementation will by far exceed the
negative one.
9. Development of Plastic Industry in Kazakhstan (Chapter 9)
9-1.Strengthening and development of educational system to promote plastic industry in
Kazakhstan
9-1-1. Background of human resource development in plastic industry
It seems that there is no integrated manufacturing company from mold designing to the final
plastic products. Absence of plastic industry association makes it difficult to collect definite
information. As for academic institute, there are no special institutes that can teach design and
manufacture precision plastic moldings. Some engineering collage teaches CAD, however, it is
not focus on practical plastic dies making. Also, some university and polytechnic have open
college courses for workers for skill training but it is not directly connecting to plastic molding.
Moreover, vocational training for working people on metalworking and plastic molding is mostly
neglected in the country.
Human resource development is indispensable factor to promote market competitiveness of
plastic industry in Kazakhstan.
9-1-2. Target goal of human resource development in plastic industry
To promote plastic industry of Kazakhstan as an economic driving engine for next generation
9-1-3. Objective to promote human resources
(1) Human resource development is indispensable for production of precision plastic parts and
components
(2) Industrial promotion can first be discussed with nurturing human resources
(3) Qualified human resource could be a creditable drive force in any industry.

S-43
(4) Vocational training, skill improvement for workers, training of qualified technicians and
engineer has not been tackled in the country.
9-1-4. Approaches
(1) Promote products which require only a simple technology to compensate import substitution
and to boost competitiveness within central Asian market
(2) Promote public purchasing in order to nurture domestic production
(3) Enumerate domestic products for import substitution and give special preference to help
them to invest in a high-tech machines
(4) Develop plastic specialized industrial park with common service facility for joint
development, public research institute for technology assistance and for public/private joint
activity
(5) Combine human resource development project and plastic industry promotion project as one
project to enjoy synergetic effects
(6) Discuss precision plastic manufacturing, following the low skill products manufacturing and
training.
9-1-5. Outline of the human resource program
As explained in the above section, human resource development program is better to be
tackled in other project simultaneously because it is targeting to boost national economy at final.
Here, we will introduce only an outline of the human resource development program by
summarizing mile stone subjects.
(1) Associate relating companies and organizations
(2) Develop resource network
(3) Make training of instructors
(4) Strengthen training facility and equipment to execute improvement of training program
9-2. Establishment of plastic industry association
9-2-1. Objective of the recommendation
Association, generally, deal with increasing profit of the industry. However, there is no
association representing plastic industry in Kazakhstan.

S-44
9-2-2. Approach to establish industrial association
Most of business entities do not aware of the importance and capability of association. This
is the main reason why association activities in Kazakhstan do not active. In addition to self effort
by private entities, governmental support is also significant to establish the association.
(1) Top priority activity to establish the association:
- Irradiate private firms about the profit to associate
(2) Support from the government
- Cooperative Law for industrial sector
- Law for commerce and industry cooperative
- Law for credit cooperative
9-2-3. Activities of Japan Plastics Industry Federation (JPIF)
The following activities of JPIF would provide the Project with useful information:
(1) Activities for the plastics industry such as assistance in taxation, making of measures for
SMEs and against recessions, etc.
(2) Activities on industrial statistics to grasp the trend of the industry
(3) Activities for the society in view of conserving of the environment and securing of the safety
(4) Activities related to safety of plastics in electronic materials
(5) Public relations to deepen the understanding on plastics by the society
(6) Activities related to codes and standards
(7) International activities such as dispatching overseas of the survey team

S-45
All rights reserved. The copyright of this material is held by the Agency for Natural Resources and Energy, Ministry of Economy, Trade and Industry (METI). Reproduction of all or part of this material without express permission of the copyright holder is strictly prohibited. The Japan External Trade Organization (JETRO) was commissioned by METI to produce this material. Japan External Trade Organization (JETRO) Industry and Technology Division Industry and Technology Department Ark Mori Building 6F, 12-32 Akasaka 1-chome, Minato-ku, Tokyo, 107-6006 JAPAN TEL:03-3582-5542 FAX:03-3582-7508

![A�[�ϴM}�F�C8A-� {@�;�U��] k · Title: A�[�ϴM}�F�C8A-� {@�;�U��] k Author: G�Tí](https://static.fdocuments.net/doc/165x107/5ffd3a3d7b3290266836a374/amfc8a-u-k-title.jpg)