
EXECUTIVE SUMMARY: Electronics Recycling and E-Waste · PDF fileEXECUTIVE SUMMARY: Electronics...
12
Bob Boggio Industry Analyst Clint Wheelock President EXECUTIVE SUMMARY: Electronics Recycling and E-Waste Issues Reuse, Recycling, Storage, and Waste Management for Consumer Electronics, Computer Equipment, and Mobile Phones: Market Analysis and Forecasts NOTE: This document is a free excerpt of a larger report. If you are interested in purchasing the full report, please contact Pike Research at [email protected]. Published 4Q 2011
-
Upload
nguyendieu -
Category
Documents
-
view
221 -
download
2
Transcript of EXECUTIVE SUMMARY: Electronics Recycling and E-Waste · PDF fileEXECUTIVE SUMMARY: Electronics...
Bob BoggioIndustry Analyst
Clint WheelockPresident
EXECUTIVE SUMMARY: Electronics Recycling and E-Waste Issues Reuse, Recycling, Storage, and Waste Management for Consumer Electronics, Computer Equipment, and Mobile Phones: Market Analysis and Forecasts
NOTE: This document is a free excerpt of a larger report. If you are interested in purchasing the full report, please contact Pike Research at [email protected].
Published 4Q 2011
Electronics Recycling and E-Waste Issues
© 2011 Pike Research LLC. All Rights Reserved. This publication may be used only as expressly permitted by license from Pike Research LLC and may not otherwise be accessed or used, without the express written permission of Pike Research LLC.
1
Section 1 EXECUTIVE SUMMARY
1.1 Introduction
This report provides an update to Pike Research’s Electronics Recycling and E-Waste Issues report, published in 2Q 2009. It includes an update, since 2009, on the current state of electronic device disposition at end-of-life (EOL) in addition to the following:
Estimated unit sales of consumer electronic devices from 2010 through 2025, which have been adjusted for population demographics and affordability
Estimated volumes and weights of e-scrap generated at EOL from these unit sales forecasts and their disposition as e-waste, recycle/reuse and in storage, which have also been adjusted for product lifecycles
Interview responses from U.S. states with and without extended producer responsibility (EPR) legislation as well as top tier OEMs, service providers and e-waste processors
In summary, Pike Research confirmed that the EOL disposition of unwanted electronic equipment is still, in 2011, easily and inexpensively sent to landfill burial rather than being directed toward reuse or recycling. Trans-boundary shipments of e-waste from developed countries to developing countries continue, and the informal recovery of components and materials in developing countries remains a concern for human health and the environment. However, two certification processes, e-Stewards and R2, are now available for processors of electronic scrap that establish sophisticated standards of performance for e-waste processors and OEMs are beginning to require their contractors to be certified. In the United States, additional states have implemented EPR laws. Moreover, the U.S. Congress has pending legislation that, if passed, would provide support for the Basel Convention Treaty and its Ban Amendment. In addition, the EU is considering modifications to their WEEE Directive that would close perceived loopholes and increase diversion rates.
1.2 Forecasts and Trends
The key players in the consumer electronics product sectors are all large multinational companies that have in one form or another adopted the corporate social responsibility (CSR) and sustainability concepts. Implementation and deployment vary from company to company and some are more robust in their efforts than others.
Unit sales of consumer electronic devices from 2010 to 2025 is projected by multiple industry analysts to grow throughout the period, with new devices like tablets and evolutionary products like smartphones leading the migration to a larger wireless/mobile environment. In addition, the rise of flat panel monitors and TVs will lead to the extinction of cathode ray tube (CRT) technology before the end of 2025.
The worldwide sales forecasts appear to be overly optimistic to Pike Research, given the current global economy and the ability (or lack thereof) of consumers in developing countries to afford new electronic devices. Thus, we have used population demographics and economic/affordability indicators to reduce these consensus projections by 26%. Our less aggressive unit sales figures were then used to estimate EOL quantities of e-scrap available for final disposition.

Electronics Recycling and E-Waste Issues
© 2011 Pike Research LLC. All Rights Reserved. This publication may be used only as expressly permitted by license from Pike Research LLC and may not otherwise be accessed or used, without the express written permission of Pike Research LLC.
2
Table 1.1 below is a high level summary, in five year increments, of the estimated volume and weight of e-scrap generated by consumer electronic devices at EOL.
Our interview results show that the multinational OEMs operating in the United States are adapting to the EPR requirements specified by law. However, they are less than thrilled by the 25 variations in state requirements in the United States. The added complexity and variations in the timing of reports increase costs and require more resources to ensure compliance than if there were a single, uniform, and nationwide law. OEMs have accepted the concept of responsibility for EOL management of electronics, but some would prefer an individual producer responsibility (IPR) system. Additionally, there is increasing pressure to modify new product designs to eliminate toxic materials and a growing concern about assurance of supply for critical materials like rare earth metals.
Regulators in U.S. states with EPR or advanced recycling fee (ARF) legislation are, in general, pleased with the effects their laws have had in diverting e-waste from landfill and volumes are increasing. In the U.S. states without e-waste legislation, either there has not been a perceived need or higher priority issues have prevented implementation. In the European Union (EU) and other countries around the world, legislation, in most cases modeled after the WEEE Directive, is showing similar results. The WEEE system in the EU is in the process of being modified to close loopholes and increase collection efficiencies.
Once e-scrap has been diverted from landfill or incineration it needs to be reused, resold or recycled. Smaller e-waste processor companies are concerned that local markets will disappear as industry wide consolidation reduces the number of companies to a few large regional operators. As always, the volatility in the secondary materials markets can determine if a company lives or dies, which, in turn, is determined by demand from the global economy.
Meanwhile, environmental advocates and non-governmental organizations (NGOs) continue to push for more stringent and transparent requirements, faster deployment of less toxic materials, and more serious efforts at collection and recycling.
Table 1.1 Summary of Volume and Weight of Consumer Electronics E-Scrap, E-Waste, Recycled/Reused, and In Storage from Adjusted Unit Sales by Year, World Markets: 2010-2025
Units 2010 2015 2020 2025 Total E-Scrap Volume (Million Cu. Ft.) 676 940 1,168 1,465 7,458
Weight (Million Tons) 6.0 9.1 11.4 14.9 70.2 E-Waste Volume (Million Cu. Ft.) 453 470 537 614 3,988
Weight (Million Tons) 4.0 4.5 5.2 6.1 38.0 Recycled/Reused
Volume (Million Cu. Ft.) 122 338 514 789 2,546
Weight (Million Tons) 1.1 3.2 5.0 7.9 24.5 In Storage
Volume (Million Cu. Ft.) 101 132 117 58 921
Weight (Million Tons) 0.9 1.3 1.2 0.6 8.7 (Source: Pike Research)
Electronics Recycling and E-Waste Issues
© 2011 Pike Research LLC. All Rights Reserved. This publication may be used only as expressly permitted by license from Pike Research LLC and may not otherwise be accessed or used, without the express written permission of Pike Research LLC.
3
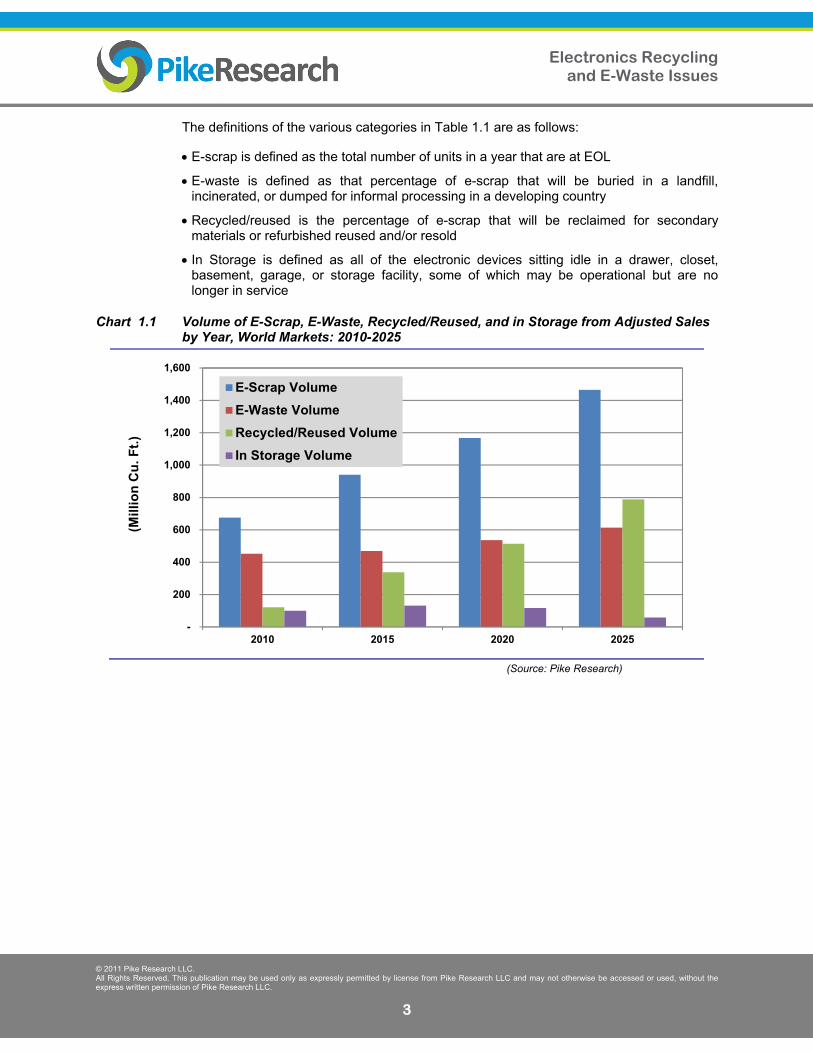
The definitions of the various categories in Table 1.1 are as follows:
E-scrap is defined as the total number of units in a year that are at EOL
E-waste is defined as that percentage of e-scrap that will be buried in a landfill, incinerated, or dumped for informal processing in a developing country
Recycled/reused is the percentage of e-scrap that will be reclaimed for secondary materials or refurbished reused and/or resold
In Storage is defined as all of the electronic devices sitting idle in a drawer, closet, basement, garage, or storage facility, some of which may be operational but are no longer in service
Chart 1.1 Volume of E-Scrap, E-Waste, Recycled/Reused, and in Storage from Adjusted Sales by Year, World Markets: 2010-2025
-
200
400
600
800
1,000
1,200
1,400
1,600
2010 2015 2020 2025
(Mill
ion
Cu
. Ft.
)
E-Scrap Volume
E-Waste Volume
Recycled/Reused Volume
In Storage Volume
(Source: Pike Research)
Electronics Recycling and E-Waste Issues
© 2011 Pike Research LLC. All Rights Reserved. This publication may be used only as expressly permitted by license from Pike Research LLC and may not otherwise be accessed or used, without the express written permission of Pike Research LLC.
4
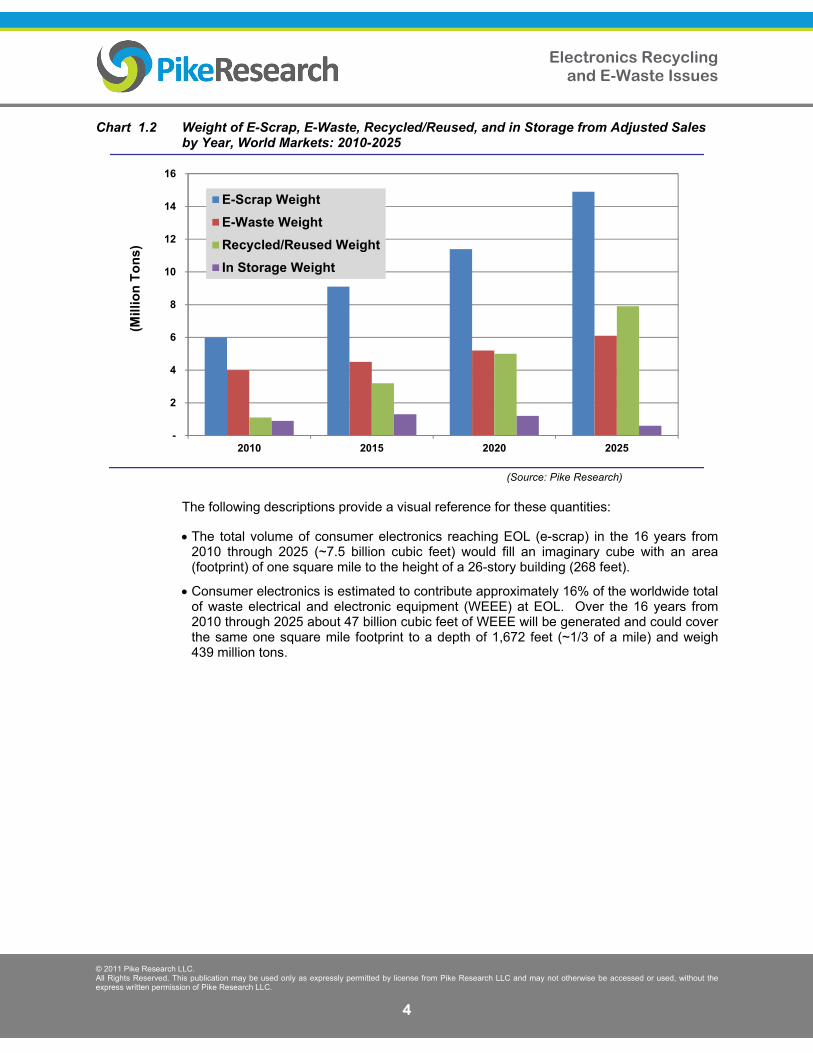
Chart 1.2 Weight of E-Scrap, E-Waste, Recycled/Reused, and in Storage from Adjusted Sales by Year, World Markets: 2010-2025
-
2
4
6
8
10
12
14
16
2010 2015 2020 2025
(Mill
ion
To
ns)
E-Scrap Weight
E-Waste Weight
Recycled/Reused Weight
In Storage Weight
(Source: Pike Research)
The following descriptions provide a visual reference for these quantities:
The total volume of consumer electronics reaching EOL (e-scrap) in the 16 years from 2010 through 2025 (~7.5 billion cubic feet) would fill an imaginary cube with an area (footprint) of one square mile to the height of a 26-story building (268 feet).
Consumer electronics is estimated to contribute approximately 16% of the worldwide total of waste electrical and electronic equipment (WEEE) at EOL. Over the 16 years from 2010 through 2025 about 47 billion cubic feet of WEEE will be generated and could cover the same one square mile footprint to a depth of 1,672 feet (~1/3 of a mile) and weigh 439 million tons.
Electronics Recycling and E-Waste Issues
© 2011 Pike Research LLC. All Rights Reserved. This publication may be used only as expressly permitted by license from Pike Research LLC and may not otherwise be accessed or used, without the express written permission of Pike Research LLC.
89
Section 10 TABLE OF CONTENTS
Section 1 ...................................................................................................................................................... 1 Executive Summary .................................................................................................................................... 1
1.1 Introduction .................................................................................................................................... 1 1.2 Forecasts and Trends ................................................................................................................... 1
Section 2 ...................................................................................................................................................... 5 Market Issues .............................................................................................................................................. 5
2.1 Introduction .................................................................................................................................... 5 2.1.1 Definitions ................................................................................................................................ 5 2.1.2 Link to Sustainability ................................................................................................................ 5
2.2 Electronic Equipment Sales – Market Conditions and Constraints ............................................... 6 2.2.1 Personal Computers ................................................................................................................ 6 2.2.2 Tablets ..................................................................................................................................... 7 2.2.3 E-Readers ............................................................................................................................... 8 2.2.4 Mobile Phones ......................................................................................................................... 8
2.3 The Consumer’s Perspective ........................................................................................................ 8 2.3.1 New Product Releases ............................................................................................................ 9 2.3.2 Consumer Issues .................................................................................................................. 10
2.4 Product Design Perspective ........................................................................................................ 11 2.4.1 Reduction in Toxic Materials in Electronic Products ............................................................. 11 2.4.2 Designing Electronics for the Environment Using EPEAT .................................................... 11 2.4.3 Rare Earth Metals ................................................................................................................. 12
2.5 The Contract Manufacturer’s Perspective ................................................................................... 13 2.5.1 Consumption and Technology Drive E-Waste Generation ................................................... 13 2.5.2 Sustainability, Corporate Social Responsibility, and Green .................................................. 14
2.6 Reuse and Recycler’s Perspective ............................................................................................. 16 2.6.1 Recycling ............................................................................................................................... 16 2.6.2 Refurbish / Resell and Recycle Issues .................................................................................. 17
2.7 Regulator’s Perspective .............................................................................................................. 17 2.7.1 Regulator’s Issues ................................................................................................................. 17
Section 3 .................................................................................................................................................... 19 Policy and Regulation ............................................................................................................................... 19
3.1 Introduction .................................................................................................................................. 19 3.2 E-Waste Legislation in the United States .................................................................................... 19
3.2.1 The U.S. E-Scrap Policy ........................................................................................................ 20 3.2.2 U.S. States with E-Waste Management Laws ...................................................................... 20 3.2.3 U.S. States without E-Waste Management Laws ................................................................. 24
3.3 North America ............................................................................................................................. 26 3.3.1 Trans-boundary Cooperation ................................................................................................ 26 3.3.2 Mexico ................................................................................................................................... 27 3.3.3 Canada .................................................................................................................................. 27
3.4 E-Waste Legislation in the European Union ............................................................................... 29 3.4.1 WEEE Revisions ................................................................................................................... 29 3.4.2 RoHS Revisions/RoHS2 ........................................................................................................ 29
3.5 International Updates and Issues................................................................................................ 29 3.5.1 China ..................................................................................................................................... 29 3.5.2 India ....................................................................................................................................... 30 3.5.3 Japan ..................................................................................................................................... 30

Electronics Recycling and E-Waste Issues
© 2011 Pike Research LLC. All Rights Reserved. This publication may be used only as expressly permitted by license from Pike Research LLC and may not otherwise be accessed or used, without the express written permission of Pike Research LLC.
90
3.5.4 Malaysia ................................................................................................................................ 30 3.5.5 Australia and New Zealand ................................................................................................... 31 3.5.6 Africa ..................................................................................................................................... 31 3.5.7 Latin America ......................................................................................................................... 31
3.6 The Caribbean............................................................................................................................. 32 3.7 E-Waste Management Programs and Issues ............................................................................. 32
3.7.1 The Basel Treaty and Its Amendment ................................................................................... 32 3.7.2 Impact of Trans-boundary Shipments of E-Waste ................................................................ 33 3.7.3 U.S. Certification Processes (R2 and e-Stewards) ............................................................... 33 3.7.4 U.S. Electronics Take Back and Donation Programs ............................................................ 34 3.7.5 REACH .................................................................................................................................. 35 3.7.6 Solving the E-Waste Problem (StEP) .................................................................................... 35
Section 4 .................................................................................................................................................... 36 Key Industry Players ................................................................................................................................. 36
4.1 Key Industry Players by Product Category ................................................................................. 36 4.1.1 Introduction ............................................................................................................................ 36 4.1.2 Desktop PCs .......................................................................................................................... 36 4.1.3 Notebooks/Laptops (Mobile PCs) .......................................................................................... 38 4.1.4 Tablets ................................................................................................................................... 39 4.1.5 E-Readers ............................................................................................................................. 40 4.1.6 Mobile Phones ....................................................................................................................... 41 4.1.7 Servers .................................................................................................................................. 42 4.1.8 Monitors ................................................................................................................................. 44 4.1.9 Printers .................................................................................................................................. 44 4.1.10 Televisions ........................................................................................................................ 45 4.1.11 Telecom Service Providers ............................................................................................... 47 4.1.12 Key Industry Players Not Otherwise Categorized ............................................................. 48
4.2 Interview Responses ................................................................................................................... 48 Section 5 .................................................................................................................................................... 59 Demographics and Disposable Income .................................................................................................. 59
5.1 Introduction .................................................................................................................................. 59 5.2 Global Population, 2010-2025 ..................................................................................................... 60
5.2.1 Wages/National Income ........................................................................................................ 61 5.2.2 Affordability ............................................................................................................................ 62
Section 6 .................................................................................................................................................... 63 Market Forecasts: Consumer Electronics .............................................................................................. 63
6.1 Introduction .................................................................................................................................. 63 6.2 Electronic Equipment Unit Sales by Type ................................................................................... 64 6.3 Pike Research’s Adjusted Unit Sales .......................................................................................... 65
6.3.1 Introduction – Contrary View ................................................................................................. 65 Section 7 .................................................................................................................................................... 66 Market Forecasts: E-Waste ...................................................................................................................... 66
7.1 Methodology ................................................................................................................................ 66 7.1.1 Product Categories and Definitions ....................................................................................... 67
7.2 E-Waste Estimates of Weight and Volume ................................................................................. 68 7.3 Recycle / Reuse / Reduce ........................................................................................................... 68
7.3.1 Recycle .................................................................................................................................. 68 7.3.2 Reuse – Used Equipment Potential ...................................................................................... 68 7.3.3 Reduce: The Leasing Model and Sustainability vs. Relentless Consumption ...................... 69
7.4 Key Industry Players ................................................................................................................... 70 7.4.1 E-Waste Processors .............................................................................................................. 70
7.5 E-Waste Processor Interview Responses ................................................................................... 71 7.5.1 Environmental Advocates Interview Responses .................................................................. 76
Electronics Recycling and E-Waste Issues
© 2011 Pike Research LLC. All Rights Reserved. This publication may be used only as expressly permitted by license from Pike Research LLC and may not otherwise be accessed or used, without the express written permission of Pike Research LLC.
91
Section 8 .................................................................................................................................................... 80 Company Directory ................................................................................................................................... 80 Section 9 .................................................................................................................................................... 85 Acronym and Abbreviation List ............................................................................................................... 85 Section 10 .................................................................................................................................................. 89 Table of Contents ...................................................................................................................................... 89 Section 11 .................................................................................................................................................. 92 Table of Charts and Figures..................................................................................................................... 92 Section 12 .................................................................................................................................................. 93 Scope of Study .......................................................................................................................................... 93 Sources and Methodology ....................................................................................................................... 93 Notes .......................................................................................................................................................... 94
Electronics Recycling and E-Waste Issues
© 2011 Pike Research LLC. All Rights Reserved. This publication may be used only as expressly permitted by license from Pike Research LLC and may not otherwise be accessed or used, without the express written permission of Pike Research LLC.
92
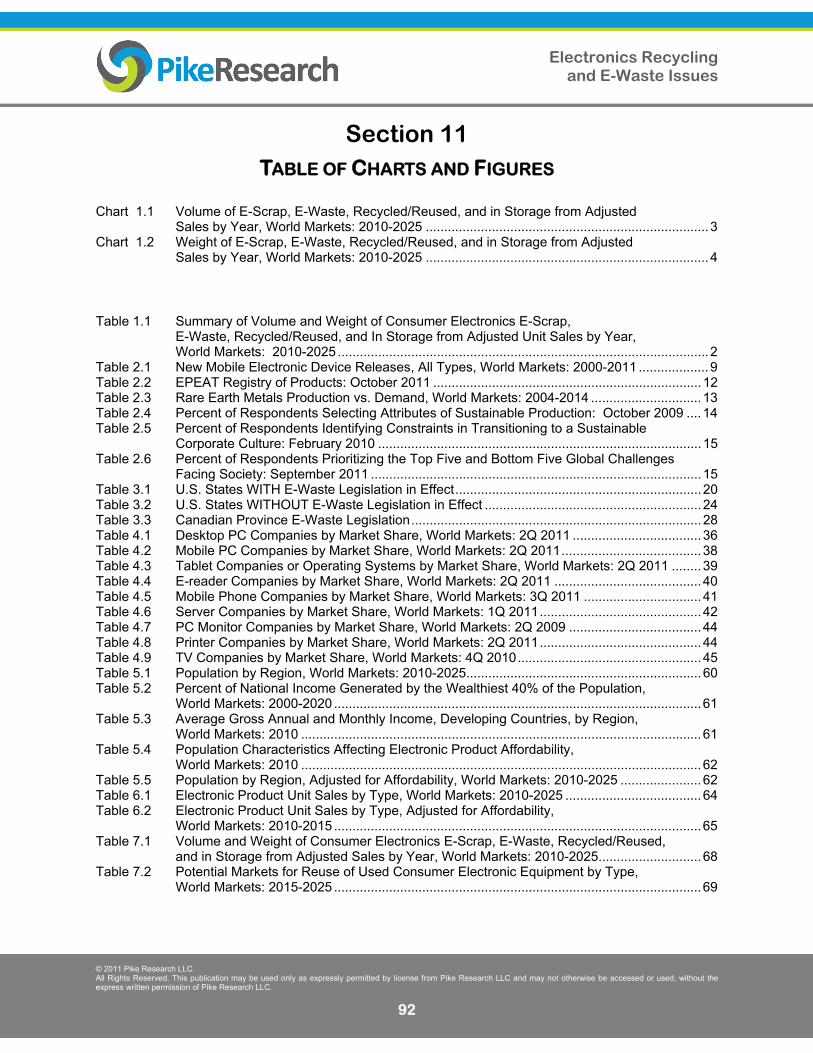
Section 11 TABLE OF CHARTS AND FIGURES
Chart 1.1 Volume of E-Scrap, E-Waste, Recycled/Reused, and in Storage from Adjusted Sales by Year, World Markets: 2010-2025 ............................................................................. 3 Chart 1.2 Weight of E-Scrap, E-Waste, Recycled/Reused, and in Storage from Adjusted Sales by Year, World Markets: 2010-2025 ............................................................................. 4
Table 1.1 Summary of Volume and Weight of Consumer Electronics E-Scrap, E-Waste, Recycled/Reused, and In Storage from Adjusted Unit Sales by Year, World Markets: 2010-2025 ..................................................................................................... 2 Table 2.1 New Mobile Electronic Device Releases, All Types, World Markets: 2000-2011 ................... 9 Table 2.2 EPEAT Registry of Products: October 2011 ......................................................................... 12 Table 2.3 Rare Earth Metals Production vs. Demand, World Markets: 2004-2014 .............................. 13 Table 2.4 Percent of Respondents Selecting Attributes of Sustainable Production: October 2009 .... 14 Table 2.5 Percent of Respondents Identifying Constraints in Transitioning to a Sustainable Corporate Culture: February 2010 ........................................................................................ 15 Table 2.6 Percent of Respondents Prioritizing the Top Five and Bottom Five Global Challenges Facing Society: September 2011 .......................................................................................... 15 Table 3.1 U.S. States WITH E-Waste Legislation in Effect ................................................................... 20 Table 3.2 U.S. States WITHOUT E-Waste Legislation in Effect ........................................................... 24 Table 3.3 Canadian Province E-Waste Legislation ............................................................................... 28 Table 4.1 Desktop PC Companies by Market Share, World Markets: 2Q 2011 ................................... 36 Table 4.2 Mobile PC Companies by Market Share, World Markets: 2Q 2011 ...................................... 38 Table 4.3 Tablet Companies or Operating Systems by Market Share, World Markets: 2Q 2011 ........ 39 Table 4.4 E-reader Companies by Market Share, World Markets: 2Q 2011 ........................................ 40 Table 4.5 Mobile Phone Companies by Market Share, World Markets: 3Q 2011 ................................ 41 Table 4.6 Server Companies by Market Share, World Markets: 1Q 2011 ............................................ 42 Table 4.7 PC Monitor Companies by Market Share, World Markets: 2Q 2009 .................................... 44 Table 4.8 Printer Companies by Market Share, World Markets: 2Q 2011 ............................................ 44 Table 4.9 TV Companies by Market Share, World Markets: 4Q 2010 .................................................. 45 Table 5.1 Population by Region, World Markets: 2010-2025................................................................ 60 Table 5.2 Percent of National Income Generated by the Wealthiest 40% of the Population, World Markets: 2000-2020 .................................................................................................... 61 Table 5.3 Average Gross Annual and Monthly Income, Developing Countries, by Region, World Markets: 2010 ............................................................................................................. 61 Table 5.4 Population Characteristics Affecting Electronic Product Affordability, World Markets: 2010 ............................................................................................................. 62 Table 5.5 Population by Region, Adjusted for Affordability, World Markets: 2010-2025 ...................... 62 Table 6.1 Electronic Product Unit Sales by Type, World Markets: 2010-2025 ..................................... 64 Table 6.2 Electronic Product Unit Sales by Type, Adjusted for Affordability, World Markets: 2010-2015 .................................................................................................... 65 Table 7.1 Volume and Weight of Consumer Electronics E-Scrap, E-Waste, Recycled/Reused, and in Storage from Adjusted Sales by Year, World Markets: 2010-2025............................ 68 Table 7.2 Potential Markets for Reuse of Used Consumer Electronic Equipment by Type, World Markets: 2015-2025 .................................................................................................... 69

Electronics Recycling and E-Waste Issues
© 2011 Pike Research LLC. All Rights Reserved. This publication may be used only as expressly permitted by license from Pike Research LLC and may not otherwise be accessed or used, without the express written permission of Pike Research LLC.
93
Section 12 SCOPE OF STUDY
This report delivers estimates for the global unit sales of common consumer electronic devices by type and the resulting (time-delayed) e-scrap generated for processing as e-waste, recycle, reuse or storage. Updates to the data and analysis provided in Pike Research’s 2Q 2009 Electronics Recycling and E-Waste Issues report are supplied and carried forward to 2025. Interviews conducted with key industry players enabled Pike Research to glean real-time insights that complement our historical data analysis. We used these data to evaluate current market conditions and generate future projections for this report. Also provided is a discussion of the significant issues facing equipment manufacturers, consumers, recyclers and regulators. Pike Research examines the effects (current and potential) of these issues on the reuse/resale markets and the recyclers and processors that convert unwanted electronic devices into valuable secondary materials.
SOURCES AND METHODOLOGY
Pike Research’s industry analysts utilize a variety of research sources in preparing Research Reports. The key component of Pike Research’s analysis is primary research gained from phone and in-person interviews with industry leaders including executives, engineers, and marketing professionals. Analysts are diligent in ensuring that they speak with representatives from every part of the value chain, including but not limited to technology companies, utilities and other service providers, industry associations, government agencies, and the investment community.
Additional analysis includes secondary research conducted by Pike Research’s analysts and the firm’s staff of research assistants. Where applicable, all secondary research sources are appropriately cited within this report.
These primary and secondary research sources, combined with the analyst’s industry expertise, are synthesized into the qualitative and quantitative analysis presented in Pike Research’s reports. Great care is taken in making sure that all analysis is well-supported by facts, but where the facts are unknown and assumptions must be made, analysts document their assumptions and are prepared to explain their methodology, both within the body of a report and in direct conversations with clients.
Pike Research is an independent market research firm whose goal is to present an objective, unbiased view of market opportunities within its coverage areas. The firm is not beholden to any special interests and is thus able to offer clear, actionable advice to help clients succeed in the industry, unfettered by technology hype, political agendas, or emotional factors that are inherent in cleantech markets.

Electronics Recycling and E-Waste Issues
© 2011 Pike Research LLC. All Rights Reserved. This publication may be used only as expressly permitted by license from Pike Research LLC and may not otherwise be accessed or used, without the express written permission of Pike Research LLC.
94
NOTES
CAGR refers to compound average annual growth rate, using the formula:
CAGR = (End Year Value ÷ Start Year Value)(1/steps) – 1.
CAGRs presented in the tables are for the entire timeframe in the title. Where data for fewer years are given, the CAGR is for the range presented. Where relevant, CAGRs for shorter timeframes may be given as well.
Figures are based on the best estimates available at the time of calculation. Annual revenues, shipments, and sales are based on end-of-year figures unless otherwise noted. All values are expressed in year 2011 U.S. dollars unless otherwise noted. Percentages may not add up to 100 due to rounding.
Electronics Recycling and E-Waste Issues
© 2011 Pike Research LLC. All Rights Reserved. This publication may be used only as expressly permitted by license from Pike Research LLC and may not otherwise be accessed or used, without the express written permission of Pike Research LLC.
95
Published 4Q 2011
© 2011 Pike Research LLC 1320 Pearl Street, Suite 300
Boulder, CO 80302 USA Tel: +1 303.997.7609
http://www.pikeresearch.com
This publication is provided by Pike Research LLC (“Pike”). This publication may be used only as expressly permitted by license from Pike and may not otherwise be reproduced, recorded, photocopied, distributed, displayed, modified, extracted, accessed or used without the express written permission of Pike. Notwithstanding the foregoing, Pike makes no claim to any Government data and other data obtained from public sources found in this publication (whether or not the owners of such data are noted in this publication). If you do not have a license from Pike covering this publication, please refrain from accessing or using this publication. Please contact Pike to obtain a license to this publication.