Executive Summary - American Red Cross › website › DROMaps › Images › Current...Executive...
34
Executive Summary DR897_Affected_Counties Prepared By Business Analyst Desktop Adams DR897_Affected_Counties Population 1990 Population 258,123 2000 Population 347,980 2010 Population 452,419 2015 Population 499,646 1990-2000 Annual Rate 3.03% 2000-2010 Annual Rate 2.59% 2010-2015 Annual Rate 2.01% 2010 Male Population 50.4% 2010 Female Population 49.6% 2010 Median Age 33.4 In the identified market area, the current year population is 452,419. In 2000, the Census count in the market area was 347,980. The rate of change since 2000 was 2.59 percent annually. The five-year projection for the population in the market area is 499,646, representing a change of 2.01 percent annually from 2010 to 2015. Currently, the population is 50.4 percent male and 49.6 percent female. Population by Employment Currently, 89.1 percent of the civilian labor force in the indentified market area is employed and 10.9 percent are unemployed. In comparison, 89.2 percent of the U.S. civilian labor force is employed, and 10.8 percent are unemployed. In five years the rate of employment in the market area will be 91.3 percent of the civilian labor force, and unemployment will be 8.7 percent. The percentage of the U.S. civilian labor force that will be employed in five years is 91.2 percent, and 8.8 percent will be unemployed. In 2000, 70.2 percent of the population aged 16 years or older in the market area participated in the labor force, and 0.1 percent were in the Armed Forces. In the current year, the occupational distribution of the employed population is: 55.9 percent in white collar jobs (compared to 61.6 percent of the U.S. employment) 15.9 percent in service jobs (compared to 17.3 percent of U.S. employment) 28.2 percent in blue collar jobs (compared to 21.1 percent of U.S. employment) In 2000, 75.7 percent of the market area population drove alone to work, and 3.1 percent worked at home. The average travel time to work in 2000 was 27.5 minutes in the market area, compared to the U.S average of 25.5 minutes. Population by Education In the current year, the educational attainment of the population aged 25 years or older in the market area was distributed as follows: 18.6 percent had not earned a high school diploma (14.8 percent in the U.S) 30.9 percent were high school graduates only (29.6 percent in the U.S.) 7.7 percent had completed an Associate degree (7.7 percent in the U.S.) 14.5 percent had a Bachelor's degree (17.7 percent in the U.S.) 5.7 percent had earned a Master's/Professional/Doctorate Degree (10.4 percent in the U.S.) Per Capita Income 1990 Per Capita Income $12,594 2000 Per Capita Income $19,712 2010 Per Capita Income $24,834 2015 Per Capita Income $28,465 1990-2000 Annual Rate 4.58% 2000-2010 Annual Rate 2.28% 2010-2015 Annual Rate 2.77% Households 1990 Households 94,112 2000 Households 122,807 2010 Total Households 157,850 2015 Total Households 173,873 1990-2000 Annual Rate 2.70% 2000-2010 Annual Rate 2.48% 2010-2015 Annual Rate 1.95% 2010 Average Household Size 2.84 The household count in this market area has changed from 122,807 in 2000 to 157,850 in the current year, a change of 2.48 percent annually. The five-year projection of households is 173,873, a change of 1.95 percent annually from the current year total. Average household size is currently 2.84, compared to 2.81 in the year 2000. The number of families in the current year is 110,890 in the market area. September 18, 2013 Made with Esri Business Analyst ©2010 Esri www.esri.com/ba 800-447-9778 Try it Now! Page 1 of 34 Data Note: Income is expressed in current dollars Source: U.S. Bureau and Census, 2000 Census of Population and Housing, Esri forecast for 2010 and 2015. Esri converted 1990 Census data into 2000 geography.
Transcript of Executive Summary - American Red Cross › website › DROMaps › Images › Current...Executive...

Executive SummaryDR897_Affected_Counties Prepared By Business Analyst DesktopAdams
DR897_Affected_CountiesPopulation
1990 Population 258,1232000 Population 347,9802010 Population 452,4192015 Population 499,6461990-2000 Annual Rate 3.03%2000-2010 Annual Rate 2.59%2010-2015 Annual Rate 2.01%2010 Male Population 50.4%2010 Female Population 49.6%2010 Median Age 33.4
In the identified market area, the current year population is 452,419. In 2000, the Census count in the market area was 347,980. The rateof change since 2000 was 2.59 percent annually. The five-year projection for the population in the market area is 499,646, representing achange of 2.01 percent annually from 2010 to 2015. Currently, the population is 50.4 percent male and 49.6 percent female.
Population by EmploymentCurrently, 89.1 percent of the civilian labor force in the indentified market area is employed and 10.9 percent are unemployed. Incomparison, 89.2 percent of the U.S. civilian labor force is employed, and 10.8 percent are unemployed. In five years the rate ofemployment in the market area will be 91.3 percent of the civilian labor force, and unemployment will be 8.7 percent. The percentage of theU.S. civilian labor force that will be employed in five years is 91.2 percent, and 8.8 percent will be unemployed. In 2000, 70.2 percent of thepopulation aged 16 years or older in the market area participated in the labor force, and 0.1 percent were in the Armed Forces.
In the current year, the occupational distribution of the employed population is:55.9 percent in white collar jobs (compared to 61.6 percent of the U.S. employment)15.9 percent in service jobs (compared to 17.3 percent of U.S. employment)28.2 percent in blue collar jobs (compared to 21.1 percent of U.S. employment)
In 2000, 75.7 percent of the market area population drove alone to work, and 3.1 percent worked at home. The average travel time towork in 2000 was 27.5 minutes in the market area, compared to the U.S average of 25.5 minutes. Population by Education
In the current year, the educational attainment of the population aged 25 years or older in the market area was distributed as follows:18.6 percent had not earned a high school diploma (14.8 percent in the U.S)30.9 percent were high school graduates only (29.6 percent in the U.S.)7.7 percent had completed an Associate degree (7.7 percent in the U.S.)14.5 percent had a Bachelor's degree (17.7 percent in the U.S.)5.7 percent had earned a Master's/Professional/Doctorate Degree (10.4 percent in the U.S.)
Per Capita Income1990 Per Capita Income $12,594
2000 Per Capita Income $19,7122010 Per Capita Income $24,8342015 Per Capita Income $28,4651990-2000 Annual Rate 4.58%2000-2010 Annual Rate 2.28%2010-2015 Annual Rate 2.77%
Households
1990 Households 94,1122000 Households 122,8072010 Total Households 157,8502015 Total Households 173,8731990-2000 Annual Rate 2.70%2000-2010 Annual Rate 2.48%2010-2015 Annual Rate 1.95%2010 Average Household Size 2.84
The household count in this market area has changed from 122,807 in 2000 to 157,850 in the current year, a change of 2.48 percentannually. The five-year projection of households is 173,873, a change of 1.95 percent annually from the current year total. Averagehousehold size is currently 2.84, compared to 2.81 in the year 2000. The number of families in the current year is 110,890 in the marketarea.
September 18, 2013
Made with Esri Business Analyst©2010 Esri www.esri.com/ba 800-447-9778 Try it Now! Page 1 of 34
Data Note: Income is expressed in current dollarsSource: U.S. Bureau and Census, 2000 Census of Population and Housing, Esri forecast for 2010 and 2015. Esri converted 1990 Census data into 2000 geography.

Executive SummaryDR897_Affected_Counties Prepared By Business Analyst DesktopAdams
DR897_Affected_CountiesHouseholds by Income
Current median household income is $62,404 in the market area, compared to $54,442 for all U.S. households. Median household income isprojected to be $72,417 in five years. In 2000, median household income was $46,614.
Current average household income is $70,753 in this market area, compared to $70,173 for all U.S households. Average household incomeis projected to be $81,359 in five years. In 2000, average household income was $55,105, compared to $34,112 in 1990.
Current per capita income is $24,834 in the market area, compared to the U.S. per capita income of $26,739. The per capita income isprojected to be $28,465 in five years. In 2000, the per capita income was $19,712, compared to $12,594 in 1990. Median Household Income
2000 Median Household Income $46,6142010 Median Household Income $62,4042015 Median Household Income $72,4172000-2010 Annual Rate 2.89%2010-2015 Annual Rate 3.02%
Average Household Income
1990 Average Household Income $34,1122000 Average Household Income $55,1052010 Average Household Income $70,7532015 Average Household Income $81,3591990-2000 Annual Rate 4.91%2000-2010 Annual Rate 2.47%2010-2015 Annual Rate 2.83%
2010 Housing
1990 Total Housing Units 104,6082000 Total Housing Units 127,0902010 Total Housing Units 172,6722015 Total Housing Units 192,9041990 Owner Occupied Housing Units 61,3291990 Renter Occupied Housing Units 32,7831990 Vacant Housing Units 10,4962000 Owner Occupied Housing Units 85,6452000 Renter Occupied Housing Units 37,1622000 Vacant Housing Units 4,2832010 Owner Occupied Housing Units 108,2122010 Renter Occupied Housing Units 49,6372010 Vacant Housing Units 14,8222015 Owner Occupied Housing Units 119,5952015 Renter Occupied Housing Units 54,2782015 Vacant Housing Units 19,031
Currently, 62.7 percent of the 172,672 housing units in the market area are owner occupied; 28.7 percent, renter occupied; and 8.6 arevacant. In 2000, there were 127,090 housing units - 67.4 percent owner occupied, 29.2. percent renter occupied, and 3.4 percent vacant.The rate of change in housing units since 2000 is 3.04 percent. Median home value in the market area is $202,184, compared to a medianhome value of $157,913 for the U.S. In five years, median value is projected to change by 3.23 percent annually to $237,065. From 2000to the current year, median home value change by 3.63 percent annually.
Population1990 Population 392,6922000 Population 489,2802010 Population 574,0162015 Population 611,7621990-2000 Annual Rate 2.22%2000-2010 Annual Rate 1.57%2010-2015 Annual Rate 1.28%
September 18, 2013
Made with Esri Business Analyst©2010 Esri www.esri.com/ba 800-447-9778 Try it Now! Page 2 of 34
Data Note: Income is expressed in current dollarsSource: U.S. Bureau and Census, 2000 Census of Population and Housing, Esri forecast for 2010 and 2015. Esri converted 1990 Census data into 2000 geography.

Executive SummaryDR897_Affected_Counties Prepared By Business Analyst DesktopArapahoe
DR897_Affected_Counties2010 Male Population 49.2%2010 Female Population 50.8%2010 Median Age 36.7
In the identified market area, the current year population is 574,016. In 2000, the Census count in the market area was 489,280. The rateof change since 2000 was 1.57 percent annually. The five-year projection for the population in the market area is 611,762, representing achange of 1.28 percent annually from 2010 to 2015. Currently, the population is 49.2 percent male and 50.8 percent female.
Population by EmploymentCurrently, 91.3 percent of the civilian labor force in the indentified market area is employed and 8.7 percent are unemployed. Incomparison, 89.2 percent of the U.S. civilian labor force is employed, and 10.8 percent are unemployed. In five years the rate ofemployment in the market area will be 93.1 percent of the civilian labor force, and unemployment will be 6.9 percent. The percentage of theU.S. civilian labor force that will be employed in five years is 91.2 percent, and 8.8 percent will be unemployed. In 2000, 73.3 percent of thepopulation aged 16 years or older in the market area participated in the labor force, and 0.5 percent were in the Armed Forces.
In the current year, the occupational distribution of the employed population is:71.0 percent in white collar jobs (compared to 61.6 percent of the U.S. employment)13.8 percent in service jobs (compared to 17.3 percent of U.S. employment)15.3 percent in blue collar jobs (compared to 21.1 percent of U.S. employment)
In 2000, 78.9 percent of the market area population drove alone to work, and 4.6 percent worked at home. The average travel time towork in 2000 was 26.1 minutes in the market area, compared to the U.S average of 25.5 minutes. Population by Education
In the current year, the educational attainment of the population aged 25 years or older in the market area was distributed as follows:9.7 percent had not earned a high school diploma (14.8 percent in the U.S)22.1 percent were high school graduates only (29.6 percent in the U.S.)7.4 percent had completed an Associate degree (7.7 percent in the U.S.)25.1 percent had a Bachelor's degree (17.7 percent in the U.S.)13.3 percent had earned a Master's/Professional/Doctorate Degree (10.4 percent in the U.S.)
Per Capita Income1990 Per Capita Income $18,812
2000 Per Capita Income $28,1702010 Per Capita Income $34,4522015 Per Capita Income $39,5641990-2000 Annual Rate 4.12%2000-2010 Annual Rate 1.98%2010-2015 Annual Rate 2.81%
Households
1990 Households 155,3872000 Households 191,6362010 Total Households 223,4082015 Total Households 237,9801990-2000 Annual Rate 2.12%2000-2010 Annual Rate 1.51%2010-2015 Annual Rate 1.27%2010 Average Household Size 2.54
The household count in this market area has changed from 191,636 in 2000 to 223,408 in the current year, a change of 1.51 percentannually. The five-year projection of households is 237,980, a change of 1.27 percent annually from the current year total. Averagehousehold size is currently 2.54, compared to 2.53 in the year 2000. The number of families in the current year is 143,895 in the marketarea.
September 18, 2013
Made with Esri Business Analyst©2010 Esri www.esri.com/ba 800-447-9778 Try it Now! Page 3 of 34
Data Note: Income is expressed in current dollarsSource: U.S. Bureau and Census, 2000 Census of Population and Housing, Esri forecast for 2010 and 2015. Esri converted 1990 Census data into 2000 geography.

Executive SummaryDR897_Affected_Counties Prepared By Business Analyst DesktopArapahoe
DR897_Affected_CountiesHouseholds by Income
Current median household income is $70,548 in the market area, compared to $54,442 for all U.S. households. Median household income isprojected to be $81,380 in five years. In 2000, median household income was $53,661.
Current average household income is $88,043 in this market area, compared to $70,173 for all U.S households. Average household incomeis projected to be $101,195 in five years. In 2000, average household income was $71,474, compared to $47,055 in 1990.
Current per capita income is $34,452 in the market area, compared to the U.S. per capita income of $26,739. The per capita income isprojected to be $39,564 in five years. In 2000, the per capita income was $28,170, compared to $18,812 in 1990. Median Household Income
2000 Median Household Income $53,6612010 Median Household Income $70,5482015 Median Household Income $81,3802000-2010 Annual Rate 2.71%2010-2015 Annual Rate 2.90%
Average Household Income
1990 Average Household Income $47,0552000 Average Household Income $71,4742010 Average Household Income $88,0432015 Average Household Income $101,1951990-2000 Annual Rate 4.27%2000-2010 Annual Rate 2.05%2010-2015 Annual Rate 2.82%
2010 Housing
1990 Total Housing Units 169,4392000 Total Housing Units 197,5742010 Total Housing Units 241,2402015 Total Housing Units 259,7381990 Owner Occupied Housing Units 98,8161990 Renter Occupied Housing Units 56,5711990 Vacant Housing Units 14,0572000 Owner Occupied Housing Units 130,3862000 Renter Occupied Housing Units 61,2502000 Vacant Housing Units 5,9432010 Owner Occupied Housing Units 148,8272010 Renter Occupied Housing Units 74,5812010 Vacant Housing Units 17,8322015 Owner Occupied Housing Units 159,0002015 Renter Occupied Housing Units 78,9802015 Vacant Housing Units 21,758
Currently, 61.7 percent of the 241,240 housing units in the market area are owner occupied; 30.9 percent, renter occupied; and 7.4 arevacant. In 2000, there were 197,574 housing units - 66.0 percent owner occupied, 31.0. percent renter occupied, and 3.0 percent vacant.The rate of change in housing units since 2000 is 1.97 percent. Median home value in the market area is $230,522, compared to a medianhome value of $157,913 for the U.S. In five years, median value is projected to change by 3.20 percent annually to $269,781. From 2000to the current year, median home value change by 3.26 percent annually.
Population1990 Population 208,9022000 Population 269,7912010 Population 297,5382015 Population 312,3991990-2000 Annual Rate 2.59%2000-2010 Annual Rate 0.96%2010-2015 Annual Rate 0.98%
September 18, 2013
Made with Esri Business Analyst©2010 Esri www.esri.com/ba 800-447-9778 Try it Now! Page 4 of 34
Data Note: Income is expressed in current dollarsSource: U.S. Bureau and Census, 2000 Census of Population and Housing, Esri forecast for 2010 and 2015. Esri converted 1990 Census data into 2000 geography.

Executive SummaryDR897_Affected_Counties Prepared By Business Analyst DesktopBoulder
DR897_Affected_Counties2010 Male Population 50.4%2010 Female Population 49.6%2010 Median Age 35.2
In the identified market area, the current year population is 297,538. In 2000, the Census count in the market area was 269,791. The rateof change since 2000 was 0.96 percent annually. The five-year projection for the population in the market area is 312,399, representing achange of 0.98 percent annually from 2010 to 2015. Currently, the population is 50.4 percent male and 49.6 percent female.
Population by EmploymentCurrently, 93.2 percent of the civilian labor force in the indentified market area is employed and 6.8 percent are unemployed. Incomparison, 89.2 percent of the U.S. civilian labor force is employed, and 10.8 percent are unemployed. In five years the rate ofemployment in the market area will be 94.6 percent of the civilian labor force, and unemployment will be 5.4 percent. The percentage of theU.S. civilian labor force that will be employed in five years is 91.2 percent, and 8.8 percent will be unemployed. In 2000, 73.4 percent of thepopulation aged 16 years or older in the market area participated in the labor force, and 0.0 percent were in the Armed Forces.
In the current year, the occupational distribution of the employed population is:73.8 percent in white collar jobs (compared to 61.6 percent of the U.S. employment)14.5 percent in service jobs (compared to 17.3 percent of U.S. employment)11.7 percent in blue collar jobs (compared to 21.1 percent of U.S. employment)
In 2000, 70.1 percent of the market area population drove alone to work, and 6.5 percent worked at home. The average travel time towork in 2000 was 22.1 minutes in the market area, compared to the U.S average of 25.5 minutes. Population by Education
In the current year, the educational attainment of the population aged 25 years or older in the market area was distributed as follows:6.7 percent had not earned a high school diploma (14.8 percent in the U.S)14.3 percent were high school graduates only (29.6 percent in the U.S.)5.7 percent had completed an Associate degree (7.7 percent in the U.S.)31.6 percent had a Bachelor's degree (17.7 percent in the U.S.)24.8 percent had earned a Master's/Professional/Doctorate Degree (10.4 percent in the U.S.)
Per Capita Income1990 Per Capita Income $17,361
2000 Per Capita Income $29,0622010 Per Capita Income $36,5242015 Per Capita Income $42,4871990-2000 Annual Rate 5.29%2000-2010 Annual Rate 2.25%2010-2015 Annual Rate 3.07%
Households
1990 Households 82,3532000 Households 106,5412010 Total Households 118,2702015 Total Households 124,2851990-2000 Annual Rate 2.61%2000-2010 Annual Rate 1.02%2010-2015 Annual Rate 1.00%2010 Average Household Size 2.44
The household count in this market area has changed from 106,541 in 2000 to 118,270 in the current year, a change of 1.02 percentannually. The five-year projection of households is 124,285, a change of 1.00 percent annually from the current year total. Averagehousehold size is currently 2.44, compared to 2.45 in the year 2000. The number of families in the current year is 68,322 in the marketarea.
September 18, 2013
Made with Esri Business Analyst©2010 Esri www.esri.com/ba 800-447-9778 Try it Now! Page 5 of 34
Data Note: Income is expressed in current dollarsSource: U.S. Bureau and Census, 2000 Census of Population and Housing, Esri forecast for 2010 and 2015. Esri converted 1990 Census data into 2000 geography.

Executive SummaryDR897_Affected_Counties Prepared By Business Analyst DesktopBoulder
DR897_Affected_CountiesHouseholds by Income
Current median household income is $73,175 in the market area, compared to $54,442 for all U.S. households. Median household income isprojected to be $85,238 in five years. In 2000, median household income was $55,437.
Current average household income is $90,568 in this market area, compared to $70,173 for all U.S households. Average household incomeis projected to be $105,371 in five years. In 2000, average household income was $72,408, compared to $43,355 in 1990.
Current per capita income is $36,524 in the market area, compared to the U.S. per capita income of $26,739. The per capita income isprojected to be $42,487 in five years. In 2000, the per capita income was $29,062, compared to $17,361 in 1990. Median Household Income
2000 Median Household Income $55,4372010 Median Household Income $73,1752015 Median Household Income $85,2382000-2010 Annual Rate 2.75%2010-2015 Annual Rate 3.10%
Average Household Income
1990 Average Household Income $43,3552000 Average Household Income $72,4082010 Average Household Income $90,5682015 Average Household Income $105,3711990-2000 Annual Rate 5.26%2000-2010 Annual Rate 2.21%2010-2015 Annual Rate 3.07%
2010 Housing
1990 Total Housing Units 88,3232000 Total Housing Units 111,4412010 Total Housing Units 127,8972015 Total Housing Units 136,4661990 Owner Occupied Housing Units 49,8591990 Renter Occupied Housing Units 32,4941990 Vacant Housing Units 5,9702000 Owner Occupied Housing Units 68,6302000 Renter Occupied Housing Units 37,9112000 Vacant Housing Units 4,9002010 Owner Occupied Housing Units 74,5962010 Renter Occupied Housing Units 43,6742010 Vacant Housing Units 9,6272015 Owner Occupied Housing Units 78,5902015 Renter Occupied Housing Units 45,6952015 Vacant Housing Units 12,181
Currently, 58.3 percent of the 127,897 housing units in the market area are owner occupied; 34.1 percent, renter occupied; and 7.5 arevacant. In 2000, there were 111,441 housing units - 61.6 percent owner occupied, 34.0. percent renter occupied, and 4.4 percent vacant.The rate of change in housing units since 2000 is 1.35 percent. Median home value in the market area is $302,725, compared to a medianhome value of $157,913 for the U.S. In five years, median value is projected to change by 3.94 percent annually to $367,254. From 2000to the current year, median home value change by 2.52 percent annually.
Population1990 Population 24,7652000 Population 39,2312010 Population 57,1682015 Population 67,8591990-2000 Annual Rate 4.71%2000-2010 Annual Rate 3.74%2010-2015 Annual Rate 3.49%
September 18, 2013
Made with Esri Business Analyst©2010 Esri www.esri.com/ba 800-447-9778 Try it Now! Page 6 of 34
Data Note: Income is expressed in current dollarsSource: U.S. Bureau and Census, 2000 Census of Population and Housing, Esri forecast for 2010 and 2015. Esri converted 1990 Census data into 2000 geography.

Executive SummaryDR897_Affected_Counties Prepared By Business Analyst DesktopBroomfield
DR897_Affected_Counties2010 Male Population 49.9%2010 Female Population 50.1%2010 Median Age 35.6
In the identified market area, the current year population is 57,168. In 2000, the Census count in the market area was 39,231. The rate ofchange since 2000 was 3.74 percent annually. The five-year projection for the population in the market area is 67,859, representing achange of 3.49 percent annually from 2010 to 2015. Currently, the population is 49.9 percent male and 50.1 percent female.
Population by EmploymentCurrently, 91.8 percent of the civilian labor force in the indentified market area is employed and 8.2 percent are unemployed. Incomparison, 89.2 percent of the U.S. civilian labor force is employed, and 10.8 percent are unemployed. In five years the rate ofemployment in the market area will be 93.5 percent of the civilian labor force, and unemployment will be 6.5 percent. The percentage of theU.S. civilian labor force that will be employed in five years is 91.2 percent, and 8.8 percent will be unemployed. In 2000, 76.0 percent of thepopulation aged 16 years or older in the market area participated in the labor force, and 0.1 percent were in the Armed Forces.
In the current year, the occupational distribution of the employed population is:72.0 percent in white collar jobs (compared to 61.6 percent of the U.S. employment)12.2 percent in service jobs (compared to 17.3 percent of U.S. employment)15.9 percent in blue collar jobs (compared to 21.1 percent of U.S. employment)
In 2000, 80.6 percent of the market area population drove alone to work, and 3.7 percent worked at home. The average travel time towork in 2000 was 27.5 minutes in the market area, compared to the U.S average of 25.5 minutes. Population by Education
In the current year, the educational attainment of the population aged 25 years or older in the market area was distributed as follows:5.3 percent had not earned a high school diploma (14.8 percent in the U.S)21.2 percent were high school graduates only (29.6 percent in the U.S.)10.3 percent had completed an Associate degree (7.7 percent in the U.S.)26.5 percent had a Bachelor's degree (17.7 percent in the U.S.)14.6 percent had earned a Master's/Professional/Doctorate Degree (10.4 percent in the U.S.)
Per Capita Income1990 Per Capita Income $15,967
2000 Per Capita Income $26,6282010 Per Capita Income $35,1772015 Per Capita Income $38,9071990-2000 Annual Rate 5.25%2000-2010 Annual Rate 2.75%2010-2015 Annual Rate 2.04%
Households
1990 Households 8,7892000 Households 14,1792010 Total Households 20,6792015 Total Households 24,5831990-2000 Annual Rate 4.90%2000-2010 Annual Rate 3.75%2010-2015 Annual Rate 3.52%2010 Average Household Size 2.76
The household count in this market area has changed from 14,179 in 2000 to 20,679 in the current year, a change of 3.75 percent annually.The five-year projection of households is 24,583, a change of 3.52 percent annually from the current year total. Average household size iscurrently 2.76, compared to 2.77 in the year 2000. The number of families in the current year is 15,134 in the market area.
September 18, 2013
Made with Esri Business Analyst©2010 Esri www.esri.com/ba 800-447-9778 Try it Now! Page 7 of 34
Data Note: Income is expressed in current dollarsSource: U.S. Bureau and Census, 2000 Census of Population and Housing, Esri forecast for 2010 and 2015. Esri converted 1990 Census data into 2000 geography.

Executive SummaryDR897_Affected_Counties Prepared By Business Analyst DesktopBroomfield
DR897_Affected_CountiesHouseholds by Income
Current median household income is $85,282 in the market area, compared to $54,442 for all U.S. households. Median household income isprojected to be $98,908 in five years. In 2000, median household income was $64,449.
Current average household income is $97,125 in this market area, compared to $70,173 for all U.S households. Average household incomeis projected to be $107,294 in five years. In 2000, average household income was $73,895, compared to $44,673 in 1990.
Current per capita income is $35,177 in the market area, compared to the U.S. per capita income of $26,739. The per capita income isprojected to be $38,907 in five years. In 2000, the per capita income was $26,628, compared to $15,967 in 1990. Median Household Income
2000 Median Household Income $64,4492010 Median Household Income $85,2822015 Median Household Income $98,9082000-2010 Annual Rate 2.77%2010-2015 Annual Rate 3.01%
Average Household Income
1990 Average Household Income $44,6732000 Average Household Income $73,8952010 Average Household Income $97,1252015 Average Household Income $107,2941990-2000 Annual Rate 5.16%2000-2010 Annual Rate 2.70%2010-2015 Annual Rate 2.01%
2010 Housing
1990 Total Housing Units 9,1762000 Total Housing Units 14,6732010 Total Housing Units 22,4362015 Total Housing Units 27,2981990 Owner Occupied Housing Units 6,3941990 Renter Occupied Housing Units 2,3951990 Vacant Housing Units 3872000 Owner Occupied Housing Units 10,9082000 Renter Occupied Housing Units 3,2712000 Vacant Housing Units 4942010 Owner Occupied Housing Units 15,7352010 Renter Occupied Housing Units 4,9432010 Vacant Housing Units 1,7572015 Owner Occupied Housing Units 18,8122015 Renter Occupied Housing Units 5,7712015 Vacant Housing Units 2,715
Currently, 70.1 percent of the 22,436 housing units in the market area are owner occupied; 22.0 percent, renter occupied; and 7.8 arevacant. In 2000, there were 14,673 housing units - 74.3 percent owner occupied, 22.3. percent renter occupied, and 3.4 percent vacant.The rate of change in housing units since 2000 is 4.23 percent. Median home value in the market area is $269,457, compared to a medianhome value of $157,913 for the U.S. In five years, median value is projected to change by 3.34 percent annually to $317,512. From 2000to the current year, median home value change by 3.70 percent annually.
Population1990 Population 7,6142000 Population 9,3142010 Population 9,1872015 Population 9,0881990-2000 Annual Rate 2.04%2000-2010 Annual Rate -0.13%2010-2015 Annual Rate -0.22%
September 18, 2013
Made with Esri Business Analyst©2010 Esri www.esri.com/ba 800-447-9778 Try it Now! Page 8 of 34
Data Note: Income is expressed in current dollarsSource: U.S. Bureau and Census, 2000 Census of Population and Housing, Esri forecast for 2010 and 2015. Esri converted 1990 Census data into 2000 geography.

Executive SummaryDR897_Affected_Counties Prepared By Business Analyst DesktopClear Creek
DR897_Affected_Counties2010 Male Population 51.7%2010 Female Population 48.3%2010 Median Age 44.2
In the identified market area, the current year population is 9,187. In 2000, the Census count in the market area was 9,314. The rate ofchange since 2000 was -0.13 percent annually. The five-year projection for the population in the market area is 9,088, representing achange of -0.22 percent annually from 2010 to 2015. Currently, the population is 51.7 percent male and 48.3 percent female.
Population by EmploymentCurrently, 94.0 percent of the civilian labor force in the indentified market area is employed and 6.0 percent are unemployed. Incomparison, 89.2 percent of the U.S. civilian labor force is employed, and 10.8 percent are unemployed. In five years the rate ofemployment in the market area will be 95.3 percent of the civilian labor force, and unemployment will be 4.7 percent. The percentage of theU.S. civilian labor force that will be employed in five years is 91.2 percent, and 8.8 percent will be unemployed. In 2000, 77.3 percent of thepopulation aged 16 years or older in the market area participated in the labor force, and 0.0 percent were in the Armed Forces.
In the current year, the occupational distribution of the employed population is:62.4 percent in white collar jobs (compared to 61.6 percent of the U.S. employment)19.1 percent in service jobs (compared to 17.3 percent of U.S. employment)18.5 percent in blue collar jobs (compared to 21.1 percent of U.S. employment)
In 2000, 72.7 percent of the market area population drove alone to work, and 7.6 percent worked at home. The average travel time towork in 2000 was 32.6 minutes in the market area, compared to the U.S average of 25.5 minutes. Population by Education
In the current year, the educational attainment of the population aged 25 years or older in the market area was distributed as follows:6.3 percent had not earned a high school diploma (14.8 percent in the U.S)21.4 percent were high school graduates only (29.6 percent in the U.S.)7.0 percent had completed an Associate degree (7.7 percent in the U.S.)24.8 percent had a Bachelor's degree (17.7 percent in the U.S.)14.6 percent had earned a Master's/Professional/Doctorate Degree (10.4 percent in the U.S.)
Per Capita Income1990 Per Capita Income $16,192
2000 Per Capita Income $28,1522010 Per Capita Income $34,4112015 Per Capita Income $39,6671990-2000 Annual Rate 5.69%2000-2010 Annual Rate 1.98%2010-2015 Annual Rate 2.88%
Households
1990 Households 3,1512000 Households 4,0162010 Total Households 3,9922015 Total Households 3,9571990-2000 Annual Rate 2.46%2000-2010 Annual Rate -0.06%2010-2015 Annual Rate -0.18%2010 Average Household Size 2.29
The household count in this market area has changed from 4,016 in 2000 to 3,992 in the current year, a change of -0.06 percent annually.The five-year projection of households is 3,957, a change of -0.18 percent annually from the current year total. Average household size iscurrently 2.29, compared to 2.31 in the year 2000. The number of families in the current year is 2,536 in the market area.
September 18, 2013
Made with Esri Business Analyst©2010 Esri www.esri.com/ba 800-447-9778 Try it Now! Page 9 of 34
Data Note: Income is expressed in current dollarsSource: U.S. Bureau and Census, 2000 Census of Population and Housing, Esri forecast for 2010 and 2015. Esri converted 1990 Census data into 2000 geography.

Executive SummaryDR897_Affected_Counties Prepared By Business Analyst DesktopClear Creek
DR897_Affected_CountiesHouseholds by Income
Current median household income is $63,775 in the market area, compared to $54,442 for all U.S. households. Median household income isprojected to be $72,681 in five years. In 2000, median household income was $51,194.
Current average household income is $78,989 in this market area, compared to $70,173 for all U.S households. Average household incomeis projected to be $90,848 in five years. In 2000, average household income was $64,705, compared to $38,725 in 1990.
Current per capita income is $34,411 in the market area, compared to the U.S. per capita income of $26,739. The per capita income isprojected to be $39,667 in five years. In 2000, the per capita income was $28,152, compared to $16,192 in 1990. Median Household Income
2000 Median Household Income $51,1942010 Median Household Income $63,7752015 Median Household Income $72,6812000-2010 Annual Rate 2.17%2010-2015 Annual Rate 2.65%
Average Household Income
1990 Average Household Income $38,7252000 Average Household Income $64,7052010 Average Household Income $78,9892015 Average Household Income $90,8481990-2000 Annual Rate 5.27%2000-2010 Annual Rate 1.97%2010-2015 Annual Rate 2.84%
2010 Housing
1990 Total Housing Units 4,8082000 Total Housing Units 5,1242010 Total Housing Units 5,3992015 Total Housing Units 5,4771990 Owner Occupied Housing Units 2,2661990 Renter Occupied Housing Units 8851990 Vacant Housing Units 1,6572000 Owner Occupied Housing Units 3,0562000 Renter Occupied Housing Units 9602000 Vacant Housing Units 1,1082010 Owner Occupied Housing Units 3,0132010 Renter Occupied Housing Units 9792010 Vacant Housing Units 1,4072015 Owner Occupied Housing Units 2,9872015 Renter Occupied Housing Units 9702015 Vacant Housing Units 1,521
Currently, 55.8 percent of the 5,399 housing units in the market area are owner occupied; 18.1 percent, renter occupied; and 26.1 arevacant. In 2000, there were 5,124 housing units - 59.6 percent owner occupied, 18.7. percent renter occupied, and 21.6 percent vacant.The rate of change in housing units since 2000 is 0.51 percent. Median home value in the market area is $242,748, compared to a medianhome value of $157,913 for the U.S. In five years, median value is projected to change by 3.45 percent annually to $287,574. From 2000to the current year, median home value change by 2.24 percent annually.
Population1990 Population 466,1312000 Population 551,9722010 Population 618,3512015 Population 665,3351990-2000 Annual Rate 1.70%2000-2010 Annual Rate 1.11%2010-2015 Annual Rate 1.48%
September 18, 2013
Made with Esri Business Analyst©2010 Esri www.esri.com/ba 800-447-9778 Try it Now! Page 10 of 34
Data Note: Income is expressed in current dollarsSource: U.S. Bureau and Census, 2000 Census of Population and Housing, Esri forecast for 2010 and 2015. Esri converted 1990 Census data into 2000 geography.

Executive SummaryDR897_Affected_Counties Prepared By Business Analyst DesktopDenver
DR897_Affected_Counties2010 Male Population 50.6%2010 Female Population 49.4%2010 Median Age 34.9
In the identified market area, the current year population is 618,351. In 2000, the Census count in the market area was 551,972. The rateof change since 2000 was 1.11 percent annually. The five-year projection for the population in the market area is 665,335, representing achange of 1.48 percent annually from 2010 to 2015. Currently, the population is 50.6 percent male and 49.4 percent female.
Population by EmploymentCurrently, 89.6 percent of the civilian labor force in the indentified market area is employed and 10.4 percent are unemployed. Incomparison, 89.2 percent of the U.S. civilian labor force is employed, and 10.8 percent are unemployed. In five years the rate ofemployment in the market area will be 91.8 percent of the civilian labor force, and unemployment will be 8.2 percent. The percentage of theU.S. civilian labor force that will be employed in five years is 91.2 percent, and 8.8 percent will be unemployed. In 2000, 67.6 percent of thepopulation aged 16 years or older in the market area participated in the labor force, and 0.1 percent were in the Armed Forces.
In the current year, the occupational distribution of the employed population is:64.4 percent in white collar jobs (compared to 61.6 percent of the U.S. employment)17.9 percent in service jobs (compared to 17.3 percent of U.S. employment)17.7 percent in blue collar jobs (compared to 21.1 percent of U.S. employment)
In 2000, 68.2 percent of the market area population drove alone to work, and 3.7 percent worked at home. The average travel time towork in 2000 was 24.4 minutes in the market area, compared to the U.S average of 25.5 minutes. Population by Education
In the current year, the educational attainment of the population aged 25 years or older in the market area was distributed as follows:17.1 percent had not earned a high school diploma (14.8 percent in the U.S)21.7 percent were high school graduates only (29.6 percent in the U.S.)5.2 percent had completed an Associate degree (7.7 percent in the U.S.)22.8 percent had a Bachelor's degree (17.7 percent in the U.S.)15.9 percent had earned a Master's/Professional/Doctorate Degree (10.4 percent in the U.S.)
Per Capita Income1990 Per Capita Income $15,547
2000 Per Capita Income $24,0402010 Per Capita Income $29,6012015 Per Capita Income $34,7791990-2000 Annual Rate 4.45%2000-2010 Annual Rate 2.05%2010-2015 Annual Rate 3.28%
Households
1990 Households 210,1172000 Households 237,8832010 Total Households 261,8382015 Total Households 280,6601990-2000 Annual Rate 1.25%2000-2010 Annual Rate 0.94%2010-2015 Annual Rate 1.40%2010 Average Household Size 2.31
The household count in this market area has changed from 237,883 in 2000 to 261,838 in the current year, a change of 0.94 percentannually. The five-year projection of households is 280,660, a change of 1.40 percent annually from the current year total. Averagehousehold size is currently 2.31, compared to 2.27 in the year 2000. The number of families in the current year is 126,743 in the marketarea.
September 18, 2013
Made with Esri Business Analyst©2010 Esri www.esri.com/ba 800-447-9778 Try it Now! Page 11 of 34
Data Note: Income is expressed in current dollarsSource: U.S. Bureau and Census, 2000 Census of Population and Housing, Esri forecast for 2010 and 2015. Esri converted 1990 Census data into 2000 geography.

Executive SummaryDR897_Affected_Counties Prepared By Business Analyst DesktopDenver
DR897_Affected_CountiesHouseholds by Income
Current median household income is $53,590 in the market area, compared to $54,442 for all U.S. households. Median household income isprojected to be $62,768 in five years. In 2000, median household income was $39,410.
Current average household income is $68,990 in this market area, compared to $70,173 for all U.S households. Average household incomeis projected to be $81,475 in five years. In 2000, average household income was $55,010, compared to $33,919 in 1990.
Current per capita income is $29,601 in the market area, compared to the U.S. per capita income of $26,739. The per capita income isprojected to be $34,779 in five years. In 2000, the per capita income was $24,040, compared to $15,547 in 1990. Median Household Income
2000 Median Household Income $39,4102010 Median Household Income $53,5902015 Median Household Income $62,7682000-2010 Annual Rate 3.04%2010-2015 Annual Rate 3.21%
Average Household Income
1990 Average Household Income $33,9192000 Average Household Income $55,0102010 Average Household Income $68,9902015 Average Household Income $81,4751990-2000 Annual Rate 4.95%2000-2010 Annual Rate 2.23%2010-2015 Annual Rate 3.38%
2010 Housing
1990 Total Housing Units 238,6682000 Total Housing Units 250,0272010 Total Housing Units 283,4302015 Total Housing Units 302,1761990 Owner Occupied Housing Units 103,2731990 Renter Occupied Housing Units 106,8441990 Vacant Housing Units 28,5442000 Owner Occupied Housing Units 124,5842000 Renter Occupied Housing Units 113,2992000 Vacant Housing Units 12,1342010 Owner Occupied Housing Units 133,0242010 Renter Occupied Housing Units 128,8142010 Vacant Housing Units 21,5922015 Owner Occupied Housing Units 142,5422015 Renter Occupied Housing Units 138,1182015 Vacant Housing Units 21,516
Currently, 46.9 percent of the 283,430 housing units in the market area are owner occupied; 45.4 percent, renter occupied; and 7.6 arevacant. In 2000, there were 250,027 housing units - 49.8 percent owner occupied, 45.3. percent renter occupied, and 4.9 percent vacant.The rate of change in housing units since 2000 is 1.23 percent. Median home value in the market area is $214,829, compared to a medianhome value of $157,913 for the U.S. In five years, median value is projected to change by 3.40 percent annually to $253,967. From 2000to the current year, median home value change by 2.91 percent annually.
Population1990 Population 397,0102000 Population 516,9222010 Population 615,8842015 Population 660,7271990-2000 Annual Rate 2.67%2000-2010 Annual Rate 1.72%2010-2015 Annual Rate 1.42%
September 18, 2013
Made with Esri Business Analyst©2010 Esri www.esri.com/ba 800-447-9778 Try it Now! Page 12 of 34
Data Note: Income is expressed in current dollarsSource: U.S. Bureau and Census, 2000 Census of Population and Housing, Esri forecast for 2010 and 2015. Esri converted 1990 Census data into 2000 geography.

Executive SummaryDR897_Affected_Counties Prepared By Business Analyst DesktopEl Paso
DR897_Affected_Counties2010 Male Population 50.0%2010 Female Population 50.0%2010 Median Age 34.2
In the identified market area, the current year population is 615,884. In 2000, the Census count in the market area was 516,922. The rateof change since 2000 was 1.72 percent annually. The five-year projection for the population in the market area is 660,727, representing achange of 1.42 percent annually from 2010 to 2015. Currently, the population is 50.0 percent male and 50.0 percent female.
Population by EmploymentCurrently, 90.3 percent of the civilian labor force in the indentified market area is employed and 9.7 percent are unemployed. Incomparison, 89.2 percent of the U.S. civilian labor force is employed, and 10.8 percent are unemployed. In five years the rate ofemployment in the market area will be 92.2 percent of the civilian labor force, and unemployment will be 7.8 percent. The percentage of theU.S. civilian labor force that will be employed in five years is 91.2 percent, and 8.8 percent will be unemployed. In 2000, 71.9 percent of thepopulation aged 16 years or older in the market area participated in the labor force, and 6.1 percent were in the Armed Forces.
In the current year, the occupational distribution of the employed population is:65.1 percent in white collar jobs (compared to 61.6 percent of the U.S. employment)17.2 percent in service jobs (compared to 17.3 percent of U.S. employment)17.7 percent in blue collar jobs (compared to 21.1 percent of U.S. employment)
In 2000, 78.0 percent of the market area population drove alone to work, and 4.0 percent worked at home. The average travel time towork in 2000 was 22.3 minutes in the market area, compared to the U.S average of 25.5 minutes. Population by Education
In the current year, the educational attainment of the population aged 25 years or older in the market area was distributed as follows:7.8 percent had not earned a high school diploma (14.8 percent in the U.S)23.4 percent were high school graduates only (29.6 percent in the U.S.)9.9 percent had completed an Associate degree (7.7 percent in the U.S.)21.6 percent had a Bachelor's degree (17.7 percent in the U.S.)13.2 percent had earned a Master's/Professional/Doctorate Degree (10.4 percent in the U.S.)
Per Capita Income1990 Per Capita Income $13,664
2000 Per Capita Income $22,0052010 Per Capita Income $27,8012015 Per Capita Income $32,2961990-2000 Annual Rate 4.88%2000-2010 Annual Rate 2.31%2010-2015 Annual Rate 3.04%
Households
1990 Households 146,9642000 Households 192,4072010 Total Households 229,3532015 Total Households 246,2961990-2000 Annual Rate 2.73%2000-2010 Annual Rate 1.73%2010-2015 Annual Rate 1.44%2010 Average Household Size 2.62
The household count in this market area has changed from 192,407 in 2000 to 229,353 in the current year, a change of 1.73 percentannually. The five-year projection of households is 246,296, a change of 1.44 percent annually from the current year total. Averagehousehold size is currently 2.62, compared to 2.61 in the year 2000. The number of families in the current year is 156,641 in the marketarea.
September 18, 2013
Made with Esri Business Analyst©2010 Esri www.esri.com/ba 800-447-9778 Try it Now! Page 13 of 34
Data Note: Income is expressed in current dollarsSource: U.S. Bureau and Census, 2000 Census of Population and Housing, Esri forecast for 2010 and 2015. Esri converted 1990 Census data into 2000 geography.

Executive SummaryDR897_Affected_Counties Prepared By Business Analyst DesktopEl Paso
DR897_Affected_CountiesHouseholds by Income
Current median household income is $61,708 in the market area, compared to $54,442 for all U.S. households. Median household income isprojected to be $70,998 in five years. In 2000, median household income was $46,821.
Current average household income is $73,376 in this market area, compared to $70,173 for all U.S households. Average household incomeis projected to be $85,287 in five years. In 2000, average household income was $57,905, compared to $35,989 in 1990.
Current per capita income is $27,801 in the market area, compared to the U.S. per capita income of $26,739. The per capita income isprojected to be $32,296 in five years. In 2000, the per capita income was $22,005, compared to $13,664 in 1990. Median Household Income
2000 Median Household Income $46,8212010 Median Household Income $61,7082015 Median Household Income $70,9982000-2010 Annual Rate 2.73%2010-2015 Annual Rate 2.84%
Average Household Income
1990 Average Household Income $35,9892000 Average Household Income $57,9052010 Average Household Income $73,3762015 Average Household Income $85,2871990-2000 Annual Rate 4.87%2000-2010 Annual Rate 2.34%2010-2015 Annual Rate 3.05%
2010 Housing
1990 Total Housing Units 165,0542000 Total Housing Units 202,4252010 Total Housing Units 254,3922015 Total Housing Units 276,3231990 Owner Occupied Housing Units 84,3171990 Renter Occupied Housing Units 62,6461990 Vacant Housing Units 18,0912000 Owner Occupied Housing Units 124,4312000 Renter Occupied Housing Units 67,9752000 Vacant Housing Units 10,0192010 Owner Occupied Housing Units 146,3182010 Renter Occupied Housing Units 83,0352010 Vacant Housing Units 25,0392015 Owner Occupied Housing Units 157,8162015 Renter Occupied Housing Units 88,4802015 Vacant Housing Units 30,027
Currently, 57.5 percent of the 254,392 housing units in the market area are owner occupied; 32.6 percent, renter occupied; and 9.8 arevacant. In 2000, there were 202,425 housing units - 61.5 percent owner occupied, 33.6. percent renter occupied, and 4.9 percent vacant.The rate of change in housing units since 2000 is 2.25 percent. Median home value in the market area is $199,782, compared to a medianhome value of $157,913 for the U.S. In five years, median value is projected to change by 3.28 percent annually to $234,808. From 2000to the current year, median home value change by 3.27 percent annually.
Population1990 Population 32,2712000 Population 46,1422010 Population 48,0112015 Population 48,0161990-2000 Annual Rate 3.64%2000-2010 Annual Rate 0.39%2010-2015 Annual Rate 0.00%
September 18, 2013
Made with Esri Business Analyst©2010 Esri www.esri.com/ba 800-447-9778 Try it Now! Page 14 of 34
Data Note: Income is expressed in current dollarsSource: U.S. Bureau and Census, 2000 Census of Population and Housing, Esri forecast for 2010 and 2015. Esri converted 1990 Census data into 2000 geography.
Executive SummaryDR897_Affected_Counties Prepared By Business Analyst DesktopFremont
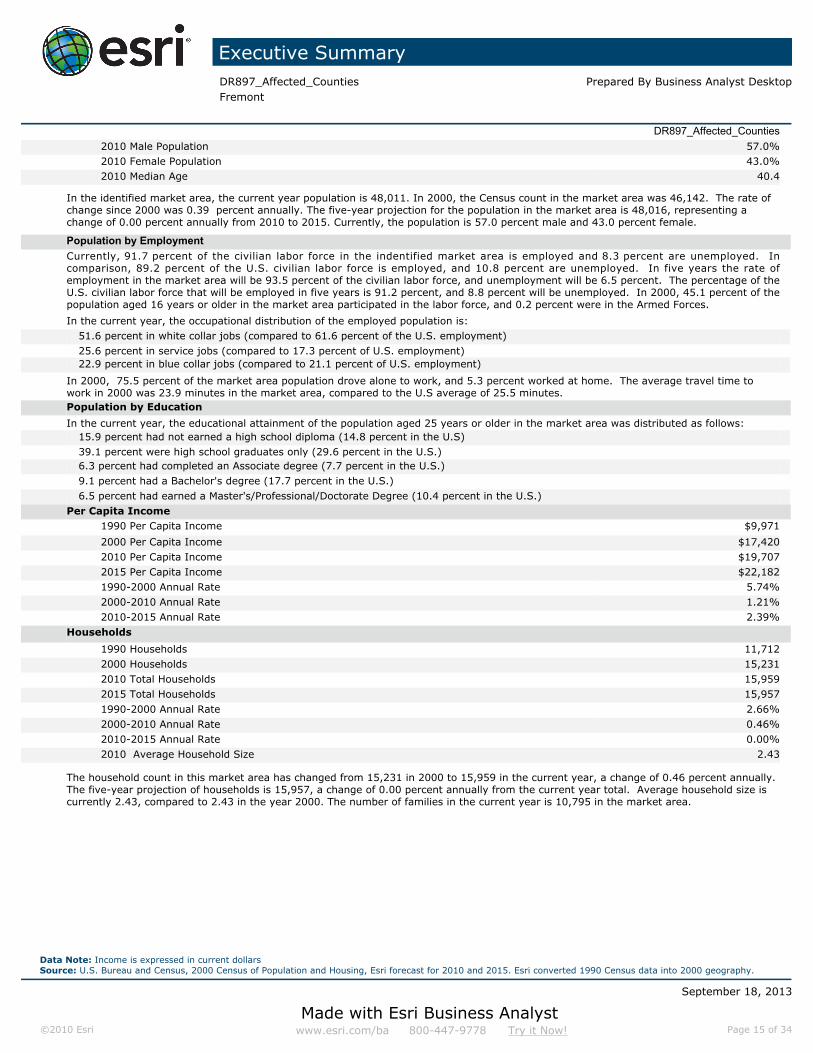
DR897_Affected_Counties2010 Male Population 57.0%2010 Female Population 43.0%2010 Median Age 40.4
In the identified market area, the current year population is 48,011. In 2000, the Census count in the market area was 46,142. The rate ofchange since 2000 was 0.39 percent annually. The five-year projection for the population in the market area is 48,016, representing achange of 0.00 percent annually from 2010 to 2015. Currently, the population is 57.0 percent male and 43.0 percent female.
Population by EmploymentCurrently, 91.7 percent of the civilian labor force in the indentified market area is employed and 8.3 percent are unemployed. Incomparison, 89.2 percent of the U.S. civilian labor force is employed, and 10.8 percent are unemployed. In five years the rate ofemployment in the market area will be 93.5 percent of the civilian labor force, and unemployment will be 6.5 percent. The percentage of theU.S. civilian labor force that will be employed in five years is 91.2 percent, and 8.8 percent will be unemployed. In 2000, 45.1 percent of thepopulation aged 16 years or older in the market area participated in the labor force, and 0.2 percent were in the Armed Forces.
In the current year, the occupational distribution of the employed population is:51.6 percent in white collar jobs (compared to 61.6 percent of the U.S. employment)25.6 percent in service jobs (compared to 17.3 percent of U.S. employment)22.9 percent in blue collar jobs (compared to 21.1 percent of U.S. employment)
In 2000, 75.5 percent of the market area population drove alone to work, and 5.3 percent worked at home. The average travel time towork in 2000 was 23.9 minutes in the market area, compared to the U.S average of 25.5 minutes. Population by Education
In the current year, the educational attainment of the population aged 25 years or older in the market area was distributed as follows:15.9 percent had not earned a high school diploma (14.8 percent in the U.S)39.1 percent were high school graduates only (29.6 percent in the U.S.)6.3 percent had completed an Associate degree (7.7 percent in the U.S.)9.1 percent had a Bachelor's degree (17.7 percent in the U.S.)6.5 percent had earned a Master's/Professional/Doctorate Degree (10.4 percent in the U.S.)
Per Capita Income1990 Per Capita Income $9,971
2000 Per Capita Income $17,4202010 Per Capita Income $19,7072015 Per Capita Income $22,1821990-2000 Annual Rate 5.74%2000-2010 Annual Rate 1.21%2010-2015 Annual Rate 2.39%
Households
1990 Households 11,7122000 Households 15,2312010 Total Households 15,9592015 Total Households 15,9571990-2000 Annual Rate 2.66%2000-2010 Annual Rate 0.46%2010-2015 Annual Rate 0.00%2010 Average Household Size 2.43
The household count in this market area has changed from 15,231 in 2000 to 15,959 in the current year, a change of 0.46 percent annually.The five-year projection of households is 15,957, a change of 0.00 percent annually from the current year total. Average household size iscurrently 2.43, compared to 2.43 in the year 2000. The number of families in the current year is 10,795 in the market area.
September 18, 2013
Made with Esri Business Analyst©2010 Esri www.esri.com/ba 800-447-9778 Try it Now! Page 15 of 34
Data Note: Income is expressed in current dollarsSource: U.S. Bureau and Census, 2000 Census of Population and Housing, Esri forecast for 2010 and 2015. Esri converted 1990 Census data into 2000 geography.

Executive SummaryDR897_Affected_Counties Prepared By Business Analyst DesktopFremont
DR897_Affected_CountiesHouseholds by Income
Current median household income is $41,872 in the market area, compared to $54,442 for all U.S. households. Median household income isprojected to be $47,785 in five years. In 2000, median household income was $34,150.
Current average household income is $48,728 in this market area, compared to $70,173 for all U.S households. Average household incomeis projected to be $54,741 in five years. In 2000, average household income was $41,840, compared to $25,750 in 1990.
Current per capita income is $19,707 in the market area, compared to the U.S. per capita income of $26,739. The per capita income isprojected to be $22,182 in five years. In 2000, the per capita income was $17,420, compared to $9,971 in 1990. Median Household Income
2000 Median Household Income $34,1502010 Median Household Income $41,8722015 Median Household Income $47,7852000-2010 Annual Rate 2.01%2010-2015 Annual Rate 2.68%
Average Household Income
1990 Average Household Income $25,7502000 Average Household Income $41,8402010 Average Household Income $48,7282015 Average Household Income $54,7411990-2000 Annual Rate 4.97%2000-2010 Annual Rate 1.50%2010-2015 Annual Rate 2.35%
2010 Housing
1990 Total Housing Units 13,6822000 Total Housing Units 17,1442010 Total Housing Units 19,5202015 Total Housing Units 20,1701990 Owner Occupied Housing Units 8,5361990 Renter Occupied Housing Units 3,1761990 Vacant Housing Units 1,9702000 Owner Occupied Housing Units 11,5642000 Renter Occupied Housing Units 3,6672000 Vacant Housing Units 1,9132010 Owner Occupied Housing Units 11,9292010 Renter Occupied Housing Units 4,0302010 Vacant Housing Units 3,5612015 Owner Occupied Housing Units 11,9312015 Renter Occupied Housing Units 4,0262015 Vacant Housing Units 4,213
Currently, 61.1 percent of the 19,520 housing units in the market area are owner occupied; 20.6 percent, renter occupied; and 18.2 arevacant. In 2000, there were 17,144 housing units - 67.5 percent owner occupied, 21.4. percent renter occupied, and 11.2 percent vacant.The rate of change in housing units since 2000 is 1.27 percent. Median home value in the market area is $155,826, compared to a medianhome value of $157,913 for the U.S. In five years, median value is projected to change by 2.43 percent annually to $175,739. From 2000to the current year, median home value change by 4.48 percent annually.
Population1990 Population 437,3032000 Population 526,6742010 Population 543,7472015 Population 551,7901990-2000 Annual Rate 1.88%2000-2010 Annual Rate 0.31%2010-2015 Annual Rate 0.29%
September 18, 2013
Made with Esri Business Analyst©2010 Esri www.esri.com/ba 800-447-9778 Try it Now! Page 16 of 34
Data Note: Income is expressed in current dollarsSource: U.S. Bureau and Census, 2000 Census of Population and Housing, Esri forecast for 2010 and 2015. Esri converted 1990 Census data into 2000 geography.

Executive SummaryDR897_Affected_Counties Prepared By Business Analyst DesktopJefferson
DR897_Affected_Counties2010 Male Population 49.6%2010 Female Population 50.4%2010 Median Age 39.0
In the identified market area, the current year population is 543,747. In 2000, the Census count in the market area was 526,674. The rateof change since 2000 was 0.31 percent annually. The five-year projection for the population in the market area is 551,790, representing achange of 0.29 percent annually from 2010 to 2015. Currently, the population is 49.6 percent male and 50.4 percent female.
Population by EmploymentCurrently, 92.0 percent of the civilian labor force in the indentified market area is employed and 8.0 percent are unemployed. Incomparison, 89.2 percent of the U.S. civilian labor force is employed, and 10.8 percent are unemployed. In five years the rate ofemployment in the market area will be 93.6 percent of the civilian labor force, and unemployment will be 6.4 percent. The percentage of theU.S. civilian labor force that will be employed in five years is 91.2 percent, and 8.8 percent will be unemployed. In 2000, 73.4 percent of thepopulation aged 16 years or older in the market area participated in the labor force, and 0.0 percent were in the Armed Forces.
In the current year, the occupational distribution of the employed population is:70.3 percent in white collar jobs (compared to 61.6 percent of the U.S. employment)13.7 percent in service jobs (compared to 17.3 percent of U.S. employment)16.0 percent in blue collar jobs (compared to 21.1 percent of U.S. employment)
In 2000, 79.6 percent of the market area population drove alone to work, and 5.1 percent worked at home. The average travel time towork in 2000 was 27.4 minutes in the market area, compared to the U.S average of 25.5 minutes. Population by Education
In the current year, the educational attainment of the population aged 25 years or older in the market area was distributed as follows:7.2 percent had not earned a high school diploma (14.8 percent in the U.S)23.3 percent were high school graduates only (29.6 percent in the U.S.)8.1 percent had completed an Associate degree (7.7 percent in the U.S.)25.2 percent had a Bachelor's degree (17.7 percent in the U.S.)13.3 percent had earned a Master's/Professional/Doctorate Degree (10.4 percent in the U.S.)
Per Capita Income1990 Per Capita Income $17,330
2000 Per Capita Income $28,0982010 Per Capita Income $36,2522015 Per Capita Income $41,5211990-2000 Annual Rate 4.95%2000-2010 Annual Rate 2.52%2010-2015 Annual Rate 2.75%
Households
1990 Households 166,1992000 Households 206,0472010 Total Households 216,6552015 Total Households 220,9321990-2000 Annual Rate 2.17%2000-2010 Annual Rate 0.49%2010-2015 Annual Rate 0.39%2010 Average Household Size 2.47
The household count in this market area has changed from 206,047 in 2000 to 216,655 in the current year, a change of 0.49 percentannually. The five-year projection of households is 220,932, a change of 0.39 percent annually from the current year total. Averagehousehold size is currently 2.47, compared to 2.52 in the year 2000. The number of families in the current year is 144,737 in the marketarea.
September 18, 2013
Made with Esri Business Analyst©2010 Esri www.esri.com/ba 800-447-9778 Try it Now! Page 17 of 34
Data Note: Income is expressed in current dollarsSource: U.S. Bureau and Census, 2000 Census of Population and Housing, Esri forecast for 2010 and 2015. Esri converted 1990 Census data into 2000 geography.

Executive SummaryDR897_Affected_Counties Prepared By Business Analyst DesktopJefferson
DR897_Affected_CountiesHouseholds by Income
Current median household income is $75,221 in the market area, compared to $54,442 for all U.S. households. Median household income isprojected to be $86,710 in five years. In 2000, median household income was $57,502.
Current average household income is $90,318 in this market area, compared to $70,173 for all U.S households. Average household incomeis projected to be $102,961 in five years. In 2000, average household income was $70,966, compared to $45,069 in 1990.
Current per capita income is $36,252 in the market area, compared to the U.S. per capita income of $26,739. The per capita income isprojected to be $41,521 in five years. In 2000, the per capita income was $28,098, compared to $17,330 in 1990. Median Household Income
2000 Median Household Income $57,5022010 Median Household Income $75,2212015 Median Household Income $86,7102000-2010 Annual Rate 2.66%2010-2015 Annual Rate 2.88%
Average Household Income
1990 Average Household Income $45,0692000 Average Household Income $70,9662010 Average Household Income $90,3182015 Average Household Income $102,9611990-2000 Annual Rate 4.64%2000-2010 Annual Rate 2.38%2010-2015 Annual Rate 2.65%
2010 Housing
1990 Total Housing Units 178,2622000 Total Housing Units 212,4962010 Total Housing Units 232,7852015 Total Housing Units 240,0841990 Owner Occupied Housing Units 116,4571990 Renter Occupied Housing Units 49,7431990 Vacant Housing Units 12,0652000 Owner Occupied Housing Units 149,3282000 Renter Occupied Housing Units 56,7192000 Vacant Housing Units 6,4532010 Owner Occupied Housing Units 154,3882010 Renter Occupied Housing Units 62,2672010 Vacant Housing Units 16,1302015 Owner Occupied Housing Units 157,4602015 Renter Occupied Housing Units 63,4722015 Vacant Housing Units 19,152
Currently, 66.3 percent of the 232,785 housing units in the market area are owner occupied; 26.7 percent, renter occupied; and 6.9 arevacant. In 2000, there were 212,496 housing units - 70.3 percent owner occupied, 26.7. percent renter occupied, and 3.0 percent vacant.The rate of change in housing units since 2000 is 0.89 percent. Median home value in the market area is $251,313, compared to a medianhome value of $157,913 for the U.S. In five years, median value is projected to change by 2.96 percent annually to $290,782. From 2000to the current year, median home value change by 3.06 percent annually.
Population1990 Population 186,1342000 Population 251,4912010 Population 300,5142015 Population 328,3331990-2000 Annual Rate 3.06%2000-2010 Annual Rate 1.75%2010-2015 Annual Rate 1.79%
September 18, 2013
Made with Esri Business Analyst©2010 Esri www.esri.com/ba 800-447-9778 Try it Now! Page 18 of 34
Data Note: Income is expressed in current dollarsSource: U.S. Bureau and Census, 2000 Census of Population and Housing, Esri forecast for 2010 and 2015. Esri converted 1990 Census data into 2000 geography.

Executive SummaryDR897_Affected_Counties Prepared By Business Analyst DesktopLarimer
DR897_Affected_Counties2010 Male Population 49.9%2010 Female Population 50.1%2010 Median Age 34.9
In the identified market area, the current year population is 300,514. In 2000, the Census count in the market area was 251,491. The rateof change since 2000 was 1.75 percent annually. The five-year projection for the population in the market area is 328,333, representing achange of 1.79 percent annually from 2010 to 2015. Currently, the population is 49.9 percent male and 50.1 percent female.
Population by EmploymentCurrently, 92.2 percent of the civilian labor force in the indentified market area is employed and 7.8 percent are unemployed. Incomparison, 89.2 percent of the U.S. civilian labor force is employed, and 10.8 percent are unemployed. In five years the rate ofemployment in the market area will be 93.8 percent of the civilian labor force, and unemployment will be 6.2 percent. The percentage of theU.S. civilian labor force that will be employed in five years is 91.2 percent, and 8.8 percent will be unemployed. In 2000, 71.9 percent of thepopulation aged 16 years or older in the market area participated in the labor force, and 0.1 percent were in the Armed Forces.
In the current year, the occupational distribution of the employed population is:65.1 percent in white collar jobs (compared to 61.6 percent of the U.S. employment)16.5 percent in service jobs (compared to 17.3 percent of U.S. employment)18.4 percent in blue collar jobs (compared to 21.1 percent of U.S. employment)
In 2000, 77.4 percent of the market area population drove alone to work, and 5.1 percent worked at home. The average travel time towork in 2000 was 21.4 minutes in the market area, compared to the U.S average of 25.5 minutes. Population by Education
In the current year, the educational attainment of the population aged 25 years or older in the market area was distributed as follows:6.1 percent had not earned a high school diploma (14.8 percent in the U.S)20.9 percent were high school graduates only (29.6 percent in the U.S.)8.0 percent had completed an Associate degree (7.7 percent in the U.S.)26.1 percent had a Bachelor's degree (17.7 percent in the U.S.)16.5 percent had earned a Master's/Professional/Doctorate Degree (10.4 percent in the U.S.)
Per Capita Income1990 Per Capita Income $13,968
2000 Per Capita Income $23,6892010 Per Capita Income $29,3512015 Per Capita Income $34,2181990-2000 Annual Rate 5.42%2000-2010 Annual Rate 2.11%2010-2015 Annual Rate 3.12%
Households
1990 Households 70,4712000 Households 97,1632010 Total Households 118,5082015 Total Households 130,1501990-2000 Annual Rate 3.26%2000-2010 Annual Rate 1.96%2010-2015 Annual Rate 1.89%2010 Average Household Size 2.48
The household count in this market area has changed from 97,163 in 2000 to 118,508 in the current year, a change of 1.96 percentannually. The five-year projection of households is 130,150, a change of 1.89 percent annually from the current year total. Averagehousehold size is currently 2.48, compared to 2.52 in the year 2000. The number of families in the current year is 75,480 in the marketarea.
September 18, 2013
Made with Esri Business Analyst©2010 Esri www.esri.com/ba 800-447-9778 Try it Now! Page 19 of 34
Data Note: Income is expressed in current dollarsSource: U.S. Bureau and Census, 2000 Census of Population and Housing, Esri forecast for 2010 and 2015. Esri converted 1990 Census data into 2000 geography.

Executive SummaryDR897_Affected_Counties Prepared By Business Analyst DesktopLarimer
DR897_Affected_CountiesHouseholds by Income
Current median household income is $62,730 in the market area, compared to $54,442 for all U.S. households. Median household income isprojected to be $72,181 in five years. In 2000, median household income was $48,735.
Current average household income is $73,328 in this market area, compared to $70,173 for all U.S households. Average household incomeis projected to be $85,185 in five years. In 2000, average household income was $60,515, compared to $36,426 in 1990.
Current per capita income is $29,351 in the market area, compared to the U.S. per capita income of $26,739. The per capita income isprojected to be $34,218 in five years. In 2000, the per capita income was $23,689, compared to $13,968 in 1990. Median Household Income
2000 Median Household Income $48,7352010 Median Household Income $62,7302015 Median Household Income $72,1812000-2010 Annual Rate 2.49%2010-2015 Annual Rate 2.85%
Average Household Income
1990 Average Household Income $36,4262000 Average Household Income $60,5152010 Average Household Income $73,3282015 Average Household Income $85,1851990-2000 Annual Rate 5.21%2000-2010 Annual Rate 1.89%2010-2015 Annual Rate 3.04%
2010 Housing
1990 Total Housing Units 77,8102000 Total Housing Units 105,3912010 Total Housing Units 133,8112015 Total Housing Units 147,2061990 Owner Occupied Housing Units 44,2961990 Renter Occupied Housing Units 26,1751990 Vacant Housing Units 7,3392000 Owner Occupied Housing Units 65,7662000 Renter Occupied Housing Units 31,3972000 Vacant Housing Units 8,2282010 Owner Occupied Housing Units 79,0962010 Renter Occupied Housing Units 39,4122010 Vacant Housing Units 15,3032015 Owner Occupied Housing Units 87,2452015 Renter Occupied Housing Units 42,9052015 Vacant Housing Units 17,056
Currently, 59.1 percent of the 133,811 housing units in the market area are owner occupied; 29.5 percent, renter occupied; and 11.4 arevacant. In 2000, there were 105,391 housing units - 62.4 percent owner occupied, 29.8. percent renter occupied, and 7.8 percent vacant.The rate of change in housing units since 2000 is 2.36 percent. Median home value in the market area is $225,617, compared to a medianhome value of $157,913 for the U.S. In five years, median value is projected to change by 3.33 percent annually to $265,818. From 2000to the current year, median home value change by 2.91 percent annually.
Population1990 Population 17,5662000 Population 20,5032010 Population 21,1452015 Population 20,8581990-2000 Annual Rate 1.56%2000-2010 Annual Rate 0.30%2010-2015 Annual Rate -0.27%
September 18, 2013
Made with Esri Business Analyst©2010 Esri www.esri.com/ba 800-447-9778 Try it Now! Page 20 of 34
Data Note: Income is expressed in current dollarsSource: U.S. Bureau and Census, 2000 Census of Population and Housing, Esri forecast for 2010 and 2015. Esri converted 1990 Census data into 2000 geography.

Executive SummaryDR897_Affected_Counties Prepared By Business Analyst DesktopLogan
DR897_Affected_Counties2010 Male Population 51.4%2010 Female Population 48.6%2010 Median Age 36.6
In the identified market area, the current year population is 21,145. In 2000, the Census count in the market area was 20,503. The rate ofchange since 2000 was 0.30 percent annually. The five-year projection for the population in the market area is 20,858, representing achange of -0.27 percent annually from 2010 to 2015. Currently, the population is 51.4 percent male and 48.6 percent female.
Population by EmploymentCurrently, 94.1 percent of the civilian labor force in the indentified market area is employed and 5.9 percent are unemployed. Incomparison, 89.2 percent of the U.S. civilian labor force is employed, and 10.8 percent are unemployed. In five years the rate ofemployment in the market area will be 95.3 percent of the civilian labor force, and unemployment will be 4.7 percent. The percentage of theU.S. civilian labor force that will be employed in five years is 91.2 percent, and 8.8 percent will be unemployed. In 2000, 60.7 percent of thepopulation aged 16 years or older in the market area participated in the labor force, and 0.0 percent were in the Armed Forces.
In the current year, the occupational distribution of the employed population is:52.6 percent in white collar jobs (compared to 61.6 percent of the U.S. employment)22.9 percent in service jobs (compared to 17.3 percent of U.S. employment)24.5 percent in blue collar jobs (compared to 21.1 percent of U.S. employment)
In 2000, 76.0 percent of the market area population drove alone to work, and 5.6 percent worked at home. The average travel time towork in 2000 was 15.2 minutes in the market area, compared to the U.S average of 25.5 minutes. Population by Education
In the current year, the educational attainment of the population aged 25 years or older in the market area was distributed as follows:14.8 percent had not earned a high school diploma (14.8 percent in the U.S)33.5 percent were high school graduates only (29.6 percent in the U.S.)12.7 percent had completed an Associate degree (7.7 percent in the U.S.)10.0 percent had a Bachelor's degree (17.7 percent in the U.S.)6.5 percent had earned a Master's/Professional/Doctorate Degree (10.4 percent in the U.S.)
Per Capita Income1990 Per Capita Income $10,898
2000 Per Capita Income $16,7212010 Per Capita Income $19,8012015 Per Capita Income $22,5591990-2000 Annual Rate 4.37%2000-2010 Annual Rate 1.66%2010-2015 Annual Rate 2.64%
Households
1990 Households 6,9782000 Households 7,5512010 Total Households 7,6072015 Total Households 7,4911990-2000 Annual Rate 0.79%2000-2010 Annual Rate 0.07%2010-2015 Annual Rate -0.31%2010 Average Household Size 2.46
The household count in this market area has changed from 7,551 in 2000 to 7,607 in the current year, a change of 0.07 percent annually.The five-year projection of households is 7,491, a change of -0.31 percent annually from the current year total. Average household size iscurrently 2.46, compared to 2.45 in the year 2000. The number of families in the current year is 5,004 in the market area.
September 18, 2013
Made with Esri Business Analyst©2010 Esri www.esri.com/ba 800-447-9778 Try it Now! Page 21 of 34
Data Note: Income is expressed in current dollarsSource: U.S. Bureau and Census, 2000 Census of Population and Housing, Esri forecast for 2010 and 2015. Esri converted 1990 Census data into 2000 geography.

Executive SummaryDR897_Affected_Counties Prepared By Business Analyst DesktopLogan
DR897_Affected_CountiesHouseholds by Income
Current median household income is $40,582 in the market area, compared to $54,442 for all U.S. households. Median household income isprojected to be $46,412 in five years. In 2000, median household income was $32,733.
Current average household income is $49,177 in this market area, compared to $70,173 for all U.S households. Average household incomeis projected to be $56,046 in five years. In 2000, average household income was $41,760, compared to $26,955 in 1990.
Current per capita income is $19,801 in the market area, compared to the U.S. per capita income of $26,739. The per capita income isprojected to be $22,559 in five years. In 2000, the per capita income was $16,721, compared to $10,898 in 1990. Median Household Income
2000 Median Household Income $32,7332010 Median Household Income $40,5822015 Median Household Income $46,4122000-2010 Annual Rate 2.12%2010-2015 Annual Rate 2.72%
Average Household Income
1990 Average Household Income $26,9552000 Average Household Income $41,7602010 Average Household Income $49,1772015 Average Household Income $56,0461990-2000 Annual Rate 4.47%2000-2010 Annual Rate 1.61%2010-2015 Annual Rate 2.65%
2010 Housing
1990 Total Housing Units 7,8242000 Total Housing Units 8,4242010 Total Housing Units 8,9922015 Total Housing Units 9,0071990 Owner Occupied Housing Units 4,6541990 Renter Occupied Housing Units 2,3241990 Vacant Housing Units 8462000 Owner Occupied Housing Units 5,2772000 Renter Occupied Housing Units 2,2742000 Vacant Housing Units 8732010 Owner Occupied Housing Units 5,2582010 Renter Occupied Housing Units 2,3492010 Vacant Housing Units 1,3852015 Owner Occupied Housing Units 5,1802015 Renter Occupied Housing Units 2,3112015 Vacant Housing Units 1,516
Currently, 58.5 percent of the 8,992 housing units in the market area are owner occupied; 26.1 percent, renter occupied; and 15.4 arevacant. In 2000, there were 8,424 housing units - 62.6 percent owner occupied, 27.0. percent renter occupied, and 10.4 percent vacant.The rate of change in housing units since 2000 is 0.64 percent. Median home value in the market area is $136,943, compared to a medianhome value of $157,913 for the U.S. In five years, median value is projected to change by 2.31 percent annually to $153,493. From 2000to the current year, median home value change by 4.62 percent annually.
Population1990 Population 21,9382000 Population 27,1702010 Population 28,4562015 Population 28,4241990-2000 Annual Rate 2.16%2000-2010 Annual Rate 0.45%2010-2015 Annual Rate -0.02%
September 18, 2013
Made with Esri Business Analyst©2010 Esri www.esri.com/ba 800-447-9778 Try it Now! Page 22 of 34
Data Note: Income is expressed in current dollarsSource: U.S. Bureau and Census, 2000 Census of Population and Housing, Esri forecast for 2010 and 2015. Esri converted 1990 Census data into 2000 geography.

Executive SummaryDR897_Affected_Counties Prepared By Business Analyst DesktopMorgan
DR897_Affected_Counties2010 Male Population 50.6%2010 Female Population 49.4%2010 Median Age 34.7
In the identified market area, the current year population is 28,456. In 2000, the Census count in the market area was 27,170. The rate ofchange since 2000 was 0.45 percent annually. The five-year projection for the population in the market area is 28,424, representing achange of -0.02 percent annually from 2010 to 2015. Currently, the population is 50.6 percent male and 49.4 percent female.
Population by EmploymentCurrently, 92.9 percent of the civilian labor force in the indentified market area is employed and 7.1 percent are unemployed. Incomparison, 89.2 percent of the U.S. civilian labor force is employed, and 10.8 percent are unemployed. In five years the rate ofemployment in the market area will be 94.4 percent of the civilian labor force, and unemployment will be 5.6 percent. The percentage of theU.S. civilian labor force that will be employed in five years is 91.2 percent, and 8.8 percent will be unemployed. In 2000, 62.4 percent of thepopulation aged 16 years or older in the market area participated in the labor force, and 0.0 percent were in the Armed Forces.
In the current year, the occupational distribution of the employed population is:47.9 percent in white collar jobs (compared to 61.6 percent of the U.S. employment)17.9 percent in service jobs (compared to 17.3 percent of U.S. employment)34.2 percent in blue collar jobs (compared to 21.1 percent of U.S. employment)
In 2000, 76.6 percent of the market area population drove alone to work, and 3.8 percent worked at home. The average travel time towork in 2000 was 18.5 minutes in the market area, compared to the U.S average of 25.5 minutes. Population by Education
In the current year, the educational attainment of the population aged 25 years or older in the market area was distributed as follows:25.6 percent had not earned a high school diploma (14.8 percent in the U.S)32.7 percent were high school graduates only (29.6 percent in the U.S.)7.7 percent had completed an Associate degree (7.7 percent in the U.S.)9.8 percent had a Bachelor's degree (17.7 percent in the U.S.)5.5 percent had earned a Master's/Professional/Doctorate Degree (10.4 percent in the U.S.)
Per Capita Income1990 Per Capita Income $10,928
2000 Per Capita Income $15,4922010 Per Capita Income $17,8532015 Per Capita Income $20,0591990-2000 Annual Rate 3.55%2000-2010 Annual Rate 1.39%2010-2015 Annual Rate 2.36%
Households
1990 Households 8,1392000 Households 9,5392010 Total Households 9,7992015 Total Households 9,7541990-2000 Annual Rate 1.60%2000-2010 Annual Rate 0.26%2010-2015 Annual Rate -0.09%2010 Average Household Size 2.84
The household count in this market area has changed from 9,539 in 2000 to 9,799 in the current year, a change of 0.26 percent annually.The five-year projection of households is 9,754, a change of -0.09 percent annually from the current year total. Average household size iscurrently 2.84, compared to 2.80 in the year 2000. The number of families in the current year is 7,042 in the market area.
September 18, 2013
Made with Esri Business Analyst©2010 Esri www.esri.com/ba 800-447-9778 Try it Now! Page 23 of 34
Data Note: Income is expressed in current dollarsSource: U.S. Bureau and Census, 2000 Census of Population and Housing, Esri forecast for 2010 and 2015. Esri converted 1990 Census data into 2000 geography.

Executive SummaryDR897_Affected_Counties Prepared By Business Analyst DesktopMorgan
DR897_Affected_CountiesHouseholds by Income
Current median household income is $43,075 in the market area, compared to $54,442 for all U.S. households. Median household income isprojected to be $49,322 in five years. In 2000, median household income was $34,524.
Current average household income is $50,588 in this market area, compared to $70,173 for all U.S households. Average household incomeis projected to be $57,018 in five years. In 2000, average household income was $43,328, compared to $29,524 in 1990.
Current per capita income is $17,853 in the market area, compared to the U.S. per capita income of $26,739. The per capita income isprojected to be $20,059 in five years. In 2000, the per capita income was $15,492, compared to $10,928 in 1990. Median Household Income
2000 Median Household Income $34,5242010 Median Household Income $43,0752015 Median Household Income $49,3222000-2010 Annual Rate 2.18%2010-2015 Annual Rate 2.75%
Average Household Income
1990 Average Household Income $29,5242000 Average Household Income $43,3282010 Average Household Income $50,5882015 Average Household Income $57,0181990-2000 Annual Rate 3.91%2000-2010 Annual Rate 1.52%2010-2015 Annual Rate 2.42%
2010 Housing
1990 Total Housing Units 9,2302000 Total Housing Units 10,4102010 Total Housing Units 11,2482015 Total Housing Units 11,5041990 Owner Occupied Housing Units 5,0891990 Renter Occupied Housing Units 3,0501990 Vacant Housing Units 1,0912000 Owner Occupied Housing Units 6,5252000 Renter Occupied Housing Units 3,0142000 Vacant Housing Units 8712010 Owner Occupied Housing Units 6,6412010 Renter Occupied Housing Units 3,1582010 Vacant Housing Units 1,4492015 Owner Occupied Housing Units 6,6132015 Renter Occupied Housing Units 3,1412015 Vacant Housing Units 1,750
Currently, 59.0 percent of the 11,248 housing units in the market area are owner occupied; 28.1 percent, renter occupied; and 12.9 arevacant. In 2000, there were 10,410 housing units - 62.7 percent owner occupied, 29.0. percent renter occupied, and 8.4 percent vacant.The rate of change in housing units since 2000 is 0.76 percent. Median home value in the market area is $146,770, compared to a medianhome value of $157,913 for the U.S. In five years, median value is projected to change by 2.53 percent annually to $166,278. From 2000to the current year, median home value change by 4.41 percent annually.
Population1990 Population 20,1852000 Population 20,3112010 Population 18,9132015 Population 18,2621990-2000 Annual Rate 0.06%2000-2010 Annual Rate -0.69%2010-2015 Annual Rate -0.70%
September 18, 2013
Made with Esri Business Analyst©2010 Esri www.esri.com/ba 800-447-9778 Try it Now! Page 24 of 34
Data Note: Income is expressed in current dollarsSource: U.S. Bureau and Census, 2000 Census of Population and Housing, Esri forecast for 2010 and 2015. Esri converted 1990 Census data into 2000 geography.

Executive SummaryDR897_Affected_Counties Prepared By Business Analyst DesktopOtero
DR897_Affected_Counties2010 Male Population 49.0%2010 Female Population 51.0%2010 Median Age 39.7
In the identified market area, the current year population is 18,913. In 2000, the Census count in the market area was 20,311. The rate ofchange since 2000 was -0.69 percent annually. The five-year projection for the population in the market area is 18,262, representing achange of -0.70 percent annually from 2010 to 2015. Currently, the population is 49.0 percent male and 51.0 percent female.
Population by EmploymentCurrently, 89.6 percent of the civilian labor force in the indentified market area is employed and 10.4 percent are unemployed. Incomparison, 89.2 percent of the U.S. civilian labor force is employed, and 10.8 percent are unemployed. In five years the rate ofemployment in the market area will be 91.7 percent of the civilian labor force, and unemployment will be 8.3 percent. The percentage of theU.S. civilian labor force that will be employed in five years is 91.2 percent, and 8.8 percent will be unemployed. In 2000, 58.4 percent of thepopulation aged 16 years or older in the market area participated in the labor force, and 0.0 percent were in the Armed Forces.
In the current year, the occupational distribution of the employed population is:57.9 percent in white collar jobs (compared to 61.6 percent of the U.S. employment)20.3 percent in service jobs (compared to 17.3 percent of U.S. employment)21.8 percent in blue collar jobs (compared to 21.1 percent of U.S. employment)
In 2000, 74.5 percent of the market area population drove alone to work, and 4.8 percent worked at home. The average travel time towork in 2000 was 18.0 minutes in the market area, compared to the U.S average of 25.5 minutes. Population by Education
In the current year, the educational attainment of the population aged 25 years or older in the market area was distributed as follows:21.2 percent had not earned a high school diploma (14.8 percent in the U.S)32.3 percent were high school graduates only (29.6 percent in the U.S.)8.9 percent had completed an Associate degree (7.7 percent in the U.S.)10.9 percent had a Bachelor's degree (17.7 percent in the U.S.)6.6 percent had earned a Master's/Professional/Doctorate Degree (10.4 percent in the U.S.)
Per Capita Income1990 Per Capita Income $9,573
2000 Per Capita Income $15,1132010 Per Capita Income $18,2822015 Per Capita Income $20,8201990-2000 Annual Rate 4.67%2000-2010 Annual Rate 1.87%2010-2015 Annual Rate 2.63%
Households
1990 Households 7,5932000 Households 7,9202010 Total Households 7,4202015 Total Households 7,1721990-2000 Annual Rate 0.42%2000-2010 Annual Rate -0.63%2010-2015 Annual Rate -0.68%2010 Average Household Size 2.47
The household count in this market area has changed from 7,920 in 2000 to 7,420 in the current year, a change of -0.63 percent annually.The five-year projection of households is 7,172, a change of -0.68 percent annually from the current year total. Average household size iscurrently 2.47, compared to 2.49 in the year 2000. The number of families in the current year is 5,032 in the market area.
September 18, 2013
Made with Esri Business Analyst©2010 Esri www.esri.com/ba 800-447-9778 Try it Now! Page 25 of 34
Data Note: Income is expressed in current dollarsSource: U.S. Bureau and Census, 2000 Census of Population and Housing, Esri forecast for 2010 and 2015. Esri converted 1990 Census data into 2000 geography.

Executive SummaryDR897_Affected_Counties Prepared By Business Analyst DesktopOtero
DR897_Affected_CountiesHouseholds by Income
Current median household income is $36,587 in the market area, compared to $54,442 for all U.S. households. Median household income isprojected to be $42,026 in five years. In 2000, median household income was $29,649.
Current average household income is $45,197 in this market area, compared to $70,173 for all U.S households. Average household incomeis projected to be $51,365 in five years. In 2000, average household income was $38,040, compared to $24,819 in 1990.
Current per capita income is $18,282 in the market area, compared to the U.S. per capita income of $26,739. The per capita income isprojected to be $20,820 in five years. In 2000, the per capita income was $15,113, compared to $9,573 in 1990. Median Household Income
2000 Median Household Income $29,6492010 Median Household Income $36,5872015 Median Household Income $42,0262000-2010 Annual Rate 2.07%2010-2015 Annual Rate 2.81%
Average Household Income
1990 Average Household Income $24,8192000 Average Household Income $38,0402010 Average Household Income $45,1972015 Average Household Income $51,3651990-2000 Annual Rate 4.36%2000-2010 Annual Rate 1.70%2010-2015 Annual Rate 2.59%
2010 Housing
1990 Total Housing Units 8,7392000 Total Housing Units 8,8132010 Total Housing Units 8,8962015 Total Housing Units 8,8961990 Owner Occupied Housing Units 5,0801990 Renter Occupied Housing Units 2,5131990 Vacant Housing Units 1,1462000 Owner Occupied Housing Units 5,4712000 Renter Occupied Housing Units 2,4492000 Vacant Housing Units 8932010 Owner Occupied Housing Units 5,0632010 Renter Occupied Housing Units 2,3572010 Vacant Housing Units 1,4762015 Owner Occupied Housing Units 4,8902015 Renter Occupied Housing Units 2,2822015 Vacant Housing Units 1,724
Currently, 56.9 percent of the 8,896 housing units in the market area are owner occupied; 26.5 percent, renter occupied; and 16.6 arevacant. In 2000, there were 8,813 housing units - 62.1 percent owner occupied, 27.8. percent renter occupied, and 10.1 percent vacant.The rate of change in housing units since 2000 is 0.09 percent. Median home value in the market area is $88,914, compared to a medianhome value of $157,913 for the U.S. In five years, median value is projected to change by 1.95 percent annually to $97,934. From 2000 tothe current year, median home value change by 2.69 percent annually.
Population1990 Population 123,0502000 Population 141,4702010 Population 160,6302015 Population 169,7381990-2000 Annual Rate 1.40%2000-2010 Annual Rate 1.25%2010-2015 Annual Rate 1.11%
September 18, 2013
Made with Esri Business Analyst©2010 Esri www.esri.com/ba 800-447-9778 Try it Now! Page 26 of 34
Data Note: Income is expressed in current dollarsSource: U.S. Bureau and Census, 2000 Census of Population and Housing, Esri forecast for 2010 and 2015. Esri converted 1990 Census data into 2000 geography.

Executive SummaryDR897_Affected_Counties Prepared By Business Analyst DesktopPueblo
DR897_Affected_Counties2010 Male Population 49.0%2010 Female Population 51.0%2010 Median Age 38.0
In the identified market area, the current year population is 160,630. In 2000, the Census count in the market area was 141,470. The rateof change since 2000 was 1.25 percent annually. The five-year projection for the population in the market area is 169,738, representing achange of 1.11 percent annually from 2010 to 2015. Currently, the population is 49.0 percent male and 51.0 percent female.
Population by EmploymentCurrently, 89.2 percent of the civilian labor force in the indentified market area is employed and 10.8 percent are unemployed. Incomparison, 89.2 percent of the U.S. civilian labor force is employed, and 10.8 percent are unemployed. In five years the rate ofemployment in the market area will be 91.4 percent of the civilian labor force, and unemployment will be 8.6 percent. The percentage of theU.S. civilian labor force that will be employed in five years is 91.2 percent, and 8.8 percent will be unemployed. In 2000, 58.3 percent of thepopulation aged 16 years or older in the market area participated in the labor force, and 0.1 percent were in the Armed Forces.
In the current year, the occupational distribution of the employed population is:57.3 percent in white collar jobs (compared to 61.6 percent of the U.S. employment)20.9 percent in service jobs (compared to 17.3 percent of U.S. employment)21.7 percent in blue collar jobs (compared to 21.1 percent of U.S. employment)
In 2000, 79.4 percent of the market area population drove alone to work, and 3.3 percent worked at home. The average travel time towork in 2000 was 20.7 minutes in the market area, compared to the U.S average of 25.5 minutes. Population by Education
In the current year, the educational attainment of the population aged 25 years or older in the market area was distributed as follows:15.7 percent had not earned a high school diploma (14.8 percent in the U.S)32.4 percent were high school graduates only (29.6 percent in the U.S.)9.3 percent had completed an Associate degree (7.7 percent in the U.S.)12.9 percent had a Bachelor's degree (17.7 percent in the U.S.)7.9 percent had earned a Master's/Professional/Doctorate Degree (10.4 percent in the U.S.)
Per Capita Income1990 Per Capita Income $10,347
2000 Per Capita Income $17,1632010 Per Capita Income $21,0442015 Per Capita Income $24,1381990-2000 Annual Rate 5.19%2000-2010 Annual Rate 2.01%2010-2015 Annual Rate 2.78%
Households
1990 Households 47,0562000 Households 54,5782010 Total Households 62,1502015 Total Households 65,7651990-2000 Annual Rate 1.49%2000-2010 Annual Rate 1.28%2010-2015 Annual Rate 1.14%2010 Average Household Size 2.52
The household count in this market area has changed from 54,578 in 2000 to 62,150 in the current year, a change of 1.28 percent annually.The five-year projection of households is 65,765, a change of 1.14 percent annually from the current year total. Average household size iscurrently 2.52, compared to 2.52 in the year 2000. The number of families in the current year is 41,710 in the market area.
September 18, 2013
Made with Esri Business Analyst©2010 Esri www.esri.com/ba 800-447-9778 Try it Now! Page 27 of 34
Data Note: Income is expressed in current dollarsSource: U.S. Bureau and Census, 2000 Census of Population and Housing, Esri forecast for 2010 and 2015. Esri converted 1990 Census data into 2000 geography.

Executive SummaryDR897_Affected_Counties Prepared By Business Analyst DesktopPueblo
DR897_Affected_CountiesHouseholds by Income
Current median household income is $43,063 in the market area, compared to $54,442 for all U.S. households. Median household income isprojected to be $49,607 in five years. In 2000, median household income was $32,930.
Current average household income is $53,152 in this market area, compared to $70,173 for all U.S households. Average household incomeis projected to be $60,970 in five years. In 2000, average household income was $43,719, compared to $26,651 in 1990.
Current per capita income is $21,044 in the market area, compared to the U.S. per capita income of $26,739. The per capita income isprojected to be $24,138 in five years. In 2000, the per capita income was $17,163, compared to $10,347 in 1990. Median Household Income
2000 Median Household Income $32,9302010 Median Household Income $43,0632015 Median Household Income $49,6072000-2010 Annual Rate 2.65%2010-2015 Annual Rate 2.87%
Average Household Income
1990 Average Household Income $26,6512000 Average Household Income $43,7192010 Average Household Income $53,1522015 Average Household Income $60,9701990-2000 Annual Rate 5.07%2000-2010 Annual Rate 1.92%2010-2015 Annual Rate 2.78%
2010 Housing
1990 Total Housing Units 50,8712000 Total Housing Units 58,9252010 Total Housing Units 70,3322015 Total Housing Units 75,8721990 Owner Occupied Housing Units 31,9461990 Renter Occupied Housing Units 15,1111990 Vacant Housing Units 3,8152000 Owner Occupied Housing Units 38,4482000 Renter Occupied Housing Units 16,1302000 Vacant Housing Units 4,3472010 Owner Occupied Housing Units 43,0762010 Renter Occupied Housing Units 19,0742010 Vacant Housing Units 8,1822015 Owner Occupied Housing Units 45,6872015 Renter Occupied Housing Units 20,0782015 Vacant Housing Units 10,107
Currently, 61.2 percent of the 70,332 housing units in the market area are owner occupied; 27.1 percent, renter occupied; and 11.6 arevacant. In 2000, there were 58,925 housing units - 65.2 percent owner occupied, 27.4. percent renter occupied, and 7.4 percent vacant.The rate of change in housing units since 2000 is 1.74 percent. Median home value in the market area is $129,872, compared to a medianhome value of $157,913 for the U.S. In five years, median value is projected to change by 3.21 percent annually to $152,075. From 2000to the current year, median home value change by 3.30 percent annually.
Population1990 Population 2,6902000 Population 2,7472010 Population 2,4572015 Population 2,3261990-2000 Annual Rate 0.21%2000-2010 Annual Rate -1.08%2010-2015 Annual Rate -1.09%
September 18, 2013
Made with Esri Business Analyst©2010 Esri www.esri.com/ba 800-447-9778 Try it Now! Page 28 of 34
Data Note: Income is expressed in current dollarsSource: U.S. Bureau and Census, 2000 Census of Population and Housing, Esri forecast for 2010 and 2015. Esri converted 1990 Census data into 2000 geography.

Executive SummaryDR897_Affected_Counties Prepared By Business Analyst DesktopSedgwick
DR897_Affected_Counties2010 Male Population 50.2%2010 Female Population 49.8%2010 Median Age 45.3
In the identified market area, the current year population is 2,457. In 2000, the Census count in the market area was 2,747. The rate ofchange since 2000 was -1.08 percent annually. The five-year projection for the population in the market area is 2,326, representing achange of -1.09 percent annually from 2010 to 2015. Currently, the population is 50.2 percent male and 49.8 percent female.
Population by EmploymentCurrently, 97.6 percent of the civilian labor force in the indentified market area is employed and 2.4 percent are unemployed. Incomparison, 89.2 percent of the U.S. civilian labor force is employed, and 10.8 percent are unemployed. In five years the rate ofemployment in the market area will be 98.1 percent of the civilian labor force, and unemployment will be 1.9 percent. The percentage of theU.S. civilian labor force that will be employed in five years is 91.2 percent, and 8.8 percent will be unemployed. In 2000, 60.9 percent of thepopulation aged 16 years or older in the market area participated in the labor force, and 0.0 percent were in the Armed Forces.
In the current year, the occupational distribution of the employed population is:54.8 percent in white collar jobs (compared to 61.6 percent of the U.S. employment)17.4 percent in service jobs (compared to 17.3 percent of U.S. employment)27.8 percent in blue collar jobs (compared to 21.1 percent of U.S. employment)
In 2000, 68.0 percent of the market area population drove alone to work, and 10.4 percent worked at home. The average travel time towork in 2000 was 15.7 minutes in the market area, compared to the U.S average of 25.5 minutes. Population by Education
In the current year, the educational attainment of the population aged 25 years or older in the market area was distributed as follows:18.3 percent had not earned a high school diploma (14.8 percent in the U.S)37.3 percent were high school graduates only (29.6 percent in the U.S.)7.4 percent had completed an Associate degree (7.7 percent in the U.S.)10.5 percent had a Bachelor's degree (17.7 percent in the U.S.)4.6 percent had earned a Master's/Professional/Doctorate Degree (10.4 percent in the U.S.)
Per Capita Income1990 Per Capita Income $9,901
2000 Per Capita Income $16,1242010 Per Capita Income $18,7652015 Per Capita Income $21,8951990-2000 Annual Rate 5.00%2000-2010 Annual Rate 1.49%2010-2015 Annual Rate 3.13%
Households
1990 Households 1,1412000 Households 1,1652010 Total Households 1,0402015 Total Households 9841990-2000 Annual Rate 0.21%2000-2010 Annual Rate -1.10%2010-2015 Annual Rate -1.10%2010 Average Household Size 2.31
The household count in this market area has changed from 1,165 in 2000 to 1,040 in the current year, a change of -1.10 percent annually.The five-year projection of households is 984, a change of -1.10 percent annually from the current year total. Average household size iscurrently 2.31, compared to 2.31 in the year 2000. The number of families in the current year is 703 in the market area.
September 18, 2013
Made with Esri Business Analyst©2010 Esri www.esri.com/ba 800-447-9778 Try it Now! Page 29 of 34
Data Note: Income is expressed in current dollarsSource: U.S. Bureau and Census, 2000 Census of Population and Housing, Esri forecast for 2010 and 2015. Esri converted 1990 Census data into 2000 geography.

Executive SummaryDR897_Affected_Counties Prepared By Business Analyst DesktopSedgwick
DR897_Affected_CountiesHouseholds by Income
Current median household income is $34,468 in the market area, compared to $54,442 for all U.S. households. Median household income isprojected to be $38,428 in five years. In 2000, median household income was $28,270.
Current average household income is $43,330 in this market area, compared to $70,173 for all U.S households. Average household incomeis projected to be $50,551 in five years. In 2000, average household income was $37,212, compared to $23,113 in 1990.
Current per capita income is $18,765 in the market area, compared to the U.S. per capita income of $26,739. The per capita income isprojected to be $21,895 in five years. In 2000, the per capita income was $16,124, compared to $9,901 in 1990. Median Household Income
2000 Median Household Income $28,2702010 Median Household Income $34,4682015 Median Household Income $38,4282000-2010 Annual Rate 1.95%2010-2015 Annual Rate 2.20%
Average Household Income
1990 Average Household Income $23,1132000 Average Household Income $37,2122010 Average Household Income $43,3302015 Average Household Income $50,5511990-2000 Annual Rate 4.88%2000-2010 Annual Rate 1.50%2010-2015 Annual Rate 3.13%
2010 Housing
1990 Total Housing Units 1,4142000 Total Housing Units 1,3872010 Total Housing Units 1,3872015 Total Housing Units 1,3871990 Owner Occupied Housing Units 8111990 Renter Occupied Housing Units 3301990 Vacant Housing Units 2732000 Owner Occupied Housing Units 8512000 Renter Occupied Housing Units 3142000 Vacant Housing Units 2222010 Owner Occupied Housing Units 7522010 Renter Occupied Housing Units 2882010 Vacant Housing Units 3472015 Owner Occupied Housing Units 7112015 Renter Occupied Housing Units 2732015 Vacant Housing Units 403
Currently, 54.2 percent of the 1,387 housing units in the market area are owner occupied; 20.8 percent, renter occupied; and 25.0 arevacant. In 2000, there were 1,387 housing units - 61.4 percent owner occupied, 22.6. percent renter occupied, and 16.0 percent vacant.The rate of change in housing units since 2000 is 0.00 percent. Median home value in the market area is $76,667, compared to a medianhome value of $157,913 for the U.S. In five years, median value is projected to change by 1.69 percent annually to $83,372. From 2000 tothe current year, median home value change by 2.43 percent annually.
Population1990 Population 4,8122000 Population 4,9262010 Population 4,5122015 Population 4,2411990-2000 Annual Rate 0.23%2000-2010 Annual Rate -0.85%2010-2015 Annual Rate -1.23%
September 18, 2013
Made with Esri Business Analyst©2010 Esri www.esri.com/ba 800-447-9778 Try it Now! Page 30 of 34
Data Note: Income is expressed in current dollarsSource: U.S. Bureau and Census, 2000 Census of Population and Housing, Esri forecast for 2010 and 2015. Esri converted 1990 Census data into 2000 geography.

Executive SummaryDR897_Affected_Counties Prepared By Business Analyst DesktopWashington
DR897_Affected_Counties2010 Male Population 53.0%2010 Female Population 47.0%2010 Median Age 42.7
In the identified market area, the current year population is 4,512. In 2000, the Census count in the market area was 4,926. The rate ofchange since 2000 was -0.85 percent annually. The five-year projection for the population in the market area is 4,241, representing achange of -1.23 percent annually from 2010 to 2015. Currently, the population is 53.0 percent male and 47.0 percent female.
Population by EmploymentCurrently, 96.7 percent of the civilian labor force in the indentified market area is employed and 3.3 percent are unemployed. Incomparison, 89.2 percent of the U.S. civilian labor force is employed, and 10.8 percent are unemployed. In five years the rate ofemployment in the market area will be 97.4 percent of the civilian labor force, and unemployment will be 2.6 percent. The percentage of theU.S. civilian labor force that will be employed in five years is 91.2 percent, and 8.8 percent will be unemployed. In 2000, 62.8 percent of thepopulation aged 16 years or older in the market area participated in the labor force, and 0.0 percent were in the Armed Forces.
In the current year, the occupational distribution of the employed population is:59.4 percent in white collar jobs (compared to 61.6 percent of the U.S. employment)13.2 percent in service jobs (compared to 17.3 percent of U.S. employment)27.4 percent in blue collar jobs (compared to 21.1 percent of U.S. employment)
In 2000, 63.1 percent of the market area population drove alone to work, and 15.4 percent worked at home. The average travel time towork in 2000 was 21.0 minutes in the market area, compared to the U.S average of 25.5 minutes. Population by Education
In the current year, the educational attainment of the population aged 25 years or older in the market area was distributed as follows:15.9 percent had not earned a high school diploma (14.8 percent in the U.S)35.3 percent were high school graduates only (29.6 percent in the U.S.)8.7 percent had completed an Associate degree (7.7 percent in the U.S.)11.7 percent had a Bachelor's degree (17.7 percent in the U.S.)4.4 percent had earned a Master's/Professional/Doctorate Degree (10.4 percent in the U.S.)
Per Capita Income1990 Per Capita Income $10,473
2000 Per Capita Income $17,7872010 Per Capita Income $19,6732015 Per Capita Income $22,5031990-2000 Annual Rate 5.44%2000-2010 Annual Rate 0.99%2010-2015 Annual Rate 2.72%
Households
1990 Households 1,9152000 Households 1,9892010 Total Households 1,7512015 Total Households 1,6421990-2000 Annual Rate 0.38%2000-2010 Annual Rate -1.24%2010-2015 Annual Rate -1.28%2010 Average Household Size 2.45
The household count in this market area has changed from 1,989 in 2000 to 1,751 in the current year, a change of -1.24 percent annually.The five-year projection of households is 1,642, a change of -1.28 percent annually from the current year total. Average household size iscurrently 2.45, compared to 2.46 in the year 2000. The number of families in the current year is 1,218 in the market area.
September 18, 2013
Made with Esri Business Analyst©2010 Esri www.esri.com/ba 800-447-9778 Try it Now! Page 31 of 34
Data Note: Income is expressed in current dollarsSource: U.S. Bureau and Census, 2000 Census of Population and Housing, Esri forecast for 2010 and 2015. Esri converted 1990 Census data into 2000 geography.

Executive SummaryDR897_Affected_Counties Prepared By Business Analyst DesktopWashington
DR897_Affected_CountiesHouseholds by Income
Current median household income is $38,061 in the market area, compared to $54,442 for all U.S. households. Median household income isprojected to be $41,739 in five years. In 2000, median household income was $32,503.
Current average household income is $48,373 in this market area, compared to $70,173 for all U.S households. Average household incomeis projected to be $55,306 in five years. In 2000, average household income was $44,412, compared to $25,701 in 1990.
Current per capita income is $19,673 in the market area, compared to the U.S. per capita income of $26,739. The per capita income isprojected to be $22,503 in five years. In 2000, the per capita income was $17,787, compared to $10,473 in 1990. Median Household Income
2000 Median Household Income $32,5032010 Median Household Income $38,0612015 Median Household Income $41,7392000-2010 Annual Rate 1.55%2010-2015 Annual Rate 1.86%
Average Household Income
1990 Average Household Income $25,7012000 Average Household Income $44,4122010 Average Household Income $48,3732015 Average Household Income $55,3061990-2000 Annual Rate 5.62%2000-2010 Annual Rate 0.84%2010-2015 Annual Rate 2.71%
2010 Housing
1990 Total Housing Units 2,3072000 Total Housing Units 2,3072010 Total Housing Units 2,4102015 Total Housing Units 2,4171990 Owner Occupied Housing Units 1,3831990 Renter Occupied Housing Units 5321990 Vacant Housing Units 3922000 Owner Occupied Housing Units 1,4642000 Renter Occupied Housing Units 5252000 Vacant Housing Units 3182010 Owner Occupied Housing Units 1,2802010 Renter Occupied Housing Units 4712010 Vacant Housing Units 6592015 Owner Occupied Housing Units 1,2012015 Renter Occupied Housing Units 4412015 Vacant Housing Units 775
Currently, 53.1 percent of the 2,410 housing units in the market area are owner occupied; 19.5 percent, renter occupied; and 27.3 arevacant. In 2000, there were 2,307 housing units - 63.5 percent owner occupied, 22.8. percent renter occupied, and 13.8 percent vacant.The rate of change in housing units since 2000 is 0.43 percent. Median home value in the market area is $99,737, compared to a medianhome value of $157,913 for the U.S. In five years, median value is projected to change by 2.08 percent annually to $110,531. From 2000to the current year, median home value change by 2.58 percent annually.
Population1990 Population 131,8182000 Population 180,7932010 Population 262,9372015 Population 299,6541990-2000 Annual Rate 3.21%2000-2010 Annual Rate 3.72%2010-2015 Annual Rate 2.65%
September 18, 2013
Made with Esri Business Analyst©2010 Esri www.esri.com/ba 800-447-9778 Try it Now! Page 32 of 34
Data Note: Income is expressed in current dollarsSource: U.S. Bureau and Census, 2000 Census of Population and Housing, Esri forecast for 2010 and 2015. Esri converted 1990 Census data into 2000 geography.

Executive SummaryDR897_Affected_Counties Prepared By Business Analyst DesktopWeld
DR897_Affected_Counties2010 Male Population 49.9%2010 Female Population 50.1%2010 Median Age 33.5
In the identified market area, the current year population is 262,937. In 2000, the Census count in the market area was 180,793. The rateof change since 2000 was 3.72 percent annually. The five-year projection for the population in the market area is 299,654, representing achange of 2.65 percent annually from 2010 to 2015. Currently, the population is 49.9 percent male and 50.1 percent female.
Population by EmploymentCurrently, 88.9 percent of the civilian labor force in the indentified market area is employed and 11.1 percent are unemployed. Incomparison, 89.2 percent of the U.S. civilian labor force is employed, and 10.8 percent are unemployed. In five years the rate ofemployment in the market area will be 91.1 percent of the civilian labor force, and unemployment will be 8.9 percent. The percentage of theU.S. civilian labor force that will be employed in five years is 91.2 percent, and 8.8 percent will be unemployed. In 2000, 68.6 percent of thepopulation aged 16 years or older in the market area participated in the labor force, and 0.1 percent were in the Armed Forces.
In the current year, the occupational distribution of the employed population is:56.0 percent in white collar jobs (compared to 61.6 percent of the U.S. employment)17.4 percent in service jobs (compared to 17.3 percent of U.S. employment)26.6 percent in blue collar jobs (compared to 21.1 percent of U.S. employment)
In 2000, 78.5 percent of the market area population drove alone to work, and 4.2 percent worked at home. The average travel time towork in 2000 was 23.7 minutes in the market area, compared to the U.S average of 25.5 minutes. Population by Education
In the current year, the educational attainment of the population aged 25 years or older in the market area was distributed as follows:16.1 percent had not earned a high school diploma (14.8 percent in the U.S)27.5 percent were high school graduates only (29.6 percent in the U.S.)9.6 percent had completed an Associate degree (7.7 percent in the U.S.)17.8 percent had a Bachelor's degree (17.7 percent in the U.S.)8.2 percent had earned a Master's/Professional/Doctorate Degree (10.4 percent in the U.S.)
Per Capita Income1990 Per Capita Income $11,350
2000 Per Capita Income $18,9492010 Per Capita Income $22,4632015 Per Capita Income $25,9991990-2000 Annual Rate 5.26%2000-2010 Annual Rate 1.67%2010-2015 Annual Rate 2.97%
Households
1990 Households 47,4692000 Households 63,1952010 Total Households 91,5842015 Total Households 104,2991990-2000 Annual Rate 2.90%2000-2010 Annual Rate 3.69%2010-2015 Annual Rate 2.63%2010 Average Household Size 2.82
The household count in this market area has changed from 63,195 in 2000 to 91,584 in the current year, a change of 3.69 percent annually.The five-year projection of households is 104,299, a change of 2.63 percent annually from the current year total. Average household size iscurrently 2.82, compared to 2.78 in the year 2000. The number of families in the current year is 64,401 in the market area.
September 18, 2013
Made with Esri Business Analyst©2010 Esri www.esri.com/ba 800-447-9778 Try it Now! Page 33 of 34
Data Note: Income is expressed in current dollarsSource: U.S. Bureau and Census, 2000 Census of Population and Housing, Esri forecast for 2010 and 2015. Esri converted 1990 Census data into 2000 geography.

Executive SummaryDR897_Affected_Counties Prepared By Business Analyst DesktopWeld
DR897_Affected_CountiesHouseholds by Income
Current median household income is $54,185 in the market area, compared to $54,442 for all U.S. households. Median household income isprojected to be $62,311 in five years. In 2000, median household income was $42,383.
Current average household income is $63,483 in this market area, compared to $70,173 for all U.S households. Average household incomeis projected to be $73,689 in five years. In 2000, average household income was $53,515, compared to $31,105 in 1990.
Current per capita income is $22,463 in the market area, compared to the U.S. per capita income of $26,739. The per capita income isprojected to be $25,999 in five years. In 2000, the per capita income was $18,949, compared to $11,350 in 1990. Median Household Income
2000 Median Household Income $42,3832010 Median Household Income $54,1852015 Median Household Income $62,3112000-2010 Annual Rate 2.43%2010-2015 Annual Rate 2.83%
Average Household Income
1990 Average Household Income $31,1052000 Average Household Income $53,5152010 Average Household Income $63,4832015 Average Household Income $73,6891990-2000 Annual Rate 5.58%2000-2010 Annual Rate 1.68%2010-2015 Annual Rate 3.03%
2010 Housing
1990 Total Housing Units 51,1372000 Total Housing Units 66,1402010 Total Housing Units 100,2412015 Total Housing Units 114,0491990 Owner Occupied Housing Units 29,0391990 Renter Occupied Housing Units 18,4301990 Vacant Housing Units 3,6682000 Owner Occupied Housing Units 43,3692000 Renter Occupied Housing Units 19,8272000 Vacant Housing Units 2,9452010 Owner Occupied Housing Units 62,2732010 Renter Occupied Housing Units 29,3112010 Vacant Housing Units 8,6572015 Owner Occupied Housing Units 71,2952015 Renter Occupied Housing Units 33,0042015 Vacant Housing Units 9,750
Currently, 62.1 percent of the 100,241 housing units in the market area are owner occupied; 29.2 percent, renter occupied; and 8.6 arevacant. In 2000, there were 66,140 housing units - 65.6 percent owner occupied, 30.0. percent renter occupied, and 4.5 percent vacant.The rate of change in housing units since 2000 is 4.14 percent. Median home value in the market area is $175,594, compared to a medianhome value of $157,913 for the U.S. In five years, median value is projected to change by 2.38 percent annually to $197,505. From 2000to the current year, median home value change by 2.49 percent annually.
September 18, 2013
Made with Esri Business Analyst©2010 Esri www.esri.com/ba 800-447-9778 Try it Now! Page 34 of 34
Data Note: Income is expressed in current dollarsSource: U.S. Bureau and Census, 2000 Census of Population and Housing, Esri forecast for 2010 and 2015. Esri converted 1990 Census data into 2000 geography.


![Food security and nutrition: building a global narrative ... · EXECUTIVE SUMMARY EXECUTIVE SUMMARY EXECUTIVE SUMMARY EXECUTIVE SUMMAR Y [ 2 ] This document contains the Summary and](https://static.fdocuments.net/doc/165x107/5ff5433612d22125fb06e6b5/food-security-and-nutrition-building-a-global-narrative-executive-summary-executive.jpg)