
EXECUTIVE SUMMARY · 2019-10-17 · EXECUTIVE SUMMARY NDMIP DETAILED BUSINESS CASE 18 1 EXECUTIVE...
22
EXECUTIVE SUMMARY NDMIP DETAILED BUSINESS CASE 18 1 EXECUTIVE SUMMARY This Executive Summary presents an overview of the Nullinga Dam and Mareeba Dimbulah Water Supply Scheme Improvements Project (NDMIP) Detailed Business Case (DBC). It summarises the: ▪ NDMIP background ▪ service needs and opportunities ▪ anticipated benefits ▪ scope of the NDMIP options ▪ analysis and findings ▪ recommendations. This DBC has been prepared by Building Queensland, on behalf of Sunwater, the nominated proponent for the NDMIP. This study is supported by funding from the Commonwealth Government of Australia (Commonwealth Government) National Water Infrastructure Development Fund, an initiative of the Northern Australia and Agricultural Competitiveness White Papers. 1.1 Background The study area for the NDMIP is defined as the existing Barron Water Plan Area and covers approximately 5,200 km 2 (see Figure 1-1). The area includes the catchment of the Barron River and the upper reaches of the Mitchell and Walsh Rivers. The proposed Nullinga Dam site is located approximately 55 kilometres south- west of Cairns and 24 kilometres south-south-west of Mareeba, situated within the Mareeba Shire Council (MSC) Local Government Area (LGA). Figure 1-1 Study Area (existing Barron Water Plan Area) The Mareeba Dimbulah Water Supply Scheme (MDWSS) is the major water resource development in the study area, with Tinaroo Falls Dam the main water storage supplying the scheme. The MDWSS involves inter-basin transfers between the Barron and Walsh rivers. Parts of the Walsh and Mitchell river catchments were included in the Barron Water Plan to enable the management of all supplemented water from the water supply scheme under a single water resource plan. Other important storages in the plan area include the Copperlode Falls Dam on Freshwater Creek and the Kuranda Weir on the Barron River. Nullinga Dam was first proposed in the 1950s following the original
Transcript of EXECUTIVE SUMMARY · 2019-10-17 · EXECUTIVE SUMMARY NDMIP DETAILED BUSINESS CASE 18 1 EXECUTIVE...

EXECUTIVE SUMMARY
NDMIP DETAILED BUSINESS CASE 18
1 EXECUTIVE SUMMARY
This Executive Summary presents an overview of the Nullinga Dam and Mareeba Dimbulah Water Supply
Scheme Improvements Project (NDMIP) Detailed Business Case (DBC). It summarises the:
▪ NDMIP background
▪ service needs and opportunities
▪ anticipated benefits
▪ scope of the NDMIP options
▪ analysis and findings
▪ recommendations.
This DBC has been prepared by Building Queensland, on behalf of Sunwater, the nominated proponent for the NDMIP. This study is supported by funding from the Commonwealth Government of Australia (Commonwealth Government) National Water Infrastructure Development Fund, an initiative of the Northern Australia and Agricultural Competitiveness White Papers.
1.1 Background
The study area for the NDMIP is defined as the existing Barron Water Plan Area and covers approximately
5,200 km2 (see Figure 1-1). The area includes the catchment of the Barron River and the upper reaches of
the Mitchell and Walsh Rivers. The proposed Nullinga Dam site is located approximately 55 kilometres south-
west of Cairns and 24 kilometres south-south-west of Mareeba, situated within the Mareeba Shire Council
(MSC) Local Government Area (LGA).
Figure 1-1 Study Area (existing Barron Water Plan Area)
The Mareeba Dimbulah Water
Supply Scheme (MDWSS) is the
major water resource development
in the study area, with Tinaroo Falls
Dam the main water storage
supplying the scheme. The MDWSS
involves inter-basin transfers
between the Barron and Walsh
rivers. Parts of the Walsh and
Mitchell river catchments were
included in the Barron Water Plan
to enable the management of all
supplemented water from the
water supply scheme under a single
water resource plan. Other
important storages in the plan area
include the Copperlode Falls Dam
on Freshwater Creek and the
Kuranda Weir on the Barron River.
Nullinga Dam was first proposed in
the 1950s following the original

EXECUTIVE SUMMARY
NDMIP DETAILED BUSINESS CASE 19
investigations for the development of the Mareeba Dimbulah Irrigation Area (MDIA), which was to support
tobacco production. However, a decision was made to build Tinaroo Falls Dam, in preference to Nullinga
Dam, as it could supply more water to a greater area with a better yield and hydrologic efficiency. In addition
to the Nullinga Dam site being in a lower rainfall area with a corresponding lower yield, the Nullinga Dam site
suffers from distribution constraints for irrigation purposes and would require additional delivery
infrastructure to address supply limitations.
Nullinga Dam was revisited under various proposals over the last 70 years since. Notable historical reports
that considered Nullinga Dam are identified below.
Figure 1-2 Past reports relevant for a potential Nullinga Dam
In 2015, with the completion of the Cairns Regional Council (CRC) Water Security Strategy and Queensland
Treasury Corporation’s review, the Queensland Government made a commitment to assess the proposed
Nullinga Dam. Following the Commonwealth Government’s commitment of $5 million from the NWIDF for a
‘detailed examination of the economic feasibility of Nullinga Dam’ in the Developing Northern Australia
White Paper, Building Queensland was tasked with the development of a business case.
In April 2017, Building Queensland developed and submitted
the Nullinga Dam and Other Options Preliminary Business Case
(PBC) to the Queensland Government. The PBC confirmed that
the existing MDWSS would be unable to support additional
water allocations for current or new customers without one, or
all of the following modifications:
▪ changes to current MDWSS rules/operations
▪ improvement works for existing water distribution assets
▪ investment in new water storage (Nullinga Dam).
The PBC found that these initiatives would potentially stimulate
irrigated agriculture in the region, supporting an opportunity for
new or expanded agricultural activities. However, the demand
assessment undertaken for the PBC did not identify a
compelling agricultural demand at that time and, similarly, did
not identify any urgent requirement for additional urban water
supply.
The PBC concluded that a DBC should not be progressed until adequate long-term demand for water could
be demonstrated.
Mareeba-Dimbulah Irrigation Project Report
•1950
•Focused on tobacco production in the MDIA considered the potential for a Nullinga Dam
Concept Investigation Report
•2008
•Sunwater
•Considered options for 30,000 ML/a of HP water supply for Cairns
Far North Queensland Regional Water Supply Strategy
•2010
•the (then) DERM
•Identified potential for Nullinga Dam to be part of the long-term water storage infrastructure for both Cairns and agricultural use
Water Security Strategy
•2015
•Cairns Regional Council
•Identified a regional dam, "nominally Nullinga Dam", as a long-term option for Cairns urban water supply
High Level Review of proposed Nullinga Dam Report
•2015
•Queensland Treasury Corporation
•Identified potential 36,000 to 69,500 ML/a from a proposed Nullinga Dam to accommodate both HP and MP customers

EXECUTIVE SUMMARY
NDMIP DETAILED BUSINESS CASE 20
In September 2017, subsequent to the PBC, additional long-term demand for water allocations was
identified. Building Queensland was advised of potential local operator demands, which would require new
water allocations1 to support the desired agricultural production.
In December 2017, after consideration of this new information, the Department of Natural Resources, Mines
and Energy (DNRME) informed Sunwater and Building Queensland of the intention to proceed with the
development of a DBC, with Sunwater as the nominated proponent.
By June 2018, Sunwater and DNRME entered into separate agreements with Building Queensland to deliver
a DBC. As per the PBC recommendations, this DBC includes consideration of modernisation works of existing
MDWSS infrastructure, improvements in operating rules, and potential Nullinga Dam options.
1.2 Service need
With the MDWSS continuing to be highly utilised and fully allocated, and CRC identifying a long-term need
for additional urban water supply requirements (in 40 years’ time), the Commonwealth and Queensland
Governments have made strategic commitments to examine the feasibility of this storage option.
The service need identified in the DBC is two-fold, recognising the:
▪ opportunity to increase water available for agricultural activities in support of potential future demand (considered the primary driver for NDMIP)
▪ need to address future urban supply requirements for Cairns (considered the secondary driver, noting the need is only in 40 years’ time).
The primary aim of the NDMIP is to provide access to additional water, within a fully allocated and highly
utilised scheme, for potential agricultural development in the MDWSS. The ongoing lack of access to
additional water is a contributing factor affecting further agricultural development, which is expected to be
largely undertaken by existing customers looking to expand their local operations.
In addition to securing additional water for agricultural use, the NDMIP is a potential option to address the
long-term future need for urban water supply for Cairns. Access to a second supplemented supply source,
within 30 to 40 years, may also reduce the likelihood and frequency of urban water restrictions and potential
water supply shortfalls for the region.
These findings are supported through an examination of the current supply and demand factors and the
future water demands for both agricultural and urban customers, as outlined further below. The demand
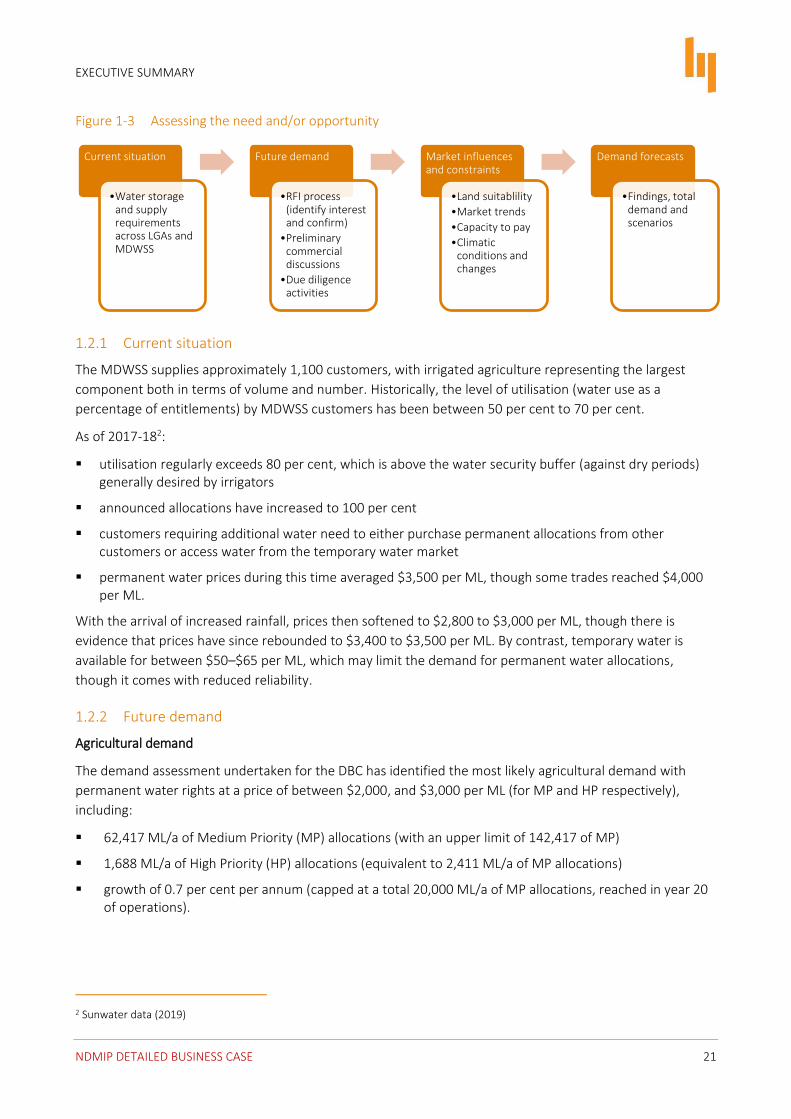
assessment process undertaken as part of this DBC is shown in Figure 1-3.
1 The total upper limit of the identified volume, at a given price, was in excess of the total dam yield, for any option, contemplated in the DBC.
EXECUTIVE SUMMARY
NDMIP DETAILED BUSINESS CASE 21
Figure 1-3 Assessing the need and/or opportunity
1.2.1 Current situation
The MDWSS supplies approximately 1,100 customers, with irrigated agriculture representing the largest
component both in terms of volume and number. Historically, the level of utilisation (water use as a
percentage of entitlements) by MDWSS customers has been between 50 per cent to 70 per cent.
As of 2017-182:
▪ utilisation regularly exceeds 80 per cent, which is above the water security buffer (against dry periods) generally desired by irrigators
▪ announced allocations have increased to 100 per cent
▪ customers requiring additional water need to either purchase permanent allocations from other customers or access water from the temporary water market
▪ permanent water prices during this time averaged $3,500 per ML, though some trades reached $4,000 per ML.
With the arrival of increased rainfall, prices then softened to $2,800 to $3,000 per ML, though there is
evidence that prices have since rebounded to $3,400 to $3,500 per ML. By contrast, temporary water is
available for between $50–$65 per ML, which may limit the demand for permanent water allocations,
though it comes with reduced reliability.
1.2.2 Future demand
Agricultural demand
The demand assessment undertaken for the DBC has identified the most likely agricultural demand with
permanent water rights at a price of between $2,000, and $3,000 per ML (for MP and HP respectively),
including:
▪ 62,417 ML/a of Medium Priority (MP) allocations (with an upper limit of 142,417 of MP)
▪ 1,688 ML/a of High Priority (HP) allocations (equivalent to 2,411 ML/a of MP allocations)
▪ growth of 0.7 per cent per annum (capped at a total 20,000 ML/a of MP allocations, reached in year 20 of operations).
2 Sunwater data (2019)
Current situation
•Water storage and supply requirements across LGAs and MDWSS
Future demand
•RFI process (identify interest and confirm)
•Preliminary commercial discussions
•Due diligence activities
Market influences and constraints
•Land suitablility
•Market trends
•Capacity to pay
•Climatic conditions and changes
Demand forecasts
•Findings, total demand and scenarios
EXECUTIVE SUMMARY
NDMIP DETAILED BUSINESS CASE 22
After the finalisation of the demand assessment, another potential customer identified a requirement for a
significant volume of MP allocations at a similar price to that identified above, which provides additional
certainty to the demand forecasts.
Urban demand
It is anticipated Cairns will require access to a new regional dam by the 2060’s to meet their projected water
needs at their stated Level of Service objectives. In addition, access to a second supply source would reduce
the likelihood and frequency of water restrictions and potential water supply shortfalls.
The demand assessment undertaken as part of the DBC supports CRC’s position that Cairns will most likely require an additional source of supply to service its urban requirements by 20633, assuming demand management initiatives and supply augmentations are successfully undertaken as currently committed.
As part of the demand assessment undertaken in the development of this DBC, CRC have indicated a
preparedness to purchase an allocation of HP to provide additional water security for Cairns. Discussions
with CRC have confirmed their commitment to pay for this allocation from the first year water is available
from a new regional dam (identified as the proposed Nullinga Dam), and their preference for trading this
water to agricultural users until it is required.
1.2.3 Market influencers and constraints
Four primary influences on agricultural and urban water demand have been considered in the DBC. These
include population growth, land use change, climatic conditions, and market trends/producer margins. Table
1-1 summarises some of the relevant issues, findings and implications of these influences for forecast
demand in the study area.
Table 1-1 Demand influencers and/or constraints
SUMMARY OF ISSUE/S IMPLICATION FOR DEMAND
POPULATION
As part of the demand assessment, CRC provided their latest population forecasts to inform the DBC. CRC’s population forecasts are based on QGSO population forecasts, and are produced for low, medium and high population growth rates. Recent population growth in CRC has been tracking along the low growth population forecast.
Population growth in Cairns has seen fluctuations over the last 30 years, from nearly 5% p.a. in the early 90’s to less than 2% p.a. over the last decade. Despite this decline, history has shown that Cairns may experience increases in population growth over short periods.
As at June 30, 2018, the estimated population reliant on this water supply network is 166,794. Under the medium growth projection, this will increase to 223,410 by 2036 and 281,339 by 2051.
Yes
Building Queensland has adopted the medium population growth estimate including demand management, as the basis for further analysis.
LAND4
3 It is noted that should CRC fail to deliver demand management initiatives, Mulgrave 2 augmentation works, and experience a high demand growth scenario, Cairns may require an additional source of supply as early as 2037, though this is considered unlikely. Equally, should lower demand growth be experienced, additional supply may not be required until even later, approximately 2071 4 Soil mapping (DAF)

EXECUTIVE SUMMARY
NDMIP DETAILED BUSINESS CASE 23
SUMMARY OF ISSUE/S IMPLICATION FOR DEMAND
Land is not considered a constraining factor on the development of irrigated agriculture in the region. Analysis of soil suitability mapping has identified over 53,000 hectares with soils suitable for agriculture within and around the MDWSS5.
While stakeholders have commented that the water from Nullinga would be used on existing crops to support yield increases, the actual crop type and mix that would be supported through additional allocations in the MDWSS will be influenced by wider market forces, including production, consumption and competition and access to domestic and international markets.
No impact on the forecast demand (not a constraint)
CLIMATIC CONDITIONS
Continued substantial increases for mean, maximum and minimum temperatures are projected with very high confidence. For the near future (2020-2039), the mean warming is around 0.3 to 1.1 °C (10th to 90th percentile) above the climate of 1986–2005 (centred at 1995).
More hot days and warm spells are projected with a very high degree of confidence. For example, in Cairns, in the near future (2020-2039), the average annual number of days over 35 and 40 °C is forecast to increase by 2.5 and 0.1 days respectively (from a current base of 3 days and 0 days).
Changes to rainfall patterns are possible, though the direction and magnitude of change is unclear. Increased intensity of extreme rainfall events is projected with high confidence. However, the magnitude of change, and the time when any change may emerge from natural variability, cannot be reliably projected.
Drought will continue to be a regular feature of the regional climate. It may change its characteristics as the climate warms; however, due to uncertainty in rainfall projections, there is low confidence in projecting how the frequency and duration of drought may change.
With medium confidence, fewer but more intense tropical cyclones are forecast.
Uncertain.
Additional sensitivities have been considered
- for the potential delay in a proposed Nullinga Dam reaching full supply level (FSL)
- implications for CRC water security requirements to change.
MARKET TRENDS AND PRODUCER MARGINS
Consideration has been made of producer’s capacity to pay upfront for irrigation water under several scenarios, ranging from a producer on a new farm to an established producer who wished to supplement current levels of irrigation. The estimates of irrigators’ preparedness to pay upfront, based on the RFIs and detailed subsequent discussions, have been compared with the results of an analysis of the capacity to pay of irrigators for different crop types, which was considered as part of the detailed demand assessment.
The vast majority (in excess of 90%) of current and future demand, in the MDWSS, is for sugarcane, where producers’ capacity and willingness to pay are currently closely aligned i.e. close to $2,000 per ML for MP.
Yes.
The majority of customers seeking new allocations in the MDWSS are unlikely to be able to pay much beyond stated water prices upfront (i.e. $2,000 per ML for MP and $3,000 for HP).
1.2.4 Total demand
In terms of agriculture, access to water within the existing MDWSS is constrained, with existing allocations
over the last couple of years, fully taken up and highly utilised. Access to water is a limiting factor affecting
further agricultural development in the MDWSS. By making additional water allocations available, at a price
that aligns with producers’ capacity to pay, further agricultural development in the MDWSS is likely to occur.
5 As a comparison, it is noted that should total demand under the central case be met, the total additional land utilised would be between 6,000 to 8,000 hectares (assuming 10 ML per hectare for sugarcane).
EXECUTIVE SUMMARY
NDMIP DETAILED BUSINESS CASE 24
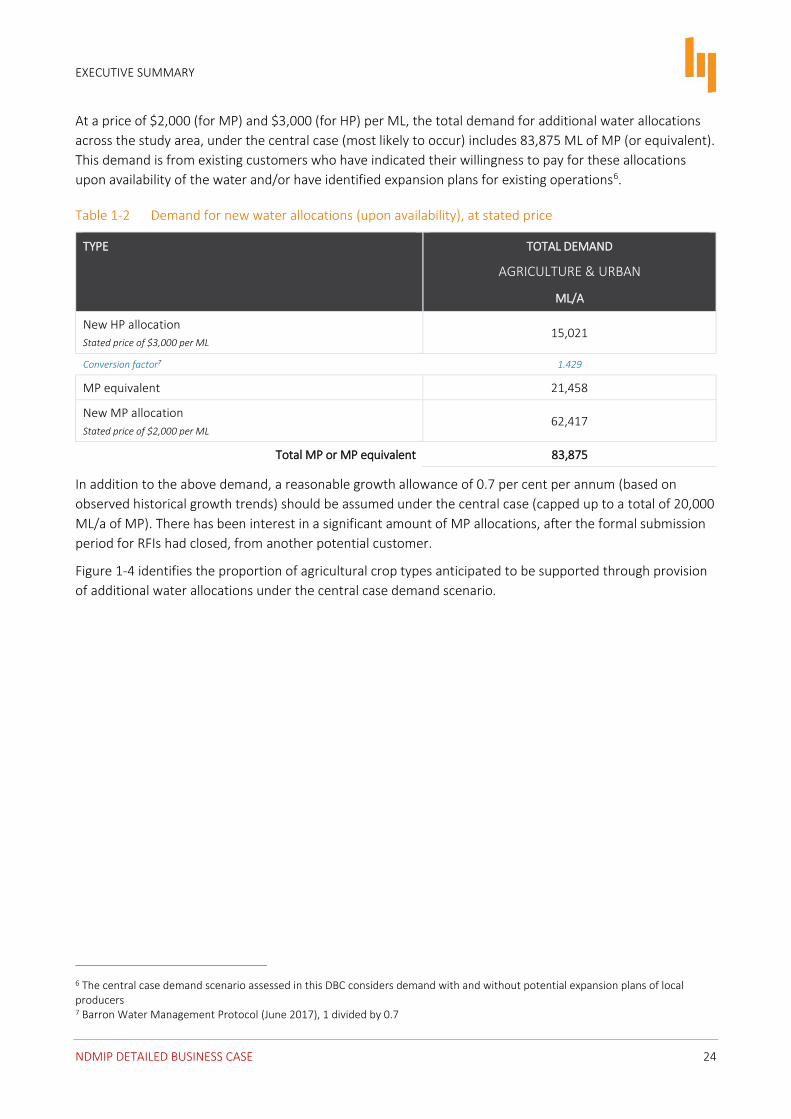
At a price of $2,000 (for MP) and $3,000 (for HP) per ML, the total demand for additional water allocations
across the study area, under the central case (most likely to occur) includes 83,875 ML of MP (or equivalent).
This demand is from existing customers who have indicated their willingness to pay for these allocations
upon availability of the water and/or have identified expansion plans for existing operations6.
Table 1-2 Demand for new water allocations (upon availability), at stated price
TYPE TOTAL DEMAND
AGRICULTURE & URBAN
ML/A
New HP allocation
Stated price of $3,000 per ML 15,021
Conversion factor7 1.429
MP equivalent 21,458
New MP allocation
Stated price of $2,000 per ML 62,417
Total MP or MP equivalent 83,875
In addition to the above demand, a reasonable growth allowance of 0.7 per cent per annum (based on
observed historical growth trends) should be assumed under the central case (capped up to a total of 20,000
ML/a of MP). There has been interest in a significant amount of MP allocations, after the formal submission
period for RFIs had closed, from another potential customer.
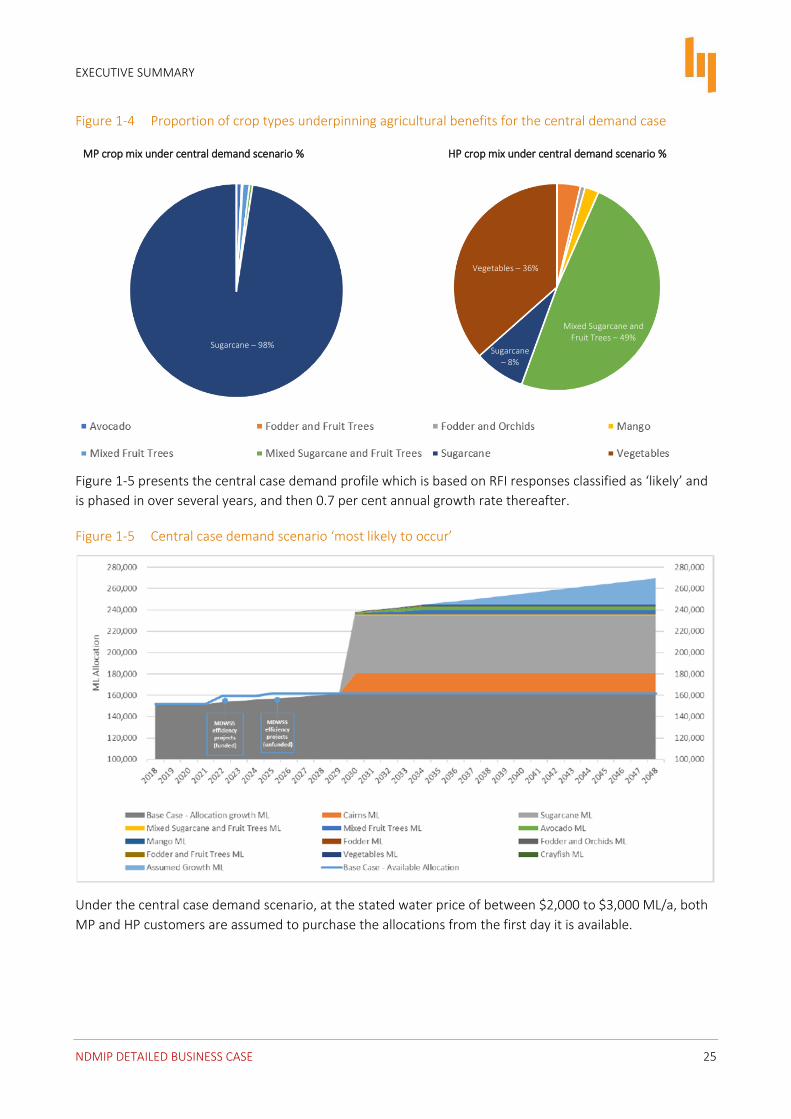
Figure 1-4 identifies the proportion of agricultural crop types anticipated to be supported through provision
of additional water allocations under the central case demand scenario.
6 The central case demand scenario assessed in this DBC considers demand with and without potential expansion plans of local producers 7 Barron Water Management Protocol (June 2017), 1 divided by 0.7
EXECUTIVE SUMMARY
NDMIP DETAILED BUSINESS CASE 25
Figure 1-4 Proportion of crop types underpinning agricultural benefits for the central demand case
MP crop mix under central demand scenario % HP crop mix under central demand scenario %
Figure 1-5 presents the central case demand profile which is based on RFI responses classified as ‘likely’ and
is phased in over several years, and then 0.7 per cent annual growth rate thereafter.
Figure 1-5 Central case demand scenario ‘most likely to occur’
Under the central case demand scenario, at the stated water price of between $2,000 to $3,000 ML/a, both
MP and HP customers are assumed to purchase the allocations from the first day it is available.
Sugarcane – 98%
Vegetables – 36%
Mixed Sugarcane and Fruit Trees – 49%
Sugarcane – 8%

EXECUTIVE SUMMARY
NDMIP DETAILED BUSINESS CASE 26
1.3 Options considered
The PBC considered ten different options to meet the (then) identified service need, including several sub-
options. It identified the three highest scoring options and assessed these against a defined base case,
including:
▪ improving MDWSS rules and operations
▪ modernisation of MDWSS distribution infrastructure
▪ building a new Nullinga Dam.
1.3.1 Non-infrastructure options
A detailed assessment of ten different initiatives for improving the current MDWSS rules and operations
were considered. Based on this analysis:
▪ the DBC has adopted the principle of exploring and converting MP to HP where there are customers able and willing to pay
▪ it is recommended that:
- as part of ongoing water plan review activities, DNRME should consider changing the water year to
three months later than currently stated in the water plan
- as part of its ongoing operational reviews and activities, Sunwater should continue to strengthen the water ordering processes and consider potential opportunities for continuous sharing arrangements.
Currently, no additional capital or recurrent funding is forecast for the above findings and these initiatives are not considered in any of the Reference Projects for this DBC.
1.3.2 Modernisation options
In parallel to the development of the PBC, Sunwater, the operator of the MDWSS,
developed a business case for a MDWSS Efficiency Improvement Project. As a
result of this work, in May 2018, $11.6 million from the NWIDF was awarded to
Sunwater to deliver six of eleven subprojects identified in the PBC, with Sunwater
committing the remaining $16.5 million of the estimated $28.1 million capital cost.
Planning activities are underway, and construction is anticipated to be completed
by 2021. These works will result at least 8,304 ML/a (MP) of existing loss
allocations available for sale to the water market.
In the development of this DBC, the concept designs for the remaining unfunded
channel upgrade sub-projects were progressed, in addition with development of cost estimates. Most of
these subprojects have an estimated cost per ML well in excess of $10,000 per ML, except for upgrade works
for the Arriga Main Channel8 and East Barron. A detailed economic and financial appraisal for these two-
upgrade works found a combined Benefit Cost Ratio (BCR) of 0.25 and Net Present Values (NPV) of -$13.8m
(discounted at 7 per cent real).
8 It is acknowledged that the proposed Arriga Main Channel works are relatively inexpensive (capital cost of approximately $0.246m), noting the potential water savings are approximately 350 ML/a
EXECUTIVE SUMMARY
NDMIP DETAILED BUSINESS CASE 27
These unfunded modernisation works were not included in any of the Reference Projects presented in this
DBC and it is acknowledged that they could be delivered as part of the existing MDWSS Efficiency
Improvement Project.
1.3.3 Nullinga Dam options
Concept engineering designs and cost estimates were developed for a range of different sized Nullinga Dam
options, in addition to hydrological analysis and a comparative Cost Benefit Analysis (CBA). Key findings from
the design and comparative analysis work includes:
▪ all dam options investigated require a saddle dam
▪ the maximum feasible yield of the Walsh River catchment is approximately 80,000 ML/a9
▪ the optimum cost per ML of yield is at approximately 550m AHD, though the cost per ML does not increase significantly between 540m AHD and 555m AHD
▪ a dam smaller than 540m AHD results in increasing costs per ML of yield
▪ a dam larger than 556m AHD (74,000 ML/a) results in exponential increase in cost per/ML, with little yield gain coupled with rapid cost rises associated with both further expansion of the main dam wall and the primary saddle dam, as well as a need for a second saddle dam
▪ Nullinga Dam cannot support the total estimated demand for water (at a stated price of $2,000 for MP and $3,000 for HP) in the MDWSS, as identified in the demand assessment undertaken for the DBC.
Given the points above, two sizes of Nullinga Dam were selected for further evaluation (including a 545m
AHD and 556m AHD options) having consideration for the calculated yields, anticipated demand (both with
and without potential local operator demand) and cost implications.
Concept development activities identified water distribution infrastructure works, both new and/or upgrades
for existing assets. These would support either a standalone scheme approach, where distribution from a
new Nullinga Dam would be separated from the allocation currently available from Tinaroo Falls Dam, or
conjunctive scheme approach, where allocation from both a new Nullinga Dam and current Tinaroo Falls
Dam would be managed as one total allocation.
Based on the recommendations of the PBC, updated analysis and investigations, the following options have
been selected for further consideration and analysis in the DBC.
▪ Reference Project 1, a Nullinga Dam (545m AHD) capable of supporting 58,000 ML/a, including consideration of both a standalone and conjunctive scheme approach, along with the associated distribution works.
▪ Reference Project 2, a Nullinga Dam (556m AHD) capable of supporting 74,000 ML/a, including consideration of a standalone, partially conjunctive and fully conjunctive scheme approaches, along with the associated distribution works.
It is acknowledged that neither Reference Project is capable of fully meeting the estimated (most likely)
demand, at the stated prices of $2,000 per ML for MP and $3,000 per ML for HP.
1.3.4 Alternative options
Since the finalisation of the PBC, and during the development of this DBC, various studies and investigations
have been undertaken by Sunwater, local government and Commonwealth Government agencies, which
9 Monthly reliability of 97.4%, based on ‘order of magnitude’ assessment of maximum possible yield.)

EXECUTIVE SUMMARY
NDMIP DETAILED BUSINESS CASE 28
have provided Building Queensland with updated or additional data/information options presented in the
PBC, for water storage and/or distribution within the MDWSS.
This DBC focuses on assessing the feasibility of appropriate Nullinga Dam options, in line with commitments
under the National Water Infrastructure Development Fund. Alternative options, both raised in the PBC, or
subsequently by third parties, have not been included in the base case or Reference Projects given the scope
of the DBC, and as a result of ongoing uncertainties relating to environmental and/or social risks, with
concept designs not as developed as the Nullinga Dam options.
1.4 Base case
The base case provides the benchmark against which the economic and social impacts of the NDMIP are
evaluated and quantified. A base case has been defined separately for each of the potential user groups
likely to be impacted by the NDMIP.
As the primary service need for Nullinga is an opportunity—rather than a problem—it is considered there is
no base case in which any user group will run out of water supply. However, there will be a point in time
when CRC and MSC, having exhausted more cost-effective water supply options, will either need to develop
a dam, or other costly augmentation solution (e.g. desalination), solely focussed on urban services to meet
urban and industrial water demand due to population growth.
Over the assessment period:
▪ Cairns’ supply security is met by existing and planned source options on the Mulgrave and Barron rivers.
▪ MSC and TRC urban water supply security is adequately met through existing sources.
▪ In absence of NDMIP, irrigated agricultural production is expected to be relatively stable, with a small
increase in production when MDWSS Efficiency Improvement Project works are completed (which will
provide an estimated 8,304 ML/a of MP), and with a gradual shift from lower to higher value crops
expected to continue in the MDWSS.
1.5 Reference Project
The Reference Projects considered in the DBC investigate the delivery of a new Nullinga Dam. In addition to
consideration of a standalone dam approach, a number of sub-options were assessed, where the dam would
be integrated into the existing MDWSS and be operated in conjunction with Tinaroo Falls Dam (the existing
MDWSS water storage infrastructure). These sub options require delivery of bespoke distribution
infrastructure and works, as compared with the standalone approach.
Table 1-3 provides a summary of the Reference Projects and the associated upfront capital costs10.
10 The costs prepared for Nullinga Dam solutions are a Class 3 estimate, prepared by Bellwether and based on preliminary designs prepared by SMEC and peer reviewed by GHD.
EXECUTIVE SUMMARY
NDMIP DETAILED BUSINESS CASE 29
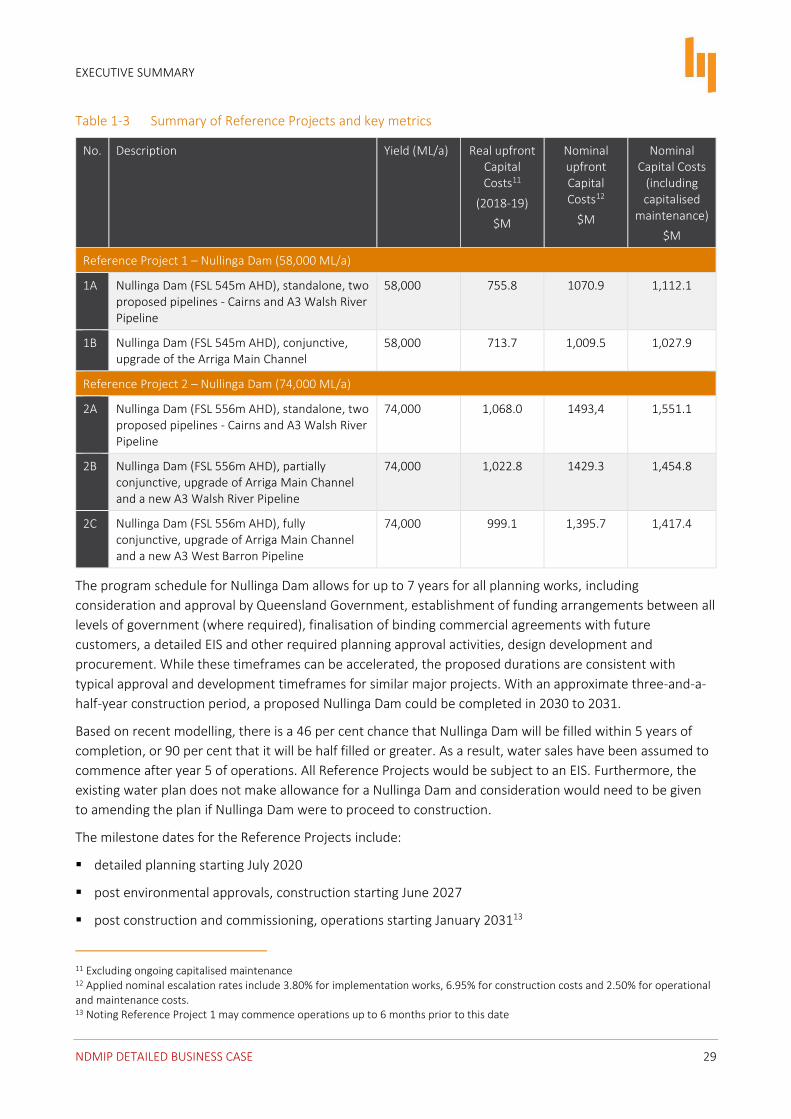
Table 1-3 Summary of Reference Projects and key metrics
No. Description Yield (ML/a) Real upfront Capital Costs11
(2018-19)
$M
Nominal upfront Capital Costs12
$M
Nominal Capital Costs
(including capitalised
maintenance)
$M
Reference Project 1 – Nullinga Dam (58,000 ML/a)
1A Nullinga Dam (FSL 545m AHD), standalone, two proposed pipelines - Cairns and A3 Walsh River Pipeline
58,000 755.8 1070.9 1,112.1
1B Nullinga Dam (FSL 545m AHD), conjunctive, upgrade of the Arriga Main Channel
58,000 713.7 1,009.5 1,027.9
Reference Project 2 – Nullinga Dam (74,000 ML/a)
2A Nullinga Dam (FSL 556m AHD), standalone, two proposed pipelines - Cairns and A3 Walsh River Pipeline
74,000 1,068.0 1493,4 1,551.1
2B Nullinga Dam (FSL 556m AHD), partially conjunctive, upgrade of Arriga Main Channel and a new A3 Walsh River Pipeline
74,000 1,022.8 1429.3 1,454.8
2C Nullinga Dam (FSL 556m AHD), fully conjunctive, upgrade of Arriga Main Channel and a new A3 West Barron Pipeline
74,000 999.1 1,395.7 1,417.4
The program schedule for Nullinga Dam allows for up to 7 years for all planning works, including
consideration and approval by Queensland Government, establishment of funding arrangements between all
levels of government (where required), finalisation of binding commercial agreements with future
customers, a detailed EIS and other required planning approval activities, design development and
procurement. While these timeframes can be accelerated, the proposed durations are consistent with
typical approval and development timeframes for similar major projects. With an approximate three-and-a-
half-year construction period, a proposed Nullinga Dam could be completed in 2030 to 2031.
Based on recent modelling, there is a 46 per cent chance that Nullinga Dam will be filled within 5 years of
completion, or 90 per cent that it will be half filled or greater. As a result, water sales have been assumed to
commence after year 5 of operations. All Reference Projects would be subject to an EIS. Furthermore, the
existing water plan does not make allowance for a Nullinga Dam and consideration would need to be given
to amending the plan if Nullinga Dam were to proceed to construction.
The milestone dates for the Reference Projects include:
▪ detailed planning starting July 2020
▪ post environmental approvals, construction starting June 2027
▪ post construction and commissioning, operations starting January 203113
11 Excluding ongoing capitalised maintenance 12 Applied nominal escalation rates include 3.80% for implementation works, 6.95% for construction costs and 2.50% for operational and maintenance costs. 13 Noting Reference Project 1 may commence operations up to 6 months prior to this date

EXECUTIVE SUMMARY
NDMIP DETAILED BUSINESS CASE 30
▪ water sales starting January 2035.
Guidance note: Cost estimation
The capital cost estimate for the PBC was based on a Sunwater report completed in 2008. The high-level capital cost
estimate in the PBC was based on a 540 m AHD dam with a 168,000 ML capacity, which would yield 44,000 ML/a
after losses14. Based on the preliminary level of design documentation, the PBC estimates typically comply with a
Class 5 estimate, with an expected accuracy range of up to +100 per cent.
Since the PBC, there has been an increase in identified demand for water to meet potential agricultural and future
urban requirements, at a stated price. In addition to an increase in identified demand, the relevant design guidelines
have been updated, the design status including hydrological analysis and time until first water is available from a
Nullinga Dam has further developed in the ten years since the completion of the initial capital cost estimate,
resulting in several major changes from the PBC, including:
▪ extension of hydrologic model data to capture the federation and millennium droughts has reduced the yield from the catchment, requiring a larger dam to deliver the increased yield
▪ Australian National Committee on Large Dams (ANCOLD) design guidelines for Concrete Gravity Dams have been revised since the Concept Investigation report were released, increasing the structural requirements of the dam, which has impacted the total cost to deliver.
In addition, these key drivers have resulted in the following major changes to project development and delivery
timeframes from the PBC including:
▪ increased understanding of pre-construction activities and continuation and further development of design and procurement activities
▪ increased understanding of the risks, resources and timeframes required to develop an approved Environmental Impact Statement (EIS)
▪ increased understanding of risks of construction of Nullinga Dam options.
The factors above have contributed to larger dam solutions (than that identified within the PBC) that will take longer
to implement to meet the identified service need, resulting in a significant increase in the capital cost estimates for
the Reference Projects. The DBC includes an increase in capital costs from $323 million (P50, Real $2017) in the PBC
to $703 million (P90, Real $2019) for the smaller Reference Project 1B (excluding $11 million of delivery
infrastructure) identified within the DBC.
Concept engineering designs and cost estimates, in addition to hydrological analysis, were developed for a range of
different sized Nullinga Dam options, to inform a comparative CBA, resulting in larger dam options identified in the
DBC to service the identified potential demand. These concept designs were further progressed and developed to
preliminary design level and included updated hydrology, and interpretation of available information on the geology
and geotechnical conditions and published seismicity of the area. The dam options included within the DBC include:
▪ Reference Project 1: 256,000 ML capacity / 58,000 ML/a yield
▪ Reference project 2: 518,000 ML capacity / 74,000 ML/a yield
This increase in project definition from the PBC to DBC stage results in an increase in costs from the PBC as outlined
below:
▪ increase in costs due to revised contingency from the PBC P50 capital cost estimate to DBC P90 capital cost estimate, including allowances for:
– supply of a portion of quarry materials from external off-site quarry15, if not available from within site boundary
– demobilising during expected wet weather events during wet weather season in North Queensland
14 55,400 ML/a before losses. 15 This is based on findings from preliminary site investigations undertaken as part of the preliminary design development process

EXECUTIVE SUMMARY
NDMIP DETAILED BUSINESS CASE 31
▪ increase in direct costs due to increase in size of Reference Project from:
– 540m AHD to 545m AHD dam, for Reference Project 1, which includes a main dam which is 2m higher and 60m longer than the PBC dam solution, and 42,000m3 (13 per cent) larger, and the associated saddle dam is 5m higher and over 300m longer and 84,000m3 (250 per cent) larger than the saddle dam identified within the PBC
– 540m AHD to 556m AHD dam, for Reference Project 2, includes a main dam which is 12m higher and 130m longer than the PBC dam solution, and 354,000m3 (100 per cent) larger, and the associated saddle dam is 16m higher and over 900m longer and 553,000m3 (1,000 per cent) larger than the saddle dam identified within the PBC
▪ increase in time related costs due to increase in overall project development and implementation duration from 4 to 11 years, to accommodate the detailed planning approval, design and procurement processes for a more complex dam option than envisioned under the PBC, and to include an increase in anticipated construction duration from 2 to 3.5 years
▪ increase in costs due to provision for:
– increase in size for various dam components, including stilling basin, fish lock and clearing for inundation areas
– increase in allowance for project planning and approval related activities including EIS development and land acquisition costs
– required distribution infrastructure including pipelines
– allowance for working in remote location including camp development and facilities operations.
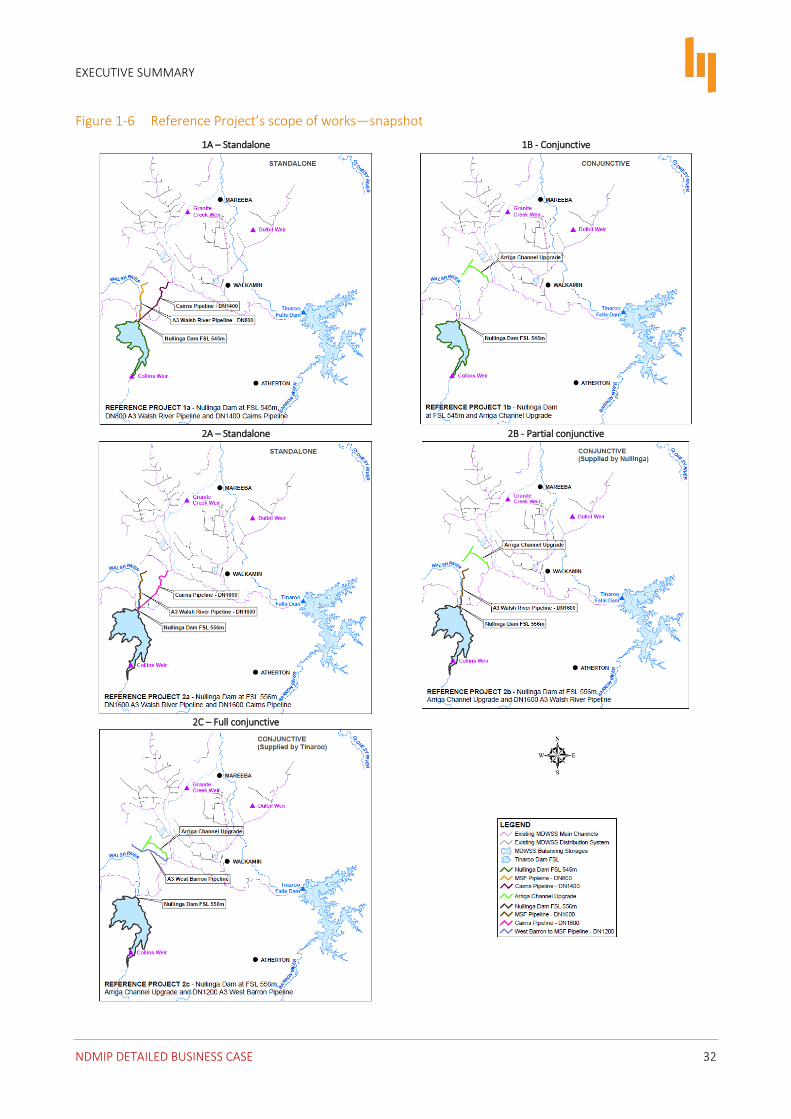
Figure 1-6 (overleaf) provides a snapshot of the scope of works under each of the considered Reference
Projects. Importantly, it is acknowledged that conjunctive scheme approaches utilise and upgrade existing
distribution channels where practicable. Notable components included in the scope of works of the Nullinga
Dam options include, for Reference Project 1 and 2 respectively, a:
▪ main dam wall with a height of 54.7m to 65.3m, and length of 635m to 703m
▪ Saddle Dam with a height of 10.2m to 19.8m, width of 49m to 109m and length of 1.04km to 1.63km.
EXECUTIVE SUMMARY
NDMIP DETAILED BUSINESS CASE 32
Figure 1-6 Reference Project’s scope of works—snapshot
1A – Standalone 1B - Conjunctive
2A – Standalone 2B - Partial conjunctive
2C – Full conjunctive
EXECUTIVE SUMMARY
NDMIP DETAILED BUSINESS CASE 33
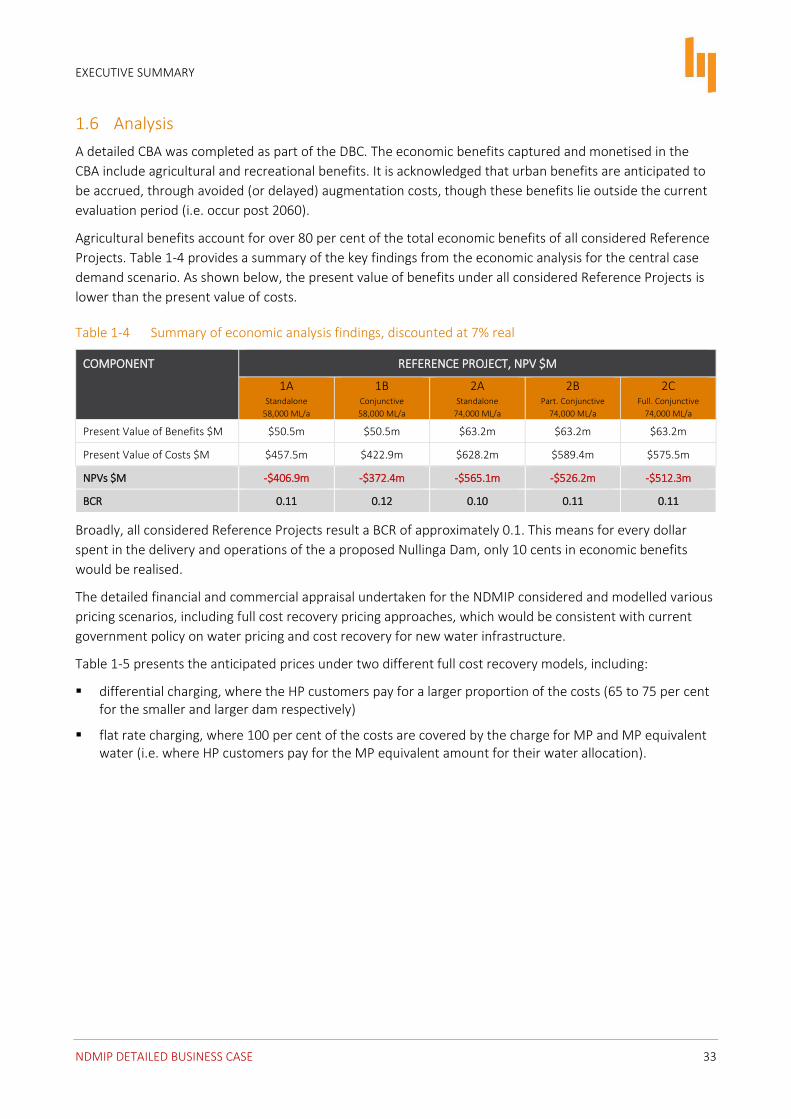
1.6 Analysis
A detailed CBA was completed as part of the DBC. The economic benefits captured and monetised in the
CBA include agricultural and recreational benefits. It is acknowledged that urban benefits are anticipated to
be accrued, through avoided (or delayed) augmentation costs, though these benefits lie outside the current
evaluation period (i.e. occur post 2060).
Agricultural benefits account for over 80 per cent of the total economic benefits of all considered Reference
Projects. Table 1-4 provides a summary of the key findings from the economic analysis for the central case
demand scenario. As shown below, the present value of benefits under all considered Reference Projects is
lower than the present value of costs.
Table 1-4 Summary of economic analysis findings, discounted at 7% real
COMPONENT REFERENCE PROJECT, NPV $M
1A Standalone
58,000 ML/a
1B Conjunctive
58,000 ML/a
2A Standalone
74,000 ML/a
2B Part. Conjunctive
74,000 ML/a
2C Full. Conjunctive
74,000 ML/a
Present Value of Benefits $M $50.5m $50.5m $63.2m $63.2m $63.2m
Present Value of Costs $M $457.5m $422.9m $628.2m $589.4m $575.5m
NPVs $M -$406.9m -$372.4m -$565.1m -$526.2m -$512.3m
BCR 0.11 0.12 0.10 0.11 0.11
Broadly, all considered Reference Projects result a BCR of approximately 0.1. This means for every dollar
spent in the delivery and operations of the a proposed Nullinga Dam, only 10 cents in economic benefits
would be realised.
The detailed financial and commercial appraisal undertaken for the NDMIP considered and modelled various
pricing scenarios, including full cost recovery pricing approaches, which would be consistent with current
government policy on water pricing and cost recovery for new water infrastructure.
Table 1-5 presents the anticipated prices under two different full cost recovery models, including:
▪ differential charging, where the HP customers pay for a larger proportion of the costs (65 to 75 per cent for the smaller and larger dam respectively)
▪ flat rate charging, where 100 per cent of the costs are covered by the charge for MP and MP equivalent water (i.e. where HP customers pay for the MP equivalent amount for their water allocation).

EXECUTIVE SUMMARY
NDMIP DETAILED BUSINESS CASE 34
Table 1-5 Estimated upfront water charges under full cost recovery approaches
APPROACH UPFRONT CAPITAL CHARGE ($/ML)
Differential charging UPFRONT CAPITAL CHARGE ($/ML)
Flat charging
REFERENCE PROJECT MP HP MP (and MP
equivalent) HP price based on
MP equivalent16
Reference Project 1A 6,800 49,200 17,000 24,286
Reference Project 1B 6,300 46,000 15,900 22,714
Reference Project 2A 8,900 57,600 18,000 25,714
Reference Project 2B 8,400 54,800 17,100 24,429
Reference Project 2C 8,200 53,500 16,700 23,857
Under the full cost recovery approaches presented above:
▪ differential charging approach would result in extremely high HP water prices, which are 10 to 13 times higher than current HP prices in the MDWSS, with HP customers paying $46,000 per ML or higher
▪ a flat charging regime would result in an upfront payment of between 4 and 9 times the current stated price, with customers being required to pay approximately $15,900 per ML or greater.
Under any considered full cost recovery model, the pricing would be commercially unattractive for all
current (and future) MDWSS customers. The central case scenario adopted for consideration in the DBC has
therefore assumed:
▪ a proposed Nullinga Dam would not operate under a full cost recovery model
▪ water pricing would reflect willingness and capacity to pay assumptions (i.e. upfront price of $2,000 to $3,000 per ML for MP and HP respectively)
▪ ongoing fees set to recover operating, maintaining and refurbishing costs of the asset only.17
The adoption of the above pricing is inconsistent with current pricing and cost recovery principles of both
the Queensland and Commonwealth Governments18 for new water infrastructure; however, without capping
upfront charges and limiting ongoing charges to the recovery of Operating and Maintenance (O&M) costs
only, it is reasonably anticipated that no customer would be willing or able to pay the associated prices.
Figure 1-7 summarises the net financial impact, in Financial Net Present Value (FNPV) terms, using P90 costs
of the Reference Projects over a 30-year evaluation period, for the central case demand scenario (including
potential local operator demand).
16 Conversion rate of 0.7 (i.e. MP price divided by 0.7), as per Barron Water Management Protocol (June 2017). 17 Similar to irrigation prices for existing schemes where the government sets the prices. 18 Including pricing principles under QBWOS and the National Water Initiative.

EXECUTIVE SUMMARY
NDMIP DETAILED BUSINESS CASE 35
Figure 1-7 FNPV summary of P90 financial analysis of the Reference Projects
All Reference Projects have a negative FNPV. This is due to the following factors:
▪ the large capital costs relative to the dams’ yields, for the smaller and larger dam options
▪ the long time period before first water (and revenue) commences.
Conjunctive scheme alternatives outperform all standalone Reference Projects. This is due in large to the
cheaper capital costs involved in delivering augmented distribution infrastructure in which customers could
receive allocations from either Nullinga Dam and/or Tinaroo Falls Dam. The costs associated with new
distribution infrastructure under a standalone approach are consistently higher. Table 1-6 presents the
present values of the cashflows and the overall FPNV for the Reference Projects.
Table 1-6 Reference Projects, Whole of Life Costs, FNPV P90
ESTIMATE REFERENCE PROJECT, NPV $M
1A Standalone
58,000 ML/a
1B Conjunctive
58,000 ML/a
2A Standalone
74,000 ML/a
2B Part. Conjunctive
74,000 ML/a
2C Full. Conjunctive
74,000 ML/a
Revenues—upfront 74.1 74.1 97.1 97.1 97.1
Revenues—ongoing 19.9 9.3 24.3 11.6 10.4
Total revenue 94.1 83.4 121.4 108.7 107.5
Capital expenditure 340.1 324.6 464.4 447.7 439.5
Implementation costs 60.3 53.9 86.4 79.4 75.8
O&M costs 25.9 11.7 30.6 14.3 12.7
Total planned costs 426.3 390.3 581.4 541.4 528.0
Unplanned risks 73.6 68.4 98.2 93.1 90.8
Program risks 19.5 19.6 19.9 19.9 19.9
Total risk adjustments 93.1 88.0 118.0 113.0 110.7
Total costs 519.4 478.3 699.5 654.4 638.7
EXECUTIVE SUMMARY
NDMIP DETAILED BUSINESS CASE 36
ESTIMATE REFERENCE PROJECT, NPV $M
1A Standalone
58,000 ML/a
1B Conjunctive
58,000 ML/a
2A Standalone
74,000 ML/a
2B Part. Conjunctive
74,000 ML/a
2C Full. Conjunctive
74,000 ML/a
Net financial impacts
Total (excl. WDV) (425.3) (394.9) (578.1) (545.7) (531.3)
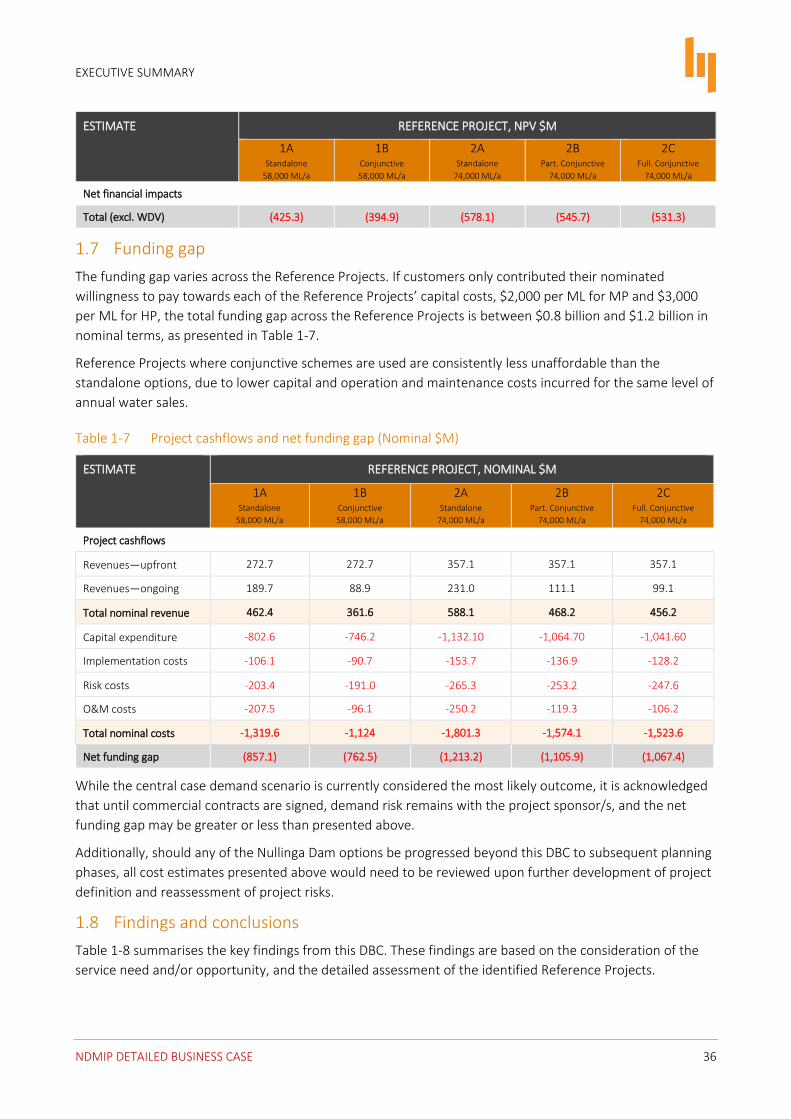
1.7 Funding gap
The funding gap varies across the Reference Projects. If customers only contributed their nominated
willingness to pay towards each of the Reference Projects’ capital costs, $2,000 per ML for MP and $3,000
per ML for HP, the total funding gap across the Reference Projects is between $0.8 billion and $1.2 billion in
nominal terms, as presented in Table 1-7.
Reference Projects where conjunctive schemes are used are consistently less unaffordable than the
standalone options, due to lower capital and operation and maintenance costs incurred for the same level of
annual water sales.
Table 1-7 Project cashflows and net funding gap (Nominal $M)
ESTIMATE REFERENCE PROJECT, NOMINAL $M
1A Standalone
58,000 ML/a
1B Conjunctive
58,000 ML/a
2A Standalone
74,000 ML/a
2B Part. Conjunctive
74,000 ML/a
2C Full. Conjunctive
74,000 ML/a
Project cashflows
Revenues—upfront 272.7 272.7 357.1 357.1 357.1
Revenues—ongoing 189.7 88.9 231.0 111.1 99.1
Total nominal revenue 462.4 361.6 588.1 468.2 456.2
Capital expenditure -802.6 -746.2 -1,132.10 -1,064.70 -1,041.60
Implementation costs -106.1 -90.7 -153.7 -136.9 -128.2
Risk costs -203.4 -191.0 -265.3 -253.2 -247.6
O&M costs -207.5 -96.1 -250.2 -119.3 -106.2
Total nominal costs -1,319.6 -1,124 -1,801.3 -1,574.1 -1,523.6
Net funding gap (857.1) (762.5) (1,213.2) (1,105.9) (1,067.4)
While the central case demand scenario is currently considered the most likely outcome, it is acknowledged
that until commercial contracts are signed, demand risk remains with the project sponsor/s, and the net
funding gap may be greater or less than presented above.
Additionally, should any of the Nullinga Dam options be progressed beyond this DBC to subsequent planning
phases, all cost estimates presented above would need to be reviewed upon further development of project
definition and reassessment of project risks.
1.8 Findings and conclusions
Table 1-8 summarises the key findings from this DBC. These findings are based on the consideration of the
service need and/or opportunity, and the detailed assessment of the identified Reference Projects.

EXECUTIVE SUMMARY
NDMIP DETAILED BUSINESS CASE 37
Table 1-8 Findings from the DBC
Area Key finding
Demand 1) There is no immediate need for additional urban water supply for Cairns, as CRC has strategies to meet supply requirements over the next 40 years
2) There is an opportunity to support expanded agricultural activities in the MDWSS through access to additional allocations, at a stated price of $2,000 to $3,000 per ML
3) There is little capacity for customers to pay more than the stated price of $2,000 to 3,000 per ML (even for the highest priority water) where sugarcane is the predominant crop type (as it currently is for the NDMIP central case demand)
Considered options
4) Based on an assessment of the identified non-infrastructure options, with the adoption principle of exploring and converting MP to HP where there are customers able and willing to pay, it is acknowledged that as part of ongoing water plan review activities:
a. DNRME should consider changing the water year to three months later than currently stated in the water plan
b. Sunwater should continue to strengthen water ordering processes and consider potential opportunities for continuous sharing arrangements
5) The remaining unfunded modernisation works identified in the PBC, and outside the current MDWSS Efficiency Improvement Project, will not result in a positive socio-economic return on investment
6) Two proposed Nullinga Dam options are the identified Reference Projects for the DBC, along with sub-options that consider both standalone and conjunctive scheme approaches
Reference Project
7) Reference Project 1 would cater for 58,000 ML/a
8) Reference Project 2 would cater for 74,000 ML/a
9) Only Reference Project 2 (and associated sub-options) would be able to support potential local operator demand
Economic analysis
10) None of the Reference Projects considered will result in a positive socioeconomic return. With no BCR greater than 0.12, the cost of each Reference Project significantly exceeds its expected benefits.
11) The Nullinga Dam option with the highest BCR (Reference Project 1B) has less than 1 per cent chance of achieving a BCR of 0.39 or higher, based on applied probabilities of all considered cost and benefit variables
Financial analysis
12) Any full cost recovery pricing model, which would align with current Queensland and Commonwealth Government water pricing policies, are commercially unviable, with a cost recovery approach resulting in:
a. customers paying $15,900 per ML for MP (and MP equivalent) water allocations
b. an upfront payment of between 4 and 9 times higher than customers willingness and capacity to pay for the majority of the known crop types
13) Adoption of the stated price of $2,000 for MP and $3,000 for HP, and recovery of O&M costs only through ongoing charges, for the central case demand scenario, will result in all Reference Projects return a negative FNPV
14) All Reference Projects would result in a funding gap equal to 90% (or greater) of upfront capital costs. This funding requirement would need to be met to support a water price of $2,000 to $3,000 per ML.
Based on the above findings, the following conclusions can be drawn:
▪ there is an opportunity to support expanded agricultural production in the study area, but only at a price that is substantially lower than the actual cost per ML of delivering additional water under any of the considered Reference Projects
EXECUTIVE SUMMARY
NDMIP DETAILED BUSINESS CASE 38
▪ Cairns’ water supply augmentation needs are not urgent, with CRC having adopted a program of supply increase and demand management initiatives which will address water needs over the next 40 years
▪ all considered Nullinga Dam options would result in poor economic outcomes and poor financial returns.
While all Nullinga Dam options result in poor socio-economic outcomes, it is acknowledged that conjunctive
scheme approaches provide an opportunity to reduce capital costs, through the use and upgrade of existing
distribution channels, over and above a standalone approach. It is further acknowledged that building the
larger dam is predicated on demand arising from forecast expansion activities of one customer and presents
additional demand risk than proceeding with a smaller dam option.
Given the findings of the economic and financial analysis, no detailed implementation plan has been
included in the DBC.
1.9 Stakeholder implications
Extensive community and local stakeholder engagement activities were undertaken during the development
of the DBC, including the implementation of a local project Stakeholder Reference Group (SRG), comprising
local industry, interest and agricultural groups.
Building Queensland engaged directly with representatives of CRC, MSC and local operators to further
inform the development of the business case. Community engagement sessions were held to understand the
views of the local communities regarding the development of Nullinga Dam. In addition, potentially impacted
landholders adjacent to Tinaroo Falls Dam and at the Nullinga Dam site were contacted to understand their
potential concerns.
EXECUTIVE SUMMARY
NDMIP DETAILED BUSINESS CASE 39
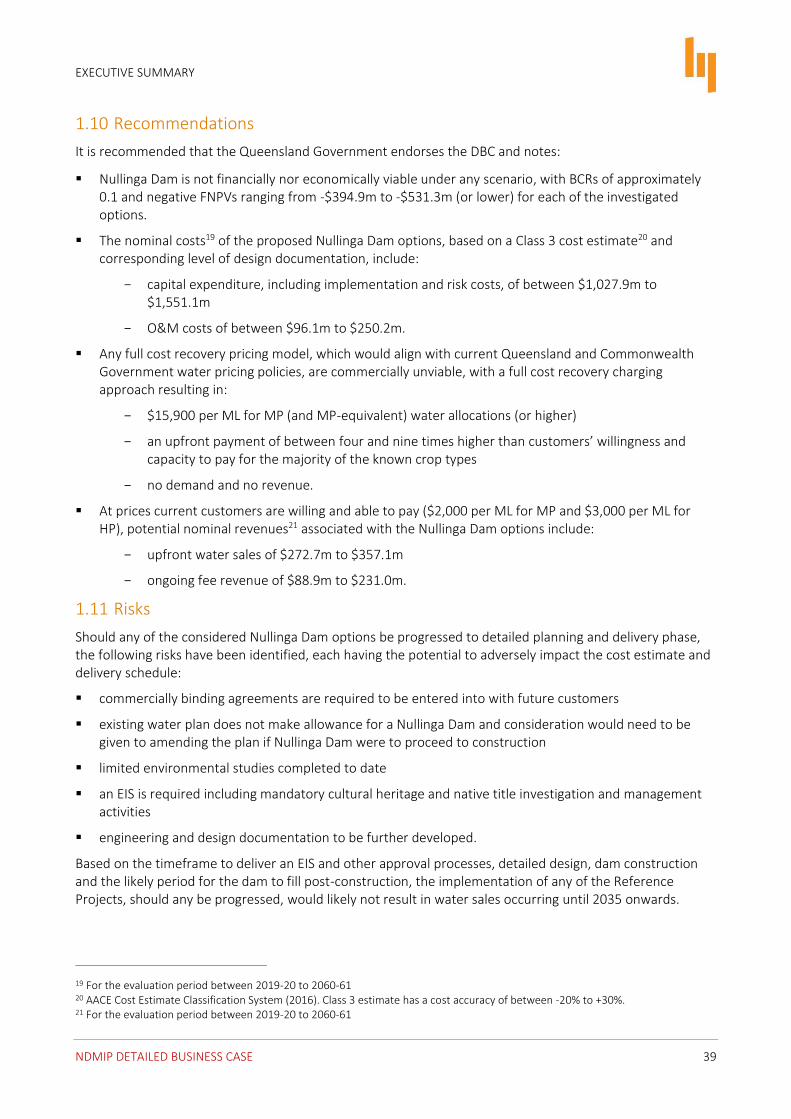
1.10 Recommendations
It is recommended that the Queensland Government endorses the DBC and notes:
▪ Nullinga Dam is not financially nor economically viable under any scenario, with BCRs of approximately 0.1 and negative FNPVs ranging from -$394.9m to -$531.3m (or lower) for each of the investigated options.
▪ The nominal costs19 of the proposed Nullinga Dam options, based on a Class 3 cost estimate20 and corresponding level of design documentation, include:
capital expenditure, including implementation and risk costs, of between $1,027.9m to $1,551.1m
O&M costs of between $96.1m to $250.2m.
▪ Any full cost recovery pricing model, which would align with current Queensland and Commonwealth Government water pricing policies, are commercially unviable, with a full cost recovery charging approach resulting in:
$15,900 per ML for MP (and MP-equivalent) water allocations (or higher)
an upfront payment of between four and nine times higher than customers’ willingness and capacity to pay for the majority of the known crop types
no demand and no revenue.
▪ At prices current customers are willing and able to pay ($2,000 per ML for MP and $3,000 per ML for HP), potential nominal revenues21 associated with the Nullinga Dam options include:
upfront water sales of $272.7m to $357.1m
ongoing fee revenue of $88.9m to $231.0m.
1.11 Risks
Should any of the considered Nullinga Dam options be progressed to detailed planning and delivery phase, the following risks have been identified, each having the potential to adversely impact the cost estimate and delivery schedule:
▪ commercially binding agreements are required to be entered into with future customers
▪ existing water plan does not make allowance for a Nullinga Dam and consideration would need to be given to amending the plan if Nullinga Dam were to proceed to construction
▪ limited environmental studies completed to date
▪ an EIS is required including mandatory cultural heritage and native title investigation and management activities
▪ engineering and design documentation to be further developed.
Based on the timeframe to deliver an EIS and other approval processes, detailed design, dam construction and the likely period for the dam to fill post-construction, the implementation of any of the Reference Projects, should any be progressed, would likely not result in water sales occurring until 2035 onwards.
19 For the evaluation period between 2019-20 to 2060-61 20 AACE Cost Estimate Classification System (2016). Class 3 estimate has a cost accuracy of between -20% to +30%. 21 For the evaluation period between 2019-20 to 2060-61


![Food security and nutrition: building a global narrative ... · EXECUTIVE SUMMARY EXECUTIVE SUMMARY EXECUTIVE SUMMARY EXECUTIVE SUMMAR Y [ 2 ] This document contains the Summary and](https://static.fdocuments.net/doc/165x107/5ff5433612d22125fb06e6b5/food-security-and-nutrition-building-a-global-narrative-executive-summary-executive.jpg)