
Executive Committee Agenda - EKU Faculty...
25
Executive Committee Agenda September 26, 2016 - 3:30 p.m. CALL TO ORDER GUEST SPEAKERS: Barry Poynter and Sara Pitt - Health Care Benefits (roll out plans) John Settimi – Chairs Steering Committee Partnership UNFINISHED BUSINESS: Ad Hoc Committee on Legislative Forum (should it continue, who should serve, possibly joint venture with chairs) Faculty Lounge – Senator Kopacz Academic Program Review Report o Data Sheets (provided in packets) o Presentations (shared previously - available on website) NEW BUSINESS: Policy Updates – Sherry Robinson Posthumous Degree for Jaysa Len Goodpaster Discussion Items: o Faculty Senate Budget Committee Report (if available) o Update on Ad Hoc Committee on Academics & Athletics - Senator O’Brien o Feedback on electronic voting o Rules Committee - Revisions for catalog and internal procedures o Clarification of committee minutes and/or Senate reports Announcements: o Remind colleagues the October Senate meeting will run extra long SENATE STANDING COMMITTEES - Liaison Reports Academic Quality Committee: Senator Givens Budget Committee: Senator Kopacz Elections & University Nominations Committee: Senator G. Hunter Faculty Welfare Committee: Senator Spigelman Informational Technology Committee: Senator Slusher Rules Committee: last year: Senator Kay Rights and Responsibilities Committee: Senator Givens UNIVERSITY COMMITTEES - (reports to XC only if there are issues) University Withdrawal Committee: Senator Slusher University Residency Appeals Committee: Senator Corley University General Education Committee: Senator Givens REPORTS & QUESTIONS: Report from the Senate Chair: Senator O’Brien Report from the Faculty Regent: Senator Day Report from the Provost: Senator Vice ADJOURNMENT
Transcript of Executive Committee Agenda - EKU Faculty...
Executive Committee Agenda
September 26, 2016 - 3:30 p.m.
CALL TO ORDER
GUEST SPEAKERS:
Barry Poynter and Sara Pitt - Health Care Benefits (roll out plans)
John Settimi – Chairs Steering Committee Partnership
UNFINISHED BUSINESS:
Ad Hoc Committee on Legislative Forum (should it continue, who should serve, possibly
joint venture with chairs)
Faculty Lounge – Senator Kopacz
Academic Program Review Report
o Data Sheets (provided in packets)
o Presentations (shared previously - available on website)
NEW BUSINESS:
Policy Updates – Sherry Robinson
Posthumous Degree for Jaysa Len Goodpaster
Discussion Items: o Faculty Senate Budget Committee Report (if available)
o Update on Ad Hoc Committee on Academics & Athletics - Senator O’Brien
o Feedback on electronic voting
o Rules Committee - Revisions for catalog and internal procedures
o Clarification of committee minutes and/or Senate reports
Announcements:
o Remind colleagues the October Senate meeting will run extra long SENATE STANDING COMMITTEES - Liaison Reports
Academic Quality Committee: Senator Givens
Budget Committee: Senator Kopacz
Elections & University Nominations Committee: Senator G. Hunter
Faculty Welfare Committee: Senator Spigelman
Informational Technology Committee: Senator Slusher
Rules Committee: last year: Senator Kay
Rights and Responsibilities Committee: Senator Givens
UNIVERSITY COMMITTEES - (reports to XC only if there are issues)
University Withdrawal Committee: Senator Slusher
University Residency Appeals Committee: Senator Corley
University General Education Committee: Senator Givens
REPORTS & QUESTIONS:
Report from the Senate Chair: Senator O’Brien
Report from the Faculty Regent: Senator Day
Report from the Provost: Senator Vice
ADJOURNMENT

Executive Committee Minutes
August 29, 2016 - 3:30 p.m.
CALL TO ORDER
GUEST SPEAKERS:
Justin Goldstein & Jonathan Sikora – Turning Point Technology Training (for Senate
Voting) keep for Senate Agenda
Chairs/Program Coordinators – Additional salient points about programs on the list for
Suspension (I will include Pauletta on correspondence so we know who will present)
Betina Gardner – LMS Update
NEW BUSINESS:
Policy Updates – Sherry Robinson
We should have policies for vetting at next XC ( Faculty Grievance, Anti Bullying,
Academic Travel) Policies for later: Intellectual Property, Library Faculty Evaluation,
Ombuds, and an Administrative policy.
Discussion Items: o Chairs Steering Committee Partnership we will invite John Settimi to attend. Ad hoc
needs, etc.
o Program Review Report
o Providing an opportunity for Programs to present short 5 minute report on
programs for suspension no real discussion
o Committee Charges and Liasions
I will attach. Should I send out to all committees now?
o Ombuds Committee forming.
o Ad Hoc Athletics Report continue. Add to charges to have a panel presentation
o Transparency Deb shared Checklist for committees. Maybe this should go on webpage?
o Website Needs kudos to Pauletta for updating this summer and keeping it relevant!
o Update on actions over the summer
o LMS Updates keep on FS agenda
o Summer School/Winter Break ProRating? Discussed. Keep on Budget committee
charges
o Committee Liaisons Below
o OTHER: Paula Kopacz Motion: The XC unanimously passed the following motion:
o That action to renovate, remodel, and remove and replace furniture from the
Faculty Lounge be suspended until such time as the Faculty is allowed to have input into
decision-making regarding the future function and usage of the space.
Shirley to communicate this to Dean Zeigler and Dean Gardner. (done 8/30/16)
o
I have heard from Senator Eser – he is going to have some motion from the floor. He will
send it to me next week.
Announcements:
Discussion about moving Senate Meeting in Sept to Perkins or other venue. Decision
was to keep as is.
(if any) SENATE STANDING COMMITTEES - Liaison Reports
Academic Quality Committee: last year: Senator O’Brien this year: Senator Givens (bylaws dictates)
Budget Committee: last year: Senator Ciocca this year: Senator Kopacz
Elections & University Nominations Committee: last year: Senator Elliott this year: Senator Gill Hunter
Faculty Welfare Committee: last year: Senator Kopacz this year: Senator Spieglman
XC_09-26-16 Page 2
Executive Committee Minutes August 29, 2016 Page 2
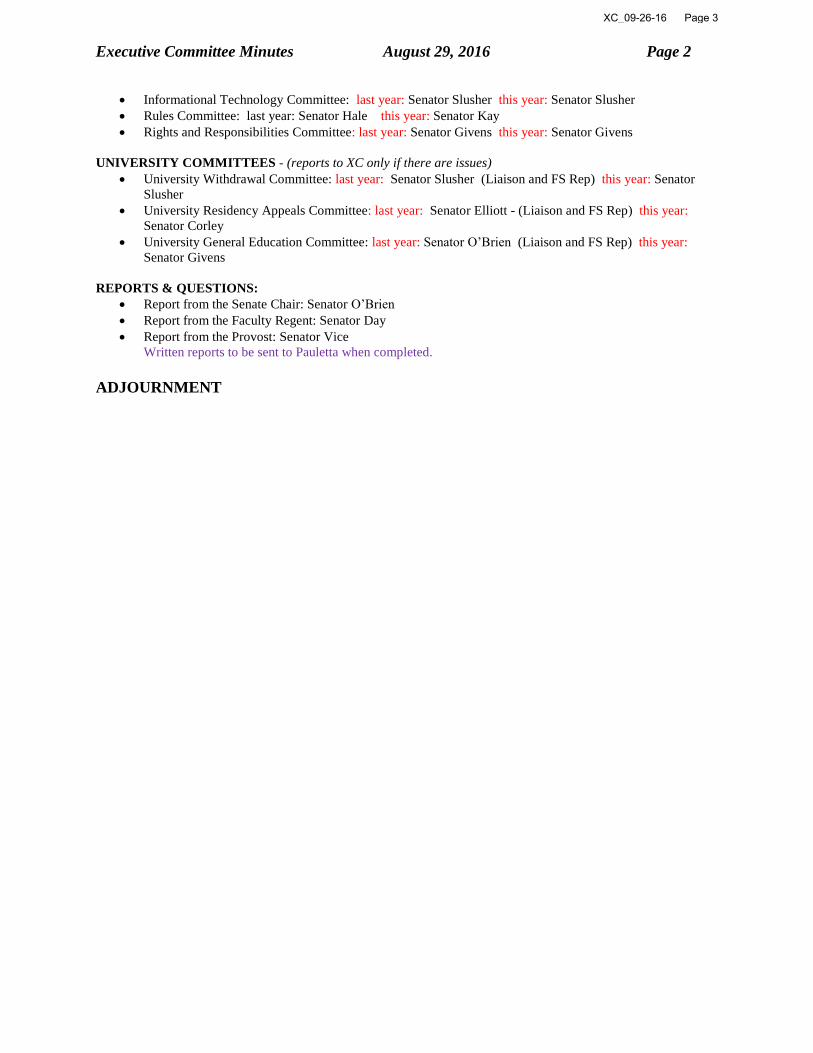
Informational Technology Committee: last year: Senator Slusher this year: Senator Slusher
Rules Committee: last year: Senator Hale this year: Senator Kay
Rights and Responsibilities Committee: last year: Senator Givens this year: Senator Givens
UNIVERSITY COMMITTEES - (reports to XC only if there are issues)
University Withdrawal Committee: last year: Senator Slusher (Liaison and FS Rep) this year: Senator
Slusher
University Residency Appeals Committee: last year: Senator Elliott - (Liaison and FS Rep) this year:
Senator Corley
University General Education Committee: last year: Senator O’Brien (Liaison and FS Rep) this year:
Senator Givens
REPORTS & QUESTIONS:
Report from the Senate Chair: Senator O’Brien
Report from the Faculty Regent: Senator Day
Report from the Provost: Senator Vice
Written reports to be sent to Pauletta when completed.
ADJOURNMENT
XC_09-26-16 Page 3

Comparative Humanities Updated September 20, 2016
1
May 31, 2016
BA in Comparative Humanities
Degree Production – Major (based on first and second major)
2008-09 2009-10 2010-11 2011-12 2012-13 2013-14 2014-15 2015-16 3-YR AVG 8-YR AVG
2 3 3 3 5 6 5 3 5 4
Declared Majors (Fall- based on first major)
2008 2009 2010 2011 2012 2013 2014 2015 8-YR AVG
7 8 12 11 12 5 9 8 9
Degree Production – Minor (based on first and second minor)
2008-09 2009-10 2010-11 2011-12 2012-13 2013-14 2014-15 2015-16 3-YR AVG 8-YR AVG
1 0 0 2 0 1 0 0 0 1
Faculty (2014-15) Full-Time Part-Time 2 tenured* 5 *1 faculty member is ½ reassigned to Honors/Chautauqua
Estimated maximum savings: $237,796 Estimated minimum savings: $67,425
Notes:
Completion percentages are cumulative: Of the 14 Comparative Humanities students, 3
have completed 50% or more program requirements. Of those 3, 2 have completed 75% or more program requirements. Of those 2, 0 have completed 90% or more program
requirements. In order to accurately pull program completion information, each program is analyzed separately. A student double majoring in two of these programs would be double counted. Estimated tuition revenue was calculated using the total tuition each HUM major paid for Fall 2016 and subtracting the amount of institutional aid received by each student. Estimated annual tuition revenue can be extrapolated by doubling the fall amount.
Profit from e-campus 2015-16 $15,459
Note: e-campus profit derives from HUM 300, a general education offering for e-campus programs.
02468
101214161820
2009 2010 2011 2012 2013 2014 2015 2016
Degree Productivity
Major Minor
Enrollment as of 9-13-16
Degree Program
#
Enrolled
Fall 2016
Total
Enrolled
Hours
Estimated
Total Fall
2016 Tuition
from majors
# Complete
50% or more
of program
# Complete
75% or more
of program
# Complete
90% or more
of program Freshmen Soph. Junior Senior
Comparative Humanities BA 14 162 $44,605 3 2 0 0 5 5 4
TOTAL 14 162 44,605$ 3 2 0 0 5 5 4
Salaries Benefits Total
Faculty $125,273 $45,098 $170,371
Part-time 2015-16 $62,200 $5,225 $67,425
Total $237,796
100% of part-time expenditures were for Gen Ed courses
XC_09-26-16 Page 4

Comparative Humanities Updated September 20, 2016
2
May 31, 2016
Course Enrollments Academic Year 2014-15 and 2015-16
Degree program started in 2008-09 2014-16 courses taught by FT faculty – 29 2014-16 courses taught by PT faculty – 42
Notes: 1. Capacity for this analysis is based on course cap, which is often set by the program and approved by the college. 2. Courses capped at “0” are not highlighted because the cap is a mechanism to control registration for the course.
General Education Major
Course CAP F14 S15 F15 S16* Course CAP F14 S15 F15 S16*
HUM 124 35 24 29 34 30 HUM 302 35 8
35 32 32 34 27 HUM 320 35 12
35 34 33 35 34 HUM 350 8 8
35 28 33 33 34 HUM 490 5 2 1 4
35 19 18 29 18 HUM 499 5 1 2 3 3
35 27 29 34 9 15 3 15 11
35 31 34 30 31
35 34 34 33 32
35 31 31 16 28
26 25^*
40 20^^
HUM 226 35 27 16 31 10
35 31 17 34 27
HUM 228 35 29 30 29 13
35 15
HUM 300 50 45^ 41^
50 45^ 41^
HUM 300W 25 13 14 18 14
25 21 50% -74% capacity
HUM 360** 30 14 27 25% - 49% capacity
486 364 517 334 1% - 24% capacity
^^ITV class Over Capacity ^e-campus ^*web
*Current as of 4/10/16 **Used both for Gen Ed and Major
General Education HUM 124 – Element 3A and 3B HUM 226 – Element 3A and 3B HUM 228 – Element 3A and 3B HUM 300 – Element 3A and 3B (also W) HUM 360 – Element 6
XC_09-26-16 Page 5

French Updated September 13, 2016
1
May 31, 2016
BA in French and BA in French Teaching
Degree Production – Major (based on first and second major)
2008-09 2009-10 2010-11 2011-12 2012-13 2013-14 2014-15 2015-16 3-YR AVG 8-YR AVG
6 6 2 3 5 7 5 0 4 4
Declared Majors (Fall – based on first major)
2008 2009 2010 2011 2012 2013 2014 2015 8-YR AVG
8 8 6 11 12 9 8 6 9
Degree Production – Minor (based on first and second minor)
2008-09 2009-10 2010-11 2011-12 2012-13 2013-14 2014-15 2015-16 3-YR AVG 8-YR AVG
2 3 3 1 4 3 2 2 2 3
French Teaching information is on Page 2
Faculty (2015-16) Full-Time Part-Time
1 Tenured 1 1 Tenure-track
Estimated maximum savings: $141,888 Estimated minimum savings: $76,276
Notes:
Completion percentages are cumulative: Of the 17 French students, 4 have Completed 50% or more program
requirements. Of those 4, 2 have completed 75% or more program requirements. Of those 2, 1 has completed 90% or more program requirements. In order to accurately pull program completion information, each program is analyzed separately. A student double majoring in two of these programs would be double counted.
Estimated tuition revenue was calculated using the total tuition each FRE major paid for Fall 2016 and subtracting the amount of institutional aid received by each student. Estimated annual tuition revenue can be extrapolated by doubling the fall amount.
02468
101214161820
2009 2010 2011 2012 2013 2014 2015 2016
Degree Productivity
Major Minor Teaching Major
Salaries Benefits Total
Faculty 96,040 34,574 130,614
Part-time 2015-16 10,400 874 11,274
Total 141,888
100% of part-time expenditures were for Gen Ed courses
Enrollment as of 9-13-16
Degree Program
#
Enrolled
Fall 2016
Total
Enrolled
Hours
Estimated
Total Fall
2016 Tuition
from majors
# Complete
50% or more
of program
# Complete
75% or more
of program
# Complete
90% or more
of program Freshmen Soph. Junior Senior
French BA 17 245 $45,984 4 2 1 1 9 5 2
French Minor 12 - - - - - 4 1 2 5French Teaching 0 0 0 0 0 0 0 0 0 0
29 245 $45,984 4 2 1 5 10 7 7
XC_09-26-16 Page 6

French Updated September 13, 2016
2
May 31, 2016
FRENCH TEACHING Degree Production – Major (based on first and second major)
2008-09 2009-10 2010-11 2011-12 2012-13 2013-14 2014-15 2015-16 3-YR AVG 8-YR AVG
0 1 0 2 1 0 0 0 0 1
Enrolled Majors (based on first major)
2008 2009 2010 2011 2012 2013 2014 2015 8-YR AVG
5 5 7 6 3 3 3 2 4
Course Enrollments Academic Year 2014-15 and 2015-16
Degree program started prior to 2001 2014-16 courses taught by FT faculty – 30 2014-16 courses taught by PT faculty – 6
Notes: 1. Capacity for this analysis is based on course cap, which is often set by the program and approved by the college. 2. Courses capped at “0” are not highlighted because the cap is a mechanism to control registration for the course.
General Education Major
Course CAP F14 S15 F15 S16* Course CAP F14 S15 F15 S16*
FRE 101 25 22 23 21 23 FRE 210 20 12
25 25 23 24 23 FRE 310 15 11
25 18 24 23 25 FRE 330 15 17
25 21 19 FRE 340 15 13
FRE 102 25 17 20 11 19 FRE 350 25 14
25 20 24 18 26 FRE 360 25 8
FRE 201 25 9 11 14 FRE 312 25 6
FRE 202 25 7 13 FRE 370 25 8
20 12 22 14 23 30
FCC 220 25 21
FCC 210 25 15 20
147 153 163 128 50% -74% capacity
25% - 49% capacity 1% - 24% capacity Over Capacity
*Current as of 4/10/16
General Education FRE 101 – Element 6 FRE 102 – Element 6 FRE 201 – Element 6 FRE 202 – Element 6
FCC 220 – Element 3B FCC 210 – Element 3B
XC_09-26-16 Page 7

Geography Updated September 20, 2016
1
May 31, 2016
BA in Geography
Degree Production – Major (based on first and second major)
2008-09 2009-10 2010-11 2011-12 2012-13 2013-14 2014-15 2015-16 3-YR AVG 8-YR AVG
17 10 10 8 7 10 7 4 7 9
Declared Majors (Fall – based on first major)
2008 2009 2010 2011 2012 2013 2014 2015 8-YR AVG
42 34 24 21 21 22 16 21 25
Degree Production – Minor (based on first and second major)
2008-09 2009-10 2010-11 2011-12 2012-13 2013-14 2014-15 2015-16 3-YR AVG 8-YR AVG
7 5 2 4 2 1 3 3 2 3
Degree Production – GIS Minor (based on first and second major)
2008-09 2009-10 2010-11 2011-12 2012-13 2013-14 2014-15 2015-16 3-YR AVG 7-YR AVG
0 0 0 1 0 0 1 0 0 0
Faculty (2015-16) Full-Time Part-Time 3 Tenured 5 1 Tenure-track 2 lecturers
Estimated maximum savings: $483,200 Estimated minimum savings: $248,777
Notes:
Completion percentages are cumulative: Of the 27 Geography students, 17 have completed
50% or more program requirements. Of those 17, 10 have completed 75% or more program requirements. Of those 10, 9 have completed 90% or more program requirements. In order to accurately pull program completion information,
each program is analyzed separately. A student double majoring in two of these programs would be double counted. Estimated tuition revenue was calculated using the total tuition each GEO major paid for Fall 2016 and subtracting the amount of institutional aid received by each student. Estimated annual tuition revenue can be extrapolated by doubling the fall amount.
Profit from e-campus 2015-16 $51,317
Note: e-campus profit derives from GEO 210, a general education offering for e-campus programs and GEO 353, a supporting course for Homeland Security online.
02468
101214161820
2009 2010 2011 2012 2013 2014 2015 2016
Degree Productivity
Major Minor
Salaries Benefits Total
Faculty 324,066 116,664 440,730
Part-time 2015-16 39,179 3,291 42,470
Total 483,200
83% of part-time expenditures were for Gen Ed courses
Enrollment as of 9-13-16
Degree Program
#
Enrolled
Fall 2016
Total
Enrolled
Hours
Estimated
Total Fall
2016 Tuition
from majors
# Complete
50% or more
of program
# Complete
75% or more
of program
# Complete
90% or more
of program Freshmen Soph. Junior Senior
Geography BA 27 366 $90,022 17 10 9 1 4 5 17
Geography Minor 5 - - - - - 0 0 1 4
TOTAL 32 366 $90,022 17 10 9 1 4 6 21
XC_09-26-16 Page 8

Geography Updated September 20, 2016
2
May 31, 2016
Course Enrollments Academic Year 2014-15 and 2015-16
Degree program started prior to 2001 2014-16 courses taught by FT faculty – 90 2014-16 courses taught by PT faculty – 38
^e-campus (with facilitators) ^* web class ^^Corbin ~ Manchester Notes: 1. Capacity for this analysis is based on course cap, which is often set by the program and approved by the college.
2. Courses capped at “0” are not highlighted because the cap is a mechanism to control registration for the course.
General Education Major
Course CAP F14 S15 F15 S16* Course CAP F14 S15 F15 S16*
GEO 100 24 23 23 GEO 300 24 12 9 6
45` 27 40 44 32 24 8
45` 38 41 45 GEO 302 35 13
45` 44 39 45 GEO 315 35 26 25 27 25
45 44 43 GEO 322 24 17 10
24 8^^ 22^^ GEO 325 15 13 9
24 25 GEO 343 24 23
24 24 GEO 347 24 10 9 13
GEO 110 24 24 GEO 351 24 14
24 24 GEO 353 24 22 24 24 23
GEO 115 60 29 28 17 24 25 25 23 24
GEO 210 24 23 22 24 23 24 22
24 24 23 22 24 GEO 405 25 9
24 23 22 24 20 GEO 430 10 5
24 22 23 23 20 GEO 453 24 21 24
24 22 24 19 24 GEO 455 24 19
24 23^* 24 24 23 GEO 456 24 24 23 24 18
24- 24 23 22 14^* 24 15
24> 23^* 24 25^* 22^* GEO 458 24 12 15
24> 21 24 18^* 25^* GEO 490 24 12 8
24> 24 24 21^* 24^* GEO 498 0 3 3 1 3
24> 20 24 19~ 25^* 0 1
24> 22 25^* GEO 501 14 13
24 22 23 19 13
24 22 14 173 217 170 187
24 18 22 50% -74% capacity
24 26~ 25% - 49% capacity
50 46^ 1% - 24% capacity
50 41^ Over Capacity
75 74^ `Cap was “40” in Spring 15 and Spring 16 and “47” in Fall 15 -Cap was 15 in Spring 16 >Cap was 25 in Spring 16
GEO 220 45` 32 21
581 489 581 477
General Education GEO 110 – Element 4 GEO 210 – Element 4 GEO 100 – Element 5B GEO 220 – Element 5B
Supporting/Required Courses for Various Programs GEO 115 GEO 355* GEO 315 GEO 453 GEO 322* GEO 456 GEO 353 *for program on the watch list
XC_09-26-16 Page 9

Horticulture Updated September 13, 2016
1
May 31, 2016
BS in Horticulture
Degree Production – Major (based on first and second major)
2008-09 2009-10 2010-11 2011-12 2012-13 2013-14 2014-15 2015-16 3-YR AVG 8-YR AVG
4 11 8 8 10 4 2 2 3 6
Declared Majors (Fall – based on first major)
2008 2009 2010 2011 2012 2013 2014 2015 8-YR AVG
46 44 44 37 40 17 24 25 35
Degree Production – Minor (based on first and second minor)
2008-09 2009-10 2010-11 2011-12 2012-13 2013-14 2014-15 2015-16 3-YR AVG 8-YR AVG
1 0 0 1 0 1 0 0 0 0
Faculty (2015-16) Full-Time Part-Time 1 Tenured* 1 1 Tenure-track *1/2 time to the Agriculture program
Estimated maximum savings: $152,685 Estimated minimum savings: $81,100
Notes: Completion percentages are
cumulative: Of the 25 Geography students, 14 have completed 50% or more program requirements. Of those 14, 4 have completed 75% or more program requirements. Of those 4, 1 has
completed 90% or more program requirements. In order to accurately pull program completion information, each program is analyzed separately. A student double majoring in two of these programs would be double counted. Estimated tuition revenue was calculated using the total tuition each OHO major paid for Fall 2016 and subtracting the amount of institutional aid received by each student. Estimated annual tuition revenue can be extrapolated by doubling the fall amount.
02468
101214161820
2009 2010 2011 2012 2013 2014 2015 2016
Degree Productivity
Major Minor
Enrollment as of 9-13-16
Degree Program
#
Enrolled
Fall 2016
Total
Enrolled
Hours
Estimated
Total Fall
2016 Tuition
from majors
# Complete
50% or more
of program
# Complete
75% or more
of program
# Complete
90% or more
of program Freshmen Soph. Junior Senior
Horticulture BS 25 355 $103,794 14 4 1 4 3 7 11
TOTAL 25 355 $103,794 14 4 1 4 3 7 11
Salaries Benefits Total
Faculty $82,539 $27,502 $110,041
Part-time 2015-16 $3,200 $256 $3,456
Total $113,497
XC_09-26-16 Page 10
Horticulture Updated September 13, 2016
2
May 31, 2016
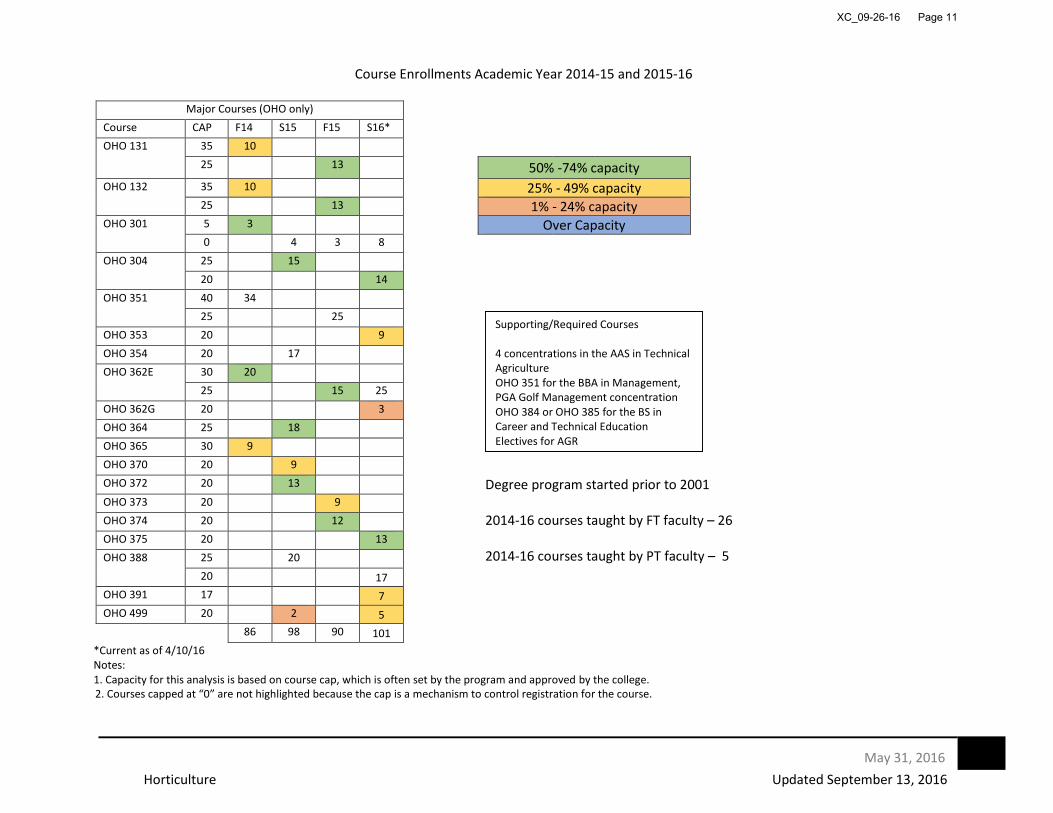
Course Enrollments Academic Year 2014-15 and 2015-16
2. Courses capped at “0” are not highlighted because the cap is a mechanism to control registration for the course.
Major Courses (OHO only) Course CAP F14 S15 F15 S16* OHO 131 35 10 25 13 50% -74% capacity
OHO 132 35 10 25% - 49% capacity 25 13 1% - 24% capacity OHO 301 5 3 Over Capacity 0 4 3 8 OHO 304 25 15
20 14 OHO 351 40 34 25 25 OHO 353 20 9 OHO 354 20 17 OHO 362E 30 20 25 15 25 OHO 362G 20 3 OHO 364 25 18 OHO 365 30 9 OHO 370 20 9 OHO 372 20 13 Degree program started prior to 2001
2014-16 courses taught by FT faculty – 26 2014-16 courses taught by PT faculty – 5
OHO 373 20 9 OHO 374 20 12 OHO 375 20 13 OHO 388 25 20 20 17 OHO 391 17 7 OHO 499 20 2 5 86 98 90 101
*Current as of 4/10/16 Notes: 1. Capacity for this analysis is based on course cap, which is often set by the program and approved by the college.
Supporting/Required Courses 4 concentrations in the AAS in Technical Agriculture OHO 351 for the BBA in Management, PGA Golf Management concentration OHO 384 or OHO 385 for the BS in Career and Technical Education Electives for AGR
XC_09-26-16 Page 11

Journalism Updated September 13, 2016
1
May 31, 2016
BA in Journalism
Degree Production – Major (based on first and second major)
2008-09 2009-10 2010-11 2011-12 2012-13 2013-14 2014-15 2015-16 3-YR AVG 8-YR AVG
12 10 7 11 6 4 6 6 5 8
Declared Majors (Fall – based on first major)
2008 2009 2010 2011 2012 2013 2014 2015 8-YR AVG
59 48 46 34 32 37 40 42 42
Degree Production – Minor (based on first and second minor)
2008-09 2009-10 2010-11 2011-12 2012-13 2013-14 2014-15 2015-16 3-YR AVG 8-YR AVG
2 3 2 3 4 1 1 1 1 2
Faculty (2015-16) Full-Time Part-Time 2 Tenured 3 1 Lecturer
Estimated maximum savings: $250,929 Estimated minimum savings: $78,276
Notes: Completion percentages are cumulative: Of the 43 Journalism students, 17 have completed 50% or more program requirements. Of those 17, 7 have completed 75% or more program requirements. Of those 7, 6 have completed 90% or more program requirements. In order to accurately pull program completion information, each program is analyzed separately. A student double majoring in two of these programs would be double counted. Estimated tuition revenue was calculated using the total tuition each JOU major paid for Fall 2016 and subtracting the amount of institutional aid received by each student. Estimated annual tuition revenue can be extrapolated by doubling the fall amount.
Salaries Benefits Total
Faculty $181,882 $65,478 $247,360
Part-time 2015-16 $3,200 $269 $3,469
Total $250,82902468
101214161820
2009 2010 2011 2012 2013 2014 2015 2016
Degree Productivity
Major Minor
Enrollment as of 9-13-16
Degree Program
#
Enrolled
Fall 2016
Total
Enrolled
Hours
Estimated
Total Fall
2016 Tuition
from majors
# Complete
50% or more
of program
# Complete
75% or more
of program
# Complete
90% or more
of program Freshmen Soph. Junior Senior
Journalism BA 43 644 $117,476 17 7 6 12 11 10 10
Journalism Minior 13 - - - - - 1 3 6 3
TOTAL 56 644 $117,476 17 7 6 13 14 16 13
XC_09-26-16 Page 12

Journalism Updated September 13, 2016
2
May 31, 2016
Course Enrollments Academic Year 2014-15 and 2015-16
Degree program started prior to 2001 2014-16 courses taught by FT faculty – 27 2014-16 courses taught by PT faculty – 1
Notes: 1. Capacity for this analysis is based on course cap, which is often set by the program and approved by the college. 2. Courses capped at “0” are not highlighted because the cap is a mechanism to control registration for the course.
Major
Course CAP F14 S15 F15 S16*
JOU 302 0 9 6 11 7
JOU 305W 18 17 14 15 14
18 16 16
JOU 310 18 15 11
JOU 320 18 18 17 19
23 16
JOU 325 22 22 20 22
25 25
JOU 401 18 13 8
JOU 412 16 23
16 22
22 23
JOU 491 18 5 10
2 2
102 133 88 93
50% -74% capacity 25% - 49% capacity 1% - 24% capacity
Over Capacity
*Current as of 4/10/16
XC_09-26-16 Page 13
Social Intelligence and Leadership Updated September 13, 2016
1
May 31, 2016
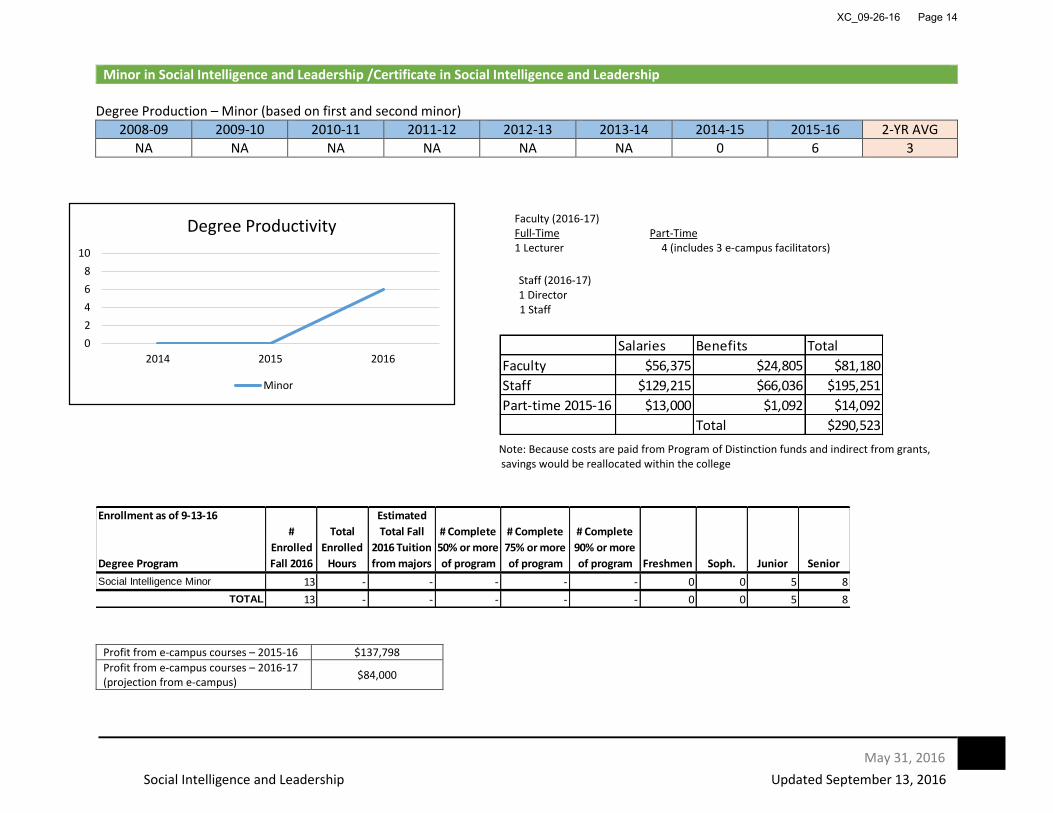
Minor in Social Intelligence and Leadership /Certificate in Social Intelligence and Leadership
Degree Production – Minor (based on first and second minor)
2008-09 2009-10 2010-11 2011-12 2012-13 2013-14 2014-15 2015-16 2-YR AVG
NA NA NA NA NA NA 0 6 3
Faculty (2016-17) Full-Time Part-Time 1 Lecturer 4 (includes 3 e-campus facilitators)
Staff (2016-17) 1 Director 1 Staff
Note: Because costs are paid from Program of Distinction funds and indirect from grants, savings would be reallocated within the college
Enrollment as of 9-13-16
Degree Program
#
Enrolled
Fall 2016
Total
Enrolled
Hours
Estimated
Total Fall
2016 Tuition
from majors
# Complete
50% or more
of program
# Complete
75% or more
of program
# Complete
90% or more
of program Freshmen Soph. Junior Senior
Social Intelligence Minor 13 - - - - - 0 0 5 8
TOTAL 13 - - - - - 0 0 5 8
Profit from e-campus courses – 2015-16 $137,798
Profit from e-campus courses – 2016-17 (projection from e-campus)
$84,000
0
2
4
6
8
10
2014 2015 2016
Degree Productivity
Minor
Salaries Benefits Total
Faculty $56,375 $24,805 $81,180
Staff $129,215 $66,036 $195,251
Part-time 2015-16 $13,000 $1,092 $14,092
Total $290,523
XC_09-26-16 Page 14
Social Intelligence and Leadership Updated September 13, 2016
2
May 31, 2016
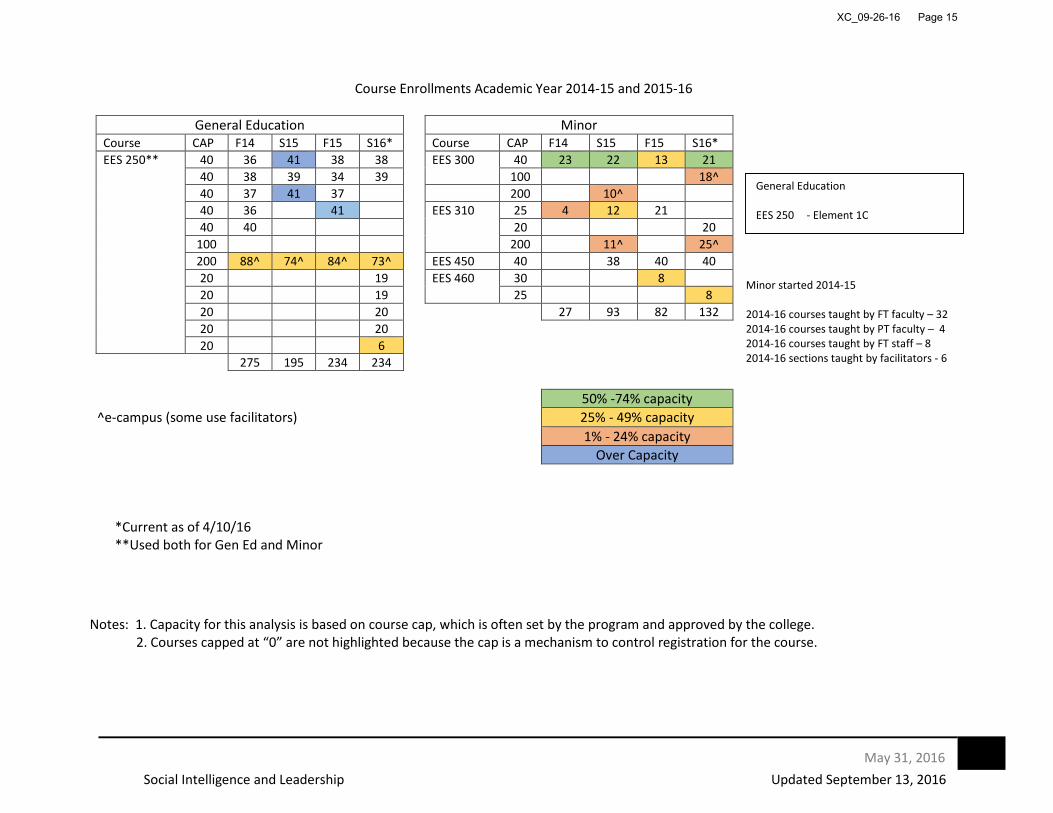
Course Enrollments Academic Year 2014-15 and 2015-16
Minor started 2014-15 2014-16 courses taught by FT faculty – 32 2014-16 courses taught by PT faculty – 4 2014-16 courses taught by FT staff – 8 2014-16 sections taught by facilitators - 6
Notes: 1. Capacity for this analysis is based on course cap, which is often set by the program and approved by the college. 2. Courses capped at “0” are not highlighted because the cap is a mechanism to control registration for the course.
General Education Minor Course CAP F14 S15 F15 S16* Course CAP F14 S15 F15 S16*
EES 250** 40 36 41 38 38 EES 300 40 23 22 13 21
40 38 39 34 39 100 18^
40 37 41 37 200 10^
40 36 41 EES 310 25 4 12 21
40 40 20 20
100 200 11^ 25^
200 88^ 74^ 84^ 73^ EES 450 40 38 40 40
20 19 EES 460 30 8
20 19 25 8
20 20 27 93 82 132
20 20
20 6
275 195 234 234
50% -74% capacity
^e-campus (some use facilitators) 25% - 49% capacity
1% - 24% capacity
Over Capacity
*Current as of 4/10/16 **Used both for Gen Ed and Minor
General Education EES 250 - Element 1C
XC_09-26-16 Page 15

Technical Writing Updated September 20, 2016
1
July 11, 2016
BA English – Technical Writing Concentration Degree Production – Major (based on first and second major)
2008-09 2009-10 2010-11 2011-12 2012-13 2013-14 2014-15 2015-16 3-YR AVG 8-YR AVG
6 2 5 2 2 3 7 6 5 4
Declared Majors (Fall –based on first major)
2008 2009 2010 2011 2012 2013 2014 2015 8-YR AVG
16 10 9 8 13 17 16 15 13
Concentration added in 2003
No part-time faculty used in 2014-2016
No faculty taught exclusively technical writing courses – 2 faculty are roughly ½ time to technical writing
Technical writing concentration has three courses exclusive to the concentration
Any cost savings would likely come from reassignment to courses in other English programs and other efficiencies resulting in fewer department courses taught by part-time faculty.
Notes: Completion percentages are cumulative: Of the 12 Technical Writing students, 12 have completed 50% or more program requirements. Of those 12, 12 have completed 75% or more program requirements. Of those 12, 10 have completed 90% or more program requirements. In order to accurately pull program completion information, each program is analyzed separately. A student double majoring in two of these programs would be double counted. Estimated tuition revenue was calculated using the total tuition each Tech Writing major paid for Fall 2016 and subtracting the amount of institutional aid received by each student. Estimated annual tuition revenue can be extrapolated by doubling the fall amount.
Profit from e-campus 2015-16 $9,881
Note: e-campus profit derives from ENG 300, a supporting course for the online paralegal program.
Salaries Benefits Total
Faculty $35,560 $12,802 $48,362
Salaries adjusted to reflect workload in Tech Writing major
Enrollment as of 9-13-16
Degree Program
#
Enrolled
Fall 2016
Total
Enrolled
Hours
Estimated
Total Fall
2016 Tuition
from majors
# Complete
50% or more
of program
# Complete
75% or more
of program
# Complete
90% or more
of program Freshmen Soph. Junior Senior
Technical Writing Concentration 12 167 $32,270 12 12 10 0 3 5 4
TOTAL 12 167 $32,270 12 12 10 0 3 5 4
0
2
4
6
8
10
12
14
16
18
20
2009 2010 2011 2012 2013 2014 2015 2016
Degree Productivity
Major
XC_09-26-16 Page 16
Technical Writing Updated September 20, 2016
2
July 11, 2016
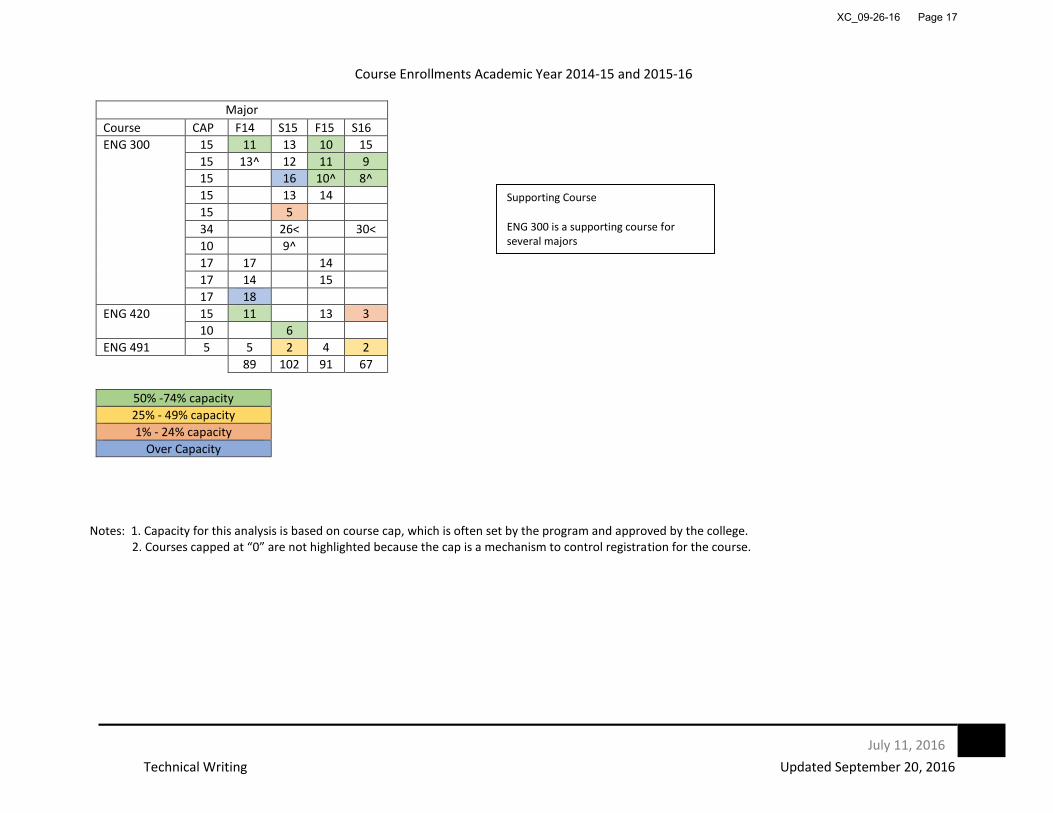
Course Enrollments Academic Year 2014-15 and 2015-16
Notes: 1. Capacity for this analysis is based on course cap, which is often set by the program and approved by the college. 2. Courses capped at “0” are not highlighted because the cap is a mechanism to control registration for the course.
Major
Course CAP F14 S15 F15 S16
ENG 300 15 11 13 10 15
15 13^ 12 11 9
15 16 10^ 8^
15 13 14
15 5
34 26< 30<
10 9^
17 17 14
17 14 15
17 18
ENG 420 15 11 13 3
10 6
ENG 491 5 5 2 4 2
89 102 91 67
50% -74% capacity
25% - 49% capacity
1% - 24% capacity
Over Capacity
Supporting Course ENG 300 is a supporting course for several majors
XC_09-26-16 Page 17

Theatre Updated September 13, 2016
1
May 31, 2016
BA English – Theatre Concentration Degree Production – Major (based on first and second major)
2008-09 2009-10 2010-11 2011-12 2012-13 2013-14 2014-15 2015-16 3-YR AVG 8-YR AVG
1 1 5 2 5 8 2 1 4 3
Declared Majors (Fall –based on first major)
2008 2009 2010 2011 2012 2013 2014 2015 8-YR AVG
8 19 23 22 17 19 15 21 18
Degree Production – Minor (based on first and second minor)
2008-09 2009-10 2010-11 2011-12 2012-13 2013-14 2014-15 2015-16 3-YR AVG 8-YR AVG
1 1 0 2 0 4 0 2 2 1
Faculty (2015-16) Full-Time 2 tenured 1 tenure-track 1 visiting Part Time 4 Estimated maximum savings: $440,476
Estimated minimum savings: $271,734
Notes: Completion percentages are cumulative: Of the 34 Theatre students, 12 have completed 50% or more program requirements. Of those 12, 10 have completed 75% or more program requirements. Of those 10, 4 have completed 90% or more program requirements. In order to accurately pull program completion information, each program is analyzed separately. A student double
majoring in two of these programs would be double counted. Estimated tuition revenue was calculated using the total tuition each THE major paid for Fall 2016 and subtracting the amount of institutional aid received by each student. Estimated annual tuition revenue can be extrapolated by doubling the fall amount.
02468
101214161820
2009 2010 2011 2012 2013 2014 2015 2016
Degree Productivity
Major Minor
Degree Program
#
Enrolled
Fall 2016
Total
Enrolled
Hours
Estimated
Tuition
Revenue
# Complete
50% or more
of program
# Complete
75% or more
of program
# Complete
90% or more
of program Freshmen Soph. Junior Senior
English BA w Concentration in
Theatre 34 471.5 $125,306 12 10 4 9 6 8 11English Teaching BA w Concentration
in Theatre Teaching 9 134 $28,206 1 0 0 3 4 0 2
Theatre Minor 19 - - - - - 1 5 7 6
TOTAL 62 605.5 $153,512 13 10 4 13 15 15 19
Salaries Benefits Total
Faculty $235,015 $84,605 $319,620
Staff $28,255 $22,321 $50,576
$370,196
Operating $21,344
Part-time 2015-16 $59,164 $4,970 $64,134
($15,198)
Total $440,476
61% of part-time expenditures were for Gen Ed courses
Adjustment for box office receipts
XC_09-26-16 Page 18

Theatre Updated September 13, 2016
2
May 31, 2016
Theatre Teaching Degree Production – Major (based on first and second major)
2008-09 2009-10 2010-11 2011-12 2012-13 2013-14 2014-15 2015-16 3-YR AVG 8-YR AVG
0 1 1 1 0 0 0 1 0 1
Declared Majors Theatre Teaching (Fall - based on first major)
2008-09 2009-10 2010-11 2011-12 2012-13 2013-14 2014-15 2015-16 3-YR AVG 8-YR AVG
7 8 6 4 5 7 7 7 7 6
Course Enrollments Academic Year 2014-15 and 2015-16
1990’s BA in Theatre Arts (in different department) 2001 – BFA in Performing Arts (in English department) 2006 – BA in English, theatre concentration 2014-16 courses taught by FT faculty – 46 2014-16 courses taught by PT faculty – 28
Notes: 1. Capacity for this analysis is based on course cap, which is often set by the program and approved by the college. 2. Courses capped at “0” are not highlighted because the cap is a mechanism to control registration for the course.
General Education Major
Course CAP F14 S15 F15 S16* Course CAP F14 S15 F15 S16*
THE 100 30 26 29 30 29 THE 110 20 21 12
30 26 27 29 8 THE 130 20 16 12 11 13
30 30 19 29 29 THE 135 15 13
30 30 26 10 30 15 10
30 29 29 16 27 24 15 11
30 9 26 26 16 THE 150 20 17
30 24 28 THE 200 16 17
30 17 THE 210 25 11 7
THE 135 18 16 THE 220 20 18 17
18 17 THE 235 20 13 16
THE 390** 25 16 THE 285 25 10 9
THE 391** 30 19 9 THE 300 24 7 6
166 199 185 181 THE 320 20 13 18
THE 330 20 6 7 9 7
*Current as of 4/10/16 THE 335 25 10
**Used both for Gen Ed and Major THE 340 25 6
THE 341 12 11
10 6
50% -74% capacity THE 430 8 7 5
25% - 49% capacity THE 348 10 8
1% - 24% capacity THE 490 0 7 8
Over Capacity THE 495 25 1 7
10 1
111 95 122 91
General Education THE 100 – Element 3A THE 135 – Element 3A THE 390 – Element 3A and 3B THE 391 – Element 3A and 3B
XC_09-26-16 Page 19

XC_09-26-16 Page 20
XC_09-26-16 Page 21

XC_09-26-16 Page 22

XC_09-26-16 Page 23
XC_09-26-16 Page 24

XC_09-26-16 Page 25


![:hE>h/^ ZME EKU^ ]} o d^ /vP v] ](] ] v ohv]À ] ^ À]ooU Zd ...etsie.us.es/sites/default/files/ficheros/file/programas-eng... · :hE>h/^ ZME EKU^ ]} o d^ /vP v] _ ](] ] v ohv]À](https://static.fdocuments.net/doc/165x107/601cab457dc8f4112766982b/heh-zme-eku-o-d-vp-v-v-ohv-oou-zd-etsieusessitesdefaultfilesficherosfileprogramas-eng.jpg)

![:hE>h/^ ZME EKU^ ]} o d^ /vP v] ](] ] v ohv]À ] ^ À]ooU ...etsie.us.es/sites/default/files/ficheros/file/programas-eng... · :hE>h/^ ZME EKU^ ]} o d^ /vP v] _ ](] ] v ohv]À ] ^](https://static.fdocuments.net/doc/165x107/5fdaecc660aeac0e4d6dc64b/heh-zme-eku-o-d-vp-v-v-ohv-oou-etsieusessitesdefaultfilesficherosfileprogramas-eng.jpg)


