Exco Technologies Limited Investor Presentation. Principal Businesses Casting and Extrusion...
23
Exco Technologies Limited Investor Presentation
-
Upload
kory-kennedy -
Category
Documents
-
view
224 -
download
2
Transcript of Exco Technologies Limited Investor Presentation. Principal Businesses Casting and Extrusion...

Exco Technologies Limited
Investor Presentation

Principal Businesses
Casting and Extrusion Technology
Automotive Solutions
2003 Sales$231 million

Fiscal 2003
Sales $231M
Net Income $17.1M
EPS (1) $0.41
(1) Post-split
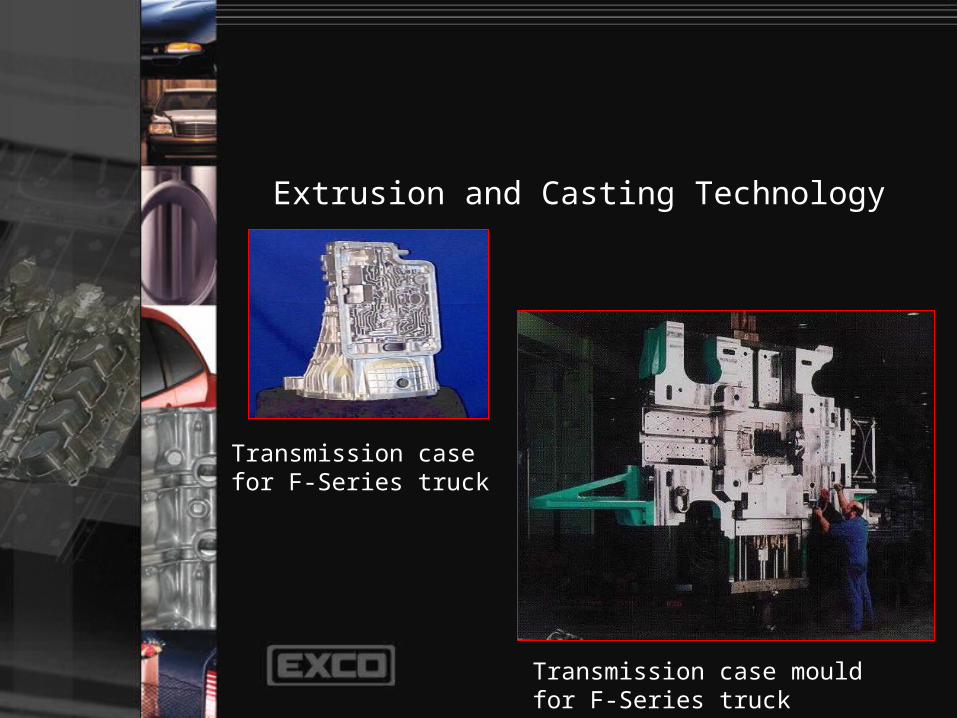
Extrusion and Casting Technology
Transmission case mould for F-Series truck
Transmission casefor F-Series truck

Extrusion and Casting Technology
Aluminiumextrusion dies
Extrusions for commercial construction

Extrusion and Casting Technology
Multi-Slide zincdie-casting machine
Zincdie-castings

Extrusion and Casting Technology
Competitive Edge
• Significant barriers to entry
• Low cost producer
• Diverse customer and product base
• World’s largest in product niche

Extrusion and Casting Technology
Opportunities For Growth
• Automakers strive for fuel efficiency
• Extrusion tooling market share less than 15%
• Consolidation of aluminium extruders
• Market for magnesium die-cast machine
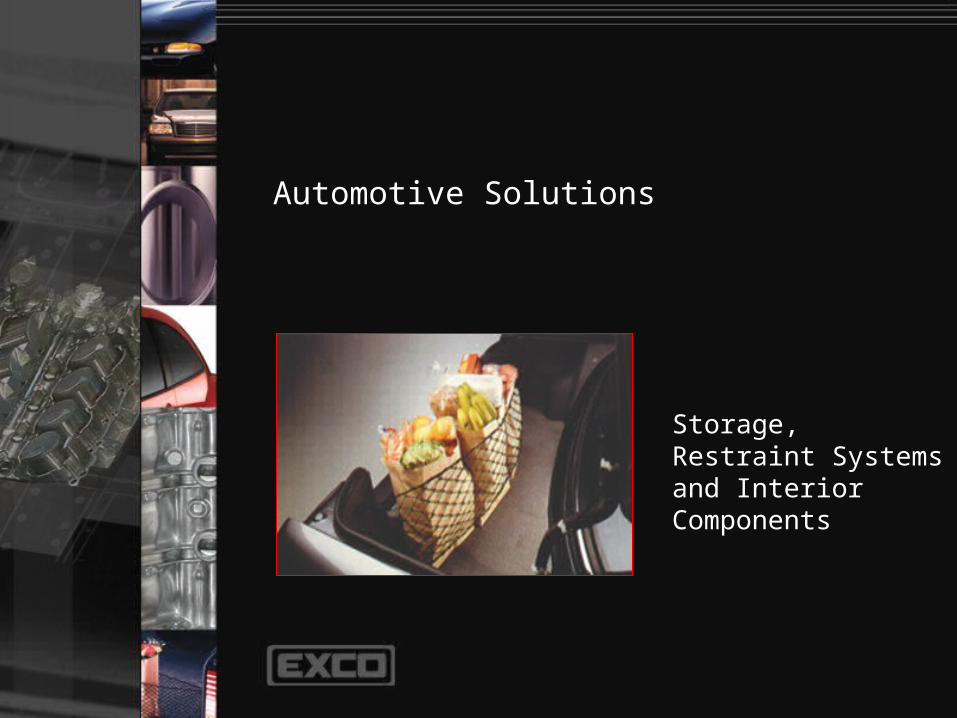
Automotive Solutions
Storage,Restraint Systemsand Interior Components

Automotive Solutions
Cargo Systems

Automotive Solutions
Painted Laser Etched Components

Automotive Solutions
Competitive Edge
• Low-cost producer – Mexican and Moroccan facility
• Niche product line

Automotive Solutions
Opportunities for Growth
• Barrier nets for vehicle safety
• Penetrate European market
• Market for storage products increasing

Corporate Culture
• Divisions run as profit centres
• Plant Managers’ bonus tied to plant profit performance
• Employees are shareholders
• Highly skilled and union-free workforce

Corporate Governance
• Independent Board of Directors
• One class of common shares
• Majority of stock options are “purchased”

Dividend Policy
• Annual dividend of $0.05 per share
• Demonstrates confidence in future

Sales
Sales
118.3 118.1
184.1
213.1230.5
0
30
60
90
120
150
180
210
240
1999 2000 2001 2002 2003
($ m
illi
on
s)
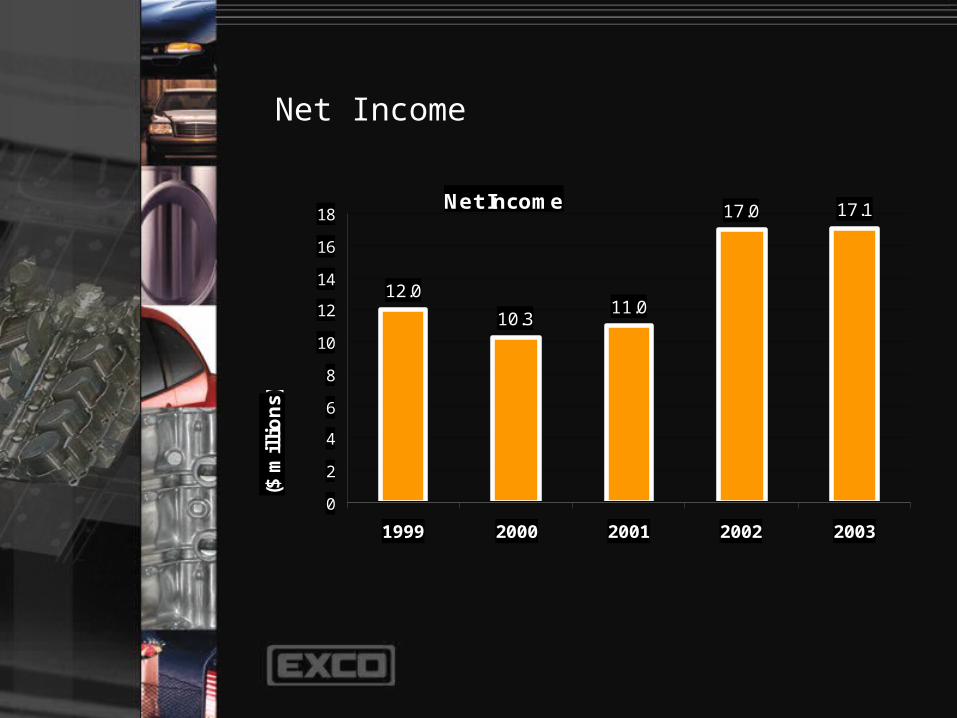
Net Income
Net Income
12.0
10.311.0
17.0 17.1
0
2
4
6
8
10
12
14
16
18
1999 2000 2001 2002 2003
($ m
illi
on
s)

Sales $230.5 $213.1
Net income $17.1 $17.0
EBITDA $44.0 $43.4
Cash flow from operations $32.2 $32.0
EPS (1) –diluted $0.41 $0.42
(1) Post-split
2003 Financial Results
Twelve Months Ended September 30
2003 2002
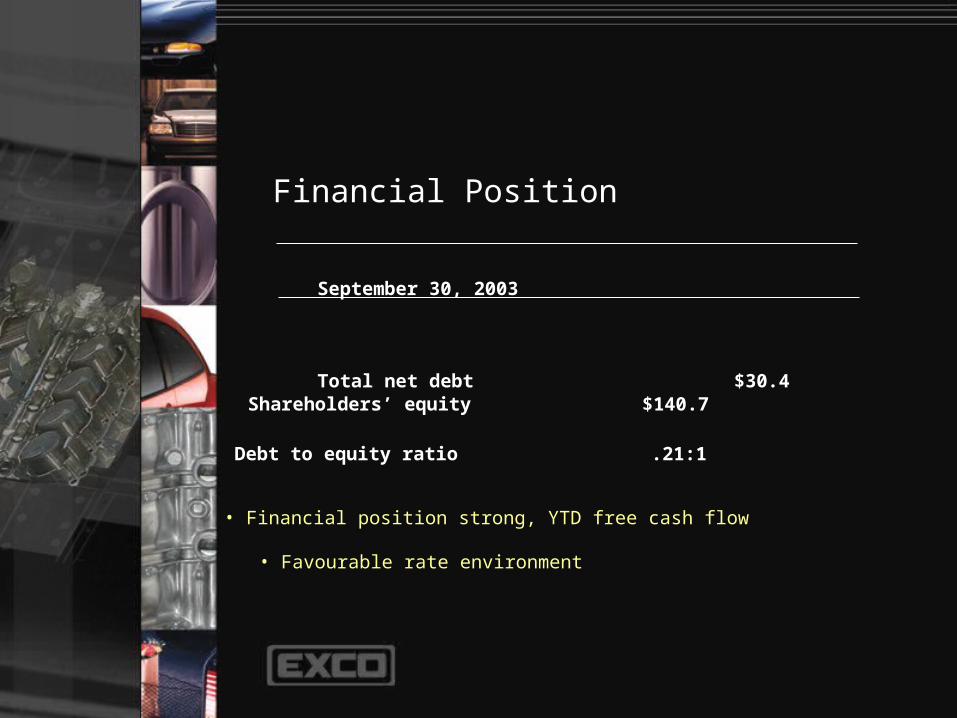
Shareholders’ equity $140.7
Debt to equity ratio .21:1
• Financial position strong, YTD free cash flow
• Favourable rate environment
Financial Position
September 30, 2003
Total net debt $30.4

Return on Capital Employed (1)
2003 18%
• Excellent return
(1) Calculated as EBIT divided by shareholders’ equity plus total debt

EBITDA margin 19% 20% 20% 25% 27%
• Exceptional margins
Margins
2003 2002 2001 2000 1999
Gross margin 35% 36% 36% 39% 40%

Foundation for Growth
• Outstanding long-term financial trends
• New products and new markets
• Investment in technology and capacity


![[09.10.24] Exco Talk](https://static.fdocuments.net/doc/165x107/54821b29b4af9faa0d8b46c9/091024-exco-talk.jpg)