Exciton Transport and Diffusion Length in Polymers with Electron Acceptor End … · ·...
39
1 Charge Transfer Fluorescence and 34 nm Exciton Diffusion Length in Polymers with Electron Acceptor End Traps Lori Zaikowski 1,2* , Gina Mauro 1,2 , Matthew Bird, 2 Brianne Karten 1 , Sadayuki Asaoka 4,† , Qin Wu 3 , Andrew R. Cook, 2 and John R. Miller 2 * 1 Chemistry and Physics Department, Dowling College, Oakdale, NY 2 Chemistry Department, Brookhaven National Laboratory, Upton, NY 3 Center for Functional Nanomaterials, Brookhaven National Laboratory, Upton, NY 4 Department of Biomolecular Engineering, Kyoto Institute of Technology, Matsugasaki, Sakyo-ku, Kyoto 606- 8585, Japan *Correspondence: [email protected] Abstract Photoexcitation of conjugated poly-2,7-(9,9-dihexylfluorene) polyfluorenes with naphthylimide (NI) and anthraquinone (AQ) electron-acceptor end traps produces excitons that form charge transfer states at the end traps. Intramolecular singlet exciton transport to end traps was examined by steady state fluorescence for polyfluorenes of 17 to 127 repeat units in chloroform, dimethylformamide (DMF), tetrahydrofuran (THF), and p-xylene. End traps capture excitons and form charge transfer (CT) states at all polymer lengths and in all solvents. The CT nature of the end-trapped states is confirmed by their fluorescence spectra, solvent and trap group dependence and DFT descriptions. Quantum yields of CT fluorescence are as large as 46%. This strong CT emission is understood in terms of intensity borrowing. Energies of the CT states from onsets of the fluorescence spectra give the depths of the traps which vary with solvent polarity. For NI end traps the trap depths are 0.06 (p-xylene), 0.13 (THF) and 0.19 eV (CHCl 3 ). For AQ, CT fluorescence could be observed only in p-xylene where the trap depth is 0.27 eV. Quantum yields, emission energies, charge transfer energies, solvent reorganization and vibrational energies were calculated. Fluorescence measurements on chains >100 repeat units indicate that end traps capture ~50% of the excitons, and that the exciton diffusion length L D =34 nm, which is much larger than diffusion lengths reported in polymer films or than previously BNL-108317-2015-JA
Transcript of Exciton Transport and Diffusion Length in Polymers with Electron Acceptor End … · ·...

1
Charge Transfer Fluorescence and 34 nm Exciton Diffusion Length in Polymers with
Electron Acceptor End Traps
Lori Zaikowski1,2*, Gina Mauro1,2, Matthew Bird,2 Brianne Karten1, Sadayuki Asaoka4,†, Qin
Wu3, Andrew R. Cook,2 and John R. Miller2 *
1Chemistry and Physics Department, Dowling College, Oakdale, NY 2Chemistry Department, Brookhaven National Laboratory, Upton, NY 3Center for Functional Nanomaterials, Brookhaven National Laboratory, Upton, NY 4 Department of Biomolecular Engineering, Kyoto Institute of Technology, Matsugasaki, Sakyo-ku, Kyoto 606-
8585, Japan
*Correspondence: [email protected]
Abstract
Photoexcitation of conjugated poly-2,7-(9,9-dihexylfluorene) polyfluorenes with
naphthylimide (NI) and anthraquinone (AQ) electron-acceptor end traps produces excitons that
form charge transfer states at the end traps. Intramolecular singlet exciton transport to end traps
was examined by steady state fluorescence for polyfluorenes of 17 to 127 repeat units in
chloroform, dimethylformamide (DMF), tetrahydrofuran (THF), and p-xylene. End traps capture
excitons and form charge transfer (CT) states at all polymer lengths and in all solvents. The CT
nature of the end-trapped states is confirmed by their fluorescence spectra, solvent and trap
group dependence and DFT descriptions. Quantum yields of CT fluorescence are as large as
46%. This strong CT emission is understood in terms of intensity borrowing. Energies of the CT
states from onsets of the fluorescence spectra give the depths of the traps which vary with
solvent polarity. For NI end traps the trap depths are 0.06 (p-xylene), 0.13 (THF) and 0.19 eV
(CHCl3). For AQ, CT fluorescence could be observed only in p-xylene where the trap depth is
0.27 eV. Quantum yields, emission energies, charge transfer energies, solvent reorganization and
vibrational energies were calculated. Fluorescence measurements on chains >100 repeat units
indicate that end traps capture ~50% of the excitons, and that the exciton diffusion length LD =34
nm, which is much larger than diffusion lengths reported in polymer films or than previously
BNL-108317-2015-JA

2
known for diffusion along isolated chains. The efficiency of exciton capture depends on chain
length, but not on trap depth, solvent polarity or which trap group is present.
KEYWORDS: Exciton trapping, Charge transfer state, conjugated polymer, polyfluorene,
exciton diffusion, diffusion length, charge transfer exciton
Introduction
A principal problem in organic solar cells is transport of excitons to junctions where they
can split to form electrons and holes. The advent of bulk heterojunction (BHJ) cells addressed
this problem by creation of nano-domains of donor and acceptor material so only short exciton
diffusion lengths are necessary.1-3 4 The BHJ concept is now almost universal, although it does
lead to other problems, especially in transport of electrons and holes, which limit efficiency of
organic photovoltaics (OPV). It is therefore reasonable to ask: Can there be alternatives to living
with short exciton diffusion lengths? The properties of conjugated chains suggest the possibility
of efficient transport over long distances; at least along single continuous chains. That possibility
was questioned by experiments with polyindenofluorene chains having perylenedimide caps5,6
that found transport to be inherently slow. On the other hand, experiments in this laboratory
suggested faster transport,7 but both results utilized relatively short chains. Healy8 examined
steady state fluorescence quenching on polythiophene chains with fullerene end traps, finding a
diffusion length LD=7 nm, which is similar to exciton diffusion lengths reported in polymer
films,9-14 which are in accord with theory.15
The present work examines charge transfer fluorescence and exciton movement in long
polyfluorene (pF) chains with naphthylimide (NI) and anthraquinone (AQ) acceptor trap groups
at the ends (Chart 1, Figure 1). Below we report exciton transfer to trap groups at the ends of
conjugated chains as a function of chain length, solvent, and end trap using steady state
fluorescence. Theoretical calculations were performed using linear response time-dependent
density functional theory (TDDFT) to gain insight into the nature of the charge transfer states
and the emission solvent dependence.

3
Chart 1. Polyfluorenes with naphthylimide (pFnNI) and anthraquinone (pFnAQ) end traps. R =
C6H13. n = 17-127
Figure 1. Photoexcitation produces excitons that form a charge transfer (CT) state when they
reach end trap acceptors (A), and emit a photon when the CT exciton radiatively decays.
Results
Figure 2 and Tables 1-2 report measurements of fluorescence spectra and intensities after
380 nm photoexcitation of polyfluorenes without and with end traps. The 380 nm excitation light
is absorbed almost exclusively by the strong bands of pF chains to form excitons in the chains.
Results reported below measure resulting fluorescence and estimate the efficiency of exciton
transport to the trap groups as a function of chain length and the behavior of the excitons at the
traps. The 27 polymer fractions of different lengths and caps were measured initially in all four
solvents, and selected polymers were subsequently re-measured multiple times to obtain
reproducibility within 1-2%. In DMF poor solubility and evidence of interchain and/or intrachain
aggregation in both absorption and emission spectroscopy (Figures S1 and S2) includes smaller
absorption and emission intensities, long wavelength tails in the absorption spectra and long
wavelength contributions to the emission spectra. These made observations in DMF difficult to
interpret, so little will be reported about the DMF results. The energy of the pF chain excitons in
hυ
1(pF+A-)*
pFA
1pF*A
CT emission
hυ
1(pF+A-)*
pFA
1pF*A
CT emission

4
DMF, estimated as the energy of crossing of absorption and fluorescence spectra (Figure S3), is
lower than in other solvents, while the energy of the CT state appears to be higher,
approximately equaling the energy of the pF chain states. Fluorescence emission spectra of pF
chains without trap groups in THF, chloroform and p-xylene showed small, but repeatable
differences in intensity and energy shown in Table 1and Figure 2a. No differences were found
for uncapped pF fractions of different lengths. Fluorescence spectra of pFNI and pFAQ (both
abbreviated as pFA) show emissions from both the pF chain, referred to as “chain fluorescence,”
and new emissions that will be identified as charge transfer (CT) states at the end traps (Figure
2b). pF chain intensities in pFA are less than uncapped pF intensities due to exciton transport
and charge transfer to end traps (pF+A-) that results in charge transfer fluorescence. As pFA
polymer length decreases, charge transfer fluorescence increases and pF chain fluorescence
decreases. In the longest end capped polymers, pF117NI and pF127AQ, evidence of exciton
transport to end caps is observed, wherein pF chain fluorescence is half as intense as in uncapped
pF. Emissions from the locally excited states of naphthylimide and anthraquinone 16-18;19-21are
not observed; only charge transfer state emissions occur at the end traps.
Table 1. Energy (eV) of maximum fluorescence emission intensity (Emax) and average energy of
charge transfer band origins (E0). Emax(pF)- E0(pFA) gives trap depths for pFNI of 0.06 (xyl),
0.13 (THF) and 0.19 (CHCl3) and 0.27 eV for pFAQ in xylene. E0 for pF is the chain fluoresence
origin.
Xylene THF CHCl3 DMF c ECT (pFA⋅-)d
pFa Emax 3.00 2.98 2.99
2.90
E0 3.08 3.05 3.06 3.0
pFNI Emax 2.76 2.34 2.28
2.4
1.21
E0 2.94 2.85 2.80
2.9
0.85
pFAQb Emax 2.41 n.o. n.o.
1.7

5
E0 2.73 n.o. n.o.
1.40
apF45 bn.o. = not observed. c Energies in DMF may be suspect and are more uncertain due to
aggregration. d Energies of charge transfer (CT) bands for pFNI⋅- and pFAQ⋅- anions reported by
Asaoka22 in THF.
Figure 2. Steady state fluorescence emission spectra. (a) pF chain fluorescence of uncapped pF
in THF (black solid), chloroform (green dotted), and xylene (blue dashed). Average pF peak
intensity in THF = 32.3 x 10⁶ counts/s, chloroform = 27.4 x 10⁶ counts/s, xylene = 24.2 x 10⁶
counts/s, DMF (not shown) = 0.75 x 10⁶ counts/s. (b) pFNI emissions in THF. Note decrease in

6
pF chain intensity compared to uncapped pF in Fig. 2a. (c) pF22NI emission in xylene (blue
solid). pF chain contribution (blue dotted) subtracted to give solely (pF+NI-) CT spectrum (blue
dashed). (d) CT fluorescence with pF chain contribution subtracted. (pF+NI-) in xylene (blue
dashed), THF (black solid), chloroform (green dotted). (pF+AQ-) in xylene (thick red solid).
(pF+AQ-) CT fluorescence is negligible in THF and chloroform.
Table 2. Quantum yields, charge-transfer state energies, and reorganization energies of pFNI and
pFAQa. The fraction of pF chain fluorescence, is the ratio of peak chain fluorescence from pFNI
or pFAQ to that in uncapped pF, (Fc)=IpFA/IpF. Also reported are the chain fluorescence quantum
yield (φc) per photon absorbed, charge transfer state (pF+A-) quantum yield per photon absorbed
(φCT/hυ), charge transfer state quantum yield per trapped exciton (φCT/exT), charge transfer state
energy (E0CT), solvent reorganization energy (λs), and vibrational reorganization energy (λv).
pF22NI XYL
pF71NI XYL
pF117NI XYL
pF22NI THF
pF71NI THF
pF117NI THF
pF22NI CHCl3
pF117NI CHCl3
pF20AQ XYL
pF81AQ XYL
pF127AQ XYL
Fc a 0.28 0.43 0.56 0.25 0.40 0.49 0.20 0.53 0.25 0.49 0.58
φc 0.19 0.28 0.36 0.19 0.30 0.37 0.14 0.39 0.16 0.32 0.37 φCT/hυa 0.46 0.30 0.24 0.39 0.31 0.24 0.32 0.20 0.12 0.08 0.07
φCT/exTa 0.64 0.52 0.55 0.52 0.51 0.48 0.40 0.42 0.16 0.16 0.16 E0 CT 2.93 2.93 2.95 2.86 2.85 2.85 2.81 2.79 2.73 2.70 2.76
λs 0.18 0.17 0.20 0.42 0.42 0.42 0.44 0.41 0.25 0.21 0.28 λv 0.14 0.14 0.13 0.14 0.14 0.14 0.14 0.14 0.14 0.16 0.16
a For short pFAQs in THF and CHCl3 Fc = 0.26, φCT/hυ is <0.02 and φCT/exT is ≤ 0.025. E0CT could not be determined for pFAQs in THF and CHCl3 due to low signal to noise.
CT fluorescence is solvent dependent. In a given solvent the observed fluorescence
spectra were well described as sums of two contributions: pF chain fluorescence and charge
transfer (CT) fluorescence. CT fluorescence spectra were obtained in each solvent by subtracting
the pF chain contribution from the overlapping pF chain and CT spectra (Figure 2c and 2d). For
different chain lengths the shapes of the two spectra remained the same, only the relative
intensities changed. The chain and CT fluorescence intensities are plotted against chain length in
Figure 3, showing a decrease in pF chain emission intensity and increase in CT emission
intensity as chain length decreases. CT emissions have the highest quantum yields and highest
emission energies (are bluest) in xylene; pFNI CT emission energies shift red by 0.4 eV in THF,
and slightly further red in chloroform. pFAQ CT fluorescence is observed in xylene, but is

7
minimal in polar solvents. Evidence of pFAQ charge transfer is seen in the marked decrease in
pF chain fluorescence intensity compared to uncapped pF (Table 2). The reduced intensity of
pFAQ CT fluorescence compared to pFNI is not indicative of less charge transfer, but of
competing non-radiative decay pathways for the CT state. In DMF CT fluorescence is observed
for pFNI (Figure S2) at almost the same energy as in THF and chloroform.
The high energy onsets of the CT fluorescence mark the energies (origins), E0,CT, of the
CT states relative to the ground states. These onsets may be estimated by inspection of the curves
in Figure 2. Improved estimates fit the CT fluorescence spectra using an expression23 for the
Franck-Condon envelope, using an onset energy, E0,CT, and solvent and high-frequency
reorganization energies reported in Table 2. Table 1 also compares the origins and maxima of the
CT fluorescence bands with origins and maxima of CT absorption bands for anions of pFNI and
pFAQ reported in THF.22
Absolute quantum yields in selected short and long end-capped polyfluorenes for the pF
chain (φc) and CT fluorescence per photon absorbed (φCT/hυ) and per trapped exciton (φCT/exT)
are reported in Table 2. Quantum yields were determined by integrating fluorescence spectra of
absorption-matched solutions, and correcting for refractive index differences between solvents.
A reported value for pF chain quantum efficiency (φ = 0.64) was used as a standard to which
endcapped chains were compared. Charge transfer state (pF+A-) quantum yields per photon
absorbed were calculated by Equation 1, where FCT = (area CT fluorescence spectrum in
solvent)/(area uncapped pF fluorescence spectrum in solvent), and φPF = (area uncapped pF
spectrum in solvent)/(area uncapped pF spectrum in xylene) * (nsolvent/nxylene)2 * 0.64.
(φCT/hυ) = (FCT) (φPF) (1)
Quantum yields of charge transfer state fluorescence per trapped exciton were calculated by
Equation 2, where FexT = FCT/(1-Fc), where Fc is the fraction of chain fluorescence in pFA
compared to pF, and (1-Fc) is the fraction of excitons that make it to an end trap.
(φCT/exT) = (FexT) (φPF) (2)
Charge transfer fluorescence quantum yields per trapped exciton (φCT/exT) for a given
solvent and end trap do not change much with polymer length, but are about 15% higher in
xylene than in THF and 40% higher in xylene than in chloroform and increase with increasing
energy of the CT state (Figure S4). Regardless of the nature of the end trap or solvent, chain
8
fluorescence quantum yields (φc) per photon absorbed are 1.9 – 2.8 times larger in the longest
pFA compared to the shortest, and charge transfer state (pF+A-) quantum yields per photon
absorbed (φCT/hυ) are 1.6 to 1.9 times higher in short versus long polymers (Figure 4). However,
charge transfer state (pF+A-) quantum yields per photon absorbed (φCT/hυ) and per trapped
exciton (φCT/exT) are about three times higher for pFNI than pFAQ.
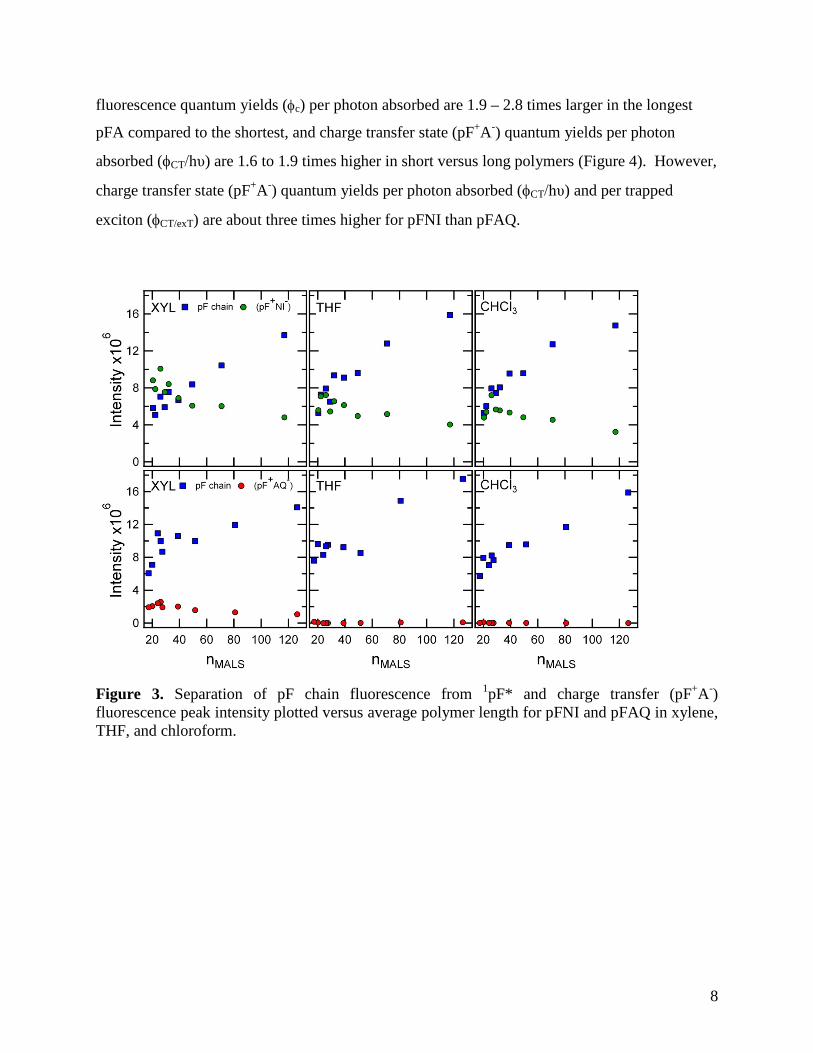
Figure 3. Separation of pF chain fluorescence from 1pF* and charge transfer (pF+A-) fluorescence peak intensity plotted versus average polymer length for pFNI and pFAQ in xylene, THF, and chloroform.

9
Figure 4. Charge transfer state (pF+A-) quantum yields per photon absorbed (φCT/hυ) plotted as a function of polymer length. Uncertainties 1-2%.
Density Functional Theory. To gain further insight into the spectra, we carried out
calculations using linear response time-dependent density functional theory (TDDFT) 26,25,27 in
conjunction with a polarizable continuum model (PCM) for solvation28, as implemented in the
Gaussian 09 software package29. Our model compounds are made up of a fluorene trimer with
one end capped by an either NI or AQ group; no chain-length dependence was studied. Rather
our goals are to provide some understanding of the fluorescence states and solvent dependence of
the emission.
A first goal was to determine whether a computational description also finds that the long
wavelength fluorescence in pFNI and pFAQ is from the end traps. Does it predict that the
charge-transfer state lies lower than the excited states in pF with significant oscillator strength?
To accomplish this, we used recently developed long-range corrected (LC) functionals30,31 which
are shown to be critical in correcting the error in conventional exchange-correlation functionals
that leads to underestimation of the charge-transfer state energy.32,25,33. Table 3 presents the
results from the LC-ωPBE functional that we recently found successful for polaron description in
polyfluorenes in solution.34 It shows that the first excitation in F3NI (F3AQ) has a lower energy
than that in F3 or NI (AQ), suggesting it is charge transfer transition. Furthermore, it has
significant oscillator strength that would allow fluorescence. We have carried out the same
calculations with a different LC functional, CAM-B3LYP35 , and reached the same conclusion,
even though the computed excitation energies and oscillator strengths differ. However, because

10
excited state geometry optimization with LC functionals is currently not implemented, we are not
able to study the emission with these functionals, but we do not expect that the charge transfer
transition will go above local transitions at its optimized geometry.
Table 3: TDDFT energies in eV and oscillator strengths (in parentheses) of the first three transitions for F3NI and F3AQ, as well as for F3, NI and AQ, all in the solvent THF. TDDFT calculations are performed at the geometry optimized in the ground state with the same functional, i.e LC-ωPBE with ω=0.1 bohr-1. All calculations use the standard basis set 6-31G(d) and the PCM solvation with THF being the solvent.
F3NI F3AQ F3 NI AQ 2.791 (0.9676)
2.447 (0.2526)
3.343 (2.5641)
3.142 (0.0001)
2.495 (0.0000)
3.127 (0.0048)
2.507 (0.1026)
3.910 (0.0168)
3.466 (0.2122)
2.770 (0.0000)
3.330 (1.5712)
2.764 (0.0003)
4.135 (0.0000)
3.660 (0.0000)
3.303 (0.0000)
The fact that the charge transfer transition is indeed the lowest-lying transition in F3NI and
F3AQ also means that the underestimation errors for charge transfer states in conventional
functionals become insignificant to a qualitatively correct description of these states. Therefore,
we used B3LYP to probe the solvent-dependence of the emission energy, with the main purpose
of identifying the trend. Following the well-described procedure for such studies from Gaussian
manual29, we were able to do TDDFT geometry optimization with equilibrium, linear-response
solvation.36,37 It gives us the minimum energy point on the charge-transfer state potential energy
surface in the solvent reaction field that corresponds to the ground state charge distribution.
Comparing the charge transfer transition energy at this point in Table 4, a clear, albeit rather
small, red shift is seen for the transition energy when the solvent changes from p-xylene to THF.
More drastic solvent dependence of the emission energy, which was seen experimentally, can be
expected with a state-specific equilibrium solvation of the excited state38,39, as also described in
the manual.29 These calculations, however, could not converge for the charge transfer states that
we are interested in. The equilibrium solvation effects of charge transfer states can also be
probed by combining constrained DFT40 and PCM.41 Here we attempt a different strategy42 in
which the lowest triplet state, as calculated by unrestricted DFT, is used to approximate the
charge distribution of the charge transfer state and hence, the equilibrium solvation effects. The
Mulliken charge of the acceptor group in the triplet state (Table 4) indicates that such an
approximation works better for F3AQ than for F3NI, as could be anticipated from the greater CT

11
character of the pFAQ triplet.43 The equilibrium solvation effect in F3AQ triplet is also stronger
than in F3NI triplet and agrees better with the experimentally observed shift of the emission
energy.
Table 4: TDDFT (B3LYP/6-31G*) energies in eV of the first transition for F3NI and F3AQ in the solvents THF and p-xylene. Geometries are optimized using TDDFT and linear-response solvation for the singlet excited states. Triplet energies are calculated with unrestricted DFT and reported relative to the singlet ground state at the same TDDFT optimized geometries. The numbers in parentheses are the Mulliken charge on the acceptor group (NI or AQ). The experimental shift is reported as the energy of maximum fluorescence emission intensity.
F3NI F3AQ F3NI triplet F3AQ triplet THF 2.209 1.747 2.029 (-0.33) 1.834 (-0.77) p-xylene 2.267 1.790 2.102 (-0.22) 2.115 (-0.56) Shift 0.058 0.057 0.073 0.281 Expt. shift 0.42 no no no
Intensity borrowing The intensity of charge transfer fluorescence may be understood through
the interaction of the charge transfer state and the fluorescent local excited state of the pF chain.
These two states together with the ground state form a three-state model that was originated in
the theoretical treatment of Murrell44 and later extended by Bixon et al. 45 Our zeroth order
electronic states are |pFA⟩, |pF*A⟩ and |pF+A-⟩. Their energies are 0, E1 and Ect, respectively.
The small electronic coupling between |pF+A-⟩ and the other two states are V and V*,
respectively. Therefore, the ground state and the charge transfer state become, to the first order,
|GS⟩ = |pFA⟩ + V/Ect |pF+A-⟩ ,
|CT⟩ = |pF+A-⟩ - V/Ect |pFA⟩ + V*/(E1-Ect) |pF*A⟩ .
The transition dipole moment between these two states is then, again to the first order,
µ = µ0 + V/Ect ∆µ + V*/(E1-Ect) µ* (3) where µ0 is the transition dipole moment between |pFA⟩ and |pF+A-⟩, ∆µ is the difference
between the permanent dipole moments of |pF+A-⟩ and |pFA⟩, and µ* is the transition dipole
moment between |pFA⟩ and |pF*A⟩. µ0 depends on overlap between the initial and final states
and is usually small for CT transitions. In the present case TDDFT calculations indicate that the
CT states are principally (90%) composed of configurations consisting of the HOMO and

12
LUMO shown in Figure 5. The small overlap between these orbitals will make µ0 small. When
Ect is much larger than V, the second term is also small. In eq 3 the third term, which can be
viewed as charge transfer state borrowing the intensity from local excited state, depends
critically on the energy gap between the local excited state and the charge transfer state. The
theory of intensity borrowing therefore predicts that radiative rates for fluorescence from the CT
states will decrease as the energy of the CT state decreases. It explains why charge transfer
fluorescence increases with lower solvent polarity because of the raised charge transfer state
energy of pFA. The difference between pFNI and pFAQ may also be attributed to the fact that
the former has a higher Ect, assuming similar coupling strengths.
Figure 5 Orbitals that are mainly responsible for the charge transfer transition in F3NI and F3AQ, plotted at the TDDFT (B3LYP/6-31G*) optimized geometries in linear-response PCM solvation. The solvent is THF; other
solvents are not expected to change the picture much.
Discussion
Natures and Energies of Charge Transfer States. Figure 6 summarizes energetics for
the fluorescent states in the chains and at the end traps. These data show that NI end groups form
traps for excitons with depths of 0.14 eV in p-xylene and 0.25 eV in THF. The AQ group
provides a 0.35 eV trap in xylene; in THF and chloroform it is deeper, but no clear CT
fluorescence spectrum was observed so the depth could not be determined. The difference with
solvent polarity and the deeper trapping by AQ vs. NI both point to the CT nature of the end
trapped exciton states. The broad, featureless fluorescence spectra in Figure 2 are typical of CT
transitions. Figure 6 also shows that the energies of the end trapped excitons are below those of
local excited states of NI and AQ, further supporting their CT character. Finally the CT nature

13
of the end trapped states is confirmed by the TDDFT calculations in Table 3 and the orbitals
involved in Figure 5.
Figure 6. Energies (eV) of charge transfer band origins (E0) in xylene (blue), THF and
chloroform (green), compared to triplet energies a from Sreearunothai43 and the energies of
separate pF+● and pFA-● from sums of redox potentials under electrochemical conditions
(yellow) given in Table 5, from Asaoka.22
Electrochemical measurements22 provide redox potentials for formation of pF+●, pFNI-●,
and pFAQ-●. Differences (eq 4) reported in Table 5 give free energies changes to form pF+● and
pFNI-● or pF+●, pFAQ-●.
∆GCS(0) = + E0(pF+/0) - E0(pFNI0/-) or AQ (4)
These free energy changes are lower than the energies of CT states for pFNI in THF and
chloroform. The separated ions measured electrochemically are expected to be stabilized due to
the presence of 0.1 M electrolyte. On the other hand they are expected to be destabilized because
sums of electrochemical potentials refer to making ion-pairs at infinite distance. This comparison
suggests that the stabilization of ions by the electrolyte is the stronger effect, but it may also
indicate that in intimate ion pairs like pF+NI- with partly or nearly overlapping charge
distributions both ions lose solvation energy and may encounter some kind of electronic
destabilization in addition to the large Coulomb attraction between pF+ and NI-.

14
Table 5. Estimated energy of charge transfer bands from electrochemical potentials. (E0 vs
Fc+/0)
E0(pFA0/-)a E0(pF+/0)- E0(pFA0/-)
pFNI -1.831 2.491a
pFAQ -1.437 2.097a a Redox potentials vs. Fc+/0 in THF + 0.1 M Bu4NBF4.
E0(pF+/0)= +0.66 22
Comparison to other CT states. Results presented here show behavior that contrasts
with those of Neuteboom et al.46 who studied PFP, in which a single fluorene is capped by
aperylene bisimide on both ends (PFP) (Chart 2). In PFP the locally excited state of the perylene
bisimide (PERY) end trap is always the emitting state. The present molecules are similar in that
CT states lie below a strongly emitting local excited state, pF in the present molecules and PERY
in those of Neuteboom. The two cases are different in that in all solvents: Neuteboom sees no CT
fluorescence, but finds the CT state to be below the local excited state of PERY* based on a
decrease of PERY fluorescence as evidence of CT formation. With PFP* and PERY* very close
in energy (PFP* ~ 0.01eV lower) and below the local excited states, one would expect charge
transfer states to form, but the absence of a CT fluorescence band leads to the conclusion that
quenching of PERY fluorescence results from rapid intramolecular electron transfer from
fluorene to PERY. The highly solvent dependent rates range from ~50ps in THF to 7 ns in
toluene. Plausible reasons for the absence of charge transfer state fluorescence are that the CT
band, if formed, could be outside the scanned wavelength region, or it may have very low
intensity, possibly due to rapid non-radiative decay. Alternatively, the electronic coupling may
be weak between the fluorene and PERY units. The NI and AQ end groups are directly
conjugated to the pF chains, so V* in eq 3 is large. Eq 3 therefore predicts strong intensity
borrowing resulting in strong transition moments for radiative decay of the CT states of pFNI
and pFAQ. In PFP the fluorene is bonded to PERY at the diimide nitrogen without direct
conjugation. V* is therefore much weaker in PFP, so eq 3 predicts much less intensity borrowing
and slow radiative decay. V* may be weakened further by the likelihood of a large dihedral angle
between fluorene and PERY; a twisted conformation is supported by their UV-vis absorption

15
spectra. The pFNIs in our study have stronger electronic coupling through conjugated bonds
between the pF chain and the NI end cap, and the linkage at the NI aromatic ring rather than at
the PERY saturated nitrogen bonds enables more overlap between the NI and pF subunits.
Their system also differs from ours in that the PFP “chain” is very short; just one fluorene.
Therefore, there is no need for transport. This distinction suggests evidence of delocalization of
the positive charge in our molecules over several pF repeat units in the CT state. There is less
Coulomb attraction in pFNI with the delocalized positive charge than in PFP.
Chart 2. Structure of PFP. 2,7-bis(N-(1-hexylheptyl)-3,4:9,10-perylene-bisimide-N’-yl))-9,9-
didodecylfluorene.
Transport to traps.
Data in Table 2 and Figure 3 show that chain length is the primary factor
determining how many excitons reach the end traps as measured by the fraction of chain
fluorescence, Fc. Varying the solvent from xylene to THF and CHCl3, appears to have little
effect on Fc. Neither does the nature of the end trap (NI vs AQ), although all of the changes alter
the free energy change for the trapping process. Thus a first major finding is that exciton capture
appears to be controlled by the rate of transport along the chains, not by the actual trapping
process, which is likely to be diffusion-controlled, as suggested by Healy and coworkers8 in their
thiophene fullerene molecules. Steady state fluorescence measurements on long chains
composed of >100 repeat units in the present pFs suggest that end traps still capture 40-50% of
excitons.

16
Homogeneous Diffusion Model Fluorescence decays as e-kf*t in pF polymers without traps, with
the lifetime of a pF exciton approximately kf-1=400 ps. In end-capped polymers there is an
additional decay that occurs if the exciton transports to the end trap group. Excitons in pF chains
form polarons reported to be 5 repeat units in length based on convergence of fluorescence
spectra of oligomers.34 From evidence noted above we may expect that excitons diffusing in the
pF chains will be captured in every encounter with a trap group: capture will be diffusion-
controlled. Below the results will be used to examine this assumption. If excitons diffuse
randomly along pF chains with diffusion-controlled capture at the traps, decay by reaction with
the traps is expected7 to follow the known solution47,48 for diffusion with diffusion coefficient D
to the ends of rods of length L. Eq 5 gives the probability, P(t), that a randomly diffusion exciton
has survived capture by the traps.
P(t)= ∑
∑∞
=
∞
=
+−
+
+
02
0
)12(
2
)12(1
)12(1 2
22
n
n
LDtn
n
en
π
(5)
Eq 5 describes a multiexponential decay in which 82% of the excitons decay by a single
exponential that may be called the principal exponential, kp, while the other 18% decay faster.
Integration of eq 5 over t would give the fraction of chain fluorescence, Fc, reported in Table 2.
Eq 5 will be used below to describe homogeneous diffusion, but we note that the rate of decay
might be approximated as a single exponential function with rate e-kf*t. If it behaves as one-
dimensional diffusion to the end traps, the decay is multi-exponential. For an exciton of length lex
the principal exponential, kp, varies with the diffusion coefficient and the square of the length for
chains with traps at both ends:
kp=π2D/(L-lex)2 (6a) .
We refer to this as a “homogeneous diffusion model” because eq 5 assumes that diffusion occurs
with a diffusion constant, D, that is the same along the entire chain: the chain is homogeneous
without significant defects that can disturb the diffusive motion. For a point particle (exciton of
zero length) eq 6a becomes kp=π2D/(L)2. Decay would be 4 times slower for chains with traps at
one end compared to two ends:
kp=π2D/4(L-lp) (6b)

17
With the approximation of a single exponential rate to the traps, kp, these relations along with the
known fluorescence lifetime of kf-1=400 ps can be used to predict the integrated fraction of
excitons not captured, Fc . While the integrated form of eq 5 will be used below, eq 7 gives a
simplified form of reasonable accuracy.
Fc=kf/(kf+kp) (7)
Fc from integration of eq 5 can be compared to measured values of Fc reported in Table 2.
A complication is that not all chains have the intended two trap groups. Recently the
completeness of end capping was determined by measurements of triplet capture in the pFNI and
pFAQ length fractions used here.49 The long lives of the triplets allowed them to move over the
entire length of the chains. NMR measurements compared to multiangle light scattering (MALS)
measurements were averaged over lengths giving a second measurement of Pcap, which was
accurate for shorter lengths (n<60 repeat units). Results of the two methods agreed to yield
Pcap,= 0.73±0.1 for pFNIs and 0.63±0.12 for pFAQ. Pcap showed a small variations with length,
but these were within the uncertainties of the measurements. Here we will assume these values
do not depend on length. Assuming random capping (one end does not know about the other
during synthesis), the fractions of chains with two, one and zero trap groups are P2= Pcap2, P1=
2Pcap (1-Pcap) and P0= (1-Pcap)2.
We follow Healy8 in integrating diffusion equations over distributions of lengths in each
polymer fraction. Figure 7a) shows a fit of Fc with length in pFNI, with Fc determined by
integration of eq 5 in which each data point is averaged over the distribution of lengths in that
polymer fraction using the distributions from MALS given in Figure 7b). The weight fraction
distribution is used as longer chains have a higher probability of absorbing a photon to form an
exciton. Using the measured Pcap=0.73,49 the fit describes the data well giving D=0.037 ±0.004
cm2/s, where uncertainties are from fits. The fit results are given as points that compare well to
the measurements. The dashed line in Figure 7a) shows a similar fit without averaging over
distributions of length. For each of the nine points the length L in eq 5 is set to the average length
for that polymer fraction. The resulting dashed line gives a poor description of the data,
highlighting the need to consider the polymer length distributions. Figure S5 shows similar fits
for a range of values for completeness of capping, Pcap. These fits, which do not take length
distributions into account, give reasonable descriptions only with Pcap=0.5-0.6, which is far lower
than the previously reported value. They give somewhat larger values of the diffusion

18
coefficient, D=0.099 cm2/s and 0.04 cm2/s. The value D=0.037 cm2/s from the fit with
distributions is considered much more reliable.
Figure 7. Chain fluorescence fits for pFNI in THF using the one-dimensional homogeneous
diffusion model of eq 5. a) Chain fractions Fc with fit points (◊) obtained by integrating eq 5 over
the length distributions shown in b). An alternative fit assumes that each polymer fraction is
monodisperse with a length =<n>. Both fits use an end capping probability, Pcap=0.73. The
superior fit with averaging over length distributions, gave a diffusion coefficient D=0.037 cm2/s.
Data and fits for the pFNIs similar to those in Figure 7a) in three different solvents
(Figure S6) give diffusion coefficients, D=0.025 (xylene), 0.037 (THF) and 0.025 cm2/s
(CHCl3). The average over the three solvents is 0.029 cm2/s. In fluorene oligomers with C60 end
traps Shibano found D=5.9-8.5 x 10⁻³ cm2/s, about four times smaller. From D=0.029 cm2/s and

19
τ=400ps the diffusion length, LD=(Dτ)1/2=34 nm can be estimated. While THF and chloroform
are moderately polar liquids, p-xylene in nearly nonpolar. Additional differences are that p-
xylene has conjugated π orbitals while the other two do not, and is a somewhat poorer solvent.
An important aspect of the present results is that the exciton transport does not seem to be
influenced by changes in the polarity the medium or whether it contains saturated or π bonds.
While it is conceivable that effects of these different properties might partly cancel, the similarity
of results in the three solvents implies that exciton transport is nearly independent of these
properties.
While the homogeneous diffusion model described appears to explain measurements of
exciton capture here and those by fullerene traps on polythiophene chains,8 other types of
measurement of excitons in polymer chains are often interpreted by assuming that the chains are
not homogeneous but are divided into segments.5,6,50,51 A very simple model based on this idea is
shown schematically in Figure 8. In this simple model excitons diffuse freely until they
encounter some kind of defect. Near each end trap the excitons can diffuse to reach the trap from
an average distance covering nD repeat units. Excitons farther than nD units from a trap are
sufficiently slowed that they do not reach the trap within their lifetime.
Figure 8. A polymer chain with a length of n repeat units having either one or two end traps nD
is the diffusion length of an exciton within its lifetime. Alternatively, for discussion of a model
of defects, that length is ndef, the distance in repeat units to the defect closest to the trap.
If only excitons near to trap groups are captured, as suggested in Figure 8, then the
fraction giving chain fluorescence, is Fc=(n-2nD)/n for doubly-capped chains and Fc=(n-nD)/n for
singly-capped chains. At the simplest level the diffusion length, nD repeat units, is the same for
every chain. Fits of the observed chain fluorescence intensities to this description (not shown)
are not good and display discontinuities inherent in this somewhat artificial model. This model,

20
an alternative to that of homogeneous diffusion, assumes that capture occurs only near the traps.
This behavior could arise if exciton capture involved direct exciton transfer to the traps, without
transport, such as by long-distance Förster transfer. But the large values of nD, 26-106 repeat
units (22-88 nm), are too large for such direct transfer.
The picture in Figure 8 also defines a type of diffusional capture length nc in repeat units
derived from the fractions of chain fluorescence in a chain of length n units as nc=n(1-
Fc)/(2Pcap2+2Pcap(1- Pcap)) and lc=0.83nc for pF chains. Figure 9 plots the capture lengths (per trap
group) defined in this way for data in pFNI and pFAQ chains. These capture lengths are small
for shorter chains, being confined by chain lengths. For longer chains they approach the diffusion
length, LD=34 nm estimated above.
Figure 9. Diffusional capture lengths lc vs chain length for pFNI and pFAQ, each in three
solvents, THF, p-xylene and chloroform..
Figure 8 can also describe a model based on defects. The simplest such model assumes
that exciton diffusion occurs readily along the chain, but is halted by a defect. With this
assumption, the traps capture excitons formed in the segments of length ndef near the traps, but
excitons formed at longer lengths can not be captured. ndef is therefore the distance from the trap
to the nearest defect. ndef is not constant. It is different for each chain determined by probability.
Assuming that the defects are randomly placed with an average density ρd (and average spacing

21
of ρd -1) then the probability that the defect nearest to a trap is located η repeat units from the trap
is P(η)= ρd (1- ρd)η-1. Then for chains with κ=1 or 2 end trap groups, the surviving chain
fluorescence is
∑≤
++
−=
κη
κηκηη/
)(n p
pc nk
knn
nPF (8).
In eq 8 κ=1 for a singly capped chain; the n- η units farther than the defect fluoresce normally
and the η units near the trap group are quenched by the factor kf/( kf + kp). The principal
exponential, kp, is related to the exciton diffusion coefficient, D, by eq 6b, to describe diffusion
in a segment with a trap group at one end and a reflecting defect at the other. For a doubly
capped chain, κ=2, eq 8 approximates η1 + η2=2η. This will underestimate exciton capture
because for different lengths to the first defect (η1 ≠ η2) there could be more capture.
Figure 10 displays fits of the defect model to chain fractions for pFNI in THF. The fit
curve describes the data well within its noise.
Figure 10. Fractions of chain fluorescence for pFNI inTHF fit by the defect model (eq 8) with
averaging over distributions. The fits gave an average defect spacings of 75 repeat units.
Pcap=0.73 (pFNI) was fixed during the fit. The inset plots the probability, P(η)= ρd (1- ρd)η-1. that
the closest defect is η repeat units from the trap for average defect spacings of 20, 30, 50 and 80
repeat units.

22
The defect model fit in Figure 10 does not allow the exciton to move freely along the
entire chain. It gives average diffusional capture lengths, lc=32, 27 and 26 nm from the fits to the
three data sets in Figures 10 and S6 for long polymer fractions. These are shorter than LD =34
nm estimated from the diffusion coefficient obtained in the fits by homogeneous diffusion. These
capture lengths are shorter than the average defect spacings of 65, 49, and 46 repeat units, (or 54,
41 and 38 nm) because the distribution of probabilities of closest defects is skewed toward short
lengths as seen in the inset to Figure 10. In this defect description the capture length is
determined by the defect spacing; the fits are nearly independent of the diffusion coefficient over
a large range so D is not determined by the fits. The fits to eq 8 used D=0.02 cm2/s. Slightly
better fits were found for larger diffusion coefficients, but we capped D to a value7 near to that
found for homogeneous diffusion.
The defect model used here describes the data reasonably well, as does the homogeneous
diffusion model. Other defect-based descriptions might as well. It gives diffusion lengths that are
roughly similar to those of the homogeneous diffusion model. The simple model of eq 8 assumes
the defects to be impermeable barriers. More sophisticated models could allow some
permeability or even include a range of barriers or alternatively shallow traps. The present data
with nine length fractions provides valuable tests, but could likely be fit by a range of models
and would not be likely to distinguish between them. At present the homogeneous diffusion
model, applied to take distributions of length into account, is the simplest of the models that
describe the data well.
Conclusions
Naphthylimide (NI) and anthraquinone (AQ) end traps directly conjugated to the ends of
polyfluorene chains serve as traps for excitons created by excitation of the chains in solution.
The trap depths ranging from 0.06 to >0.27 eV, vary with solvent polarity and trap group. End
trapped excitons often give strong CT fluorescence with CT states at energies that lie above
those of separated ions in electrochemical conditions. CT state quantum yields per trapped
exciton are as high as 64%, or 46% per absorbed photon. The very intense CT fluorescence is
understood in terms of intensity borrowing. CT fluorescence is less intense in polar solvents,
showing that non-radiative decay is favored as the energy of the polar CT excited state is

23
lowered in polar solvents. It also reflects less effective intensity borrowing in polar solvents
where the CT state lies farther below the pF chain excited state. The large shift in pFNI charge
transfer fluorescence energy as a function of solvent polarity (0.2eV) suggests a considerable
dipole moment in the CT excited state as compared to the pF excited state with its small solvent
effect energy shift (0.02eV). This results in weak CT fluorescence in polar solvents for (pF+AQ-
), which is expected to have lower energy than (pF+NI-).
The probability of exciton capture by the end traps depends on chain length, but is
independent of 1) trap depth, 2) solvent polarity and 3) which trap group is used. These findings
point to diffusion-controlled capture of excitons by both trap groups, as might be expected
because the NI and AQ traps are intimately connected to the chains by conjugated links.
Diffusion-controlled capture means that properties of the chains, not the end traps, determine the
rates of exciton capture so the present results tell us that exciton transport along the chains is not
affected by the surrounding medium. The steady state fluorescence results reported here can be
modeled by homogeneous 1D diffusion along the chains to give an exciton diffusion length of 34
nm, or by a model based on occasional defects.
A goal of this work was to assess the potential of conjugated chains to act as “molecular
wires” that could act as antennae to funnel excitons to donor-acceptor junctions in OPV cells.
Such cells are typically 100-200 nm thick, so even if conjugated chains could be aligned to
transport excitons to junctions, the 34 nm diffusion length found here may not resoundingly
suggest that there are alternatives to living with the short exciton diffusion lengths reported in
films. But it is a substantial step in the right direction and a notable improvement on what is
known. The LD=34 nm found here substantially exceeds diffusion lengths near 7 nm in polymer
films,9-14 also 7 nm for transport along polythiophene chains8 and 20 nm found in crystalline
poly-(3-hexyl)thiophene (P3HT) domains.52 It may therefore be a record-setting diffusion length
for singlet exciton transport in organic polymers.
Experimental Section
Chemicals. Tetrahydrofuran, xylene, chloroform, dimethylformamide, and polystyrene
were used as received from Aldrich. The synthesis of pF24 to pF136, pF21NI to pF117NI, and

24
pF17AQ to pF127AQ was described previously.22,53. pF, pFNI, and pFAQ with MN=19±2 kD were
each separated into nine fractions by preparative gel permeation chromatography. Multi-angle
light scattering was used to determine the average polymer lengths within each fraction. The
average number of end caps per chain end was estimated by NMR to be, Pcap=0.81±0.04 (pFNI)
and 0.74±0.07 (pFAQ) for fractions <40 units in length; accuracy is low for longer fractions.
Measurements of triplet capture suggest slightly smaller values Pcap=0.74±0.04 (pFNI) and
0.63±0.06 (pFAQ).
Spectroscopy. pF, pFNI, and pFAQ solutions that gave UV-visible absorbencies of 0.05
were prepared in chloroform, dimethylformamide (DMF), tetrahydrofuran (THF), and xylene.
Concentrations were 10-7 to 10-8 M. Ultraviolet-visible absorption spectroscopy was performed at
room temperature from 200-600 nm on a Shimadzu 3600 spectrometer using 1.0 cm pathlength
quartz spectrophotometric cells. Ground state UV-visible absorption spectra for polymers of
length pF24 to pF136, pF21NI to pF117NI, and pF17AQ to pF127AQ in chloroform,
dimethylformamide (DMF), tetrahydrofuran (THF), and xylene show absorption maxima at 387-
390 nm in THF and 384-390nm in chloroform (Table S1). DMF maxima are red shifted (398-
410nm) and broader (Figure S1); xylene maxima are blue shifted (381-387nm). Extinction
coefficients range from 1 x 10⁶ to 4 x 10⁶ M-1cm-1. Corrected steady state fluorescence emission
spectra were obtained from 380-700nm in 1.00 cm pathlength dry quartz cells on a Horiba Jobin-
Yvon Fluoromax 4 with excitation at 380nm and slit width of 1.0 nm. Spectral data were
processed using IGOR Pro (Wavemetrics).
Computations. Gaussian 0929 was employed to perform calculations using linear
response time-dependent density functional theory (TDDFT) 26,27 in conjunction with the
polarizable continuum model (PCM) for solvation.28 The model compounds were fluorene
trimers with one end capped by either an NI or AQ group.
Supporting Information Available: UV-visible absorption data, absorption and fluorescence
spectra in DMF, chain fluorescence fits using one-dimensional diffusion models. This material is
available free of charge via the Internet at http://pubs.acs.org.
Author Information
Corresponding Author: [email protected]

25
Notes: The authors declare no competing financial interest.
Acknowledgments
Research carried out in part at the Center for Functional Nanomaterials, Brookhaven National
Laboratory, which is supported by the U.S. Department of Energy, Office of Basic Energy
Sciences, under Contract No. DE-AC02-98CH10886. The authors gratefully acknowledge
support of the Division of Chemical Sciences, Geosciences, and Biosciences, Office of Basic
Energy Sciences of the U.S. Department of Energy through Grant No. DE-AC02-98CH10886 to
all authors. We thank Melissa Farrell of Dowling College who carried out preliminary
experiments, and Xiang Li of Brookhaven National Laboratory for experiments to determine the
percent of uncapped pFA. Partial support was provided by the National Science Foundation's
Robert Noyce Teacher Scholarship Program at Dowling College to LZ, MF, BK, and GM under
Award No. 03-35799 and 09-34814. Any opinions, findings, and conclusions or
recommendations expressed in this material are those of the authors and do not necessarily
reflect the views of the National Science Foundation. LZ and GM thank Noel Blackburn of the
BNL Office of Educational Programs for his leadership and support in the U.S. Department of
Energy Faculty and Student Team (FaST) Program. LZ acknowledges support from Dowling
College Release Time for Research.
References
(1) Hoppe, H.; Sariciftci, N. S. In Photoresponsive Polymers Ii; Marder, S. R., Lee, K. S., Eds. 2008; Vol. 214, p 1-86. (2) Winder, C.; Sariciftci, N. S., Low Bandgap Polymers for Photon Harvesting in Bulk Heterojunction Solar Cells, J. Mater. Chem. 2004, 14, 1077-1086. (3) Halls, J. J. M.; Walsh, C. A.; Greenham, N. C.; Marseglia, E. A.; Friend, R. H.; Moratti, S. C.; Holmes, A. B., Efficient Photodiodes from Interpenetrating Polymer Networks, Nature 1995, 376, 498-500. (4) Yu, G.; Gao, J.; Hummelen, J. C.; Wudl, F.; Heeger, A. J., Polymer Photovoltaic Cells - Enhanced Efficiencies Via a Network of Internal Donor-Acceptor Heterojunctions, Science 1995, 270, 1789-1791. (5) Beljonne, D.; Pourtois, G.; Silva, C.; Hennebicq, E.; Herz, L. M.; Friend, R. H.; Scholes, G. D.; Setayesh, S.; Mullen, K.; Bredas, J. L., Interchain Vs. Intrachain Energy Transfer in Acceptor-Capped Conjugated Polymers, Proc. Nat. Acad. Sci. USA 2002, 99, 10982-10987.

26
(6) Hennebicq, E.; Pourtois, G.; Scholes, G. D.; Herz, L. M.; Russell, D. M.; Silva, C.; Setayesh, S.; Grimsdale, A. C.; Mullen, K.; Bredas, J. L.et. al., Exciton Migration in Rigid-Rod Conjugated Polymers: An Improved Forster Model, J. Am. Chem. Soc. 2005, 127, 4744-4762. (7) Shibano, Y.; Imahori, H.; Sreearunothai, P.; Cook, A. R.; Miller, J. R., Conjugated "Molecular Wire" for Excitons, J. Phys. Chem.Lett. 2010, 1, 1492-1496. (8) Healy, A. T.; Boudouris, B. W.; Frisbie, C. D.; Hillmyer, M. A.; Blank, D. A., Intramolecular Exciton Diffusion in Poly(3-Hexylthiophene), J. Phys. Chem.Lett. 2013, 4, 3445-3449. (9) Lewis, A. J.; Ruseckas, A.; Gaudin, O. P. M.; Webster, G. R.; Burn, P. L.; Samuel, I. D. W., Singlet Exciton Diffusion in Meh-Ppv Films Studied by Exciton-Exciton Annihilation, Org. Electron. 2006, 7, 452-456. (10) Mikhnenko, O. V.; Cordella, F.; Sieval, A. B.; Hummelen, J. C.; Blom, P. W. M.; Loi, M. A., Temperature Dependence of Exciton Diffusion in Conjugated Polymers, J. Phys. Chem. B 2008, 112, 11601-11604. (11) Shaw, P. E.; Ruseckas, A.; Samuel, I. D. W., Exciton Diffusion Measurements in Poly(3-Hexylthiophene), Adv. Mater. 2008, 20, 3516-+. (12) Markov, D. E.; Tanase, C.; Blom, P. W. M.; Wildeman, J., Simultaneous Enhancement of Charge Transport and Exciton Diffusion in Poly(P-Phenylene Vinylene) Derivatives, Phys. Rev. B 2005, 72. (13) Scully, S. R.; McGehee, M. D., Effects of Optical Interference and Energy Transfer on Exciton Diffusion Length Measurements in Organic Semiconductors, J. Appl. Phys. 2006, 100. (14) Mikhnenko, O. V.; Azimi, H.; Scharber, M.; Morana, M.; Blom, P. W. M.; Loi, M. A., Exciton Diffusion Length in Narrow Bandgap Polymers, Energy & Environmental Science 2012, 5, 6960-6965. (15) Barford, W.; Bittner, E. R.; Ward, A., Exciton Dynamics in Disordered Poly(P-Phenylenevinylene). 2. Exciton Diffusion, J. Phys. Chem. A 2012, 116, 10319-10327. (16) Zalesskaya, G. A.; Blinov, S. I., Delayed Fluorescence of Anthraquinone, Activated by Multiphoton Vibrational Excitation of Triplet Molecules, Sov. Phys. Kokl. 1985, 30, 297-299. (17) Montalti, M.; Credi, A.; Prodi, L.; Gandolfi, M. T. Handbook of Photochemistry 3rd ed.; CRC Press,Taylor and Francis Group: Boca Raton, FL,. 2006. (18) Wintgens, V.; Valat, P.; Kossanyi, J.; Biczok, L.; Demeter, A.; Berces, T., Spectroscopic Properties of Aromatic Dicarboximides. Part1.-N-H and N-Methyl-Substituted Naphthalimides, J. Chem. Soc., Faraday Trans. 1994, 90, 411-421. (19) Borisevich, N. A.; Zalesskaya, G. A.; Urbanovich, A. E., Delayed Luminescence Induced by Multiple Photon Excitation of Ground Electronic State Polyatomic Molecules with Carbon Dioxide Laser, Spectrosc. Lett. 1990, 23, 405-24. (20) Gololobov, A. E.; Dorokhin, A. V.; Zalesskaya, G. A., Vibrational Relaxation of Triplet Molecules at High Vibrational Excitation Levels, Dokl. Akad. Nauk BSSR 1986, 30, 708-11. (21) Zalesskaya, G. A.; Blinov, S. A., Vibrational Excitation of Anthraquinone Triplet Molecules by Carbon Dioxide Laser Radiation in the Absence of Collisions, Dokl. Akad. Nauk SSSR 1985, 281, 1102-5 [Phys.]. (22) Asaoka, S.; Takeda, N.; Iyoda, T.; Cook, A. R.; Miller, J. R., Electron and Hole Transport to Trap Groups at the Ends of Conjugated Polyfluorenes, J. Am. Chem. Soc. 2008, 130, 11912-11920.

27
(23) Penfield, K. W.; Miller, J. R.; Paddon-Row, M. N.; Cotsaris, E.; Oliver, A. M.; Hush, N. S., Optical and Thermal Electron Transfer in Rigid Difunctional Molecules of Fixed Distance and Orientation, J. Am. Chem. Soc. 1987, 109, 5061-5. (24) Morris, J. V.; Mahaney, M. A.; Huber, J. R., Fluorescence Quantum Yield Determinations. 9,10-Diphenylanthracene as a Reference Standard in Different Solvents, The Journal of Physical Chemistry 1976, 80, 969-974. (25) Lakowicz, J. R. Principles of Fluorescence Spectroscopy; 3rd ed.; Springer: New York, NY, 2006. (26) Casida, M. E. In Recent Advances in Density Functional Methods: Part 1; Chong, D. P., Ed.; World Scientific: 1995, p 155. (27) Bauernschmitt, R.; Ahlrichs, R., Treatment of Electronic Excitations within the Adiabatic Approximation of Time Dependent Density Functional Theory, Chem. Phys. Lett. 1996, 256, 454-464. (28) Tomasi, J.; Mennucci, B.; Cammi, R., Quantum Mechanical Continuum Solvation Models., Chem. Rev. 2005, 105, 2999-3093. (29) Gaussian 09, v. A.1, Frisch, M. J.; Trucks, G. W.; Schlegel, H. B.; Scuseria, G. E.; Robb, M. A.; Cheeseman, J. R.; Scalmani, G.; Barone, V.; Mennucci, B.; Petersson, G. A.et. al., 2009. (30) Savin, A. In Recent Advances in Density Functional Methods, Part 1; Chong, D. P., Ed.; World Scientific: 1995, p 129. (31) Vydrov, O. A.; Scuseria, G. E., Assessment of a Long-Range Corrected Hybrid Functional., J. Chem. Phys. 2006, 125, 234109. (32) Rohrdanz, M. A.; Martins, K. M.; Herbert, J. M., A Long-Range-Corrected Density Functional That Performs Well for Both Ground-State Properties and Time-Dependent Density Functional Theory Excitation Energies, Including Charge-Transfer Excited States, The Journal of chemical physics 2009, 130, 054112-054112-8. (33) Rohrdanz, M. A.; Herbert, J. M., Simultaneous Benchmarking of Ground- and Excited-State Properties with Long-Range-Corrected Density Functional Theory, The Journal of Chemical Physics 2008, 129, -. (34) Zaikowski, L.; Kaur, P.; Gelfond, C.; Selvaggio, E.; Asaoka, S.; Wu, Q.; Chen, H. C.; Takeda, N.; Cook, A. R.; Yang, A.et. al., Polarons, Bipolarons, and Side-by-Side Polarons in Reduction of Oligofluorenes, J. Am. Chem. Soc. 2012, 134, 10852-10863. (35) Yanai, T.; Tew, D. P.; Handy, N. C., A New Hybrid Exchange–Correlation Functional Using the Coulomb-Attenuating Method (Cam-B3lyp), Chem. Phys. Lett. 2004, 393, 51-57. (36) Scalmani, G.; Frisch, M. J., Continuous Surface Charge Polarizable Continuum Models of Solvation. I. General Formalism., The Journal of chemical physics 2010, 132, 114110. (37) Scalmani, G.; Frisch, M. J.; Mennucci, B.; Tomasi, J.; Cammi, R.; Barone, V., Geometries and Properties of Excited States in the Gas Phase and in Solution: Theory and Application of a Time-Dependent Density Functional Theory Polarizable Continuum Model, The Journal of chemical physics 2006, 124, 094107. (38) Improta, R.; Barone, V.; Scalmani, G.; Frisch, M. J., A State-Specific Polarizable Continuum Model Time Dependent Density Functional Theory Method for Excited State Calculations in Solution, The Journal of chemical physics 2006, 125, 054103-054103-9. (39) Improta, R.; Scalmani, G.; Frisch, M. J.; Barone, V., Toward Effective and Reliable Fluorescence Energies in Solution by a New State Specific Polarizable Continuum Model Time Dependent Density Functional Theory Approach, J. Chem. Phys. 2007, 127.

28
(40) Wu, Q.; Van Voorhis, T., Direct Optimization Method to Study Constrained Systems within Density-Functional Theory, Phys. Rev. A 2005, 72, 024502. (41) Zheng, S.; Phillips, H.; Geva, E.; Dunietz, B. D., Ab Initiostudy of the Emissive Charge-Transfer States of Solvated Chromophore-Functionalized Silsesquioxanes, J. Am. Chem. Soc. 2012, 134, 6944-6947. (42) Liu, T.; Troisi, A., Absolute Rate of Charge Separation and Recombination in a Molecular Model of the P3ht/Pcbm Interface, J. Phys. Chem. C 2011, 115, 2406-2415. (43) Sreearunothai, P.; Estrada, A.; Asaoka, S.; Kowalczyk, M.; Jang, S.; Cook, A. R.; Preses, J. M.; Miller, J. R., Triplet Transport to and Trapping by Acceptor End Groups on Conjugated Polyfluorene Chains, J. Phys. Chem. C 2011, 115, 19569-19577. (44) Murrell, J. N., Molecular Complexes and Their Spectra. Ix. The Relationship between the Stability of a Complex and the Intensity of Its Charge-Transfer Bands1, J. Am. Chem. Soc. 1959, 81, 5037-5043. (45) Bixon, M.; Jortner, J.; Verhoeven, J. W., Lifetimes for Radiative Charge Recombination in Donor-Acceptor Molecules, J. Am. Chem. Soc. 1994, 116, 7349-7355. (46) Neuteboom, E. E.; Meskers, S. C. J.; Beckers, E. H. A.; Chopin, S. p.; Janssen, R. A. J., Solvent Mediated Intramolecular Photoinduced Electron Transfer in a Fluorene-Perylene Bisimide Derivative, The Journal of Physical Chemistry A 2006, 110, 12363-12371. (47) Carslaw, H. S.; Jaeger, J. C. Conduction of Heat in Solids; 2nd ed.; Oxford University Press, USA: New York, 1986. (48) Zachmanoglou, E. C.; Thoe, D. W. Introduction to Partial Differential Equations with Applications; Dover Publications, 1987. (49) Liang Xi, M. B., † Gina Mauro, † Sadayuki Asaoka, §, Andrew R. Cook, † Hung-Cheng Chen, †‡ and John R. Miller, Continuous Transport of Triplet Excitons Along 100 Nm Polyfluorene Chains, J. Phys. Chem., submitted 2014. (50) Nguyen, T. Q.; Wu, J. J.; Doan, V.; Schwartz, B. J.; Tolbert, S. H., Control of Energy Transfer in Oriented Conjugated Polymer-Mesoporous Silica Composites, Science 2000, 288, 652-656. (51) Hwang, I.; Scholes, G. D., Electronic Energy Transfer and Quantum-Coherence in Pi-Conjugated Polymers, Chem. Mater. 2011, 23, 610-620. (52) Tamai, Y.; Matsuura, Y.; Ohkita, H.; Benten, H.; Ito, S., One-Dimensional Singlet Exciton Diffusion in Poly(3-Hexylthiophene) Crystalline Domains, J. Phys. Chem.Lett. 2014, 5, 399-403. (53) Klaerner, G.; Miller, R. D., Polyfluorene Derivatives: Effective Conjugation Lengths from Well-Defined Oligomers, Macromolecules 1998, 31, 2007-2009.

29
Table of Contents Graphic.
hυ
1(pF+A-)*
pFA
1pF*A
CT emission
hυ
1(pF+A-)*
pFA
1pF*A
CT emission

1
Supporting Information for: Charge Transfer Fluorescence and 34 nm Exciton Diffusion
Length in Polymers with Electron Acceptor End Traps
Lori Zaikowski,1,2* Gina Mauro,1,2,Matthew Bird,2 Brianne Karten1, Sadayuki Asaoka2,†, Qin
Wu3, Andrew R. Cook,2 and John R. Miller2 *
: Table S1. Wavelengths of maximum UV-vis absorption for pFn, pFnNI, and pFnAQ in xylene (XYL), chloroform (CHCl3), tetrahydrofuran (THF), and dimethylformamide (DMF). n = average number of repeat units for each fraction separated by preparatory gel permeation chromatography. Polymer XYL (nm) CHCl3 (nm) THF (nm) DMF (nm) pF24 381 384 388 390 pF28 384 388 388 395 pF30 384 388 389 399 pF32-pF34 385 388 389 400 pF45 385 389 390 400 pF57-pF84 386 389 390 402 pF136 387 390 390 402 pFNI21 386 388 388 395 pFNI22-pF50 386 389 390 396-402 pFNI71-pFNI 117 387 389 390 402 pFAQ17 385 384 387 390 pFAQ20 385 385 388 393 pFAQ24 385 388 389 394 pFAQ26-pFAQ28 386 388 389 399 pFAQ39-pFAQ52 386 389 390 400 pFAQ81 387 389 390 402 pFAQ127 386 390 390 402

2
Figure S1. Steady state UV-vis absorption spectra for pF28, pF22NI, and pF24AQ in THF, xylene, and DMF in 1 cm pathlength quartz cells. 3 x 10⁻⁷ M concentration based on sample mass and MALS average mw. Chloroform spectra, not shown; are almost identical to THF spectra. Note intensity differences among pF, pFNI, and pFAQ spectra in a given solvent. The absorption (and emission) blue shift in xylene is likely due to an increased dihedral angle between monomers, causing reduced pi overlap and a shorter effective conjugation length.1 In DMF the absorption peak shifted red and broadens, which could signal longer conjugation length and more planarity between monomers. Samples in DMF have lower absorption at a given concentration than THF or xylene samples, and lower fluorescence than THF or xylene samples with the same absorption at the excitation wavelength, indicating inter- or intra-chain aggregation.2,3

3
Figure S2. Steady state fluorescence of pF, pFNI, and pFAQ in DMF. Note pF intensity is 30-40 times smaller in DMF than in xylene, chloroform or THF. In pF26NI, pF chain intensity is zero and only (pF+NI-) charge transfer fluorescence is observed. In pF26NI, (pF+NI-) charge transfer fluorescence intensity is ~37 times smaller in DMF than in THF. pFAQ shows little pF chain fluorescence and no charge transfer fluorescence. The fit (black dashed line) for pF26NI in DMF gave E0CT = 2.85, λs = 0.38 eV, and λv = 0.14 eV using eq S1. Equation S14 describes the contour of a charge transfer band
(S1)
}]4/)exp{-[(w!Se)(4 I I
0w
2w
S-21
0 ∑∞
=
−+∆+
= TkwhGTk Bs
osBs λνλπλ

4
Figure S3a. Absorption and fluorescence intensity of pF28 in DMF.

5
Figure S3b). Fluorescence intensity of pF117 in p-xylene and DMF. The intensity in DMF was multiplied by 3.4.

6
Figure S4. Average charge transfer state quantum yields per trapped exciton (φCT/exT) plotted as
a function of charge transfer state energy (E0 CT).

7
Figure S5. The observed fraction of chain fluorescence, Fc, with fits to the homogeneous diffusion model (eqs 5-6) for pFA in xylene, THF, and chloroform with varying capping fractions. These fits like that if Figure 7a) use the average lengths of each polymer fraction, not taking into account the distribution of lengths in each polymer fraction. Pcap is the probability that a chain end has a trap group.

8
Table S2. Diffusion lengths (nD) for pFNI and pFAQ in xylene, THF, and chloroform.
nD = (πDτ)1/2, where D is the diffusion coefficient determined from the one-dimensional
diffusion model, and τ is the lifetime of an exciton.
Pcap pFNI XYL pFNI THF pFNI CHCl3 pFAQ XYL pFAQ THF pFAQ CHCl3
1.0 21.6 26.1 20.7 13.7 24.2 20.9
0.9 25.4 31.1 24.5 16.2 28.4 25.0
0.8 31.2 38.2 29.9 20.0 35.0 31.1
0.7 40.2 49.9 38.6 26.5 45.9 40.7
0.6 55.9 70.9 53.8 38.5 65.0 57.7
0.5 85.2 111.4 83.3 62.9 97.5 87.1
Table S3. ET(30)/(kcal*mol-1) values, dipole moments (µ), dielectric constants (ε), and polarity indices for xylene, THF, and chloroform.
Xylene THF CHCl3 ET(30)/(kcal*mol-1) 33.1 37.4 39.1
µ (debyes) 0 1.63 1.08 εr 2.2 7.5 4.5
Polarity index a ~2.5 4.0 4.1 a http://www.chemical-ecology.net/java/solvents.htm

9
Figure S6. Fits of the intensity of chain fluorescence plotted as a fraction, Fc, of the
fluorescence vs. the average length in repeat units for the nine length fractions of pFNI. The
three panels show data in three solvents. The fits to a model of homogeneous diffusion (eq 5)
include averaging over the distribution of lengths for each polymer fraction as in Figure 7b).

10
Figure S7. Diffusion lengths in repeat units, nD, deduced from fits using the defect model (eq 8) plotted vs. the lengths of the chains. (1) Klaerner, G.; Miller, R. D., Polyfluorene Derivatives: Effective Conjugation Lengths from Well-Defined Oligomers, Macromolecules 1998, 31, 2007-2009. (2) Han, Y.; Fei, Z.; Sun, M.; Bo, Z.; Liang, W.-Z., Unusual Aggregation of Nanosized Six-Arm Star Oligofluorenes, Macromol. Rapid Commun. 2007, 28, 1017-1023. (3) Koizumi, Y.; Seki, S.; Tsukuda, S.; Sakamoto, S.; Tagawa, S., Self-Condensed Nanoparticles of Oligofluorenes with Water-Soluble Side Chains, J. Am. Chem. Soc. 2006, 128, 9036-9037. (4) Penfield, K. W.; Miller, J. R.; Paddon-Row, M. N.; Cotsaris, E.; Oliver, A. M.; Hush, N. S., Optical and Thermal Electron Transfer in Rigid Difunctional Molecules of Fixed Distance and Orientation, J. Am. Chem. Soc. 1987, 109, 5061-5.
![Exciton diffusion, end quenching, and exciton …exciton binding energy can be larger than a third of the band gap energy [4–6], making them stable even at room temperature. The](https://static.fdocuments.net/doc/165x107/5f9e847eddf44d4ccd689439/exciton-diffusion-end-quenching-and-exciton-exciton-binding-energy-can-be-larger.jpg)