EXCHANGE RATE POLICY AND ECONOMIC REFORM IN ETHIOPIA
52
MARCH 1997 , __ ,_. ___ RESEARCH PAPER FIFfY-FOUR , '. , - -. EXCHANGE RATE POLICY AND ECONOMIC REFORM IN ETHIOPIA ASMEROM KIDANE AFRICAN ECONOMIC RESEARCH CONSORTIUM CONSORTIUM POUR LA RECHERCHE ECONOMIQUE EN AFRIQUE
Transcript of EXCHANGE RATE POLICY AND ECONOMIC REFORM IN ETHIOPIA
MARCH 1997
, __ ,_. ___ ~~_~' RESEARCH PAPER FIFfY-FOUR
--,~~~~$" "~'-'-'~~~~:;;~:, ,
""'~~:. ~,~' '.
, --.
EXCHANGE RATE POLICY AND ECONOMIC REFORM IN ETHIOPIA
ASMEROM KIDANE
AFRICAN ECONOMIC RESEARCH CONSORTIUM
CONSORTIUM POUR LA RECHERCHE ECONOMIQUE EN AFRIQUE
jmenustik
Rectangle
Exchange rate policy and economic reform
in Ethiopia

Other publications in the AERC Research Papers Series:
Structural Adjustment Programmes and the Coffee Sector in Uganda by Germina . Ssemogerere, Research Paper 1.
Real Interest Rates and the Mobilization of Private Savings in Africa by EM. Mwega, S.M. Ngola and N. Mwangi, Research Paper 2.
Mobilizing Domestic Resourcesfor Capital Formation in Ghana: The Role of Informal Financial Markets by Ernest Aryeetey and Fritz Gockel, Research Paper 3.
The Informal Financial Sector and Macroeconomic Adjustment in Malawi by C. Chipeta and M.L.C. Mkandawire, Research Paper 4.
The Effects of Non-Bank Financial Intermediaries on Demand for Money in Kenya by S.M. Ndele, Research Paper 5.
Exchange Rate Policy and Macroeconomic Performance in Ghana by C.D. Jebuni, N.K. Sowa and K.S. Tutu, Research Paper 6.
A Macroeconomic-Demographic Modelfor Ethiopia by Asmerom Kidane, Research Paper 7.
Macroeconomic Approach to External Debt: the Case of Nigeria by S. Ibi Ajayi, Research Paper 8.
The Real Exchange Rate and Ghana's Agricultural Exports by K. Yerfi Fosu, Research Paper 9.
The Relationship Between the Formal and Informal Sectors of the Financial Market in Ghana by E. Aryeetey, Research Paper to.
Financial System Regulation, Deregulation and Savings Mobilization in Nigeria by A. Soyibo and E Adekanye, Research Paper 11.
The Savings-Investment Process in Nigeria: An Empirical Study of the Supply Side by A. Soyibo, Research Paper 12.
Growth and Foreign Debt: The Ethiopian Experience, 1964-86 by B. Degefe, Research Paper 13.
Links Between the Informal and Formal/Semi-Formal Financial Sectors in Malawi by C. Chipeta and M.L.C. Mkandawire, Research Paper 14.
The Determinants of Fiscal Deficit and FiscalAdjustment in Cote d'Ivoire by O. Kouassy and B. Bohoun, Research Paper 15.
Small and Medium-Scale Enterprise Development in Nigeria by D.E. Ekpenyong and M.O. Nyong, Research Paper 16.
The Nigerian Banking System in the Context of Policies of Financial Regulation and Deregulation by A. Soyibo and E Adekanye, Research Paper 17.
Scope, Structure and Policy Implications of Informal Financial Markets in Tanzania by M. Hyuha, O. Ndanshau and J.P. Kipokola, Research Paper 18.
European Economic Integration and the Franc Zone: Thefuture of the CFA Franc after 1996. Part I: Historical Background and a New Evaluation of Monetary Cooperation in the CFA Countries by Allechi M'bet and Madeleine Niankey,

Research Paper 19. Revenue Productivity Implications of Tax Reform in Tanzania by Nehemiah E. Osoro,
Research Paper 20. The Informal and Semi-formal Sectors in Ethiopia: A Study of the Iqqub, Iddir and Sav
ings and Credit Cooperatives by Dejene Aredo, Research Paper 21. Inflationary Trends and Control in Ghana by Nii K. Sowa and John K. Kwakye,
Research Paper 22. Macroeconomic Constraints and Medium-Term Growth in Kenya: A Three-Gap
Analysis by EM. Mwega, N. Njuguna and K. Olewe-Ochilo, Research Paper 23. The Foreign Exchange Market and the Dutch Auction System in Ghana by Cletus K.
Dordunoo, Research Paper 24. Exchange Rate Depreciation and the Structure of Sectoral Prices in Nigeria Under an
Alternative Pricing Regime, 1986-89 by Olu Ajakaiye and Ode Ojowu, Research Paper 25.
Exchange Rate Depreciation, Budget Deficit and Inflation - The Nigerian Experience by E Egwaikhide, L. Chete and G. Falokun, Research Paper 26.
Trade, Payments Liberalization and Economic Performance in Ghana by C.D. Jebuni, A.D. Oduro and K.A. Tutu, Research Paper 27.
Constraints to the Development and Diversification of Non-Traditional Exports in Uganda, 1981-90 by G. Ssemogerere and L.A. Kasekende, Research Paper 28.
Indices of Effective Exchange Rates: A Comparative Study of Ethiopia, Kenya and the Sudan by Asmerom Kidane, Research Paper 29.
Monetary Harmonization in Southern Africa by C. Chipeta and M.L.C. Mkandawire, Research Paper 30.
Tanzania's Trade with PTA Countries: A Special Emphasis on Non-Traditional Products by Flora Mndeme Musonda, Research Paper 31.
Macroeconomic Adjustment, Trade and Growth: Policy Analysis using a Macroeconomic Model of Nigeria by C. Soludo, Research Paper 32.
Ghana: The Burden of Debt Service Payment Under Structural Adjustment by Barfour Osei, Research Paper 33.
Short-Run Macroeconomic Effects of Bank Lending Rates in Nigeria, 1987-91: A Computable General Equilibrium Analysis by D. Olu Ajakaiye, Research Paper 34.
Capital Flight and External Debt in Nigeria by S.Thi Ajayi, Research Paper 35. Institutional Reforms and the Management of Exchange Rate Policy in Nigeria by
Kassey Odubogun, Research Paper 36. The Role of Exchange Rate and Monetary Policy in the Monetary Approach to the Bal
ance of Payments: Evidence from Malawi by Exley B.D. Silumbu, Research Paper 37.
Tax Reforms in Tanzania: Motivations, Directions and Implications by Nehemiah E. Osoro, Research Paper 38.
Money Supply Mechanisms in Nigeria, 1970-88 by Oluremi OgunandAdeola Adenikinju, Research Paper 39.
Profiles and Determinants of Nigeria's Balance of Payments: The Current Account
Component, 1950-88, by Joe U. Umo and Tayo Fakiyesi, Research Paper 40. Empirical Studies of Nigeria's Foreign Exchange Parallel Market 1: Price Behaviour
and Rate Determination by Melvin D. Ayogu, Research Paper 4l. The Effects of Exchange Rate Policy on Cameroon's Agricultural Competitiveness by
Aloysius Ajab Amin , Research Paper 42. Policy Consistency and Inflation in Ghana by Nii Kwaku Sowa, Research Paper 43. Fiscal Operations in a Depressed Economy: Nigeria, 1960-90 by Akpan H. Ekpo and
John E. U. Ndebbio, Research Paper 44. Foreign Exchange Bureaus in the Economy of Ghana by Kofi A. Osei, Research Paper
45. The Balance of Payments as a Monetary Phenomenon: An Econometric Study of
Zimbabwe's Experience by Rogers Dhliwayo, Research Paper 46. Taxation of Financial Assets and Capital Market Development in Nigeria by Eno L.
Inanga and Chidozie Emenuga, Research Paper 47. The Transmission of Savings to Investment in Nigeria by Adedoyin Soyibo, Research
Paper 48. A Statistical Analysis of Foreign Exchange Rate Behaviour in Nigeria's Auction by
Genevesi O. Ogiogio, Research Paper 49. The Behaviour of Income Velocity In Tanzania 1967-1994 by Michael O.A. Ndanshau,
Research Paper 50. Consequences and Limitations of Recent Fiscal Policy in COte d'lvoire, by Kouassy
Oussou and Bohoun Bouabre, Research Paper 5l. Effects of Inflation on Ivorian Fiscal Variables: An Econometric Investigation, by Eugene
Kouassi, Research Paper 52. European Economic Integration and the Franc Zone: The Future of the CFA Franc
after 1999, Part II, by Allechi M'Bet and Niamkey A. Madeleine, Research Paper 53.

Exchange rate policy and economic reform
in Ethiopia
Asmerom Kidane Addis Ababa University
AERC Research Paper 54 African Economic Research Consortium, Nairobi
March, 1997

© 1996, African Economic Research Consortium.
Published by: The African Economic Research Consortium P.O. Box 62882
Printed by:
Nairobi, Kenya
The Regal Press Kenya, Ltd. P.O. Box 46116 Nairobi, Kenya
ISBN 9966-900-96-9

Contents
List of tables List of figures Abstract
I II III IV V VI VII VIn IX
Introduction Some effects of an over-valued exchange rate Foreign exchange allocation in Ethiopia The economic reform of 1991 Effects of devaluation on the Ethiopian macroeconomic performance Modelling the monetary effect of devaluation Empirical results The effect of devaluation on real variables Conclusion
Appendix References
1 2 5 9
11 24 28 31 33
35 37

List of tables
1. GDP by industrial origin at constant factor cost (million birr) 2. Growth rate of GDP and its components 3. Balance of payments position of Ethiopiand million birr 4a. Price of trade abies (coffee) 4b. Price of non-tradeables (cereals) 5. Quantity of coffee supplied and auctioned and the ratio of the two 6. Monthly export of coffee in metric tons 7. Official parallel market exchange rates for the Ethiopian birr 8. General consumer price index (CHI) for Addis Ababa 9. Determinants of the price of tradeables dependent variable 10. Determinants of the price of non-tradeables dependent variable 11. Determinants of real exchange rate dependent variable (Log RER) 12. Determinants of coffee supply dependent variable
List of figures
1. GDP by sectors and total (1981-1982 to 1995-1996) 2. Growth rate of GDP and its components (1981-1996) 3. Balance of payment and current account 1989-1993 4a. Price of tradeables (coffee) 4b. Price of non-tradeables (cereals) 5. Coffee supplied and auctioned (monthly observations) 6. Monthly export of Coffee (in metric tons) 7. Official and parallel market (exchange rate for Ethiopian birr) 8. General consumer price index (CPI) for Addis Ababa
14 14 15 16 17 19 20 21 22 29 29 30 32
13 13 15 16 17 18 19 20 22

Abstract
This paper summarizes the macroeconomic consequences of an over-valued currency. It describes the extent of foreign exchange misalignment in Ethiopia and its impact on the foreign exchange rate and the premium obtained through commodity smuggling in the country. Between 1974 and 1991 there were various forms of exchange and trade controls, which resulted in the increase in premiums, smuggling and other macroeconomic inbalances. In 1991 an economic reform programme was introduced that included a 59% devaluation. The effect of the devaluation on various macroecnomic indicators suggests that the exchange rate reform policy was able to produce the desired results. The major conclusion of this study is that devaluation and the corresponding increase in the real exchange rate increased the supply and export of Ethiopia's principal commodity (coffee) through the official market.

I. Introduction
Like many other African countries, Ethiopia faced serious economic problems from the mid 1970s through the entire decade of the 1980s. This debilitating economic crisis manifested itself in various ways, such as low growth rate of GDP, negative growth rate of per capita income, an increasing balance of payments deficit and huge debt servicing followed by accumulation of arrears. Agriculture was hard hit. Agricultural output in general and food production in particular grew at a lower rate than did population, forcing the country to either import basic necessities or depend on external donations.
The causes for the poor state of events were many and varied. Like many other African governments the Ethiopian government put the blame on deteriorating terms of trade, high interest rates and possibly protectionism. Even though these factors did contribute to the worsening economic crisis, by far the most important cause of poor economic performance was overall macroeconomic mismanagement. This is again manifested by lack of appropriate incentive schemes to promote efficient use of resources. In general, the macroeconomic policies of developing countries induding Ethiopia have led to distortions in all sectors of the economy.
The way out of these distortions is to introduce comprehensive economic reform, the aim of which is to regain internal and external balances thereby promoting sustainable growth and development in all sectors.
Among the consequences of poor macroeconomic management is the over-valuation of the exchange rate of a country's currency, which discourages export diversification and makes imports artificially cheap. The quantitative restrictions that are introduced in the allocation of foreign exchange are essentially the result of an over-valued domestic currency. In most economic reform packages one finds that the realignment of exchange rates is a major policy objective. In the following section we briefly consider the effect of an over-valued exchange rate on selected macroeconomic indicators.

II. Some effects of an over-valued exchange rate
Devaluation and balance of payments
We have already noted that an over-valued exchange rate will lead to persistent balance of payments deficits. This is because an over-valued exchange rate makes production for export unprofitable while imports become cheaper. Since hard currency is scarce, only a few individuals or institutions will have access to exchange at the artificially low rate. The fact that imported goods are priced at market prices enables the privileged importers to earn high profits. On the other hand, the excessive dollar-equivalent price of non-tradeables raises the production cost of local manufactures, making them uncompetitive and impeding export of such goods. One may get more insight into the effects of over-valued currencies by classifying production of tradeables and nontradeables. Domestic demand for trade abies will be high because of low relative prices; on the other hand, production of non-tradeables will be discouraged because of low prices and lack of competitiveness.
As export earnings decrease and foreign exchange becomes scarce, governments resort to exchange controls because demand exceeds supply. Controls lead to corruption in the official system, and a parallel market flourishes with an ever-increasing premium. Both exporters and tourists resort to the parallel market, and remittances from abroad fail to go through the banking system. Over time, the quantity of foreign exchange available in the official markets decreases. In general, over-valuation and subsequent exchange controls lead to the widening of current account deficits.
The devaluation of an over-valued currency is expected to narrow the gap in the current account deficit by increasing the profitability of exports and making them more competitive. At the same time, the local currency cost of imports is expected to increase. In other words, there will be reallocation of resources toward the production of tradeables. The effectiveness of such a policy depends on the elasticity of the export supply and the demand for imports. Because there are restrictions on the importation of consumption goods, most imports are capital and intermediate goods whose elasticity may be low. Also, some developing countries are exporters of primary products whose volumes do not respond quickly to price increases - at least not in the short run. Furthermore, the effect of devaluation on the balance of payments assumes that producers of primary products will be beneficiaries of devaluation; this may require institutional reforms such as reforming or eliminating marketing boards or reducing taxes on the agricultural sector

EXCHANGE RATE POLICY AND ECONOMIC REFORM IN ETHIOPIA 3
in general and trade abies in particular.
Devaluation and inflation
While devaluation will stimulate export earnings, reduce the demand for imports and thereby improve the balance of payments position of a country, the short-run inflationary effect is an argument that always concerns policy makers. Improvement in agricultural productivity is usually the long-run objective of African economies. This requires modernizing the sector, which in tum may require imported inputs. The necessary fertilizers, other chemicals and modem implements have to be imported. Thus the cost of production of agricultural produce is likely to increase as a result of devaluation. However, the effect of devaluation on the agricultural prices depends on the fraction of imported inputs on agricultural output. If the major inputs are land and labour only, then the effect of devaluation is likely to be low. Exchange rate realignment is also meant to enable producers to allocate resources more efficiently; in such a case reduction of more expensive imported inputs may be in order.
The effect of devaluation on the cost of production in the manufacturing sector may be substantial if the fraction of imported inputs is quite high. The fact that industries are highly protected, with domestic prices of manufactured products higher than the corresponding prices in the world market, makes industrial establishments rather inefficient. Devaluation will then increase the cost of production. When expressed in local currencies this will be passed to consumers, which will further increase the price and reduce demand. Increased prices will naturally lead to reduced real wages. This is likely to be resisted by wage earners and their unions, leading to increases in nominal wages. The inflationary effect of devaluation is apparent, unless demand for higher wages can be contained.
Devaluation and government budgets
In a situation of over-valued currency, exporters of primary and other products are remitted in local currency at the prevailing official exchange rate; this is nothing but an implicit tax on exports. Since this implicit tax is not used as budgetary support but as a subsidy to importers, the over-valued currency is likely to lead to budget deficits.
Taxes on exports and imports or tradeables constitute a significant portion of government revenue. As a result of decreased export earnings, the revenue from this sector will decrease whenever the extent of over-valuation is substantial. Devaluation will enhance the revenue position of the government. At the same time, expenditure on imports may increase, depending on the elasticity of demand. The latter includes the cost of debt servicing as denominated in local currency. One cannot on the basis of this

4 RESEARCH PAPER 54
argument predict the effect of devaluation on the budget deficit. The overall result depends on the magnitude of debt and debt servicing and on the share of trade taxes in government revenue. Finally, the effect of capital inflow will improve the revenue position of the government when denominated in local currency. The higher the amount of capital inflow, the narrower the expenditure-revenue gap. Since devaluation is followed by increased capital inflow, budget deficits are expected to be narrower.
Devaluation and parallel market
Since an over-valued exchange rate penalizes them, exporters may be forced to channel their foreign exchange receipts through the parallel market where the market premium is substantial. Alternatively, exporters may smuggle their produce rather than use official channels. Either way, governments lose control of foreign exchange allocation. Remittances from abroad will fail to pass through normal banking channels, and in the end the foreign exchange earnings of the government may dry up. Official balance of payments statistics will not show the true position of the country and such misleading statistics will also mislead policy makers.
Devaluation is expected to reduce or eliminate the parallel market premium, reverse the negative consequences and improve efficiency in resource allocation. If devaluation is to be effective, exchange controls may have to be lifted so that market forces will determine the true exchange rate.
We have briefly considered the effect of over-valued currency on balance of payments, inflation, government budgets and the emergence of parallel markets. We also considered how devaluation may improve balance of payments and budget deficits and eliminate parallel markets. Conditions under which a devaluation-induced inflationary spiral would be reduced were also mentioned. One could as well consider the effect of devaluation on other economic variables such as income distribution and the like.

III. Foreign exchange allocation in Ethiopia
The extent of foreign exchange misalignment
In a free market or an open economy both monetary and fiscal policies have to be consistent with the prevailing nominal exchange rate. If this condition is met, then the economy is said to be at a stable and sustainable equilibrium, thereby generating a positive growth rate. On the other hand, if monetary and fiscal policies are not internally consistent with the prevailing exchange rate, a country is certain to face disequilibrium and exchange rate misalignment leading to fiscal deficits as well as exchange rate and balance of payments crises. This is the situation Ethiopia is in.
Over the past 21 years Ethiopia has followed a fixed predetermined nominal exchange rate pegged to the US dollar. This in turn led to the over~valuation of the Ethiopian birr and to an ever-increasing government deficit; the government was forced to balance the deficit mainly through money creation. One result was double-digit inflation, generally greater than the corresponding rate of major trading partners. Between 1988 and 1992 prices increased by 270%. Because of the inconsistency between the fiscal deficits and exchange rate misalignment, the price of non-trade abIes increased by as much as the rate of inflation, while the domestic price of tradeables grew at the inflation rate prevailing in major trading partners. This led to further appreciation of the exchange rate.
Instead of trying to reverse the process, the Ethiopian government (1974-1991) tried to contain it - not by following appropriate policies that would bring the disequilibrium and inconsistency back to sustainable equilibrium and internal consistency, but by imposing further exchange controls and higher duties and by directing further nationalization at the expense of private incentives and the operation of market forces. The controls, duties and interferences include:
1. Denying private investors access to foreign exchange allocations. 2. Uncoordinated and arbitrary rationing of the available foreign exchange among
state-owned enterprises. 3. Strictly controlling the type and quality of goods to be imported. 4. Increasing both import and export duties. 5. Keeping interest at an unrealistically low level and enacting investment laws that
discourage local and foreign investors.

6 RESEARCH PAPER 54
The controls led to the emergence of parallel markets and an increasing budgetary deficit. Over the past 20 years the ratio of the parallel to the official dollar exchange rate of the Ethiopian birr has increased to 3.63 from 1.17. The gap between the two has widened during the past five years. One can also compare the extent of foreign misalignment on fiscal deficits. The expenditure-revenue ratio increased from 0.83 in the late 1950s and early 19608 to 1.34 in the late 1980s. During 1989, 1990 and 1991 the deficit as a percentage of GOP was 14.7, 17.2 and 15.8, respectively.
As stated earlier, the misalignment and the poor performance of the economy were due to the various exchange control regulations as well as the lost time and the costs that follow from such regulations. We briefly consider the foreign exchange allocation process in Ethiopia.
The foreign exchange allocation process
The foreign exchange regulations of Ethiopia that have been in operation over the past 15 years spell out the procedures for transactions in foreign exchange, holding of foreign exchange, surrender and replenishment of foreign exchange, approval of exports of goods and services, capital remittances and payments for imports to Ethiopia. The regulations state that commercial banks cannot hold foreign currency and that they cannot acquire shares, stocks or bonds denominated in foreign currencies. No Ethiopian national resident in the country can maintain a bank account abroad, and every transaction involving hard currency must be made through the National Bank of Ethiopia.
A large percentage of foreign exchange allocated by the national bank is for payments of imports. An importer has to produce a valid foreign trade or import license, and goods to be imported must be free from import prohibition. There are detailed forms to fill, including suppliers' invoices, the terms of payments and the provision of adequate insurance. The process is so detailed and time consuming that by the time the application is approved and payment authorized the original invoice may be outdated and a new process initiated.
Other allocations
Besides foreign exchange allocations for import, there are allocations for "invisibles" such as salary transfers by foreign employees who are entitled to remit 30% of their net earnings. Students with valid visas who leave Ethiopia for study abroad are allowed foreign exchange up to the equivalent of birr 500; students and trainees sent abroad by the Ethiopian government may obtain foreign exchange upon the request of the concerned government department.
It is possible for an individual or an organization to borrow from abroad and make repayment thereof. However, prior consultation with the national bank is required before

EXCHANGE RATE POLICY AND ECONOMIC REFORM IN ETHIOPIA 7
entering into a foreign loan contract. The bank usually approves such loans when the necessary funds are not available locally and the terms and conditions of the loans are reasonable. Individuals or organizations that consider borrowing from abroad must first apply to the exchange controller. The applicant should include information such as the amount to be borrowed, the purpose of the loan, interest rates and other costs, and the terms of repayment. Other required particulars are the name, address and nationality of the lending person or institution, the relationship between the borrower and the lender, and the collateral given. The application must be accompanied by letters from local banks rejecting the desired loan. Subsequent applications for foreign exchange for repayment of the approved foreign loan should be accompanied by a copy of the exchange controller's letter of authority and a local bank's advice of credit.
Other foreign exchange allocations include payment for insurance and reinsurance abroad, premiums on life policies, payment of royalties, transfer of profits and dividends, payment or refunds on travel tickets to air or sea carriers of foreign ownership and tour operators, as well as transfer of foreign exchange by diplomatic missions and international organizations. Like the allocation of foreign exchange for import, these entitlements require detailed administrative procedures and various restrictions, leading to substantial costs in terms of money, time and labour.
Actual allocation processes 1974-1992
The implementation of the rules and regulations described above has not been uniform over the years. This is due to several reasons, including the deterioration in the country's export earnings and subsequent decline in foreign exchange reserves at the disposal of the national bank, the introduction of orthodox marxist economic policies, and the transfer of the foreign exchange allocation process from the National Bank of Ethiopia to the Workers' Party of Ethiopia.
The actual allocation procedure over the past 20 years or so can be broken into four phases: pre 1974, 1974-1983, 1984-1991 and post 1991. During the pre 1974 phase, the foreign exchange reserve of the country was sound and there was a thin and insignificant parallel market exchange rate. The exchange controller of the National Bank of Ethiopia had the authority to allocate the requested foreign exchange on a daily basis provided that all the necessary procedures were followed. During the peak foreign exchange earning season (October to February) the quantity supplied was more or less equal to the amount demanded.
When deciding to make a foreign exchange allocation the exchange controller considered the available foreign exchange and the expected earnings; the latter were estimated by taking into account the export permits issued. During the off-peak season foreign exchange allocation was sometimes delayed by a few days to two weeks, depending on the amount requested and on the expected earnings. A substantial portion of the allocation was made to the private sector.
8 RESEARCH PAPER 54
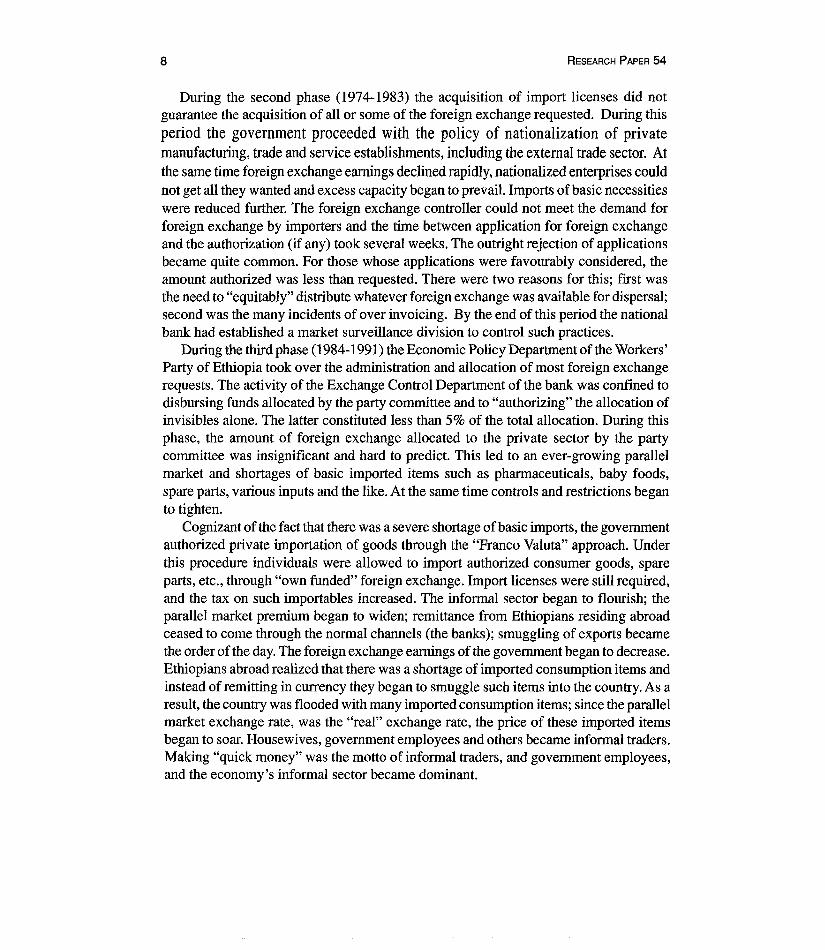
During the second phase (1974-1983) the acquisition of import licenses did not guarantee the acquisition of all or some of the foreign exchange requested. During this period the government proceeded with the policy of nationalization of private manufacturing, trade and service establishments, including the external trade sector. At the same time foreign exchange earnings declined rapidly, nationalized enterprises could not get all they wanted and excess capacity began to prevail. Imports of basic necessities were reduced further. The foreign exchange controller could not meet the demand for foreign exchange by importers and the time between application for foreign exchange and the authorization (if any) took several weeks. The outright rejection of applications became quite common. For those whose applications were favourably considered, the amount authorized was less than requested. There were two reasons for this; first was the need to "equitably" distribute whatever foreign exchange was available for dispersal; second was the many incidents of over invoicing. By the end of this period the national bank had established a market surveillance division to control such practices.
During the third phase (1984-1991) the Economic Policy Department of the Workers' Party of Ethiopia took over the administration and allocation of most foreign exchange requests. The activity of the Exchange Control Department of the bank was confined to disbursing funds allocated by the party committee and to "authorizing" the allocation of invisibles alone. The latter constituted less than 5% of the total allocation. During this phase, the amount of foreign exchange allocated to the private sector by the party committee was insignificant and hard to predict. This led to an ever-growing parallel market and shortages of basic imported items such as pharmaceuticals, baby foods, spare parts, various inputs and the like. At the same time controls and restrictions began to tighten.
Cognizant of the fact that there was a severe shortage of basic imports, the government authorized private importation of goods through the "Franco Valuta" approach. Under this procedure individuals were allowed to import authorized consumer goods, spare parts, etc., through "own funded" foreign exchange. Import licenses were still required, and the tax on such importables increased. The informal sector began to flourish; the parallel market premium began to widen; remittance from Ethiopians residing abroad ceased to come through the normal channels (the banks); smuggling of exports became the order of the day. The foreign exchange earnings of the government began to decrease. Ethiopians abroad realized that there was a shortage of imported consumption items and instead of remitting in currency they began to smuggle such items into the country. As a result, the country was flooded with many imported consumption items; since the parallel market exchange rate, was the "real" exchange rate, the price of these imported items began to soar. Housewives, government employees and others became informal traders. Making "quick money" was the motto of informal traders, and government employees, and the economy's informal sector became dominant.

IV. The economic reform of 1991
By May 1991, when the New Transitional Government of Ethiopia took over by toppling the Stalinist regime of Mengistu, the foreign exchange earnings of the country had reached a very low level. No foreign assistance except food for the hungry was forthcoming.
Early in 1992 the new government agreed to undertake economic reforms as prescribed by the IMP and the World Bank. Economic assistance began to arrive and the national bank regained its authority as the custodian and distributor of foreign exchange.
The newly announced economic reform prograinmes include the reorganization of state-owned enterprises and marketing boards. Most important, all export duties were eliminated, the birr was devalued by 59% and a foreign exchange auction system was introduced. These three reforms aimed at realigning foreign exchange management in Ethiopia. In other words, one of the major objectives of the economic reform was the use of foreign exchange as a tool for bringing about economic growth and stability. Before we consider the effect of devaluation on key macroeconomic indicators, we will first provide a brief description of the overall reform.
One of the major undertakings of the Transitional Government of Ethiopia is to limit the role of the government in the economy while at the same time encouraging the development of the private sector. In other words, most new macroeconomic policies are aimed at creating a conducive environment for a private sector based on the free market. The economic reforms include changes in private investment policy, fiscal and monetary policies, labour market policies, trade policies, private sector deregulation, and exchange rate realignment. A brief description of some of the macroeconomic reforms is given below.
A new investment policy that is more liberal and less bureaucratic was introduced in 1992. A separate office - The Investment Office of Ethiopia (IOE) - was established to facilitate applications for investment. To invest in Ethiopia one needs a license. One may obtain the license from IOE, from one ofthe Regional Investment Offices (RIO) or from one of the sectoral ministries. The investment law is detailed, clear and full of options. We may not do justice to summarize the incentives to which would-be investors are entitled. A summary of new investment projects since the revised regulations were issued shows a total of 714 projects with an aggregate capital of 4.5 billion birr, which is more than US$900 million, have been granted; 46.9% of this is in foreign currency. When classified by source of finance, 43.9% is in the form of equity while the rest is in the form of loans. Out of the 714 projects 44% are in the industrial sector followed by about 12% in agriculture.
The fiscal policy of the country since economic liberalization aims to reduce the

10 RESEARCH PAPER 54
government deficit and its inflationary impact. Revenue from direct tax constitutes a small percentage of the total and this share has been declining over the past six years. On the other hand, because of the devaluation of the birr in October 1992, tax from imports increased substantially and this contributed to the reduction of the deficit. A major effort at narrowing the budgetary gap came through a reduction in the government deficit through decreased defense expenditure. A deficit still prevails, since the economic reforms have been financed by external loans and domestic bank borrowing. The latter constitutes 6.3% of GDP, which compares favourably with the 10.2% that existed during the pre-reform period.
After the introduction of the reforms there was a substantial reallocation of resources from the public to the private sector through the elimination of differential interest rates on deposit and lending for private and public sector as well as cooperatives. The nominal interest rate was also raised to improve the returns on financial assets. This resulted in a substantial increase in real interest. Furthermore, the restrictive monetary policy increased the availability of loanable funds. This was accomplished by reducing the government deficit and restricting money supply. The aim was to prevent the growth in money supply from exceeding the level of inflation.
The major component of the reform is the attempt to realign the exchange rate through devaluation and the introduction of the auction system. In October 1992 the Ethiopian birr was devalued from 2.07 birr per dollar to 5.00 birr per dollar. At that time the parallel market exchange rate was 7.80 birr to the dollar - a premium of more than 37%. Unlike the experience of many other African and Latin American countries the parallel market rate did not appreciate further.
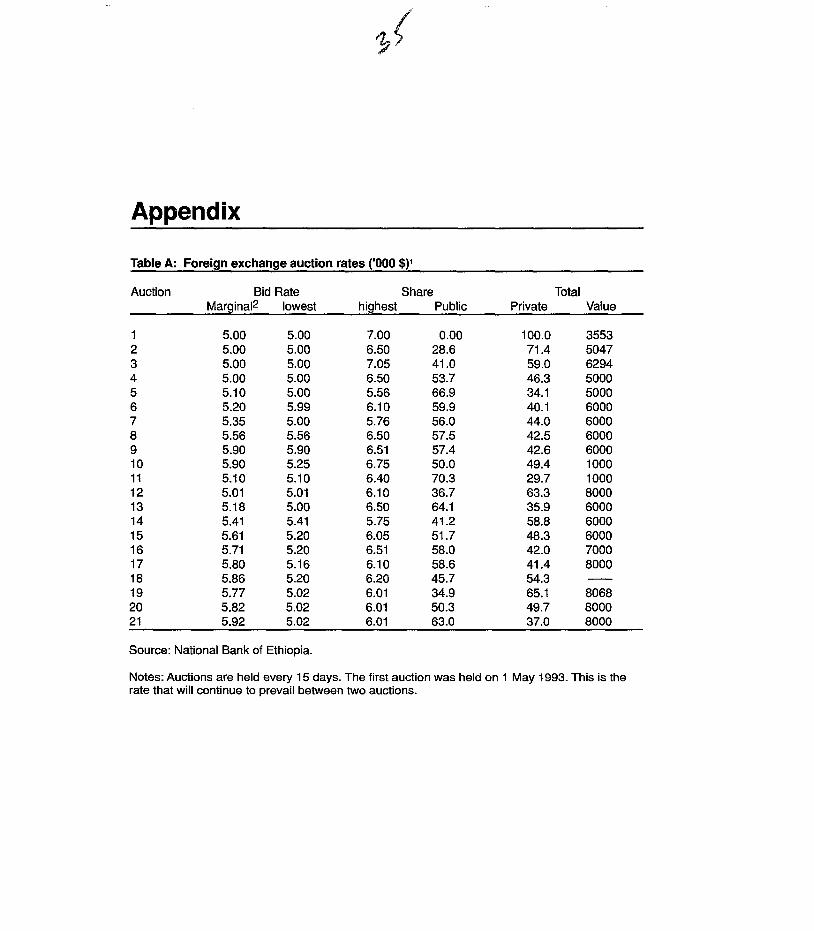
In May 1993, the national bank introduced an auction system, which implies the application of dual exchange rates. The first one (the 5 birr to the dollar) applied to the importation of basic items such as petroleum, pharmaceuticals, and payments of debts and other external obligations. The market (auction) determined exchange rate applied to the importation of other items. Both the private and the public sector can participate in the auction market, which is conducted every 15 days. Participants from the private sector are expected to have import licenses and to present pro forma invoices. The price quotation that clears the market during a particular auction period is the rate that prevails for the next 15 days. The table in Appendix A shows the highest and lowest bids for each auction, as well as the one that clears the market. The table also shows the total bid amount as well as the share that goes to the private sector. It should be noted that before the reforms almost all the foreign exchange was used by the state. The table shows the increased share of the private sector in the acquisition of foreign exchange since the introduction of the auction system.
I (
v. Effects of devaluation on the Ethiopian macroeconomic performance
Before considering the effect of devaluation on the Ethiopian economy, we will look briefly at the macroeconomic performance before the implementation of the reform package. We will also consider some indicators of the extent of foreign exchange misallocation. It should be noted that the economic reform and liberalization programme currently under way in Ethiopia is relatively recent. A detailed analysis of exchange rate and other reforms may be premature and may have to wait one or two more years. However, there are indications that the programme is showing some positive results. For example, it was expected that immediately after devaluation the parallel market exchange rate would appreciate, but it did not increase further as a result of devaluation. In fact, the premium has been substantially reduced. The inflationary spiral that was expected on non-tradeables such as food and other basic necessities did not materialize; the amount of export items smuggled into neighbouring countries is believed to have been reduced; and the extent of resource misallocation such as excess capacity is showing some improvement.
For purposes of comparison, some pre and post reform empirical information on major economic indicators of macroeconomic performance is summarized below. As the major component of the reform is devaluation, we will analyse macroeconomic performance vis-a-vis exchange rate unification.
Gross domestic product (GOP)
Figures 1 and 2 as well as Tables 1 and 2 present estimated GDP and its growth rate at factor cost from 1981/82 until 1995/1996. The results show substantial reduction, especially during the late 1980s and early 1990s. On the other hand, there was some improvement during 1992-1993. Estimated GDP and its growth rate are also given for 1994 to 1996, where some positive results suggest improved macroeconomic performance in the industrial sector followed by agriculture. While these results show a positive effect of the overall economic reform policy, they may not be direct indicators of the effect of one of the components of reform, namely, devaluation. A better indicator of the effect of devaluation on resource allocation would be the following variables:

12 RESEARCH PAPER 54
• Balance of payments • The prices of tradeables and non-tradeables • Supply and export of coffee • Parallel market premium • Inflation
Balance of payments
The balance of payments and current account deficit position of the Ethiopian economy over the past 16 quarters is given in Figure 3 and Table 3. The results show slight improvement in the balance of payments position after the October 1992 devaluation, suggesting a positive impact on exchange realignment. However, we may have to wait several quarters before a consensus is reached on this point. Quarterly balance of payments statistics in Ethiopia are usually published with a one-year lag.
The price of tradeables and non-tradeables
Prices playa vital role in the efficient allocation of resources. More specifically, higher prices on tradeables are expected to improve the performance of the export sector. It is not easy to establish a clear demarcation between what is tradeable and what is not. For purposes of analysis in this paper, the domestic price of coffee will serve as an indicator of price movement of tradeables, while the price of cereals (all of which are produced and consumed locally) will be the indicator of non-trade abies. Monthly price movements of the two commodity groups are given in Figures 4a and 4b, followed by the corresponding Tables 4a and 4b.
Figures 4a and 4b show monthly data (September to October) for the years 1990-1991, 1991-1992 and 1992-1993. The reason for starting with the month of October is to compare the prices before and after devaluation (October 1992). Thus the two monthly price series 1990-1991 and 1991-1992 are before devaluation and those of 1992-1993 are after. The results in Figures 4a and 4b show a dramatic increase in the price of coffee, a major tradeable commodity, compared to cereals, which are non-tradeable. It should be noted that the price of tradeables is the estimated producers price and not the world price.

EXCHANGE RATE POLICY AND ECONOMIC REFORM IN ETHIOPIA
Figure 1: GOP by sectors and total (1981-1982 to 1995-1996)
.... .... :0_ c (J)
.Q -g :::ro
11 -11- Agriculture -,-Total -0- Other -0- Distribution ~
10 -e- Industry ~
9 /-'~-'-" ~ '-....,/ 81-~ '-........
7 E ~ 6 c 0
0:: F= 5 _. . -.----a-
C) 4 ....................... ............._-.-.--- -. 3
,,-..-.
1 1 2 3 4 5 6 7 8 9 10 11 12 13 14 15
Years
Figure 2: Growth rate of GOP and its components (1981-1996)
20 -.- Agriculture -,- Total -0- Distribution -0- Other
15 -Industry
10
-c 5 Q)
t? Q)
0 Q..
-5
-10
-15
-20 1 2 3 4 5 6 7 8 9 10 11 12 13 14
Years
13

14 RESEARCH PAPER 54
Table 1 : GOP by industrial origin at constant factor cost (million birr)
Agriculture Industry Distribution Other Total
1981/82 3807.7 1312.5 1264.0 1586.8 7671.0 83 4203.2 1376.1 1346.2 1683.9 8610.4 84 3685.7 1460.1 1367.6 1671.7 8185.1 85 3125.3 1473.5 1356.6 1748.5 7703.9 86 3480.6 1516.0 1464.2 1776.0 8236.8 87 4006.7 1588.6 1540.1 1896.8 9024.2 88 3923.7 1604.9 1596.1 2068.1 9192.8 89 4011.4 1611.6 1627.4 2091.4 9341.8 90 4020.5 1536.8 1573.6 2081.9 9212.8 91 4342.9 1289.1 1429.6 2092.0 9153.6 92 4169.2 1226.4 1371.2 1712.5 8479.3 93 4375.3 1379.4 1498.3 1869.4 9122.4 94* 4546.3 1524.3 1613.3 1970.9 9654.8 95* 4752.2 1611.9 1732.4 2085.3 10212.3 96* 4935.6 1800.0 1856.6 2210.6 10802.7
Source: National Bank of Ethiopia, Economic Research and Planning Department. * Estimated values.
Table 2: Growth rate of GOP and its components
Time Agri. Ind. Dist. Other Total
1982-83 10.4 4.8 6.5 6.1 8.2 1983-84 -12.3 6.1 1.6 -1.0 -4.5 1984-85 -15.3 1.0 -1.0 4.5 -5.9 1985-86 11.3 2.9 7.9 1.6 6.9 1986-87 15.1 4.8 5.2 6.8 10.0 1987-88 2.2 1.0 3.6 9.0 1.9 1988-89 2.2 1.0 2.0 1.1 1.7 1989-90 0.2 -4.5 -3.4 -0.5 -1.1 1990-91 8.0 16.4 -9.2 0.1 -7.4 1991-92 -4.0 -4.9 -4.1 -18.2 7.5 1992-93 4.9 12.5 9.3 9.1 5.8 1993-94 3.9 10.5 7.7 5.4 5.7 1994-95 4.5 9.0 7.3 5.8 5.7
Source: National Bank of Ethiopia, Economic Research and Planning Department

EXCHANGE RATE POLICY AND ECONOMIC REFORM IN ETHIOPIA
Figure 3: Balance of payment and current account 1989-1993
500
00 -500 c:: .Q
'E -1000 -"-"-
OJ -1500
-2000
---- BOB -e- Current account
-2500 L-..L.
1-
21..-....L
3-...L..
4 -51..-....1.
6-...L..
7 -8"-· ---L
9- .......
10-
1"'-1--'12-....... 13-.L.....I
Quarters
Table 3: l13alance of payments position of Ethiopia in million birr (quarterly values)
Time Balance of payments Current account
1989-90 1 - 65.1 -2349.0 2 - 58.7 -259.0 3 - 26.0 -79.0 4 -8.1 -44.6 1990-91 1 3.1 -462.3 2 -26.7 -435.7 3 73.3 -327.4 4 192.1 122.1 1991-92 1 -95.0 67.75 2 -91.0 -84.7 3 -52.8 -46.2 4 -275.9 -78.4 1992-93 1 -129.0 -11.1 2 3 4
Source: National Bank of Ethiopia, Economic Research and Planning Department.
15

16 RESEARCH PAPER 54
Figure 4a: Price of tradeables (coffee) (birr per metric ton)
-11- 1990-91 -0- 1992-93
.... ....
~:;19~-94 / ~----/
ill
Month
Table 4a: Price of tradeables (coffee) {estimated producer price)1
Month 1990-91 1991-92 1992-93 1993-94
October 2630 3915 7921 November 2515 4729 7558 December 2502 5355 7467 January 2526 2505 5642 6731 February 2557 2399 5645 7632 March 2629 2431 5873 April 2632 2392 5787 May 2567 2351 5647 June 2545 2344 5605 July 2504 2351 7071 August 2479 2284 9397 September 2511 2288 9003
Source: National Bank of Ethiopia, Economic Research and Planning Department.
1. Birr per metric ton.

EXCHANGE RATE POLICY AND ECONOMIC REFORM IN ETHIOPIA
Figure 4b: Price of non-tradeables (cereals)
105 I-
100 I-
95 I-
[j3 90 "0 c
85 I-
80
75 I-
----1990 -1991 _- 1991-1992 -0-1992-1993 -0- 1993 -1994
70~--~--L-~--~--~1~--~'~~'~~--~~~~--~'~ 1 2 3 4 5 6 7 8 9 10 11 12
Table 4b: Price of non-tradeables (cereals)
Month
October November December January February March April May June July August September
1990-91
73.5 77.2 84.3 86.9 88.9 92.6 90.1 89.3 88.1
1991-92
87.2 90.2 86.4 85.4 91.4 91.2 93.8 93.2 94.6 96.2 99.7
100.0
Months
1992-93 1993-94
99.6 99.2 99.5 99.8 97.6 95.2 97.4 95.2 97.5 97.2 97.7
103.6 103.6 99.9 99.0 99.5 99.6
Source: Central Statistics Authority of Ethiopia, Statistical Abstract (various issues)
1. Birr per metric ton.
The supply response of coffee cannot be analysed in the short run because coffee is
17

18 RESEARCH PAPER 54
Figure 5: Coffee supplied and auctioned (monthly observations)
14
4
10 (j) "0 c: 8 ro (j) :::J 0
6 .c: I--
4
2
0
---Supplied -e- Auctioned •
r-
r-
1\ . / I- /\/\ .. I
j ____
/ ~ ~ .? ~ ~ i/" . . \/) ~----// -.......
..... ~' I I I
1 2 345 678 9101112131415161718192021222324 Months
I
"perennial". On the other hand, it is conceivable that the extent of smuggling of coffee through the borders may have been reduced. Besides, the domestic consumption of coffee in Ethiopia has always been substantial. As a result of devaluation and the corresponding increase in price there may be a shift from domestic consumption to export. There may thus be a short-run "supply response" as a result of the increased price of coffee.
The extent of decrease in coffee smuggling can be estimated by observing the amount of coffee supplied to various branches of the Coffee Marketing Board. Monthly data over the three periods are provided in Figure 5 and Table 5. Even though there is seasonal variation in coffee trade, the results in Figure 5 show a substantial increase in the amount of coffee supplied to official marketing channels.
A comparison between the amount supplied and the amount auctioned may indicate whether there has been a shift from domestic consumption to export. Both auctioned and supplied amounts are plotted in Figure 5. A high auction-supply ratio may indicate a shift from domestic consumption to exports and this is what the figure tries to show. A monthly volume of export is also provided in Figure 6 and Table 6. Even though there is high seasonal variation, the results show marked increase in coffee export after the October 1992 devaluation.

EXCHANGE RATE POLICY AND ECONOMIC REFORM IN ETHIOPIA 19
Figure 6: Monthly export of coffe (in metric tons)
14 -1990-91 -·-1991-92
12 -0-1992-93 -0-1993-94
- 10 en "0 c m 8 en :::J 0 ..c t:.. 6
4
2
0 1 2 3 4 5 6 7 8 9 10 11 12
Time (Years)
Table 5: Quantity of coffee supplied and auctioned and the ratio of the two (metric tons)
Date Supplied (S) Auctioned (A) Ratio (A/S)
1991-1992 July 942 215 0.23 August September 2738 237 0.09 October 1036 211 0.20 November 3609 1330 0.37 December 4499 3983 0.88 January 6181 4697 0.76 February 9592 4528 0.47 March 7445 3803 0.51 April 8143 2291 0.28 May 8786 2024 0.23 June 5002 2202 0.44 1992-1993 July 2074 1013 0.49 August 2150 915 0.43 September 1672 1297 0.78 October 3573 3293 0.92 November 5052 4770 0.94 December 6043 5400 0.90 January 8380 6901 0.82 February 12202 6381 0.52 March 13834 6237 0.45 April 12032 4125 0.34 May 10049 3454 0.34 June 10608 4009 0.38

20 RESEARCH PAPER 54
Figure 7: Official and parallel market (exchange rate for Ethiopian birr)
8 --- Official -e- Parallel
7
1
II I I I I It
o 1 2 3 4 5 6 7 8 9 10 11 12 131415 16 17 18 19 2021 22 2324 25
Time (years)
Table 6: Monthly export of coffee in metric tons
Month
October November December January February March April May June July August September
1990-91
2,841 4,074
10,345 10,409 12,650
375 269
2,459 2,538
1991-92 1992-93
3,167 351 380 6,026 971 2,089
3,228 4,701 2,182 6,724 4,147 4,274 3,337 8,336 1,999 8,948 7,300 12,508 4,794 8,241 4,355 5,091 4,259 4,410
1994-95
2,331 2,121 1,948
Source: National Bank of Ethiopia, Economic Research and Planning Department.
The parallel market premium
The limited supply of foreign exchange and the strengthening of foreign exchange controls and trade restrictions during the 1980s resulted in the substantial growth of the parallel exchange market. During the early 1970s official and parallel market exchange rates were the same. There were even cases where the parallel market rate was lower than the

EXCHANGE RATE POLICY AND ECONOMIC REFORM IN ETHIOPIA 21
Table 7: Official/parallel market exchange rates for the Ethiopian birr
Time Official (0) Parallel (P) Ratio (P/O)
1981 2.01 3.04 1.51 1982 2.07 3.34 1.61 1983 2.07 3.54 1.71 1984 2.07 4.13 2.00 1985 2.07 4.17 2.01 1986 2.07 3.85 1.86 1987 2.07 5.50 2.66 1988 2.07 5.70 2.75 1989 2.07 6.50 3.14 1990 2.07 7.00 3.38 1991 2.07 7.50 3.62 1992 September 2.07 7.80 3.77 October 5.00 7.80 1.56 November 5.00 7.80 1.56 December 5.00 7.50 1.50 1993 January 5.00 7.50 1.50 February 5.00 7.50 1.50 March 5.00 7.48 1.50 April 5.00 7.50 1.50 May 5.00 7.60 1.50 June 5.05 7.60 1.52 July 5.30 7.45 1.50 August 5.73 7.20 1.45 September 5.40 7.00 1.25
official rate, especially for small amounts of hard currency. After 1974 the ratio of the parallel to the official rate was only 1.07. By 1980 it had reached 1.5 and during early 1992, that is, before devaluation, it was about 3.62. Economists expected the premium to remain the same after the October 1992 devaluation - or even increase further. This did not happen. Figure 7 and Table 7 show the convergence between the parallel and official exchange rates as a result of the devaluation. As of September 1993, the ratio of the parallel to the official market was only 1.25; this shows a substantial improvement compared to the pre-devaluation ratio in September 1992, one year earlier.
Inflation
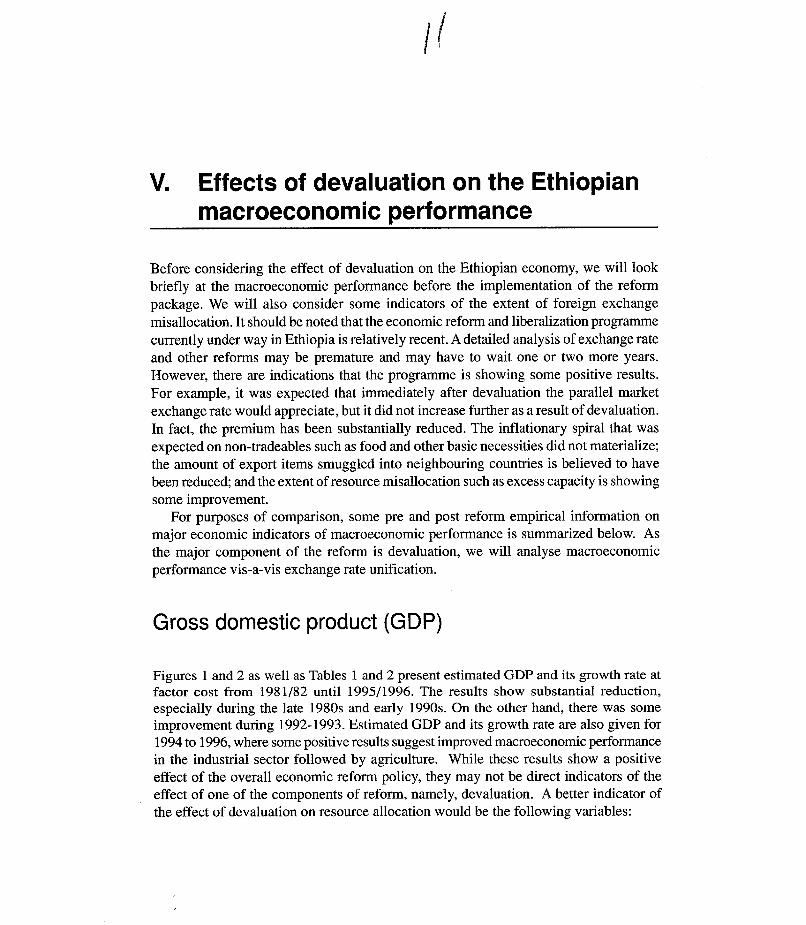
The immediate effect of a devaluation is expected to be an increase in prices in general and the cost ofliving in particular. This is especially so if the foreign exchange component of domestically produced goods and services is high. While detailed analysis of the inflationary consequence of inflation is beyond the scope of this study, the price index of Addis Ababa was compared for the three periods. This is shown in Figure 8 along with the corresponding Table 8. The overall index shows a high value because the base
22 RESEARCH PAPER 54
Figure 8: General consumer price index (CPI) for Addis Ababa
105
100
95
~ 90 "'0 C
85
80 -
75
-·-1990-1991 ----1991-1992 -0-1992-1993 -0- 1993-1994
70~---~'--~'~'--~---~'~'--~'---L-'~--~--~--~~ 1 2 3 4 5 6 7 8 9 10 11 12 13
Time (Years)
Table 8: General consumer price index (CPI) for Addis Ababa
Month
October November December January February March April May June July August September
1990-1991
73.0 77.0 84.2 86.8 88.8 92.6 90.1 89.3 88.1
1991-1992
87.3 90.2 86.5 85.4 91.3 91.1 93.8 93.2 94.5 96.1 99.8
100.0
1992-1993 1993-1994
100.7 99.8 99.5 95.2 97.5 95.2 97.4 97.2 97.5 97.7
104.4 99.9 99.1 99.5 99.6 99.1
Source: Central Statistics Authority of Ethiopia, Statistical Abstract (various issues).
period (1963) is 33 years old. The comparison of the CPI over the three periods shows that the inflationary impact of devaluation was not significant.

VI. Modelling the monetary effect of devaluation
When modelling the effect of devaluation we separate such effects into monetary and real variables. The analysis of the monetary (price) effect considers the impact of devaluation on:
• Price of tradeables • Price of non-trade abies • Real exchange rate
To study the effects on real variables, we consider the supply of exports to the official market as opposed to the parallel market.
Price of tradeables
The modelling exercise here draws heavily on the work by Elbadawi (1990). We begin with a small economy assumption and assume the price of trade abies - both exports and imports - as given. Given both official and parallel market exchange rates as well as the prevailing trade policy, the domestic price of exportables and importables in terms of a given currency can be expressed as:
(1)
p e f3 e(1-/3) (1 + t )p* 0 < f3 < 1 m m m' (2)
P ap (I-a) 0 1 x m •••• <a< (3)
Where P x and Pm are the domestic prices of exports and imports, respectively. The corresponding given international prices are P* x ' P* m; e and e are the official and parallel market exchange rates; and tx and tm are export and import taxes. The latter two are indicators of the extent of trade liberalization. In other words, in the presence of complete liberalization, tx = tm = o. One should note that the parallel market exchange

24 RESEARCH PAPER 54
rate is introduced in the determination of the price of imports. This is because the demand for dollars through the parallel market is for purposes of financing imports. The parameter f3 is an indicator of the extent of such dependency. The price of tradeable PI is the weighted mean of P and P
x m Equations 1, 2 and 3 may now be used to derive an equation that explains the
determinants of the price of tradeable Pt' Elbadawi (1992) expresses this in a logarithmic form as follows:
log(Pt ) = loge + (1- a)(l- {3)log(q) + a log(1- tx ) + (1- a)
+a log(P;) + (1- a) log(P:) (4)
In the above equation, is the parallel market premium. The premium positively
affects the price of tradeables; the magnitude of the relation depends on the value of ex and ~ that is, the weights given to the price of exportables as well as the magnitude of the parallel market. The official exchange rate may also positively affect the price of trade abIes even though the magnitude cannot be specified beforehand. Finally, the effect of the international price of importables could have a positive effect. The value of their respective coefficients depends on ex- the weights given to the price of exportables.
Price of non-tradeables
The demand and supply functions for non-tradeables can be represented by the following equations:
(5)
(6)
It should be noted that besides the corresponding prices, real income Y and excess aggregate demandf(.) affect the demand for non-tradeables only, while excess capacity C affects aggregate supply of non-tradeables. In this exercise, excess demand is defmed
p
as the rate of growth of domestic credit less the rate of growth of income. For simplicity

EXCHANGE RATE POLICY AND ECONOMIC REFORM IN ETHIOPIA 25
we assume that excess capacity Cp
is fixed. By expressing Equations 5 and 6 in logarithmic forms that differentiating and
expressing the result in proportionate changes, we can rewrite the results as:
(7)
(8)
It should be noted that.t: > 0 and (J. < 0 for j = x ,m; 8.is the price elasticity of demand )} }
for non-tradeables, while (J. < 0 is the corresponding supply elasticity. The static )
eqUilibrium in the non-tradeable goods market (DN = SN) yields
(9)
Further algebraic manipulation yields a formula for P N - the price of non-tradeables, which is given as
(10)
Where:
The direct measure of excess demand is given by:
J=(DC-e-n (11)

26 RESEARCH PAPER 54
Plugging equations 1,2 and 11 into Equation 10, rearranging the terms and expressing in their logarithmic forms, we get a reduced form equation for the determinants of nontradeables as follows:
Pn = Wo + log(e) + (1- w)(I- P)log(q) + w log(1- tx) + 1-w log(1 + tm)
* cd +wlog(Px ) + (1- w)log(Pm) + Wy log(-)
eoy (12)
Equation 12 shows that the price of non-tradeables depends on those variables that affect the price of trade abIes plus income as well as an indicator of domestic excess capacity.
The real exchange rate (RER)
We can now define the real exchange rate as the ratio of the weighted average price of tradeables to the price of non-tradeables. In other words:
P*ap *(l-a) p* RER = e x m = !!....L
PN PN
(13)
This definition ofRER is appropriate for a dependent economy. Using equations 1, 2, 10 and 13, we obtain a reduced form equation for the real exchange rate that yields:
p* logRER= -Wo - Wlog(l-tx)-(l- W)log(l- tm)-(W - a)log[-+]
Pm
DC -Wy log(Y)- Wflog[ eY ] - (1-:- W)(1- ,B)log(q) (14)
Effect of HberaHzauon
A decrease in export and import tax (more liberalization) will cause the depreciation of the real exchange rate. The extent of depreciation depends on the relative elasticities of the price of non-trade abies to the price of exportables. This will be so if the substitution effect dominates the potential income effect. If the income effect dominated the substitution effect, we would have an appreciation of real exchange rate, which is contrary to the depreciation predicted by Equation 13.
EXCHANGE RATE POLICY AND ECONOMIC REFORM IN ETHIOPIA 27
Effect of expenditure
An increase in expenditure (Y) or excess demand will lead to an appreciation of real exchange rate. This is because higher expenditure will result in the increase in the price of non-tradeable P N (Equation 10). The extent of appreciation depends on Wyand WI' which in turn depend on income and price elasticities.
Effect of black market premium
A rise in the black market premium leads to real exchange rate appreciation. The size of the appreciation depends on price elasticity of home goods (l-W) as well as share of imports financed through the black market (1 -/3).
The effect of terms of trade
The terms-of-trade effect is ambiguous. Terms of trade could lead to an appreciation of real exchange rate if exportable price elasticity exceeds the share of exportables in the tradeable goods sector [(w -a) > 0]. The opposite will be true if [(w -a) < 0].

VII. Empirical results
Data
In this sector we describe the data required for estimating the reduced form equations on the determinants of the prices of tradeables and non-tradeables and of the real exchange rate. In order to capture the effect of the 1991-1992 economic reforms in general, and that of devaluation in particular, we have used quarterly data up to the end of 1994. First we took coffee, which constitutes more than 75% of Ethiopian export earnings, as the only tradeable commodity. All cereals produced within Ethiopia are consumed locally, and this constitutes more than 80% of domestic agricultural production. Cereals are thus classified as non-tradeables. Up-to-date quarterly information on these two commodities is available. Information on domestic credit, official and parallel market exchange rates, and international coffee prices is available. On the other hand, income (GOP) is available on a yearly basis only. We attempted to decompose yearly values into quarterly estimates. The major component of GOP is from the agricultural sector, most of which is harvested and sold during the fourth and first quarters of a year. We thus gave more weight to these two quarters while decomposing the yearly GOP into quarters. Export tax rates were obtained by dividing quarterly tax revenue from exports by total export earnings. A similar procedure was followed in the estimation of import tax rates. Finally, the international price of importables was indirectly estimated by dividing the value of Ethiopian imports by the corresponding volume. The data used for estimation are given in Table 2.
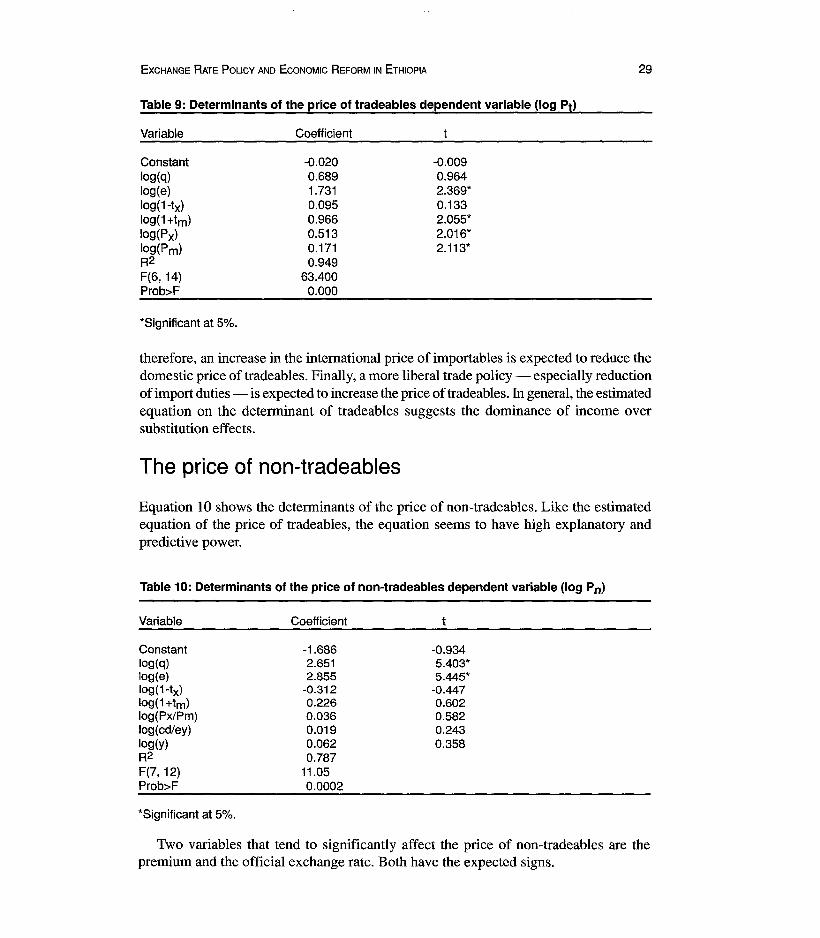
The price of tradeables
The reduced form of the determinants of the price of tradeables (Equation 15) is given in Table 9. The estimate indicates that the official exchange rate and the premium are the two important variables influencing the price of tradeables in Ethiopia during the period under study. The results suggest that a large percentage of the devaluation is passed into the domestic price of coffee - the major indicator of tradeables. Also, the effect of international prices of importables is more significant compared to the international price of exports. The two prices show the expected positive sign. In the Ethiopian context,
EXCHANGE RATE POLICY AND ECONOMIC REFORM IN ETHIOPIA
Table 9: Determinants of the price of tradeables dependent variable (log PI>
Variable
Constant log(q) log (e) log(1-tx) log(1+tm) log(Px) log(Pm) R2 F(6, 14) Prob>F
*Significant at 5%.
Coefficient
-0.020 0.689 1.731 0.095 0.966 0.513 0.171 0.949
63.400 0.000
-0.009 0.964 2.369* 0.133 2.055* 2.016* 2.113*
29
therefore, an increase in the international price of importables is expected to reduce the domestic price of tradeables. Finally, a more liberal trade policy - especially reduction of import duties - is expected to increase the price of tradeables. In general, the estimated equation on the determinant of tradeables suggests the dominance of income over substitution effects.
The price of non-tradeables
Equation 10 shows the determinants of the price of non-tradeables. Like the estimated equation of the price of tradeables, the equation seems to have high explanatory and predictive power.
Table 10: Determinants of the price of non-tradeables dependent variable (log Pn)
Variable
Constant log(q) log(e) log(1-tx) log(1+tm) log(Px!Pm) log(cd/ey) log(y) R2 F(7,12) Prob>F
*Significant at 5%.
Coefficient
-1.686 2.651 2.855
-0.312 0.226 0.036 0.019 0.062 0.787
11.05 0.0002
-0.934 5.403* 5.445*
-0.447 0.602 0.582 0.243 0.358
Two variables that tend to significantly affect the price of non-tradeables are the premium and the official exchange rate. Both have the expected signs.
30 RESEARCH PAPER 54
Table 11: Determinants of real exchange rate dependent variable (log RER)
Variable
Constant log(q) log(1-tx) log(1+tm) log(Px/Pm) log (cd/ey)
~~(y)
F(7, 12) Prob>F
*Significant at 5%.
Coefficient
3.314 1.018
-0.732 0.223 0.033
-0.296 -0.230 0.866
20.05 0.000
The real exchange rate
1.237 -10.072* -0.625 0.306 0.273
-2.139* -0.654
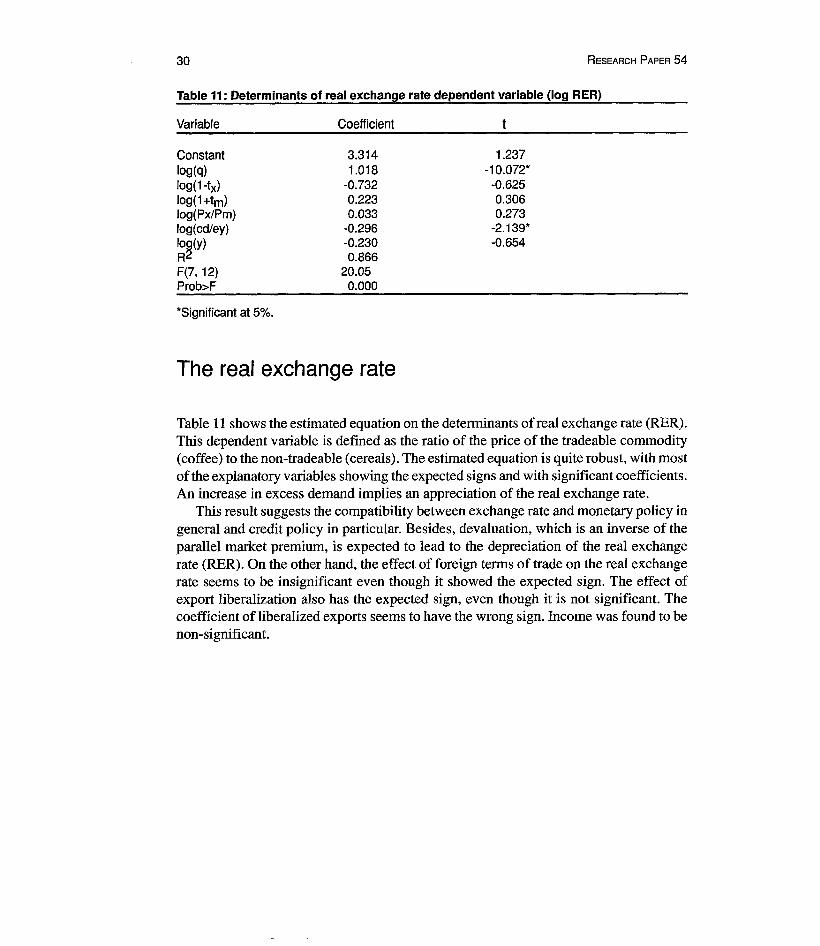
Table 11 shows the estimated equation on the determinants of real exchange rate (RER). This dependent variable is defined as the ratio of the price of the tradeable commodity (coffee) to the non-tradeable (cereals). The estimated equation is quite robust, with most of the explanatory variables showing the expected signs and with significant coefficients. An increase in excess demand implies an appreciation of the real exchange rate.
This result suggests the compatibility between exchange rate and monetary policy in general and credit policy in particular. Besides, devaluation, which is an inverse of the parallel market premium, is expected to lead to the depreciation of the real exchange rate (RER). On the other hand, the effect of foreign terms of trade on the real exchange rate seems to be insignificant even though it showed the expected sign. The effect of export liberalization also has the expected sign, even though it is not significant. The coefficient of liberalized exports seems to have the wrong sign. Income was found to be non-significant.

VIII. The Effect of devaluation on real variables
We have noted that devaluation can increase export earnings by increasing the prices of trade abies compared with non-tradeables. The major export of Ethiopia is coffee, and there may be a lag of 4 to 5 years before the effect of devaluation on coffee production and supply becomes apparent. Still, one can see the effect of devaluation on the substitution between domestic coffee consumption and exports as well as the reduction in coffee smuggling. This aspect of the study of the effects on real variables can only be considered as a preliminary indicator, as one cannot consider a rigorous model at this stage.
We use the information on the monthly supply of coffee to official markets as a dependent variable and regress this variable as a function of the real exchange rate, which is defined as the price of trade abies (coffee) over non-tradeables (cereal). The consumer price index (Cpr) is also put as an explanatory variable. The rationale behind the inclusion of the cpr is to capture the shift from the domestic consumption of coffee to export. A higher cpr would mean less domestic consumption of coffee and hence more for auction and export. The model is given as follows:
where COFFSUP = RER = CPI =
U. = J
amount of coffee supplied to auction markets ratio of coffee price over cereal price consumer price index error terms
The linear and non-linear estimates are provided in Table 12.
(15)
Both estimates clearly indicate that the effect of devaluation (RER.) on the supply J
and export of coffee seems to be positive and significant. This suggests a substantial reduction in domestic consumption and/or decrease in coffee smuggling. Even though the cpr coefficient (an indicator of the domestic price of coffee) is not significant, its sign suggests that an increase in the domestic price of coffee could mean an increase in coffee export.

32 RESEARCH PAPER 54
Table 12: Determinants of coffee supply dependent variable (COFFFSUPj)
Variable
Constant REACPl'] R2 ]
F, n
Constant Log(RERj) Log(CPlj) R2 F, n
Coefficient
8112.810 7176.211
-14.027 0.426 9.54,24
25.563 1.899
-2.615 0.335 6.79
Linear
Non-linear
t Statistic
0.596 3.657*
-0.747
1.132 3.133"
-0.772
IX. Conclusion
This paper considered the exchange rate policies and economic reform in Ethiopia. The report summarized some of the effects of an over-valued currency on key indicators of macroeconomic performance. It then summarized the foreign exchange allocation process during the Stalinist regime (1974-1991) of the Ethiopian government and the resulting foreign exchange misalignment.
The summary review of economic reform in Ethiopia emphasized the impact of devaluation and the importance of foreign exchange realignment as a major policy variable in transforming a stagnant economy. The empirical results on key macroeconomic indicators suggest that the 59% devaluation of 1992 seems to be producing the desired results. The economic performances summarized in figures and tables indicate that exchange rate realignment tends to have the expected results in affecting the prices of tradeables and non-trade abies - the latter plays a vital role in the efficient reallocation of resources. This is so despite the fact that devaluation is a one-period phenomenon. By eliminating the subsidy enjoyed by inefficient state enterprises and a few privileged importers during the pre-devaluation period, the new economic policy seems to foster economic growth as well as internal stability and consistency.
The descriptive statistics on GDP, price of trade abies and non-tradeables, supply and export of coffee, reduction in the parallel market premium, and the reduced growth rate of the CPI showed that foreign exchange realignment is an important policy tool for better macroeconomic performance. The impact of the policy changes should be analysed by the construction of a theoretically sound and rigorous econometric model. In other words, the transmission mechanisms from devaluation to the prices of tradeables and non-tradeables and the real exchange rate should be theoretically formulated and empirically verified.
We attempted to do this by deriving reduced fonn equations on the determinants of the prices of trade abIes and non-trade abIes and the real exchange rate. The results tend to confinn that a devaluation of a currency will increase the price of trade abies in a predicted manner. This will in tum affect the real variables; in the Ethiopian context the supply and export of coffee through the official channels have increased. This in tum will increase the foreign exchange earnings of the government, provided the international price of such trade abies is not reduced.
Our empirical evidence suggests that the overall effect of devaluation is proceeding in a predictable and positive manner, and the process of exchange rate unification as well as reduction in the parallel market premium seems to be well under way. Most

34 RESEARCH PAPER 54
important, the relative increase in the domestic price of tradeables (coffee) that came about as a result of devaluation seems to reduce both the extent of smuggling and the domestic consumption of coffee.
It can be argued that the current positive trends may not be sustainable and may be driven by foreign loans and grants. In other words, foreign loans and grants may not be forthcoming for too long and the situation may return to its original disequilibrium. There are as well, some exchange controls still in place despite the fact that the list of commodities that cannot be imported has been reduced substantially and despite the fact that the private sector is now engaged in the purchase of foreign exchange. On the other hand, we were able to note that through a conservative monetary policy, as well as substantial reduction in deficit financing, exchange rate unification could still be achieved even if foreign loans and grants are reduced. Moreover, the demand for foreign exchange in the parallel market has always been for transactions by the informal sector for purchase of imported consumer goods and not for capital flight. Thus, as production capacity in the manufacturing sector has improved with more readily available inputs, basic necessities are no longer so scarce and the role of the informal sector has declined substantially.
Appendix
Table A: Foreign exchange auction rates ('000 $)1
Auction Bid Rate Share Total Marginal2 lowest highest Public Private Value
1 5.00 5.00 7.00 0.00 100.0 3553 2 5.00 5.00 6.50 28.6 71.4 5047 3 5.00 5.00 7.05 41.0 59.0 6294 4 5.00 5.00 6.50 53.7 46.3 5000 5 5.10 5.00 5.56 66.9 34.1 5000 6 5.20 5.99 6.10 59.9 40.1 6000 7 5.35 5.00 5.76 56.0 44.0 6000 8 5.56 5.56 6.50 57.5 42.5 6000 9 5.90 5.90 6.51 57.4 42.6 6000 10 5.90 5.25 6.75 50.0 49.4 1000 11 5.10 5.10 6.40 70.3 29.7 1000 12 5.01 5.01 6.10 36.7 63.3 8000 13 5.18 5.00 6.50 64.1 35.9 6000 14 5.41 5.41 5.75 41.2 58.8 6000 15 5.61 5.20 6.05 51.7 48.3 6000 16 5.71 5.20 6.51 58.0 42.0 7000 17 5.80 5.16 6.10 58.6 41.4 8000 18 5.86 5.20 6.20 45.7 54.3 19 5.77 5.02 6.01 34.9 65.1 8068 20 5.82 5.02 6.01 50.3 49.7 8000 21 5.92 5.02 6.01 63.0 37.0 8000
Source: National Bank of Ethiopia.
Notes: Auctions are held every 15 days. The first auction was held on 1 May 1993. This is the rate that will continue to prevail between two auctions.

36 RESEARCH PAPER 54
Appendix B: Macroeconomic variables used in the Estimation monetary effects
Year Quarter D2 Exp.Tax Imp.Tax IPC3 IPI4 GDP5
1989 1 6559 0.27 0.17 121 1.72 2118 2 7141 0.17 0.28 113 2.12 2055 3 7249 0.10 0.17 72 1.76 2709 4 7510 0.06 0.20 62 2.91 2055
1990 5 7856 0.05 0.30 70 2.96 2119 6 8331 0.03 0.31 73 3.37 2395 7 8585 0.04 0.16 73 4 2672 8 8960 0.03 0.19 73 4 2027
1991 9 9159 0.10 0.31 72 3 2105 10 9337 0.03 0.56 69 2.58 2380 11 9666 0.03 0.48 65 2.03 2655 12 9840 0.03 0.27 64 3.73 2014
1992 13 10230 0.02 0.14 58 3.37 1950 14 10507 0.03 0.27 50 3.81 2205 15 10763 0.01 0.20 47 3.88 2459 16 11203 0.03 0.11 59 3.74 1865
1993 17 12175 0.02 0.16 57 4.34 2098 18 12494 0 0.20 53 4.58 2372 19 12698 0 0.20 67 4.6 2645 20 11410 0 0.20 70 4.7 2007
1994 21 11750 0 0.20 70 4.8 2220
Source: National Bank of Ethiopia.
Notes: Other variables are given in other tables. Domestic credit. International price of coffee. International price of importables. In millions
Bibliography
Aghevi, B.B. 1977. "Money, prices and the balance of payments, Indonesia 1968-73". IDS vol. 13, no. 2.
Bautista, R.M. 1987. "Production incentives in Phillipine agriculture: Effects of trade and exchange rate policies". IFPRI, No.5.
Collier, P. and V. Joshi. 1989. "Exchange rate policy in developing countries". Oxford Review of Economic Policy, vol. 5, no. 2.
Crocket, A. D. and S.M. Nsouli. 1987. "Exchange rate policies for developing countries", Finance in Developing Countries.
Edwards, S. 1988. "Exchange controls, devaluation and real exchange rates: The Latin American experience". EDCC vol. 37, no. 3.
Edwards, S. 1989. Real Exchange Rate, Devaluation and Adjustment. Cambridge, Massachusetts: MIT Press.
Elbadawi, I. 1992. "Real overvaluation, terms-of-trade shocks and the cost to agriculture in sub-Saharan Africa: The case of Sudan". Journal of African Economies, voU, no.l.
Jebuni, C.D., N.K. Sowa and K.A. Tutu. 1991. Exchange rate policy and Macroeconomic Performances in Ghana. AERC Research Paper No.6.
Kamin, S. 1988. "Devaluation, external balance and macroeconomic performance: A look at the numbers". Princeton Studies in International Finance, no. 62.
Kasekende, L.A. and G. Ssemogerere. 1992. "Exchange rate unification and economic development: Case study of Uganda". Final research report. Nairobi: AERC.
Lipumba, M.H.!. 1990. "The appropriate exchange rate policy for African countries: Some policy issues". A paper presented at the Eastern and Southern Africa Economic Association, Nairobi.
Mwega, F. 1993. "Real exchange rate misalignment and macroeconomic performance in Kenya". A paper presented at the AERC Research workshop in Cape Town, S.A.
National Bank of Ethiopia. (various issues) Annual Reports. Pinto, B. 1990. "Black market premia, exchange rate unification and inflation in sub
Saharan Africa". The World Bank Economic Review, vol. 3, no. 3. __ 1991. "Black markets for foreign exchange: Real exchange rates and inflation".
Journal of International Economics, vol. 30. Rose, A.K. 1990. "Exchange rates and the trade balance". Economic Letters, vol. 32. Younger, S.R. 1992. "Testing the link between devaluation and inflation: Time series
evidence from Ghana". Journal of African Economies, voU, no. 3

RP54 MARCH 1997
EXCHANGE RATE P LICY AND ECONOMIC REFORM IN ETHIOPIA
Asmerom Kidane
Context
For over 20 years Ethiopia has faced serious economic crisis- low growth rate of GDP, negative growth rate of per capita income, increasing balance of payments deficits and huge debt servicing. The most important cause of the poor economic performance was macroeconomic mismanagement. This took the shape of a lack of appropriate incentive schemes to promote efficient use of resources, which led ultimately to distortions in all sectors of the economy, a highly over-valued exchange rate, double-digit inflation and an increasing budget deficit.
What is the problem?
Ethiopia's economy spiraled downward; parallel foreign exchange markets emerged, the budget deficit increased, essential goods were in short supply. The way out of such distortions is to introduce comprehensive economic reform to regain internal and external balances and promote sustainable growth in all sectors. However, instead of trying to reverse the decline, the Ethiopian government between 1974 and 1991 tried to contain it, not by following appropriate policies but by imposing further controls, particularly onforeign exchange, and nationalizing industries.
AFRICAN ECONOMIC RESEARCH CONSORTIUM CONSORTIUM POUR LA RECHERCHE ECONOMIQUE EN AFRIQUE

This paper summarizes the macroeconomic consequences of an over-valued exchange rate. The paper studied the extent of foreign exchange misalignment in Ethiopia and its impact on the foreign exchange rate and other areas of the economy.
Effects of an over-valued exchange rate
An over-valued exchange rate will lead to balance of payments deficits because it makes production for export unprofitable while imports become cheaper. Since hard currency is scarce and export earnings decline, governments resort to exchange controls. This in turn feeds corruption in the official system and encourages a parallel market with an ever-increasing premium. It also encourages smuggling, which deprives the government of revenue. Over time the amount of forex in the official market decreases, leading to the widening of current account deficits.
Devaluation is expected to narrow the gap in the current account deficit by increasing the profitability of exports and making them more competitive. At the same time, the local currency cost of imports will increase. There will be a reallocation of resources toward the production of tradeables. On the other hand, the policy may also have a short-run inflationary effect due to the spiral of increasing costs in agriculture and industry. Over the long term, however, devaluation is expected to reduce or eliminate the parallel market premium, reverse the negative consequences, and improve the allocation of resources.
The four phases of foreign exchange allocation in Ethiopia
For the past 21 years Ethiopia has followed a fixed predetermined exchange rate that pegged the birr to the U.S. dollar. Elaborate and cumbersome procedures govern transactions in foreign exchange. Traders wishing forex for imports must go through a process of application and documentation that is so time consuming by the time the application is approved and payment authorized the original invoice may be out of date. The procedures cost the country dearly in terms of money, time and labour-and increased opportunity for corruption.
Before 1974, the country's foreign exchange reserve was sound and there was an insignificant parallel market. The exchange controller of the National Bank of Ethiopia had the authority to allocate foreign exchange (pending the fulfillment of all necessary requirements) on a daily basis; the quantity supplied was more or less equal to the amount demanded, with a substantial portion allocated to the private sector.
Between 1974 and 1983 the government nationalized private manufacturing, trade and service establishments. Excess capacity prevailed and imports of basic necessities were reduced. The foreign exchange controller could not meet the demand for forex; the time between application and authorization (if any) took several weeks and the amount allocated was less than requested.
In the third phase (1984-1991) the Workers' Party of Ethiopia took over the administration and allocation of foreign exchange. In line with the marxist orientation of the government, the amount of forex allocated to the private sector was insignificant. This led to an ever-

growing parallel market and shortages of basic imported items such as pharmaceuticals, spare parts, etc. Recognizing the problem of the shortages, the government permitted "own funded" imports of authorized consumer goods, but retained import licenses and increased import taxes.
The informal sector began to flourish. The parallel market widened, remittances from Ethiopians abroad ceased to come through normal channels and government's foreign exchange earnings decreased. Smuggling became the order of the day as Ethiopians began to bring high-value goods into the country rather than remitting currency. Since the parallel market rate was the "real" exchange rate, the prices of these goods soared.
By May 1991, when the New Transitional Government toppled the Stalinist regime, foreign exchange earnings had reached a very low level and no foreign assistance was coming in except food for the hungry. The fourth phase had begun.
Economic reforms of 1991
Early in 1992 the new government agreed to undertake economic reforms prescribed by the IMP and World Bank. A major objective was to limit the role of the government in the economy, while encouraging the development of the private sector. The reforms aimed at creating a conducive free-market environment. Economic assistance began to arrive ana the national bank regained its authority as the custodian and distributor of foreign exchange.
Reforms included reorganization of state-owned enterprises and marketing boards, elimination of export duties, devaluation of the birr by 59%, and introduction of a forex auction. One of the goals of the reforms was the use of foreign exchange as a tool for bringing about economic growth and stability.
Effects of devaluation on Ethiopia's macroeconomic performance
Although reforms are still fairly new in Ethiopia, this study indicates that devaluation of the birr increased import taxes and this contributed to the reduction of the deficit. There has been substantial reallocation of resources from the public to the private sector through the elimination of interest rate differentials on deposit and lending. The parallel forex market premium has decreased from more than 37% in 1992 to about 12%.
It was exp-'~-l that the parallel market rate would appreciate after devaluation; it did not. The inflationary spiral expected for non-trade abies did not materialize. The amount of export goods smuggled into neighbouring countries is believed to have declined, and the extent of excess capacity is improving. There is also indication of slight improvement in the balance of payments position. The increase in price of tradeables (modelled by supply of coffee) may have resulted in a shift from domestic consumption to exports, with a marked increase in the amount of coffee supplied to the official marketing channels. The inflationary impact of devaluation has not been significant.

Policy implications
If monetary and fiscal policies are not internally consistent with the prevailing exchange rate, a country is certain to face disequilibrium and exchange rate misalignment, leading to fiscal deficits as well as exchange rate and balance of payments crises. Ethiopia's new economic policy seems so far to be fostering economic growth as well as internal stability and consistency.
It can be argued that the current positive trends may not be sustainable, however, as they may be driven by foreign loans and grants. If foreign loans and grants are not forthcoming for too much longer the situation may return to its original disequilibrium. The study does indicate that with a conservative monetary policy and substantial reduction in deficit financing, exchange rate unification could still be achieved even if foreign loans and grants are reduced. One reason for this lies in the nature of the demand for foreign exchange. Forex in the parallel market has always been for informal sector purchase of imported consumer goods rather than for capital flight. As manufacturing production capacity has improved with more readily available inputs, basic necessities are no longer so scarce and the informal sector demand for forex has declined substantially.
Other related AERC publications ,
"Exchange Rate Policy and Macroeconomic Performance in Ghana" by C. D. Jebuni, N. K. Sowa and K. S. Tutu, RP 6, September 1991.
"The Role of Exchange Rate and Monetary Policy in the Monetary Approach to the Balance of Payments: Evidence from Malawi" by E. B. D. Silumbu, RP 37, October 1995.
"Empirical Studies of Nigeria's Foreign Exchange Parallel Market" by Melvin D. Ayogu, RP 41, December 1995.
"The Nigerian Foreign Exchange Market: Possibilities for Covergence in Exchange Rates" by P. Kassey Garba, RP 55, March 1997.
AFRICAN ECONOMIC RESEARCH CONSORTIUM (AERC)
The principal objective of the African Economic Research Consortium (AERC), established in 1988, is to strengthen local capacity for conducting independent, rigorous inquiry into problems pertinent to the management of economies in sub-Saharan Africa. In response to special needs of the region, AERC has adopted a flexible approach to improve the technical skills of local researchers, allow for regional determination of research priorities, strengthen national institutions concerned with economic policy research, and facilitate closer ties between researchers and policy makers. AERC is supported by private foundations, bilateral aid agencies and international organizations. Further information concerning the AERC and its publications can be obtained by writing to:
Manager, Publication & Dissemination African Economic Research Consortium
8th Floor, International House P. O. Box 62882, Nairobi, Kenya
Tel: (254-2) 228057 Fax: (254-2) 219308 Telex: 22480

AFRICAN ECONOMIC RESEARCH CONSORTIUM
-AERC CREA
P.O. BOX 62882 NAIROBI, KENYA
TELEPHONE (254-2) 228057 225234 215898 212359
332438 225087
TELEX 22480
FAX (254-2) 219308
E-MAIL [email protected] or [email protected]
The principal objective of the African Economic Research Consortium (AERC), established in August 1988, is to strengthen local capacity for conducting independent, rigorous inquiry into problems pertinent to the management of economies in Sub-Saharan Africa.
In response to special needs of the region, AERC has adopted a flexible approach to improve the technical skills of local researchers, allow for regional determination of research priorities, strengthen national institutions concerned with economic policy research, and facilitate closer ties between researchers and policy makers.
Since its establishment, AERC has been supported by private foundations, bilateral aid agencies and international organizations.
SPECIAL PAPERS contain the fmdings of commissioned studies in furtherance of AERC's programmes for research, training and capacity building.
RESEARCH PAPERS contain the edited and externally reviewed results of research financed by the AERC.
It is AERC's policy that authors of Special and Research Papers are free to use material contained therein in other publications. Views expressed in the Special and Research Papers are those of the authors alone and should not be attributed to the AERC's sponsoring Members, Advisory Committee, or Secretariat.
Further information concerning the AERC and additional copies of Special and Research Papers can be obtained by writing to: African Economic Research Consortium, P.O. Box 62882, Nairobi, Kenya.
ISBN 9966-900-96-9