Exchange rate management in emerging markets: Intervention via an electronic limit order book
10
Exchange rate management in emerging markets: Intervention via an electronic limit order book Michael Melvin a, ⁎, Lukas Menkhoff b , Maik Schmeling b a Barclays Global Investors, San Francisco, CA, USA b Leibniz Universität Hannover, Hannover, Germany abstract article info Article history: Received 11 June 2008 Received in revised form 15 May 2009 Accepted 25 June 2009 Keywords: Foreign exchange market microstructure Limit order book Electronic crossing network Exchange rate intervention This paper describes and analyzes the implementation of a crawling exchange rate band on an electronic trading platform. The placement of limit orders at the central bank's target rate serves as a credible policy statement that may coordinate beliefs of market participants. We find for our sample that intervention increases exchange rate volatility (and spread) for the next minutes but that intervention days show a lower degree of volatility (and spread) than non-intervention days. We also show for intraday data that the price impact of interbank order flow is smaller on intervention days than on non-intervention days. These stabilizing effects, however, rely on the conditions of large currency reserves and the existence of capital controls; an electronic market seems to support this goal. © 2009 Elsevier B.V. All rights reserved. 1. Introduction The bulk of central bank intervention activity nowadays occurs in emerging markets which also play an increasingly important role in current global imbalances. Moreover, foreign exchange (FX) markets have changed their organizational structure to increasingly move to electronic markets and this structural change is taking place in emerging markets, too. This study is the first to analyze the workings of an emerging market's central bank intervention aimed at targeting exchange rates via electronic markets by way of a case study relying on unusually detailed information. The rise of emerging economies is not yet adequately reflected in the literature on exchange rate management. There is a wealth of studies on foreign exchange interventions but almost all of them refer to industrialized economies and most of them deal with the few main floating exchange rates. 1 Considering the changing institutional features of the FX market, it is worthwhile considering how a central bank could use an electronic trading venue to manage exchange rates. It is also important to note that in recent years, exchange rate management in general and interventions in particular occur mostly in emerging market economies. The share of all reserves held by emerging countries has increased from about 35% to 75% between 1988 and 2007 (according to IMF data). Second, effective exchange rate arrangements in the form of crawling pegs or bands dominate floating exchange rates by far, according to Reinhart and Rogoff (2004), and have further gained importance over the last two decades up to a share of more than 30% among all exchange rate arrangements during the last years. Third, much foreign exchange trading has migrated to electronic markets, a technological evolution that applies to emerging markets as well. Therefore, our case study on interventions in an electronically traded emerging market currency seems to address an increasingly important but up to now neglected field of real world exchange rate management. We report and analyze a unique type of foreign exchange (FX) market intervention by the Russian Central Bank which occurred by placing limit orders on an electronic limit order book to set an upper bound on the rouble price of a dollar (USDRUR). This could be a credible statement of a crawling band that signals a firm commitment of the Bank to spend or accumulate reserves as needed to keep the exchange rate within the band. 2 Indeed, the Russian exchange rate arrangement is classified as a “de facto crawling band” and thus belongs to the important broader category of “limited flexibility” (see Reinhart and Rogoff, 2004). 3 Our research covers 5 days of interventions and is thus a case study whose results cannot just be taken as completely conclusive and general. Nevertheless, the unusually detailed information about the complete order book allows studying intervention effects in an almost “ideal” microstructure setting: we analyze about 2700 central bank Journal of International Economics 79 (2009) 54–63 ⁎ Corresponding author. E-mail addresses: [email protected] (M. Melvin), [email protected] (L. Menkhoff), [email protected] (M. Schmeling). 1 Among the several surveys, Sarno and Taylor (2001), Edison (1993), Almekinders (1995) and Neely (2005) cover the key issues. 2 We do not use the term “target zone” here as the formal assumptions of the Krugman (1991) model, in particular no capital controls, are not satisfied. 3 Among the 31 countries in the “de facto crawling band that is narrower than or equal to +/−2%” category are further transformation economies (e.g. Czech Republic, Lithuania), middle-income African economies (e.g. Algeria, Kenya), a few South- American economies (e.g. Argentina) and emerging Asian economies (e.g. India, Malaysia, Philippines). 0022-1996/$ – see front matter © 2009 Elsevier B.V. All rights reserved. doi:10.1016/j.jinteco.2009.06.008 Contents lists available at ScienceDirect Journal of International Economics journal homepage: www.elsevier.com/locate/jie
-
Upload
michael-melvin -
Category
Documents
-
view
213 -
download
0
Transcript of Exchange rate management in emerging markets: Intervention via an electronic limit order book

Journal of International Economics 79 (2009) 54–63
Contents lists available at ScienceDirect
Journal of International Economics
j ourna l homepage: www.e lsev ie r.com/ locate / j i e
Exchange rate management in emerging markets: Intervention via an electronic limitorder book
Michael Melvin a,⁎, Lukas Menkhoff b, Maik Schmeling b
a Barclays Global Investors, San Francisco, CA, USAb Leibniz Universität Hannover, Hannover, Germany
⁎ Corresponding author.E-mail addresses: [email protected]
[email protected] (L. Menkhoff), schmelin(M. Schmeling).
1 Among the several surveys, Sarno and Taylor (2001(1995) and Neely (2005) cover the key issues.
0022-1996/$ – see front matter © 2009 Elsevier B.V. Aldoi:10.1016/j.jinteco.2009.06.008
a b s t r a c t
a r t i c l e i n f oArticle history:Received 11 June 2008Received in revised form 15 May 2009Accepted 25 June 2009
Keywords:Foreign exchange market microstructureLimit order bookElectronic crossing networkExchange rate intervention
This paper describes and analyzes the implementation of a crawling exchange rate band on an electronictrading platform. The placement of limit orders at the central bank's target rate serves as a credible policystatement that may coordinate beliefs of market participants. We find for our sample that interventionincreases exchange rate volatility (and spread) for the next minutes but that intervention days show a lowerdegree of volatility (and spread) than non-intervention days. We also show for intraday data that the priceimpact of interbank order flow is smaller on intervention days than on non-intervention days. Thesestabilizing effects, however, rely on the conditions of large currency reserves and the existence of capitalcontrols; an electronic market seems to support this goal.
© 2009 Elsevier B.V. All rights reserved.
1. Introduction
The bulk of central bank intervention activity nowadays occurs inemerging markets which also play an increasingly important role incurrent global imbalances. Moreover, foreign exchange (FX) marketshave changed their organizational structure to increasingly move toelectronicmarkets and this structural change is takingplace in emergingmarkets, too. This study is the first to analyze the workings of anemerging market's central bank intervention aimed at targetingexchange rates via electronic markets by way of a case study relyingon unusually detailed information.
The rise of emerging economies is not yet adequately reflected in theliterature on exchange ratemanagement. There is awealth of studies onforeign exchange interventions but almost all of them refer toindustrialized economies and most of them deal with the few mainfloating exchange rates.1 Considering the changing institutional featuresof the FXmarket, it is worthwhile considering how a central bank coulduse an electronic trading venue to manage exchange rates. It is alsoimportant to note that in recent years, exchange rate management ingeneral and interventions inparticular occurmostly in emergingmarketeconomies. The share of all reserves held by emerging countries hasincreased from about 35% to 75% between 1988 and 2007 (according toIMF data). Second, effective exchange rate arrangements in the form of
m (M. Melvin),[email protected]
), Edison (1993), Almekinders
l rights reserved.
crawling pegs or bands dominate floating exchange rates by far,according to Reinhart and Rogoff (2004), and have further gainedimportance over the last two decades up to a share of more than 30%among all exchange rate arrangements during the last years. Third,much foreign exchange trading has migrated to electronic markets, atechnological evolution that applies to emerging markets as well.Therefore, our case study on interventions in an electronically tradedemerging market currency seems to address an increasingly importantbut up to now neglected field of real world exchange rate management.
We report andanalyze aunique type of foreign exchange (FX)marketinterventionby theRussian Central Bankwhich occurred byplacing limitorders on an electronic limit order book to set an upper bound on therouble price of a dollar (USDRUR). This could be a credible statementof acrawling band that signals a firm commitment of the Bank to spend oraccumulate reserves as needed to keep the exchange rate within theband.2 Indeed, the Russian exchange rate arrangement is classified as a“de facto crawling band” and thus belongs to the important broadercategory of “limited flexibility” (see Reinhart and Rogoff, 2004).3
Our research covers 5 days of interventions and is thus a case studywhose results cannot just be taken as completely conclusive andgeneral. Nevertheless, the unusually detailed information about thecomplete order book allows studying intervention effects in an almost“ideal” microstructure setting: we analyze about 2700 central bank
2 We do not use the term “target zone” here as the formal assumptions of theKrugman (1991) model, in particular no capital controls, are not satisfied.
3 Among the 31 countries in the “de facto crawling band that is narrower than orequal to +/−2%” category are further transformation economies (e.g. Czech Republic,Lithuania), middle-income African economies (e.g. Algeria, Kenya), a few South-American economies (e.g. Argentina) and emerging Asian economies (e.g. India,Malaysia, Philippines).

55M. Melvin et al. / Journal of International Economics 79 (2009) 54–63
transactions within a total sample of more than 56,000 orders, amongthem about 30,000 transactions. This data has three distinctadvantages: first, it provides knowledge of the exact time of centralbank activity which the prior literature has usually inferred from newsreports or actual price movements.4 Thus we can analyze precisely theeffects of intervention in terms of the impact of central bank decisionsto intervene and the consequent exchange rate effects of purchases orsales of currency.5 Second, the analysis undertaken in our paper isunique in that we study what could be called “automated interven-tion” in that the central bank determines a desired band for theexchange rate and then places very large limit orders to keep theexchange rate inside this band. Third, the data allows analyzing orderflows which is quite new to the intervention literature.6
We find that intervention increases exchange rate volatility (andspread) for the next few minutes but that intervention days show alowerdegree of volatility (and spread) thannon-intervention days.Wealso show for intraday data that the price impact of interbank orderflow is smaller on intervention days than on non-intervention days.Finally, we reveal that informed banks take different positions thanuninformed banks as they tend to trade against the central bank —
which reflects a rational stance. Despite this position taking, thetargeted exchange rate band holds and volatility, spread and priceimpact go down. Overall, the intervention band seems to realizestabilizing effects. The success of such a regime for an emergingmarketcurrency is likely to depend on the conditions of large currencyreserves and the existence of capital controls— conditions whichweremet for the Russian case under consideration. In 2002, capital controlsin Russia were quite strict. The rigid controls in existence wereimposed after the 1998 financial crisis. For instance, business firms hadto apply on a case-by-case basis for permission prior to internationaltransfers of capital. Exporters were required to sell 50% of their foreigncurrency proceeds to the central bank. Following the 1998 crisis, firmshad a strong preference to hold convertible, reserve currencies like theU.S. dollar or euro, so the currency surrender requirement was viewedas essential to provide liquidity to the domestic foreign exchangemarket. Foreigners traded the rouble in the offshore non-deliverableforward (NDF) market and could not participate in the onshoremarket. In 2007, the rouble moved to deliverable status but foreignentities still preferred to trade offshore inmany cases due to credit andpolitical concerns. To this day, there is an active NDF market for therouble.
The paper is organized as follows. In the next section theinstitutional details of the electronic crossing network will bepresented along with a detailed overview of the data available foranalysis. Then in Section 3Effects of central bank limit orders, anempirical examination of the limit orders placed by the central bank isundertakenwith a focus on its effect on volatility, spread, price impactof order flow and order choice. Section 4 Implications for the centralbank discusses implications for the central bank and, finally, Section 5Summary and conclusions offers a summary and conclusions.
4 Exceptions to this are the Swiss National Bank, which has made its data public, seeFischer and Zurlinden (1999), Payne and Vitale (2003), and Pasquariello (2007).Fischer (2006) shows that Reuters news reports of Swiss intervention are oftenerroneous and bring into question the accuracy of such news for timing Swissinterventions. Data sets from Denmark (Fatum and Pedersen, 2009) and Canada(Beattie and Fillion, 1999; Fatum and King, 2005) have been studied, but are notavailable to the public.
5 Starting with Dominguez and Frankel (1993) more recent studies find an impact ofintervention, including Humpage (1999) and Dominguez (2003) for the US, Ito (2002,2007) for Japan, Fatum and Hutchison (2003) for Germany (and the US), Kearns andRigobon (2005) for Australia and Disyatat and Galati (2007) for the Czech Republic.Also communication can be effective (Fratzscher, 2006) or even falsely rumoredinterventions (Dominguez and Panthaki, 2007).
6 To our knowledge there are two other studies analyzing interventions in an orderflow approach: Scalia (2008) has to estimate intervention timing and thus aggregatesdata to hourly frequency, Girardin and Lyons (2007) use customer order flow of a largebank on a daily frequency.
2. Institutional details
2.1. The SELT system
Local interbank trading in the rouble occurs on an electronic limitorder market at the MICEX in Moscow and, at the time of interest tothis study, March 2002, this market determined the official exchangerate of the USDRUR. This country-wide trading at the MICEX is calledthe “unified trading session” or UTS. The structure is that of a multipledealer market without designatedmarket makers. While an interbankmarket, it is expected that much of the trading reflects customerorders received by the participating banks. During the periodanalyzed, the UTS took place for 1 h a day from 10:30–11:30 Moscowtime and the only instrument traded was the USDRUR spot rate.7
MICEX FX trading occurs on the SELT electronic system that issimilar to the electronic brokerage systems of Reuters or EBS.8 Like EBSor Reuters, participants on SELT just see the top of the book or the bestbid and ask prices with associated order size.
Foreign exchange trading within Russia appears to have a localinformation component.9 Banks in the financial centers of Moscowand St. Petersburg are more likely to see the customer order flow ofthe large Russian corporate clients than banks in other cities. Thebanks on the periphery are also less likely to be as well informed oneconomic policy developments as the banks in the financial centers.Menkhoff and Schmeling (2008) show that there is more likely to be apermanent price impact of trades originated by Moscow and St.Petersburg banks than banks on the periphery. This is consistent withthe trades from the financial centers reflecting private informationcompared to the transitory price impact associated with the tradesoriginated by other banks. Following these earlier findings, we willstructure some of our empirical analysis to take account of thisinstitutional feature of the Russian market.
Participants on the system see the best bid and offer price plusrespective quantities. They also see the cumulative buy and sellvolumes for the current trading session and the last transactionquantity and price. Trades occur anonymously and then post-tradecounterparty identities are revealed. The fact that the central banklearns the identities of private banks that trade at its limit order mayserve as a form of central bank monitoring that helps to enforce thedesired crawling band with a minimum of reserve loss.
It is likely that using an electronic limit order book as a vehicle formaintaining a crawling band is effective only in a case where thatcrossing network accounts for a very significant part of the overallmarket. In the case of Russia, this was made possible by the controlson foreign exchange trading. Foreigners traded roubles in an offshoremarket in the form of non-deliverable forward contracts. So thedomestic market was segmented from foreign participation and thisallowed the central bank to effectively target the exchange rate withlimit orders on the MICEX.10 Such a mechanism is unlikely to be ofmuch use to a country with a convertible currency and open financialmarkets given the current structure of the foreign exchange market.For instance, electronic trading in the major developed currencies issplit across several different platforms and there is no one crossing
7 Trading was later extended to a four hour session and forward contracts.8 A marginal difference for SELT is that only limit orders, specifying price and
quantity desired, or cancellations may be submitted. Unlike Reuters or EBS, there areno market orders specifying desired quantity at the best price in the order book. Toreceive immediate execution, an order must be submitted that crosses the best price inthe order book. Such marketable or crossing limit orders are the equivalent of marketorders on the SELT.
9 See Menkhoff and Schmeling (2008).10 We thus observe and analyze the trading dynamics of the domestic market. Withindomestic markets, the UTS provides much higher liquidity than regional bourseswhich are only open to banks from the respective regions. Moreover, the central bankdetermines via its interventions the official exchange rate at the UTS which is thenbinding to others. Thus the UTS is the core market to exchange information amongdomestic players.
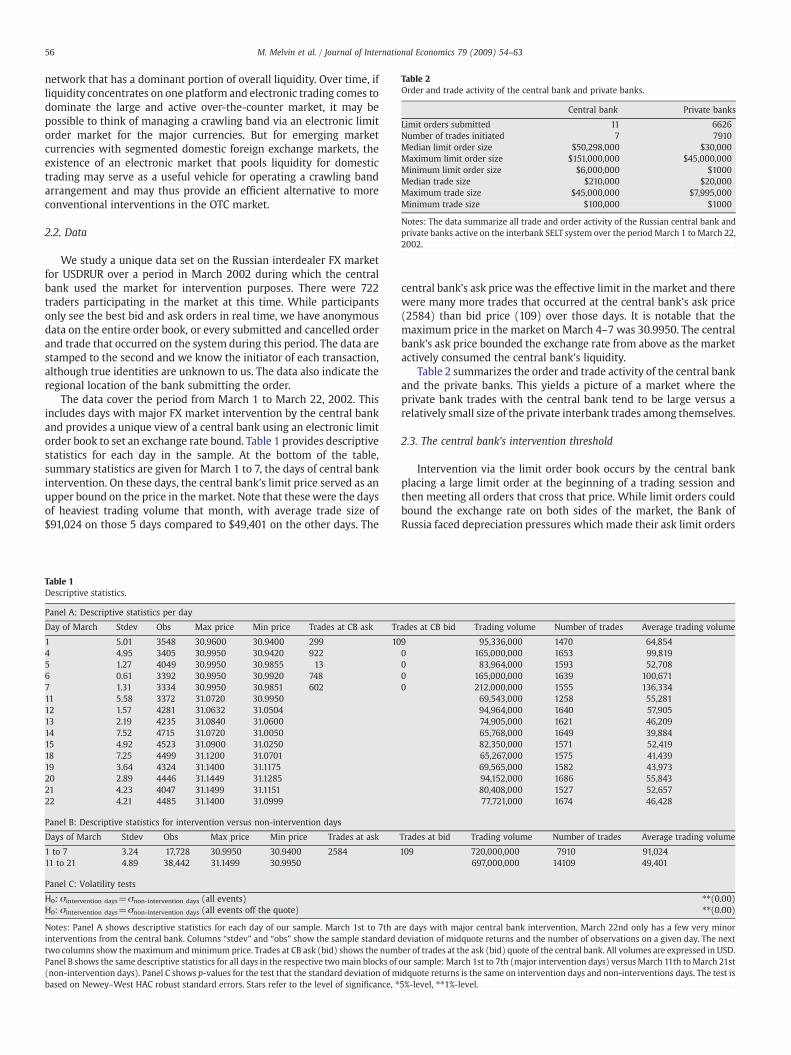
Table 2Order and trade activity of the central bank and private banks.
Central bank Private banks
Limit orders submitted 11 6626Number of trades initiated 7 7910Median limit order size $50,298,000 $30,000Maximum limit order size $151,000,000 $45,000,000Minimum limit order size $6,000,000 $1000Median trade size $210,000 $20,000Maximum trade size $45,000,000 $7,995,000Minimum trade size $100,000 $1000
Notes: The data summarize all trade and order activity of the Russian central bank andprivate banks active on the interbank SELT system over the period March 1 to March 22,2002.
56 M. Melvin et al. / Journal of International Economics 79 (2009) 54–63
network that has a dominant portion of overall liquidity. Over time, ifliquidity concentrates on one platform and electronic trading comes todominate the large and active over-the-counter market, it may bepossible to think of managing a crawling band via an electronic limitorder market for the major currencies. But for emerging marketcurrencies with segmented domestic foreign exchange markets, theexistence of an electronic market that pools liquidity for domestictrading may serve as a useful vehicle for operating a crawling bandarrangement and may thus provide an efficient alternative to moreconventional interventions in the OTC market.
2.2. Data
We study a unique data set on the Russian interdealer FX marketfor USDRUR over a period in March 2002 during which the centralbank used the market for intervention purposes. There were 722traders participating in the market at this time. While participantsonly see the best bid and ask orders in real time, we have anonymousdata on the entire order book, or every submitted and cancelled orderand trade that occurred on the system during this period. The data arestamped to the second and we know the initiator of each transaction,although true identities are unknown to us. The data also indicate theregional location of the bank submitting the order.
The data cover the period from March 1 to March 22, 2002. Thisincludes days with major FX market intervention by the central bankand provides a unique view of a central bank using an electronic limitorder book to set an exchange rate bound. Table 1 provides descriptivestatistics for each day in the sample. At the bottom of the table,summary statistics are given for March 1 to 7, the days of central bankintervention. On these days, the central bank's limit price served as anupper bound on the price in the market. Note that thesewere the daysof heaviest trading volume that month, with average trade size of$91,024 on those 5 days compared to $49,401 on the other days. The
Table 1Descriptive statistics.
Panel A: Descriptive statistics per day
Day of March Stdev Obs Max price Min price Trades at CB ask Tr
1 5.01 3548 30.9600 30.9400 299 104 4.95 3405 30.9950 30.9420 9225 1.27 4049 30.9950 30.9855 136 0.61 3392 30.9950 30.9920 7487 1.31 3334 30.9950 30.9851 60211 5.58 3372 31.0720 30.995012 1.57 4281 31.0632 31.050413 2.19 4235 31.0840 31.060014 7.52 4715 31.0720 31.005015 4.92 4523 31.0900 31.025018 7.25 4499 31.1200 31.070119 3.64 4324 31.1400 31.117520 2.89 4446 31.1449 31.128521 4.23 4047 31.1499 31.115122 4.21 4485 31.1400 31.0999
Panel B: Descriptive statistics for intervention versus non-intervention days
Days of March Stdev Obs Max price Min price Trades at ask
1 to 7 3.24 17,728 30.9950 30.9400 258411 to 21 4.89 38,442 31.1499 30.9950
Panel C: Volatility tests
H0: σintervention days=σnon-intervention days (all events)H0: σintervention days=σnon-intervention days (all events off the quote)
Notes: Panel A shows descriptive statistics for each day of our sample. March 1st to 7th ainterventions from the central bank. Columns “stdev” and “obs” show the sample standard dtwo columns show themaximum andminimum price. Trades at CB ask (bid) shows the numPanel B shows the same descriptive statistics for all days in the respective twomain blocks of(non-intervention days). Panel C shows p-values for the test that the standard deviation of mbased on Newey–West HAC robust standard errors. Stars refer to the level of significance, ⁎
central bank's ask price was the effective limit in the market and therewere many more trades that occurred at the central bank's ask price(2584) than bid price (109) over those days. It is notable that themaximum price in the market on March 4–7 was 30.9950. The centralbank's ask price bounded the exchange rate from above as the marketactively consumed the central bank's liquidity.
Table 2 summarizes the order and trade activity of the central bankand the private banks. This yields a picture of a market where theprivate bank trades with the central bank tend to be large versus arelatively small size of the private interbank trades among themselves.
2.3. The central bank's intervention threshold
Intervention via the limit order book occurs by the central bankplacing a large limit order at the beginning of a trading session andthen meeting all orders that cross that price. While limit orders couldbound the exchange rate on both sides of the market, the Bank ofRussia faced depreciation pressures which made their ask limit orders
ades at CB bid Trading volume Number of trades Average trading volume
9 95,336,000 1470 64,8540 165,000,000 1653 99,8190 83,964,000 1593 52,7080 165,000,000 1639 100,6710 212,000,000 1555 136,334
69,543,000 1258 55,28194,964,000 1640 57,90574,905,000 1621 46,20965,768,000 1649 39,88482,350,000 1571 52,41965,267,000 1575 41,43969,565,000 1582 43,97394,152,000 1686 55,84380,408,000 1527 52,65777,721,000 1674 46,428
Trades at bid Trading volume Number of trades Average trading volume
109 720,000,000 7910 91,024697,000,000 14109 49,401
⁎⁎(0.00)⁎⁎(0.00)
re days with major central bank intervention, March 22nd only has a few very minoreviation of midquote returns and the number of observations on a given day. The next
ber of trades at the ask (bid) quote of the central bank. All volumes are expressed in USD.our sample: March 1st to 7th (major intervention days) versusMarch 11th toMarch 21stidquote returns is the same on intervention days and non-interventions days. The test is5%-level, ⁎⁎1%-level.

Fig. 1. Exchange rate, roubles per dollar. The official rouble price of the dollar is plotted for the first half of 2002. The period of central bank intervention studied in this paper isindicated by the vertical lines in the chart.
57M. Melvin et al. / Journal of International Economics 79 (2009) 54–63
much more important as seen in Fig. 1. Submitting a very large asklimit order at the start of each day allowed the central bank to controlthe daily rate of depreciation in a kind of crawling peg arrangement.
The effect of such an arrangement is clearly seen in a plot of thelimit order price and counterparty activity for a day when the centralbank's limit price becomes one side of the inside spread in the market.The upper panel of Fig. 2 illustrates the central bank's limit orders andthe market price for March 1–7. On March 1, the central bank set anarrow range for the rouble with a bid price of 30.9400 and an askprice of 30.9450, which rises to 30.9500 late in the session. It is seenthat many trades occurred at both sides of the central bank's orders.Then from March 4 onwards, the ask price limit is raised to 30.9950
Fig. 2. Central bank limit orders and cumulative reserve loss. The upper figure illustrates thewith the actual price of executed deals in the market. Note that the central bank's bid price isillustrates the quantity on offer at the central bank's limit price for March 4–7 while the low
and the market consistently trades at that price over the day. Themiddle panel of Fig. 2 shows the central bank's limit order volume atthe ask price. During these days the market traded very often at thecentral bank's ask price and the quantity on offer fell steadily duringthese automated intervention activities.
3. Effects of central bank limit orders
3.1. The intervention effect on volatility and spread
The microstructure literature on foreign exchange interventionshas not produced fully conclusive results about the intervention effect
central bank's order at a price of 30.9450 for March 1 and 30.9950 for March 4–7, alongheld fixed at 30.9400, on March 1 therewere several trades at this bid. The middle paneler panel shows the cumulative loss of dollar reserves as a result of central bank trades.
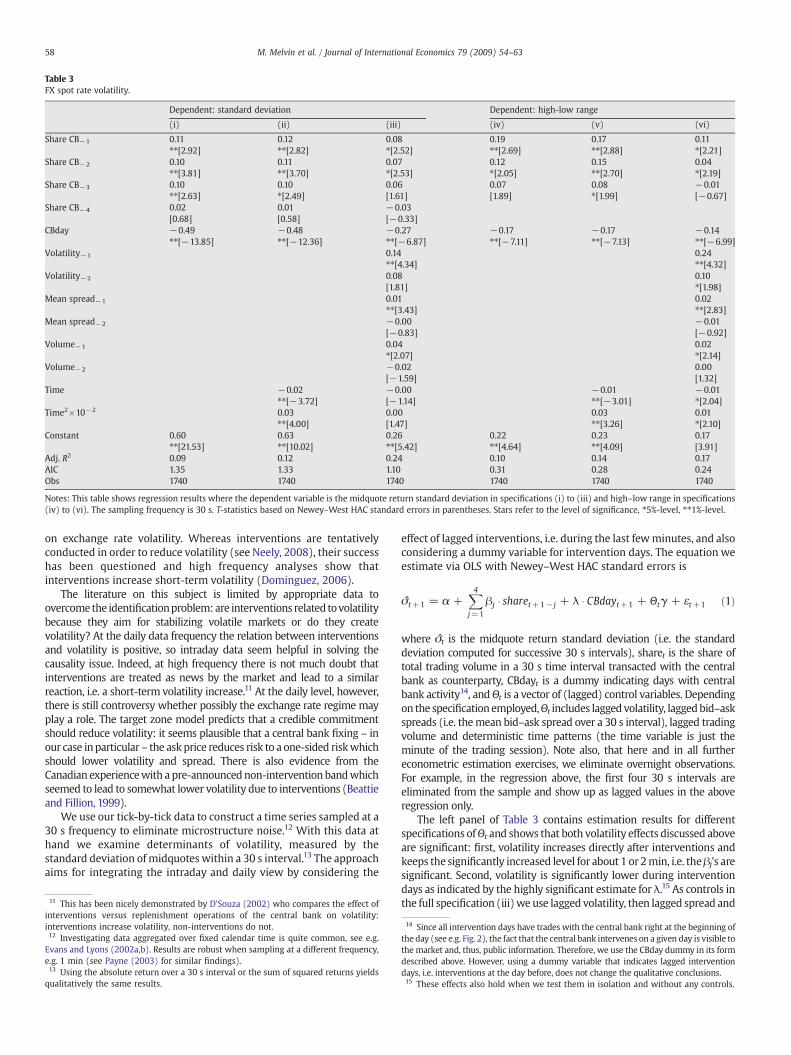
Table 3FX spot rate volatility.
Dependent: standard deviation Dependent: high-low range
(i) (ii) (iii) (iv) (v) (vi)
Share CB−1 0.11 0.12 0.08 0.19 0.17 0.11⁎⁎[2.92] ⁎⁎[2.82] ⁎[2.52] ⁎⁎[2.69] ⁎⁎[2.88] ⁎[2.21]
Share CB−2 0.10 0.11 0.07 0.12 0.15 0.04⁎⁎[3.81] ⁎⁎[3.70] ⁎[2.53] ⁎[2.05] ⁎⁎[2.70] ⁎[2.19]
Share CB−3 0.10 0.10 0.06 0.07 0.08 −0.01⁎⁎[2.63] ⁎[2.49] [1.61] [1.89] ⁎[1.99] [−0.67]
Share CB−4 0.02 0.01 −0.03[0.68] [0.58] [−0.33]
CBday −0.49 −0.48 −0.27 −0.17 −0.17 −0.14⁎⁎[−13.85] ⁎⁎[−12.36] ⁎⁎[−6.87] ⁎⁎[−7.11] ⁎⁎[−7.13] ⁎⁎[−6.99]
Volatility−1 0.14 0.24⁎⁎[4.34] ⁎⁎[4.32]
Volatility−2 0.08 0.10[1.81] ⁎[1.98]
Mean spread−1 0.01 0.02⁎⁎[3.43] ⁎⁎[2.83]
Mean spread−2 −0.00 −0.01[−0.83] [−0.92]
Volume−1 0.04 0.02⁎[2.07] ⁎[2.14]
Volume−2 −0.02 0.00[−1.59] [1.32]
Time −0.02 −0.00 −0.01 −0.01⁎⁎[−3.72] [−1.14] ⁎⁎[−3.01] ⁎[2.04]
Time2×10−2 0.03 0.00 0.03 0.01⁎⁎[4.00] [1.47] ⁎⁎[3.26] ⁎[2.10]
Constant 0.60 0.63 0.26 0.22 0.23 0.17⁎⁎[21.53] ⁎⁎[10.02] ⁎⁎[5.42] ⁎⁎[4.64] ⁎⁎[4.09] [3.91]
Adj. R2 0.09 0.12 0.24 0.10 0.14 0.17AIC 1.35 1.33 1.10 0.31 0.28 0.24Obs 1740 1740 1740 1740 1740 1740
Notes: This table shows regression results where the dependent variable is the midquote return standard deviation in specifications (i) to (iii) and high–low range in specifications(iv) to (vi). The sampling frequency is 30 s. T-statistics based on Newey–West HAC standard errors in parentheses. Stars refer to the level of significance, ⁎5%-level, ⁎⁎1%-level.
58 M. Melvin et al. / Journal of International Economics 79 (2009) 54–63
on exchange rate volatility. Whereas interventions are tentativelyconducted in order to reduce volatility (see Neely, 2008), their successhas been questioned and high frequency analyses show thatinterventions increase short-term volatility (Dominguez, 2006).
The literature on this subject is limited by appropriate data toovercomethe identificationproblem:are interventions related tovolatilitybecause they aim for stabilizing volatile markets or do they createvolatility? At the daily data frequency the relation between interventionsand volatility is positive, so intraday data seem helpful in solving thecausality issue. Indeed, at high frequency there is not much doubt thatinterventions are treated as news by the market and lead to a similarreaction, i.e. a short-term volatility increase.11 At the daily level, however,there is still controversy whether possibly the exchange rate regime mayplay a role. The target zone model predicts that a credible commitmentshould reduce volatility: it seems plausible that a central bank fixing – inour case inparticular – the ask price reduces risk to a one-sided riskwhichshould lower volatility and spread. There is also evidence from theCanadian experiencewith apre-announcednon-interventionbandwhichseemed to lead to somewhat lower volatility due to interventions (Beattieand Fillion, 1999).
We use our tick-by-tick data to construct a time series sampled at a30 s frequency to eliminate microstructure noise.12 With this data athand we examine determinants of volatility, measured by thestandard deviation of midquotes within a 30 s interval.13 The approachaims for integrating the intraday and daily view by considering the
11 This has been nicely demonstrated by D'Souza (2002) who compares the effect ofinterventions versus replenishment operations of the central bank on volatility:interventions increase volatility, non-interventions do not.12 Investigating data aggregated over fixed calendar time is quite common, see e.g.Evans and Lyons (2002a,b). Results are robust when sampling at a different frequency,e.g. 1 min (see Payne (2003) for similar findings).13 Using the absolute return over a 30 s interval or the sum of squared returns yieldsqualitatively the same results.
effect of lagged interventions, i.e. during the last fewminutes, and alsoconsidering a dummy variable for intervention days. The equation weestimate via OLS with Newey–West HAC standard errors is
σ̂t+1 = α +X4j=1
βj � sharet+1− j + λ � CBdayt+1 + Θtγ + εt+1 ð1Þ
where σ̂t is the midquote return standard deviation (i.e. the standarddeviation computed for successive 30 s intervals), sharet is the share oftotal trading volume in a 30 s time interval transacted with the centralbank as counterparty, CBdayt is a dummy indicating days with centralbank activity14, andΘt is a vector of (lagged) control variables. Dependingon the specificationemployed,Θt includes laggedvolatility, laggedbid–askspreads (i.e. themean bid–ask spread over a 30 s interval), lagged tradingvolume and deterministic time patterns (the time variable is just theminute of the trading session). Note also, that here and in all furthereconometric estimation exercises, we eliminate overnight observations.For example, in the regression above, the first four 30 s intervals areeliminated from the sample and show up as lagged values in the aboveregression only.
The left panel of Table 3 contains estimation results for differentspecifications ofΘt and shows that both volatility effects discussed aboveare significant: first, volatility increases directly after interventions andkeeps the significantly increased level for about 1 or 2min, i.e. theβj's aresignificant. Second, volatility is significantly lower during interventiondays as indicated by the highly significant estimate for λ.15 As controls inthe full specification (iii)we use lagged volatility, then lagged spread and
14 Since all intervention days have trades with the central bank right at the beginning ofthe day (see e.g. Fig. 2), the fact that the central bank intervenes on a given day is visible tothe market and, thus, public information. Therefore, we use the CBday dummy in its formdescribed above. However, using a dummy variable that indicates lagged interventiondays, i.e. interventions at the day before, does not change the qualitative conclusions.15 These effects also hold when we test them in isolation and without any controls.

Table 4Mean bid–ask spreads.
Dependent: mean spread
(i) (ii) (iii)
Share CB−1 2.40 2.68 1.62⁎⁎[3.07] ⁎⁎[3.00] ⁎[2.23]
Share CB−2 1.35 1.46 0.20⁎⁎[2.65] ⁎⁎[2.48] [0.40]
Share CB−3 1.12 1.08 0.31[1.46] [1.25] [0.52]
Share CB−4
CBday −9.13 −9.54 −2.32⁎⁎[−11.40] ⁎⁎[−8.32] ⁎⁎[−3.55]
Volatility−1 −0.09[−0.13]
Volatility−2 −0.51[−0.82]
Mean spread−1 0.78⁎⁎[10.42]
Mean spread−2 0.06[1.31]
Volume−1 0.62⁎[2.05]
Volume−2 −0.52[−1.52]
Time −0.61 −0.04⁎⁎[−4.17] [−0.97]
Time2×10−2 1.03 1.70⁎⁎[3.92] ⁎[2.20]
Constant 13.92 15.10 2.96⁎⁎[13.20] ⁎⁎[7.99] [1.20]
Adj. R2 0.06 0.15 0.62AIC 7.66 7.55 6.32Obs 1755 1755 1755
Notes: This table shows regression results with the mean bid–ask spread as dependentvariable. The sampling frequency is 30 s. T-statistics based on Newey–West HAC standarderrors in parentheses. Stars refer to the level of significance, ⁎5%-level, ⁎⁎1%-level.
17 The order flow indicator equals one if a trade is buyer initiated and minus oneotherwise. All order flow indicators in a 30 s interval are aggregated to yield the
59M. Melvin et al. / Journal of International Economics 79 (2009) 54–63
transaction volume to consider possible delayed effects from earlierevents and finally two time variables to consider a possible volatilitypattern during the 1 h opening time. However, whether controls orsubsets of these controls are used or not, results remain stable. Therefore,the effect is unlikely to result from higher trading volume due to centralbank trading since trading volume is included as a control in theregression and since trading volume and the share of central bankactivity (share) is not significantly correlated on intervention days.16
For reasons of robustness, we re-estimate the above specificationwith a different volatility proxy, namely the high-low range measuredover the intervals of 30 s.Results are reported in the rightpanel of Table 3and confirm our findings for a negative overall effect of interventions onvolatility and for a short-run positive effect. The only notable differenceis the significance of the lagged share variable. The short-run effects ofcentral bank interventions seem to die out somewhat more quicklycompared to using standard deviations as volatility proxy. We alsoestimate aGARCH(1,1)modelwithexplanatory variables in the volatilityequationwhich further strengthens the robustness of this central result(see Melvin et al., 2009).
We conclude that the Russian exchange rate band policy during thesample period has two effects on volatility, which have – to the best ofour knowledge – not been analyzed in a single approach before:automated intervention reduces volatilityat thedaily level and increasesvolatility in theminutes following a trade at the central bank's ask price.
Next we analyze the effect of intervention on bid–ask spreads. Thereare hardly any papers examining this relation as appropriate data aregenerally unavailable. The studies of Chari (2007) andPasquariello (2007)rely on quotes which are tentatively wider than effective spreads and donot necessarily reflect market conditions as precisely. Both studies findthat spread increases after interventions, indicating that a volatilityreducing effect may be counter balanced by higher transaction costs forcustomers (see Naranjo and Nimalendran, 2000, for daily data). Thus, wetest this by using an equivalent specification aswedid above for volatility:
mean spreadð Þt+1 = α +X3j=1
βj � sharet+1− j + λ � CBdayt+1
+ Θtγ + et+1
ð2Þ
where (mean spread)t is the average bid–ask spread over a 30 s intervaland all other variable definitions remain unchanged. Note, that we useonly three lags of the share variables since further lags are generallyinsignificant and also increase the AIC. Again, one might use a censoredregression model. However, the results do not change when doing so.
Results are shown inTable 4 andwefindanegative significant sign atthe daily level and a very short-lived spread increase after interventions.Obviously, spread effects go in the same direction as volatility effects inour sample.
The increase in spreads directly following interventions seems to be –at least partly – driven by lower liquidity. We find some (unreported)evidence that limit order submission decreases subsequently to reachingthe central bank's quote which might explain the temporary surge inspreads. However, the effect on spreads is short-lived and is clearly out-weighed by the overall reduction in spreads on central bank interventiondays.
Overall, in the case studied here intervention policy seems to con-tribute towards stable markets without noteworthy costs for the public.
3.2. The exchange rate band effect on the price impact of order flow
We extend the analysis of an automated crawling band effect ontrading activity by considering high frequency order flow. The theo-retical expectation of the price effects of order flow is motivated by
16 As can be seen in Table 1, daily trading volume and CB activity is correlated.However, in the intraday analysis conducted here (intervals of 30 seconds), we do notfind a high correlation of volume and the share variable.
Girardin and Lyons (2007). Following the intuition of Krugman (1991), acredible exchange rate band should dampen the price effect of orderflow as the limit of the band is approached. Taking into account thatorder flow transports information (Lyons, 2001), days when the centralbank's limit is reached shouldbecharacterizedbya lowerprice impactoforder flow, i.e. that the exchange rate is less responsive to the arrival ofinformation. Girardin and Lyons (2007) do not find clear evidence forsuch an effect for daily end user order flow of Citibank in the Yen/USdollar market.
We run price impact regressions of order flow on returns, as inEvans and Lyons (2002a), i.e. we estimate via OLS a regression of thefollowing form, again on the basis of 30 s intervals:
Δmt+1 = β0 + β1OFt+1 + β2OFt+1CBdayt+1
+ β3OFt+1CBdayt + 1Distt+1 + γΘt + et + 1
ð3Þ
where Δmt+1 is the midquote return over the chosen interval, OFt+1
is the order flow indicator17 and CBday is a dummy that equals one onintervention days.18 Dist denotes the average distance to the upperlimit of the Central Bank's crawling band, and, again, Θt containscontrol variables, namely lagged midquote returns and order flows. T-statistics are based on Newey–West HAC standard errors.
For this specification we again rely on the 30 s frequency, and weexclude all trades at the central bank limit because the impact is in these
aggregate order flow indicator for the respective interval which is used here.18 One may think of this specification as a varying parameter model whereΔmt + 1 = β0 + λtOFt + 1λt = β1 + β2CBdayt + 1 + β3CBdayt + 1Distt + 1Δmt + 1 = β0 + β1OFt + 1 + β2OFt + 1CBdayt + 1 + β3OFt + 1CBdayt + 1Distt + 1:

Table 5Price impact of order flow.
Unadjusted order flow Unexpected order flow
(i) (ii) (iii) (iv) (v) (vi) (vii) (viii)
OFt 0.087 0.123 0.087 0.123 0.121 0.112 0.171 0.159⁎⁎[6.99] ⁎⁎[9.14] ⁎⁎[7.49] ⁎⁎[9.12] ⁎⁎[8.67] ⁎⁎[7.88] ⁎⁎[8.14] ⁎⁎[6.95]
OFt×(CBday) −0.083 −0.096 −0.100 −0.160 −0.118⁎⁎[−3.85] ⁎⁎[−3.79] ⁎⁎[−4.33] ⁎⁎[−4.32] ⁎⁎[−5.04]
OFt×(CBday)×Dist −1.685 10.327 11.15 9.79[−0.31] ⁎[1.98] ⁎[2.04] ⁎[2.18]
Δm−1 0.089[1.57]
Δm−2 −0.026[−1.08]
OFt-1 0.011[1.38]
OFt-2 0.003[0.31]
Const. −0.480 −0.433 −0.482 −0.414 −0.436 −0.390 −0.359 −0.362⁎⁎[−7.39] ⁎⁎[−7.21] ⁎⁎[−7.49] ⁎⁎[−7.04] ⁎⁎[−6.87] ⁎⁎[−6.48] ⁎⁎[−4.99] ⁎⁎[−5.13]
Adj. R2 0.11 0.14 0.11 0.15 0.15 0.12 0.14 0.16Obs 1800 1800 1800 1800 1770 1800 1800 1800
Notes: The table shows regression results of midquote returns on order flow and further controls. The left panel (i)–(v) shows results for the usual order flow indicator, whereas theright panel (vi)–(viii) shows results for a measure of unexpected order flow. The sampling frequency is 30 s. T-statistics based on Newey–West HAC standard errors in parentheses.Stars refer to the level of significance, ⁎5%-level, ⁎⁎1%-level.
60 M. Melvin et al. / Journal of International Economics 79 (2009) 54–63
cases necessarily zero. Results presented in the left panel of Table 5 showthat the relation between order flow and returns is highly positive and ofthe same order as in other studies.19 The interaction term of order flowwith the central bank dummy is significantly negative. This indicates thatprice impact is dampened due to the intervention band. AWald test of therestriction β1+β2=0, which would indicate that the price impactcompletely vanishes on intervention days, cannot be rejected at anyreasonable level of significance. Furthermore, the interaction term withthe distance variableDist tends to be positive and ismarginally significant.Theestimated coefficient in specification (v) of Table5 indicates that a onestandard deviation increase in the distance variable increases the priceimpact of order flow by slightly less than 20%. Therefore, trades occurringfarther away from the Central Bank's crawling band have a tentativelyhigher price impact which seems to be intuitively related to the“honeymoon effect” of Krugman's (1991) target zonemodel as suggestedby Girardin and Lyons (2007).
We complement the above analysis by running the same sort ofregression with a measure of unexpected order flow following Pasquar-iello andVega (2007).While the above regressions directly use orderflowas a determinant of midquote returns, attention also focuses on the effectof the unexpected part of order flow, i.e. order flow shocks hitting themarket. To compute this measure of unexpected order flow, we estimatelogit models with the order flow indicator as dependent variable andlagged order flows andmidquote returns as right-hand side variables. Theregressionuses tick-by-tickdata inevent time. The residuals fromthis logitregression are free of predictable components in the raw order flowindicator and should thus provide a bettermeasure of information shocksthan raw order flow itself. For the empirical analysis we aggregate thegeneralized residuals fromthese regressions to the30s frequencyasaboveand re-run regression Eq. (3) with this measure of unexpected orderflow.20
19 Evans and Lyons (2002b) find that the order flow coefficient is 0.6 basis points per$10 million for DEM/USD and goes up for smaller markets, such as 2.4 for theAustralian dollar, while Scalia (2008) finds an even higher value of 7.6 for the Czechkoruna. The order flow coefficients in Table 4 are for order flow indicators and have tobe multiplied by a factor of 20 to obtain the impact per $10 million. Table 4 suggeststhat the impact on non-intervention days is about 0.123, so that we have an averageimpact of 0.123×20≈2.5 basis points.20 Estimationof the logitmodel in event time isdone separately for eachday. Asusual,weeliminate overnight observations and the lag length for past order flow and midquotereturns is determined separately for each day by minimizing the AIC. The average laglength across days is one for lagged order flow and two for past midquote returns.
Results are given in the right panel of Table 5 (specifications (vi)–(viii)). Eliminating predictable components from the raw order flowmeasure does not change our general results. This conclusion is similarto Pasquariello and Vega (2007) and it shows that our results are notdriven by simple endogeneity problems caused by feedback tradingwhere causality (partly) runs from midquote changes to order flow.
Finally, we can exercise another robustness test due to the highfrequency data available which is able to discriminate betweenmechanistic transitory liquidity effects of orderflowand its permanentinformation transmission. We estimate price impacts according to theHasbrouck (1991) metric, i.e. as the cumulative response of midquotereturns to order flow shocks in a SVAR-model. More specifically, weestimate a SVAR with midquote returns and market order flow asendogenous variables:
Ayt + 1 = G Lð Þyt + B�t + 1 with Var �t + 1� �
= I2 ð4Þ
where y=[Δmt+1 OFt+1]T,
A = 1 −α10 1
� �and B = βr 0
0 βx
� �ð5Þ
so that the SVAR is just-identified and causality runs from order flow tomidquote returns via α1. G(L) is a matrix polynomial in the lag operatorand thenumberof lags is chosenby theAIC foreach subsetof observationsemployed in the estimation detailed below. Permanent price impacts arecomputed by calculating the long-run cumulative response of midquotereturns to order flow shocks (see e.g. Evans and Lyons, 2002b, or Payne,2003 for applications of this procedure to FX spot rates).
The first row inTable 6 shows permanent price impacts of order flowon returns for interventiondays (left column)andnon-interventiondays(right column). As can be seen, and corroborating the evidence from theEvans–Lyons-type regressions in Table 5, order flow has a much largerprice impact on non-intervention days than on intervention days.21
In order to further examine whether the degree of price impactrobustly depends on the fact of interventions or not, we compare theaverage price impact on intervention days with non-intervention daysunder various market conditions. Thus we condition the price impactanalyses on variables that reflect market conditions typically found to
21 The price impact of 0.721 for “all trades” on intervention days in Table 5 roughlytranslates into a midquote movement of 2.4 pips. This is small compared to thepermanent impact on non-intervention days which is about 4.9 pips.

Table 6Permanent price impacts under different market conditions.
Price impacts (×1000)
CBdays Non-CBdays
All trades 0.721 1.444[0.000; 1.442] [0. 664; 2.224]
Low volume 0.547 1.057[−0.101; 1.194] [0.303; 1.811]
High volume 0.836 2.053[−0.042; 1.741] [0.716; 3.390]
Low volatility 0.140 0.651[−0.198; 0.478] [0.257; 1.045]
High volatility 1.742 1.899[0.021; 3.464] [0.613; 3.185]
Low spreads 0.242 0.954[−0.194; 0.678] [0.318; 1.590]
High spreads 1.211 2.101[−0.248; 2.670] [0.453; 3.749]
Notes: The table shows permanent price impacts from order flow on midquote returns.Permanent price impacts are measured according to the SVAR in Eqs. (4) and (5). Thesampling frequency is 30 s. 95% bootstrap confidence intervals are shown in squaredbrackets.
61M. Melvin et al. / Journal of International Economics 79 (2009) 54–63
be important in microstructure analysis. We use transacted volume asa proxy for market activity, midquote return volatility as a roughmeasure of information arrival and spreads to reflect the degree ofasymmetric information in the market.22 We then split the sampleinto two subsamples according to whether a sorting variable is belowor above the sample median and the permanent price impact of orderflow is calculated for intervention days and non-intervention days.Results of this procedure are given in the remaining rows of Table 6.
Results show marked variation in price impacts under differentmarket conditions. Price impacts tend to be higher in times of moremarket activity, higher volatility and higher spreads, so that times ofhigher market activity seem to indicate more information processing.Most interesting for our analysis is, however, that price impacts differin an economically significant way between intervention and non-intervention days. Price impacts are much higher on non-interventiondays in all regimes except the high volatility regime where the priceimpact increases only slightly. This again corroborates our finding thatinterventions dampen the impact of information arrival on spot ratemovements.
3.3. Order choice of (un)informed traders during intervention days
We know from the earlier descriptive parts of this paper that thereseem to be participants trading “against” the intervention band as canbe seen from the loss of reserves in the bottom panel of Fig. 2. At firstsight this may be unexpected, given the credibility of the interventionband. A plausible interpretation of this fact may be, however, that alater depreciation of the rouble is expected due to some pressure fromfundamentals and that either informed banks or informed customersof these banks trade on their anticipation. There is indeed Reutersheadline news supporting the viewof a fundamental pressure towardsrouble depreciation.
To explore who might be trading against the central bank's crawlingband, we exploit another feature of our data, i.e. its disaggregation oftrading banks into more and less informed participants, as discussed inSection 2.1 The SELT system.We use an order choice approach to analyzewho is trading against the band or supporting it. We do this by focusingon the variable “distance from central bank's ask”, i.e. the differencebetween the actual ask price of the central bank and the last transaction
22 These variables are also detrended to eliminate typical intraday patterns and thusto rule out the indirect influence of time. Therefore, we project each of the sortingvariables on 60 time dummies representing the minute of the trading session. We thenuse the predicted values of this regression as the intraday pattern and divide the actualobservations by the predicted value of the corresponding interval.
price (more details in Melvin et al., 2009). If the heavy buying at thecentral bank's ask is noise trading, then the share of buy orders should belargely independent of the distance from the intervention price. More-over, there should be no difference between more and less informedtraders.23
We estimate a logit model (buy versus sell market order) which isestimated separately for two groups, i.e. better informed and relativelyuninformed traders. We see that better informed traders buy morewhen the price comes closer to the upper intervention level, whereasthe less informed behave in a contrary manner. This significantlydifferent behavior suggests that informed traders' buys at the ask maybe no accident but a sort of speculative mini-attack on the crawlingband.
4. Implications for the central bank
The posting of limit orders is an effective device for containingexchange rate movements within narrow bounds. Our case studyshows that the Bankwas successful in stabilizing themarket in severalrespects. However, what are conditions for such a policy to beimplemented in general and which role does the electronic marketform play?
The ability of maintaining a credible exchange rate band dependsupon the central bank posting a quantity that is large relative to themarket so that whenever the central bank's quote rises to the top ofthe order book, the market cannot exhaust the quantity on offer andmove the exchange rate outside of the central bank's desired range. Inthis analysis of the Russian central bank's activity on an electroniccrossing network, it is clearly the case that the central bank's limitorders are very large relative to the quantities traded on this market.This conveys the image of a credible crawling exchange rate band.
Credibility of this exchange rate arrangement seems to besupported by strict capital controls which separate the domesticmarket from international financial markets. This institutionalrequirement ensures a limited market power of private participantswho might trade against the central bank's intentions. As capitalcontrols are widespread in emerging markets, it seems reasonablethat similar intervention strategies should work in other emergingmarkets controlling large currency reserves in relation to therespective currency market volume. Interestingly, the market organi-zation of a modern electronic crossing network is no disadvantage inimplementing a credible exchange rate band, as we argue below.
The literature on intervention has often focused on the channelthrough which intervention changes exchange rates. The typicaldiscretionary central bank intervention is accompanied by steriliza-tion of reserve flows in order to leave the money supply unchanged.Sterilization also seems to occur in Russia during the period we study.Since interest rates and prices are left unchanged, the usual avenuesthrough which exchange rates are changed include the portfoliobalance and signaling channels, or coordination of expectations (e.g.Reitz and Taylor, 2008). In the special case where intervention occursthrough limit orders on an electronic crossing network, it may be lesslikely that relative bond supplies are changed so that the portfoliobalance channel is not a likely candidate. There is clear signaling of thecentral bank's desired exchange rate with the posting of a limit orderthat the market learns must come from the central bank. In addition,such a posted limit order, with a very large quantity associated, servesas a credible mechanism for coordinating the expectations of marketparticipants.
However, when a central bank supports the domestic currency byproviding a perfectly elastic supply of dollars at a given exchange rate,reserve losses will be associated with trades that occur. In the case
23 In line with the order choice literature we control the decision to buy or sell, i.e. theorder choice, by a set of standard determinants (Parlour, 1998; Griffiths et al., 2000;Lyons, 2001; Ranaldo, 2004; Hasbrouck and Saar, 2009).

24 Findings are not driven by particular characteristics of the Russian market as thedaily interbank trading session at the MICEX has characteristics like those of otherelectronic crossing networks.
62 M. Melvin et al. / Journal of International Economics 79 (2009) 54–63
under study, where we know the trade sizes, it is possible for everytrader to calculate the (cumulated) reserve losses associated with theintervention activity. The lower panel of Fig. 2 depicts the cumulativeloss of reserves. The changing slope of this line reflects trade sizes atthe central bank's ask price. Over the week as a whole, the centralbank sold approximately $338 million dollars for roubles during theelectronic trading sessions which equals about 1% of reserves. Ifreserve losses are estimated to be reaching a threshold that wouldlead to the central bank's removal of the limit order, one would expecttraders to be even more aggressive in trading at the central bank'sprice. This may be seen as a short-term disadvantage for the centralbank but the visibility of interventions and thus changes in reserveswill also have a disciplining effect on the intervention policy of arational central bank. Thus, visibility of reserve losses shouldincentivize long-term credibility of exchange rate management.
The data indicate that onMarch 7 therewere some large trades latein the session as the loss of reserves increases steeply on this day. It isnotable that on the next day, the central bank allowed the officialexchange rate to depreciate to 31.1 as seen in Fig. 2. Thus, the reservelosses occurring on March 7 may represent a sort of “mini speculativeattack”. The fact that there was no limit order placed at 30.9950 onMarch 8, so that the exchange rate was allowed to depreciate, isconsistent with the central bank defending its reserves by allowingthe depreciation. As the Russian central bank was far away fromexhausting its reserves (the losses were only about 1% of totalreserves), its decision was deliberate in realizing a crawling peg. Weinterpret this episode as evidence that even in a regime with capitalcontrols it is costly for the central bank to support its currency againstobvious fundamental trends. It is often the case that a central bank'sgoal is not to achieve a hard peg but to reduce volatility in theexchange rate and moderate the rate of depreciation in line with acrawling peg regime.
Finally, a potential central bank advantage of intervening in thepassive form of posting limit orders is that the identity of counter-parties is revealed after each trade is completed. This information maybe useful in enforcing good behavior on the part of the private banks asthey know the central bank can monitor their trades when the centralbank is the counterparty. If the central bank exerts moral suasion orother enforcement mechanisms, which may be more effective inemerging compared to industrialized countries, then private banksmay regulate their trades at the central bank price to avoid anyappearance of an attack on the central bank. This mechanism may beweakened, however, if private banks just intermediate trades for theirinformed customers who are not necessarily revealed to the centralbank.
In summary, the Russian case may demonstrate to emergingeconomieswith large reserves and capital controls away of implement-ing a stabilizing crawling exchange rate band. The existence of anelectronic currency market may offer advantages in executing such apolicy.
5. Summary and conclusions
This study provides evidence regarding central bank interventionactivity in an emergingmarket via an electronic limit order book. Thuswe contribute to the increasingly important field of interventions inemerging markets but we also contribute – due to unusually detaileddata – to measuring the precise impact that interventions may have inmodern electronic currency markets.
We have focused on a short period of 2002 when the RussianCentral Bank maintained an exchange rate band for the rouble price ofa dollar by posting limit orders on an electronic crossing network. Thecentral bank orders were very large relative to the market and servedas a credible signaling device to private market participants.
Due to available deep information about the order book, we are ableto analyze this widespread exchange rate arrangement in a way not
being tackled in the earlier literature.24 We find for our sample thattrades at the central bank's limit price simultaneously induce adownward shift in volatility on a daily frequency, i.e. they reduce theoverall level of volatility. However, at the intraday frequency, such tradesinduce a higher transitory volatility that lasts for a fewminutes (resultshold qualitatively for spreads). Moreover, in this arrangement the priceimpact of order flow is lower on days when the central bank is an activeparticipant in themarket and the price impact falls the closer price is tothe central bank's limit. Finally, we see that more informed tradersexpect– in linewith fundamentals and correctly in retrospect– a furtherdecline of the rouble since they trade aggressively against the upperlimit of the exchange rate band. It is likely that the central bank seeks tosmooth the path of rouble depreciation in a crawling peg arrangementrather than defend a rigid peg at some particular exchange rate.
Sincemarket participants know the size of trades that occurred, thecentral bank's reserve losses are easily calculated. This transparency ofthe central bank's position is one potential disadvantage of using suchamechanism to limit exchange rate changes. However, theremaybe aninformational counterweight in that the central bank also learnedwhowas trading at their limit price as after each trade is completed, theparties learn each other's identity. So the central bank could potentiallyuse moral suasion or other means to discipline any private banks thatmight be viewed as abusing the systemor contributing to a speculativeattack.
The provision of liquidity via an electronic limit order book is onlylikely to serve as an effective exchange rate limiting device in a marketwhere over-the-counter trading is small compared to the electronicmarket and liquidity is concentrated on one trading platform. In thecase of Russia, non-residents traded in an offshore market due to alack of full convertibility of the rouble so that the domestic market wassegmented from outside pressures. This allowed the central bank toeffectively facilitate a crawling exchange rate band using limit orders.
Acknowledgments
We thank participants at the annual conferences of the AmericanEconomic Association, the European Economic Association, theEuropean Finance Association and the Royal Economic Society, atseveral university seminars, Andreas Fischer, Ingrid Lo, Mark P. Taylor,Eric van Wincoop (the editor), and two anonymous referees for veryuseful comments. Leila Gadijeva provided most helpful researchassistance. We gratefully acknowledge financial support from theGerman Research Foundation (Deutsche ForschungsgemeinschaftDFG).
References
Almekinders, G.J., 1995. Foreign Exchange Intervention: Theory and Evidence. EdwardElgar, London.
Beattie, N., Fillion, J.-F., 1999. An intraday analysis of the effectiveness of foreignexchange intervention. Bank of Canada Working Paper 99–4.
Chari, A., 2007. Heterogeneous market-making in foreign exchange markets: evidencefrom individual bank responses to central bank intervention. Journal of Money,Credit and Banking 39, 1134–1161.
Disyatat, P., Galati, G., 2007. The effectiveness of foreign exchange intervention inemerging market countries: evidence from the Czech koruna. Journal of Interna-tional Money and Finance 26, 383–402.
Dominguez, K.M.E., 2003. The market microstructure of central bank intervention.Journal of International Economics 59, 25–45.
Dominguez, K.M.E., 2006. When do central bank interventions influence intra-daily andlonger-term exchange rate movements. Journal of International Money and Finance25, 1051–1071.
Dominguez, K.M.E., Frankel, J.A., 1993. Does foreign-exchange intervention matter? Theportfolio effect. American Economic Review 83, 1356–1369.
Dominguez, K.M.E., Panthaki, F., 2007. The influence of actual and unrequitedinterventions. International Journal of Finance and Economics 12, 171–200.

63M. Melvin et al. / Journal of International Economics 79 (2009) 54–63
D'Souza, C., 2002. Amarketmicrostructure analysis of foreign exchange interventions inCanada. Bank of Canada Working Paper 2002–16.
Edison, H.J., 1993. The effectiveness of central-bank intervention: a survey of theliterature after 1982. Special Papers in International Economics No.18. InPrincetonUniversity.
Evans, M.D.D., Lyons, R.K., 2002a. Order flow and exchange rate dynamics. Journal ofPolitical Economy 110, 170–180.
Evans, M.D.D., Lyons, R.K., 2002b. Time-varying liquidity in foreign exchange. Journal ofMonetary Economics 49, 1025–1051.
Fatum, R., Hutchison, M.H., 2003. Is sterilised foreign exchange intervention effectiveafter all? An event study approach. Economic Journal 113, 390–411.
Fatum, R., King, M.R., 2005. Rules versus discretion in foreign exchange intervention:evidence from official Bank of Canada high-frequency data. Working Paper,University of Alberta and Bank of Canada.
Fatum, R., Pedersen, J., 2009. Real-time effects of central bank intervention in the Euromarket. Journal of International Economics, forthcoming.
Fischer, A.M., 2006. On the inadequacy of newswire reports for empirical research onforeign exchange interventions. Journal of International Money and Finance 25,1226–1240.
Fischer, A.M., Zurlinden, M., 1999. Exchange rate effects of central bank interventions:an analysis of transaction prices. Economic Journal 109, 662–676.
Fratzscher, M., 2006. On the long-term effectiveness of exchange rate communicationand interventions. Journal of International Money and Finance 25, 146–167.
Girardin, E., Lyons, R.K., 2007. Does intervention alter private behavior?. Working Paper,Université Aix-Marseille II and UC Berkeley.
Griffiths, M.D., Smith, B.F., Turnbull, D.A.S., White, R.W., 2000. The costs anddeterminants of order aggressiveness. Journal of Financial Economics 65, 65–88.
Hasbrouck, J.,1991.Measuring the information contentof stock trades. Journal of Finance46, 179–207.
Hasbrouck, J., Saar, G., 2009. Technology and liquidity provision: the blurring oftraditional definitions. Journal of Financial Markets 12, 143–172.
Humpage, O.F., 1999. U.S. intervention: assessing the probability of success. Journal ofMoney, Credit and Banking 31, 731–747.
Ito, T., 2002. Is foreign exchange intervention effective? The Japanese experience in the1990s. NBER Working Paper No.8914.
Ito, T., 2007. Myths and reality of foreign exchange interventions: an application toJapan. International Journal of Finance and Economics 12, 133–154.
Kearns, J., Rigobon, R., 2005. Identifying the efficacy of central bank interventions:evidence from Australia and Japan. Journal of International Economics 66, 31–48.
Krugman, P., 1991. Target zones and exchange rate dynamics. Quarterly Journal ofEconomics 106, 669–682.
Lyons, R.K., 2001. TheMicrostructure Approach to Exchange Rates.MIT Press, CambridgeMass.
Melvin, M., Menkhoff, L., Schmeling, M., 2009. Exchange rate management in emergingmarkets: intervention via an electronic limit order book. CESifo Working Paper.
Menkhoff, L., Schmeling, M., 2008. Local information in foreign exchange markets.Journal of International Money and Finance 27, 1383–1406.
Naranjo, A., Nimalendran, M., 2000. Government intervention and adverse selectioncosts in foreign exchange markets. Review of Financial Studies 13, 453–477.
Neely, C.J., 2005. An analysis of recent studies of the effect of foreign exchangeintervention. Federal Reserve Bank of St. Louis Review 87, 685–718.
Neely, C.J., 2008. Central bank authorities' beliefs about foreign exchange intervention.Journal of International Money and Finance 27, 1–25.
Parlour, C.A., 1998. Price dynamics in limit order markets. Review of Financial Studies 11,786–816.
Pasquariello, P., 2007. Informative trading or just costly noise? An analysis of centralbank interventions. Journal of Financial Markets 10, 107–143.
Pasquariello, P., Vega, C., 2007. Informed and strategic order flow in the bond markets.Review of Financial Studies 20, 1975–2019.
Payne, R., 2003. Informed trade in spot foreign exchange markets: an empiricalinvestigation. Journal of International Economics 61, 307–329.
Payne, R., Vitale, P., 2003. A transaction level study of the effects of central bankintervention of exchange rates. Journal of International Economics 61, 331–352.
Ranaldo, A., 2004. Order aggressiveness in limit order bookmarkets. Journal of FinancialMarkets 7, 53–74.
Reinhart, C.M., Rogoff, K.S., 2004. The modern history of exchange rate arrangements: areinterpretation. Quarterly Journal of Economics 119, 1–48.
Reitz, S., Taylor, M.P., 2008. The coordination channel of foreign exchange intervention:a nonlinear microstructural analysis. European Economic Review 52, 55–76.
Sarno, L., Taylor, M.P., 2001. Official intervention in the foreign exchange markets: is iteffective and, if so, how does it work? Journal of Economic Literature 34, 839–868.
Scalia, A., 2008. Is foreign exchange intervention effective? Some micro-analyticalevidence from the Czech Republic. Journal of International Money and Finance 27,529–546.