
Exchange Rate Exposure and The Use Of Foreign Currency...
31
Page | 1 Exchange Rate Exposure and The Use Of Foreign Currency Derivatives in the Australian Resources Sector Wing Hung Yip and Hoa Nguyen* School of Accounting, Economics and Finance Faculty of Business and Law Deakin University 221 Burwood Highway Burwood VIC 3125 Australia * Corresponding author: Hoa Nguyen Email: [email protected], Tel: +613 92446190, Fax +613 9244 6283
Transcript of Exchange Rate Exposure and The Use Of Foreign Currency...
Page | 1
Exchange Rate Exposure and The Use Of Foreign Currency Derivatives
in the Australian Resources Sector
Wing Hung Yip and Hoa Nguyen*
School of Accounting, Economics and Finance Faculty of Business and Law
Deakin University 221 Burwood Highway
Burwood VIC 3125 Australia
* Corresponding author: Hoa Nguyen Email: [email protected], Tel: +613 92446190, Fax +613 9244 6283

Page | 2
Exchange Rate Exposure and The Use Of Foreign Currency Derivatives in the Australian Resources Sector
Wing Hung Yip and Hoa Nguyen*
Abstract
In this paper, we provide a re-examination of the exchange rate exposure and foreign currency
derivative use by Australian resources firms in the 2006-2009 period which is characterized by
increased volatility caused by the global financial crisis. In particular, we consider the interaction
of a resources firm’s exchange rate risk exposures, currency derivative use and the global
financial crisis simultaneously. Conforming to expectations, our results indicate that more
companies are significantly exposed to exchange rate risk since the onset of the financial crisis.
However, there is a lack of evidence that the use of foreign currency derivative is more effective
in alleviating exchange rate exposures during the crisis as opposed to the pre-crisis period.
Keywords: Exchange rate exposure; foreign currency derivatives; Australian resources firms;
global financial crisis
JEL Classification: G32

Page | 3
1. Introduction
Exchange rate fluctuation has become a major source of risk to multinational corporations
around the world since the collapse of the Bretton Woods system in the early 1970s. However,
continuous innovations in financial markets and products have equipped corporations with a
variety of tools to effectively manage their exchange rate exposures. As a matter of fact,
exchange rate risk is one of the most widely hedged corporate risks. The popularity of foreign
currency derivatives (FCD) as a hedging device provides an interesting reason for research that
explores the relationship between FCD and foreign exchange exposure. Accordingly, in this
paper, we aim to re-examine the relationship between corporate hedging through the use of FCD
and its resultant impact on exchange rate exposures using a sample of Australian resources firms.
In addition, we investigate whether the global financial crisis (GFC) had any impact on the
dynamic of this relationship.
As highlighted above, we choose to re-examine this important empirical relationship by
focusing on a sample of Australian resources firms during a period that encompasses the global
financial crisis. Our sampling choice is based on a number of important considerations. First, the
resources sector is the backbone of the Australian economy that accounts for substantial export
revenues.1 In fact, the Australia’s resources sector is the country’s largest single export sector
and it is recognized as a high quality resources supplier in the world. Second, and more
importantly, resources firms tend to have better defined FX exposures than industrial firms. The
reason for this is two-fold: resources firms are heavily export oriented with Australia being the
world leading provider of many mining and metal products. In addition, commodities prices are
1 According to the Australia Export Fact sheet provided by the Department of Innovation, Industry, Science and Research, the mining sector was the top export sector by revenue in 2009. For more information, see http://www.innovation.gov.au/

Page | 4
often denominated in USD. As a result, resources companies commonly have exposure to
fluctuations in the AUD/USD exchange rate. On the contrary, industrial firms are significantly
more diverse in their operations and revenue structures and accordingly are less likely to have a
relatively uniform set of exposures. The prevalence of FX exposure in the resources sector helps
ensure that foreign currency derivatives FCD are generally used for hedging purposes as opposed
to speculative reasons, a practice that can potentially cloud the relationship between exchange
rate exposure and corporate use of FCD. Our sampling choice, hence, enables us to document a
more robust empirical relationship between FCD and exposure.
Another contribution of our paper lies in the sampling period of 2006-2009 which covers
the GFC. The GFC was responsible for a dramatic decline in the value of the AUD.2 Factors
contributing to this decline include interest rate cuts, a temporary weakening of commodity
demand from China and the abandonment of the AUD by panicking investors. We hypothesize
that such a large and sudden decline in the exchange rate would have a significant impact on the
revenues and hence stock returns of resources firms. In particular, we predict that our sample
firms would be more exposed to exchange rate fluctuations during the GFC.
Our results show that the majority of resources firms are significantly exposed to FX risk.
More interestingly, the number of firms suffering from significant FX exposures increased from
14.43% to 45.36% during the financial crisis. We also find evidence that in response to the
increased exposure, FCD users intensified the extent of FCD usage although there is no
substantial increase in the proportion of firms that make use of the instruments. We also find
some weak evidence that the use of FCD is associated with a lower level of exposures although
2 Before the GFC hit the AUD was trading at approximately 94 US cents. In the midst of the GFC, the AUD bottomed at 63 US cents in late 2008.

Page | 5
conclusion cannot be drawn on whether the use of such instrument in alleviating exchange rate
risk is more effective in one period compared to another. Another noteworthy finding of this
paper is the “firm size effect” where larger firms appear to have much less exposure, a result that
is plausibly an indication of how larger resources firms are better positioned to manage their
exchange rate risk.
The remainder of this paper is structured as follows: in the next section, a review of the
current literature on FX exposure and FCD usage is provided. Section 3 describes the sample
selection and dataset followed by the econometric framework. Section 4 presents and discusses
the results. Section 5 concludes.
2. Literature review Exchange rate exposure identification and corporate FX risk management strategies have been
the topic of a well established body of literature. Pioneer work in the area such as Jorion (1990),
Bodnar and Gentry (1993) and Allayannis and Ofek (2001) highlighted the potential impact of
exchange rate fluctuations on the firm stock return. In addition, although firms tend to use a
combination of internal and external hedging instruments, FCD by far has been the most popular
hedging device for short term exchange rate exposure.
Nevertheless, empirical studies that examined the effectiveness of FCD in managing FX
risk produced mixed results. Bali et al. (2007), Copeland and Joshi (1996) and Hentschel and
Kothari (2001) contend that FCD use does not appear to be associated with a lower level of FX
exposure. A number of explanations have been advanced to account for this lack of relationship.
First, firms use other forms of risk management such as operational hedging from global
diversification or production management. Second, firms do not usually fully hedge the extent of

Page | 6
exchange rate movements. Third, interest rate, exchange rate, and commodity risks are
economically insignificant relative to the firm’s return. Fourth, firms do not have an economic
justification for derivatives hedging if they are large, diversified and of good credit quality,
except in special cases. Guay and Kothari (2003) further show that corporate derivative use
appears to be a small piece of non-financial firms’ overall risk profile as the amount of their
derivatives holding is economically small in relation to their entity-level risk exposures. On the
contrary, Nguyen and Faff (2003), Hagelin and Pramborg, (2004) and Chaing and Lin (2005)
report that the use of FCD is associated with lower exposures. In addition, Allayannis and Ofek
(2001) further demonstrate that the use of FCD can enhance firm value. In particular, firms that
use FCD enjoy a substantial hedging premium.
Some existing literature also proposed that FX exposure might be an industry specific
phenomenon. Bodnar and Gentry (1993) argued that exchange rate fluctuations affect some
industries differently than others because some are more export or import dependent than others.
The results were confirmed by Shin and Soenen (1999) and He and Ng (1998) who studied a set
of different industrial sectors. Nguyen and Faff (2003) proposed the industry effect on exchange
rate exposure. They found that the Australian sample firms from resources sector achieved a
greater degree of monthly exposure reduction than the industrial sector with the use of FCD.
Different sectors may also engage in different hedging practices. For example, resource/mining
companies are believed to hedge more extensively.
In late 2008, global markets were blown apart by a sharp and sudden spike in volatility.
The GFC caused many companies to revisit or establish new foreign exchange risk strategies.
Kirschner (2009) mentioned that the use of FCD was being reassessed by firms attempting to
effectively manage the dramatic increase in currency risk accompanying the GFC. Undoubtedly,
Page | 7
a financial turmoil the magnitude of the GFC provided an imperative for multinational
corporations to review their risk management practices. Even in the absence of a financial
shakeup like the GFC, Dominguez and Tesar (2006) demonstrated that firm exposures to FX
movements are time-varying and likely to be an indication that firms actively adjust their
behavior in response to FX risk.
3. Data and Empirical framework
3.1 Sample selection and dataset
In light of hedging theory, firms using derivatives are usually bigger in size compared to those
that do not use derivatives. The economic explanation for this is only larger firms would have
sufficient financial and human resources to establish and manage a hedging program (Nance et
al., 1993). In addition, firms in exploration stages are generally small and more importantly they
do not generate any profits and hence are unlikely to have revenue-based exchange rate exposure.
Derivative usage also appears to be an uncommon practice among small firms in general and
resources firms in particular. As a result, we focus on the top 200 Australian listed resource firms
based on market capitalization. To enable the collection of FCD data, the firms are required to
have financial statements available from 2006 to 2009. Firms are then screened according to the
following criteria:
• They have thorough disclosure of the management of foreign exchange risk exposure in
the financial statements
• Firms in exploration stage are excluded for reasons that were explained above.

Page | 8
Following this filtering process, a final sample of 97 firms is obtained. FCD data is collected
manually from firms’ annual financial statements. A firm is classified as a ‘currency derivative
user’ if it uses any of the following derivative instruments to hedge the foreign exchange rate
risk – swaps, futures/forwards and options. Accordingly, data on year-end notional value of FCD
contracts were obtained from the notes to the financial statements of each individual firm.
Monthly AUD/USD exchange rate was extracted from Bloomberg while monthly stock return
data was gathered from Finanalysis. Foreign sales variable was attained from individual firm
annual report. Further data relating to the control variables were obtained from Bloomberg.
In defining the onset of the (GFC), a number of opinions exist. However, for the purpose
of this study, the pre-crisis period is defined as January 2006 – December 2007 and the crisis
period is January 2008 – December 2009. This arbitrary definition is largely due to the fact that
the variables used in the regressions are on annual basis. Hence both the pre-crisis and crisis
periods have to contain full years.3
3.2 Research Methods 3.2.1 Measuring exchange rate exposure
Following the literature, we employ a two-stage market model to investigate the relationship
between the use of FCD, and FX exposure. In the first stage, Jorion’s (1991) model is used to
estimate the FX exposure coefficients for the individual firms. The model is specified as follows:
+ + + (1)
3 For example, FCD data are collected from annual financial reports. As a result, they are not available in higher time frequency.

Page | 9
where is the monthly continuously stock return of firm i from January 2000 – July 2010;
is the monthly return on the ASX All Ordinaries Index from January 2000 – July 2010;
is the monthly change in the AUD/USD exchange rate. Monthly data will be used instead of
daily or weekly, since daily and weekly exchange rate indices are noisier and usually suffer from
nonsynchroneity problems which is the nonalignment of stock-return and exchange-rate series
(Allayannis and Ofek, 2001). , , and are raw unadjusted measures of return.
To enable a comparison between the degrees of FX exposure pre- and during-crisis, pre-
crisis exposure and during-crisis exposure are measured using the following regression:
+ + + + + (2)
where ( ) is a dummy variable set equal to unity if an observation is made before (during)
the GFC in Dec 2007 and zero otherwise. The definition of other variables remains the same as
above.
3.2.2 Cross-sectional regression
The changing pattern, if any, of the association between FCD usage/intensity and FX exposure
pre- and during-crisis is determined by second stage regressions using the FX exposures
estimated in Equation (1) as the dependent variable. The regressions are specified as follows:
+ + (3)
+ * + * + (4)
+ + (5)
+ * + * + (6)
is the exchange rate coefficient estimated from Equation (1). is a dummy variable
taking a value of unity if a firm uses FCD in a financial year and zero otherwise. is

Page | 10
the extent of FCD usage which is measured as (1) the notional amount of FCD contracts scaled
by total assets and (2) the notional amount of FCD contracts scaled by foreign sales.
Equations (3) to (6) incorporate the risk management activities proxied by USE and
EXTENT, factors that are believed to determine the level of FX exposure. If firms use FCDs to
hedge FX risk and FCDs are efficient in reducing the level of exposure, it is predicted that the
more FCDs a firm uses, the less it is exposed to FX risk.
Finally, an extended cross-sectional analysis of FX exposure is performed by running the
following regressions:
+ + ∑ + (7)
+ * * ∑ * ∑ * + (8)
+ + ∑ + (9)
+ * * ∑ * ∑ * + (10)
The above equations followed the approach adopted by Chow and Chen (1998) who
extended the cross-sectional analyses by including the additional independent variables ) to
control for firms incentives to hedge. These variables comprise: LEV (gearing ratio) measured as
the ratio of total debt to total equity, SIZE (firm size) measured as total assets, LIQ (liquidity)
measured as ratio of cash flow to total assets and PE (price earnings) measured as ratio of price
per share to earnings per share. The choice of these control variables is consistent with the
literature. A number of previous studies reported a number of factors underlying a hedging
policy. For example, firm’s use of FCD is positively related to the amount of R&D expenditure
to reduce underinvestment (Froot et al., 1993). Larger firms hedge more since they can achieve
economies of scale. Thus, the use of FCD generally rises proportionately with the size of the firm.
Page | 11
Liquidity is argued to be a substitute for hedging. There is less intention to liquid firms to use
derivatives to smooth earnings. Thus, less liquid firms would be more likely to use derivatives.
Finally, firms with growth options are more likely to hedge so that they have adequate funds to
undertake all positive NPV projects (Nguyen and Faff, 2002).
4. Results 4.1 Exchange rate exposure of Australian resource firms pre and during the GFC
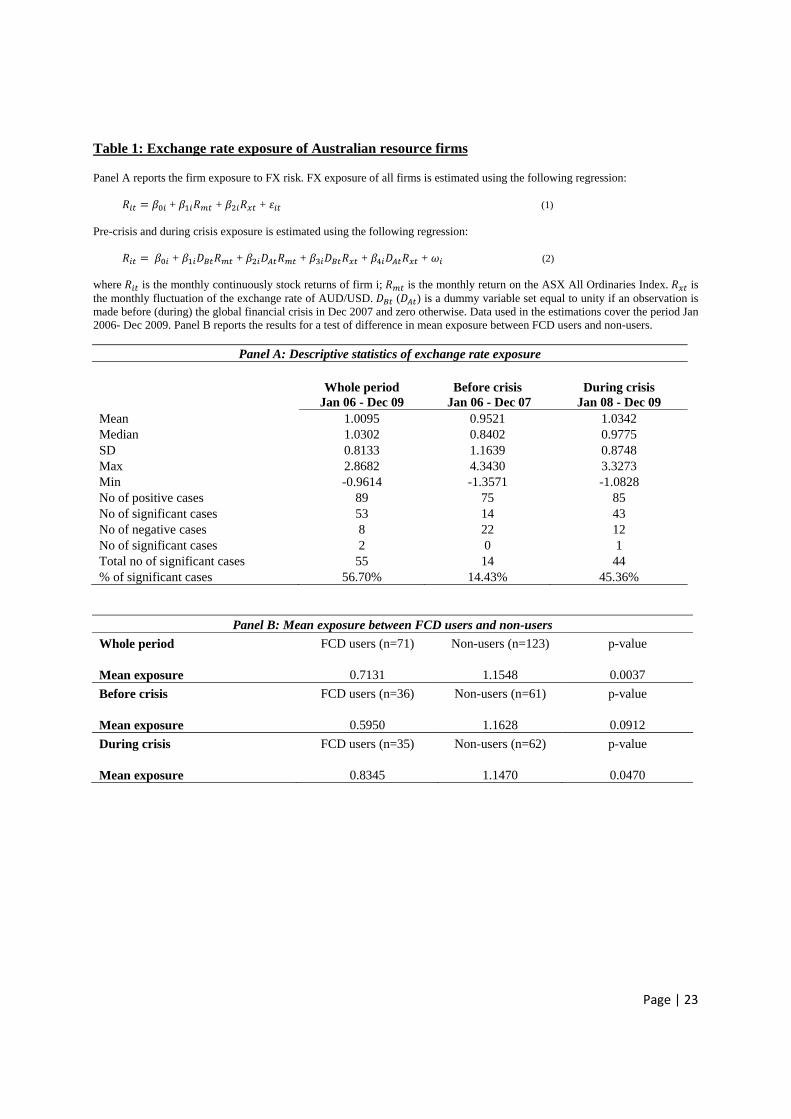
FX exposure, as estimated using Equations (1) and (2), are reported in Panel A of Table 1. Our
results show that 56.7% of all sample firms have statistically significant exchange rate exposure.
The proportion of firms that have significant exposure is quite substantial compared to what had
been reported in the literature.4 Nevertheless, a closer examination reveals that the GFC was
plausibly the underlying reason for the prevalence of significant FX exposure. In particular, only
13% of firms were exposed to FX exposure before the crisis. This figure increased substantially
to 45.36% at the onset of the GFC. The results also indicate that Australian resources firms are
overwhelmingly positively exposed to fluctuations in the AUD/USD exchange rate. In other
words, firms appear to on average gain from an appreciation of the AUD, a result consistent with
cost-based exposures as opposed to revenue-based exposures. There are two possible
explanations for this result. First, 39% of the sample firms do not have any foreign sales.5
Generally speaking, only firms with revenue exposure are expected to be hurt by an increase in 4 The existing literature has documented relatively lower significant exposures. Bodnar and Gentry (1993) for example showed that 23%, 21%, and 25% of the portfolios were significantly exposed to FX risk for the United States, Canada and Japan, respectively. Nguyen and Faff (2003) and (2006) reported significant FX exposure for 10.34% and 30.3% of their samples of Australian and French firms respectively. 5 Although 39% of the sample firms do not have any foreign sales, they still have foreign exchange rate exposure as their foreign exchange risk arises when future commercial transactions and recognized financial assets and financial liabilities are denominated in a currency that is not the entity’s functional currency. Dominguez and Tesar (2006) mentioned that firms with no international business could also be affected by the exchange rate movement through competition with foreign firms.

Page | 12
the value of the local currency. Second, the revenue based exposures could be significantly
reduced by corporate practices of setting up natural hedges where foreign denominated revenues
are offset by foreign denominated expenses. As an example, of those firms that do not make use
of FCD, 21% actually engage in one or more forms of natural hedges.
Partitioning the sample into pre-crisis and during-crisis periods further reveals that not
only does the number of firms that have significant FX exposures increase during the crisis but in
terms of economic significance, firm stock returns are more severely impacted upon by a certain
change in the exchange rate. For example, before the crisis, a 1% increase in the exchange rate
results in a 0.95% change in the individual stock return. This figure increased to 1.03% during
the crisis.
Panel B of Table 1 reports the results for a test of difference in exposure between FCD
users and non-users. As expected, non-users show a consistently higher mean exposure
comparing to FCD users in both pre and during crisis periods. Overall, our preliminary results
suggest that FCD users are not as exposed to FX exposures as their non FCD-using counterparts.
Another noteworthy finding from Panel B of Table 2 is the fact that FCD users appear to have
been more strongly impacted by the GFC than non-FCD users. FCD users, on average,
experienced a higher level of exposure during the crisis while the absolute level of exposure for
non-users stays relatively stable throughout the sampling period.
4.2 Descriptive statistics
Table 2 further provides descriptive statistics on the pattern of FCD usage and financial
characteristics of our sample firms. As is shown in Table A, the number of firms that employ
FCD does not appear to be impacted upon by the exchange rate fluctuation in 2008. Nonetheless,

Page | 13
there was a sharp increase in the intensity with which these instruments are used.. The mean
extent of usage as measured by the contract value of FCD scaled by total assets, has amplified
from 3.36% in 2007 to 8.60% in 2008. The median extent of usage increased from 1.08% to
1.83%. The other measure of the extent of FCD usage where FCD is scaled foreign sales
produces very similar result.
FCD usage was then observed to decline in 2009 by 2.8% and 9.83% as measured by
FCD/TA and FCD/FS respectively. This result is largely consistent with Melvin and Taylor’s
(2009) observation that after the onset of the GFC many firms choose to reduce the amount of
hedging or leave the entire position unhedged due to the increased cost of hedging and more
importantly increased counterparty risk. The bid-ask spread of currency derivatives contracts was
noted by Melvin and Taylor (2009) to increase by at least 400% after the onset of the crisis. In
addition, derivative contract providers, notably financial institutions, suffered from a number of
credit issues which further undermined corporate desire to take out new over the counter
contracts. 6 In the case of resource firms, if they had derivative dealings with a financial
institution that might go bankrupt, there is a chance that the contract would not be honoured. The
fact that both individual investors and institutional investors have lost confidence in financial
institutions due to the crisis coupled with the increased hedging cost is responsible for a decline
in the extent of FCD usage.
Financial characteristics of sample firms before and during the crisis are further presented
in Panel B. For the whole sampling period, users of FCD and non-users are statistically
discernible from each other with respect to total asset, total sales, foreign sales and PE ratio.
FCD users, on average, are found to be larger with higher growth opportunities. The results
6 Most of the FCD users in the sample use forward contract rather than futures contract to hedge their FX risk. As a result, counterparty risk is a relevant source of risk of our sample firms.

Page | 14
provide support to the contention that the cost of commencing and maintaining a derivatives
program is not minor and as such larger firms are more likely to hedge. On the other hand,
smaller firms may not make extensive use of FCD due to their limited exposure needs. With
further partitioning of the sampling period, the hedgers and non-hedgers are statistically different
from one another in relation to the PE ratio before the crisis but not during the crisis. On the
contrary, leverage appears to be the factor that distinguishes hedgers and non-hedgers prior to the
crisis but no longer so during the crisis. However, the findings in relation to both variables are
consistent with the literature reviews that firms with higher leverage and more growth
opportunities are more likely to use derivatives. A finding worthy of note is the fact that the
mean PE ratio for non-FCD users is negative. By convention, companies that are not currently
profitable (negative earnings) are treated as having negative PE ratio. This means some of the
sample firms are suffering loss during the sampling period. Since some of the sample firms are
newly established, it is not unusual that they do not generate any profit. This result is also
consistent with our earlier finding that the sample firms on average have cost exposures rather
than revenue exposures.
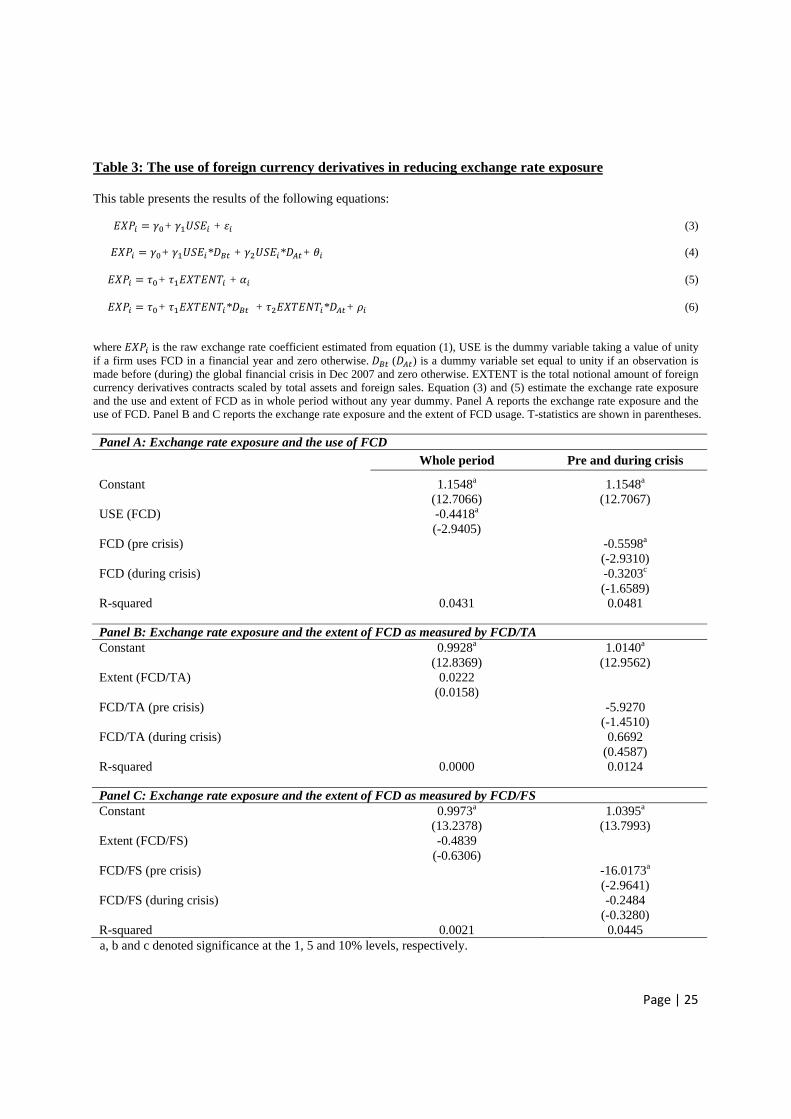
4.3 Exchange rate exposure and the use of foreign currency derivatives
This section explores the use of FCD in reducing FX exposure and whether this has been
influenced by the GFC. Regression results of Equations (3) to (6) are reported in Table 3. In
Panel A, the raw FX exposure as estimated in Equation (1) is used as the dependant variable. The
absolute value of FX exposure coefficient was used in a number of previous studies to address
the issue of ‘sign confusion’.7 Nevertheless, this exercise might be redundant in this case due to
7 The ‘sign confusion’ effect refers to the multi dimensional interpretation that can be assigned to the coefficient. For example, a positive FCD coefficient can be interpreted as ‘having a positive impact on FX exposure’ in the case of a
Page | 15
the overwhelmingly positivity of the exposures.8 With the fact that the majority of sample firms
exhibit positive exposure, a negative coefficient on the FCD variable indicates that there is a
negative relationship between the use/extent of FCD and the FX exposure. In other words, the
use of FCD can reduce the level of FX exposure. As is obvious from Panel A, the use of FCD in
both periods is associated with lower FX exposure. The incidence of FCD usage prior to the
crisis is associated with a reduction of 0.5598 in the FX exposure while the reduction is of a
magnitude of 0.3205 during the crisis. The results are significant at 1% level and 10% level
respectively.
Unlike the substantial explanatory power of FCD use, the extent to which FCD are used
appears to have little impact on exposure. Both the FCD/TA and FCD/FS are not significant in
the whole period. However, there is some evidence that the extent of usage as measured by
FCD/FS (Panel C) is a significant explanatory variable for FX exposure before the crisis which is
consistent with the result in Allayannis and Ofek (2001). The FCD/TA variable, however, does
not appear to have any power in explaining FX exposures. This lack of significant relationship is
depicted in Panel B of Table 3. Although the intensity with which firms use FCD reveals a
relationship to FX exposure that lacks consistency, the results in Panel A indicate that firms’ FX
exposure is mitigated through the use of FCD, a result that is in accordance with Allanyannis
and Ofek (2001) and Chaing and Lin (2005). This supports the hypothesis that the use of FCD is
for hedging purposes and that FCD is effective in alleviating exchange rate exposure.
In Table 4, a set of controlling variables were introduced that are proxies for other
incentives for hedging, namely: firm size, leverage, liquidity and growth opportunities as
firm with positive exposure but a totally opposite meaning in the case of a firm with negative exposure. For more detail, see Nguyen and Faff (2006) and Allayannis and Ofek (2001). 8 Absolute exposure was used as a robustness check but the exercise does not change the essence of the results.

Page | 16
measured by the PE ratio together with FCD, FCD/TA and FCD/FS. In the presence of the
control variables, the results appear to be contradictory to previous studies. As is detailed in
Panel A of Table 4, the explanatory powers of FCD usage disappear while firm size and leverage
seem to be more powerful in explaining the level of FX exposure especially firm size. The
coefficient of firm size in relation to the firm FX exposure is significant at 1% level as in whole
period. It is also significant at 1% and 5% level before and during the crisis. The negative
relationship between firm size and FX exposure is predictable as big firms are more effective in
hedging risk.9 Generally speaking, larger firms are more exposed to exchange rate fluctuation. In
order to reduce their FX exposure, not only can they use FCD but also the other risk-
management substitution techniques like foreign denominated debt, exposure netting,10 funds
adjustment11 and other multiple methods.
On the other hand, leverage also has an effect on the FX exposure but only before the
crisis. Contrary to the prediction that firms with higher leverage are more likely to use
derivatives and so the level of FX exposure is mitigated, the finding shows that the leverage
coefficient is positive. This connotes that higher leverage firms would have higher FX exposure
before the crisis. Notwithstanding the fact that the explanatory powers of FCD usage disappear
after the presence of control variables, results in Panel C suggest that the reduction in FX
exposure is associated with the act of FCD usage. However, this relationship only holds in the
pre-crisis period.
9 It is worth noting that if derivatives are used by larger firms to hedge exposures, we should expect a negative relationship between larger firms (derivative use) and positive exposure. 10 Exposure netting involves offsetting exposures in one currency with exposures in the same or another currency, where exchange rates are expected to move in a way such that losses (gains) on the first exposed position will be offset by gains (losses) on the second currency exposure. 11 Funds adjustment involves altering either the amounts or the currencies (or both) of the planned cash flows of the parent or its subsidiaries to reduce the firms local currency accounting exposure.

Page | 17
4.4 Robustness checks
A number of robustness checks were performed to ensure the robustness of the results. Although
the 97 sample firms are selected from a list of top 200 resource firms, there exists a wide gap in
firm size as the total asset of the biggest firm is $78,770m while the smallest firm is worth
$101.2m. In addition, as firm size appears to have significant impacts on the level of exposures
for resources firms both economically and statistically, it is necessary to perform robustness
checks to further re-estimate the exposure. Accordingly, the sample was separated into two
portfolios in terms of market capitalization. The first portfolio contains the largest 49 sample
firms while the second portfolio contains the remaining 48 sample firms.
Descriptive statistics in relation to the use of FCD for the two portfolios are presented in
Table 5. As is shown in Panel A of Table 5, despite the fact that large resources firms use FCD
more intensively during the financial crisis, the FX exposure for them during the crisis is higher
than prior to the crisis. The results in this table further confirm the results reported in Table 1 that
the GFC creates a substantially high level of exposure for sample firms. Table 5 further shows
that despite using FCD more intensively during the crisis, firms still have a higher level of
residual exposure.
The results of the robustness check are presented in Table 6. 12 Consistent with the
previous estimation, the control variables were also included to proxy for factors other than
hedging that can potentially influence the level of FX risk. In Panels A and D of Table 6, in the
presence of control variables, the most important determinant of FX exposure appears to be firm
size. In Panels E and F, the extent of usage as measured by both FCD/FS and FCD/TA is
significant which is consistent with prior results. Guay (1999) examined new derivatives users
12 Results relating to the control variables are not reported to conserve space.

Page | 18
and the time-series relation between changes in derivatives use and changes in firm risk. The
result showed that new users of derivatives experienced significant FX risk reduction in the
period following the initiation of a derivatives program. With the partitioning of the sample in
the robustness checks, despite the comparatively lesser number of FCD users in the second
portfolio, the extent of FCD usage of smaller firms is effective in reducing the level of FX
exposure. Unlike the bigger firms in the first portfolio who are already well established, some of
the sample firms in the second portfolio have only been established for a few years. These firms
are still very new in using FCD. In that case, although only a small number of them use FCD, the
extent of FCD usage is material. For bigger firms, since they have already been using FCD for a
long time, the act of FCD use is meaningful to them but the intensity of FCD usage is
comparatively marginal.
The findings of the robustness check provide strong evidence that the level of FX
exposure for Australian resources firms is predominantly determined by firm size. This finding is
indicative of the fact that larger firms are much better positioned to manage their risk exposure
profiles using a variety of risk management techniques of which FCD is one. This result in
relation to firm size might be a function of the way in which the sample is selected. In particular,
the 97 sample firms are filtered from the top 200 resource firms in Australia which may create a
bias towards larger firms. However, this filtering process is important to ensure that sample firms
have revenue or cost-based foreign exchange exposures. In addition, small resource firms, more
often than not, do not tend to employ FCD. 13 Bodnar and Gentry (1993) highlighted the
importance of sample selection by arguing that the failure of a number of studies in documenting
13 The sample initially comprised of the top 200 resources firms. However, the final sample is reduced to 97 due to the fact that most firms in the bottom 100 firms do not make use of FCD. More importantly, most of them are in exploration stages and as such do not have exchange rate exposures.
Page | 19
firm significant exchange rate exposures is due to poor sample selection practice whereby firms
with no exchange rate exposures are included in the sample. The sample in Nguyen and Faff
(2003) is also chosen based on a certain percentage of foreign sales of the firms.14
The finding in relation to firm size is in accordance with empirical findings reported by a
plethora of studies. Berkman et al. (2002) found that firm size and leverage are the main
explanatory variables underlying the use of financial derivatives in Australian industrial and
mining firms. Similarly, Bali et al. (2007) showed that larger firms are more likely to be exposed
to exchange-rate movements than firms with smaller involvement in international transactions.
Many previous studies provided empirical evidence that level of risk exposure is associated with
an increase in firm size, hence larger firms hedge more to reduce the exposure.15
5. Conclusion
Recent studies showed that FX exposures of non-financial companies could be managed through
the use of FCD. Building on such research, the main contribution of this study is to further
confirm the relationship between derivative usage and exposure to currency risk of a sample of
large Australian resource firms. Our findings suggest that the number of firms that have
significant FX exposure and the intensity of exposure increased during the crisis. In the presence
of the increasing level of exposure, firms responded by using more FCD although the number of
FCD users appears to reduce slightly during the crisis.
Consistent with the notion that the use of FCD is primarily for hedging purposes, there
are some partial evidence that the use of FCD is associated with a reduction in firm FX risk
14 Some previous studies pointed out the importance of foreign sales in influencing the foreign exchange exposure. They set a certain percentage of foreign sales as the necessary criterion to document FX exposures. See (Allayannis and Ofek , 2001; Chiang and Lin, 2005; Nguyen and Faff, 2006) for detail. 15 See (Nance et al., 1993; Berkman and Bradbury, 1996; Nguyen and Faff , 2002) for detail.

Page | 20
despite the economic significance of the exposure reducing property of FCD during the crisis is
relatively lower than before the crisis. To the extent that corporations monitor the effectiveness
of their hedging strategy, it is expected that firms with significant FX exposure have changed
their level use of FCD accordingly during the financial crisis. Nevertheless, there is not sufficient
evidence to conclude that an increased level of FCD use results in lower FX exposure during the
crisis.

Page | 21
References Allayannis, G., & Ofek, E. (2001). Exchange rate exposure, hedging, and the use of foreign currency derivatives. Journal of International Money & Finance, 20(2), 273. Al-Shboul, M., & Alison, S. (2009). The Effects of the Use of Corporate Derivatives on the Foreign Exchange Rate Exposure. Journal of Accounting, Business & Management, 16(1), 72-92. Bali, T., Hume, S., & Martell, T. (2007). A new look at hedging with derivatives: Will firms reduce market risk exposure. Journal of Futures Markets, 27(11). Berkman, H. and Bradbury, M, E. (1996). Empirical evidence on the corporate use of derivatives. Financial Management, (Summer), 5–13. Berkman, H., Bradbury, M., Hancockc, P., & Innes, C. (2002). Derivative financial instrument use in Australia. Accounting & Finance, 42(2), 97-109. Bodnar, G., & Gentry, W, M. (1993). Exchange rate exposure and industry characteristics: Evidence from Canada, Japan and the USA. Journal of International Money and Finance, 12, 29–45. Burgman, T, A. (1996). An Empirical Examination of Multinational Corporate Capital Structure. Journal of Internaional Business Studies, 27(3), pp.553-570. Chen, Charles J.R, Agnes Cheng, C.S, He, J., and Kim, J. (1997). "An Investigation of the Relationship Between International Activities and Capital Structure," Journal of International Business Studies, 28(3), pp.563-577. Chiang, Y. C., and Lin, H. J. (2005). The Use of Foreign Currency Derivatives and Foreign-Denominated Debts to Reduce Exposure to Exchange Rate Fluctuations. International Journal of Management, Vol. 22, No. 4, pp. 598-605. Chow, E., and Chen, H. (1998). The determinants of foreign exchange rate exposure: Evidence on Japanese firms. Pacific-Basin Finance Journal, 6, 153-174. Copeland, T. E., & Joshi. (1996). Why Derivatives Don’t Reduce FX Risk. McKinsey Quarterly, Vol. 1, pp. 66-79. Dominguez, K., & Tesar, L. (2006). Exchange rate exposure. Journal of International Economics, 68(1), 188-218. Froot, K., Scharfstein, D. S., & Stein J. C. (1993). Risk management: Coordinating corporate investment and financing policies. Journal of Finance, Vol. 48, pp. 1629-59. Guay, W. (1999). The impact of derivatives on firm risk: An empirical examination of new derivative users. Journal of Accounting & Economics, 26(1-3), 319-351. Guay, W., & Kothari, S. P. (2003). How much do firms hedge with derivatives. Journal of Financial Economics, 70, 423-461. Hagelin, N. & Pramborg, B. (2004). Hedging Foreign Exchange Exposure: Risk Reduction from

Page | 22
Transaction and Translation Hedging. Journal of International Financial Management and Accounting, Vol.15, No. 1, pp. 1-20. He, J. & Ng, L. K. (1998). The Foreign Exchange Exposure of Japanese Multinational Corporations. Journal of Finance 53, pp. 733–753. Hentschel, L. and Kothari, S.P. (2001). Are corporations or taking risks with derivatives?. Journal of Financial and Quantitative Analysis, Vol. 36, No. 1, March, pp. 93-118. Kirschner, L. (2009). The Power of a Dollar. Risk Management (00355593), 56(3), 76-80. Jorion, P. (1990). The exchange-rate exposure of U.S. multinationals. Journal of Business, 63(3), 331.
Jorion, P. (1991). The pricing of exchange rate risk in the stock market. Journal of Financial and Quantitative Analysis, 26, 363–376.
Melvin, M., and Taylor, M. P. (2009). The Crisis in the Foreign Exchange Market. CESifo Working Paper Series No. 2707. Available at SSRN: http://ssrn.com/abstract=1437408. Nance, D. R., Smith., Clifford, & Smithson, C, W. (1993). On the determinants of corporate hedging. The Journal of Finance, Vol. 48, No. 1, pp. 267-284. Nguyen, H. & Faff, R.W. (2002). On the determinants of derivative usage by Australian Companies. Australian Journal of Management, Vol. 27, No. 1, pp. 1-24. Nguyen, H. & Faff, R.W. (2003). Can the use of foreign currency derivatives explain variations in foreign exchange exposure? Evidence from Australian companies. Journal of Multinational Financial Management, Vol. 13, No. 3, pp. 193-215. Nguyen, H., Faff, R.W, & Marshall, A. (2006). Exchange rate exposure, foreign currency derivatives and the introduction of the euro: French evidence. International Review of Economics and Finance. 15, 184 – 201. Shin, H. & Soenen, L. (1999). Exposure to currency risk by U.S. multinational corporations. Journal of Multinational Financial Management , Vol. 9, 195-207.
Page | 23
Table 1: Exchange rate exposure of Australian resource firms Panel A reports the firm exposure to FX risk. FX exposure of all firms is estimated using the following regression:
+ + + (1)
Pre-crisis and during crisis exposure is estimated using the following regression:
+ + + + + (2)
where is the monthly continuously stock returns of firm i; is the monthly return on the ASX All Ordinaries Index. is the monthly fluctuation of the exchange rate of AUD/USD. ( ) is a dummy variable set equal to unity if an observation is made before (during) the global financial crisis in Dec 2007 and zero otherwise. Data used in the estimations cover the period Jan 2006- Dec 2009. Panel B reports the results for a test of difference in mean exposure between FCD users and non-users.
Panel A: Descriptive statistics of exchange rate exposure
Whole period Jan 06 - Dec 09
Before crisis Jan 06 - Dec 07
During crisis Jan 08 - Dec 09
Mean 1.0095 0.9521 1.0342 Median 1.0302 0.8402 0.9775 SD 0.8133 1.1639 0.8748 Max 2.8682 4.3430 3.3273 Min -0.9614 -1.3571 -1.0828 No of positive cases 89 75 85 No of significant cases 53 14 43 No of negative cases 8 22 12 No of significant cases 2 0 1 Total no of significant cases 55 14 44 % of significant cases 56.70% 14.43% 45.36%
Panel B: Mean exposure between FCD users and non-users Whole period
FCD users (n=71)
Non-users (n=123)
p-value
Mean exposure 0.7131 1.1548 0.0037 Before crisis
FCD users (n=36)
Non-users (n=61)
p-value
Mean exposure 0.5950 1.1628 0.0912 During crisis
FCD users (n=35)
Non-users (n=62)
p-value
Mean exposure 0.8345 1.1470 0.0470

Page | 24
Table 2: Descriptive statistics of sample firms Table 2 presents descriptive statistics for our sample firms in a pre-crisis and a during crisis period. FCD stands for foreign currency derivatives. FCD/TA is the notional amount of foreign currency derivative contracts scaled by total assets. FCD/FS is the notional amount of foreign currency derivative contracts scaled by foreign sales. TOTA is total assets. SALES is total sales. LEV is leverage: the ratio of total debt to total equity. LIQ is the liquidity: the ratio of cash flow to total assets. PE is price per earnings ratio. FORS is total foreign sales.
Panel A: Foreign currency derivatives usage in each individual year 2006 2007 2008 2009
Number of FCD users 25 32 32 28 Number of FCD non-users 72 65 65 69
FCD/TA - Mean FCD/TA - Median
3.14% 0.46%
3.36% 1.08%
8.60% 1.83%
5.80% 1.37%
FCD/FS - Mean FCD/FS - Median
1.87% 0.05%
2.14% 0.03%
13.80% 0.15%
3.97% 0.02%
Panel B: Financial characteristics of sample firms User of FCD Non-user of FCD p-value
Mean SD Mean SD Whole period (06-09) lNTOTA (log total asset) 6.9777 1.7834 4.5381 1.9490 0.0000 lNSALES (log total sales) 6.0692 2.7143 2.0268 3.4409 0.0000 LEV (gearing ratio) 0.5379 0.6221 0.2283 3.2627 0.3093 LIQ (liquidity ratio) 0.1903 0.6504 0.6158 4.7000 0.3305 PE (PE ratio) 21.3306 100.4439 -18.4676 88.8793 0.0047 lNFORS (log foreign sales) 5.5525 2.9418 1.8871 3.2707 0.0000
Pre-crisis (06-07) lNTOTA (log total asset) 6.8220 1.7589 4.0824 2.0256 0.0000 lNSALES (log total sales) 5.8282 2.9956 1.8087 3.3892 0.0000 LEV (gearing ratio) 0.6472 0.7644 0.5176 2.3889 0.6892 LIQ (liquidity ratio) 0.1733 0.4166 0.8971 6.5006 0.4027 PE (PE ratio) 10.2193 56.4631 -37.3152 88.4367 0.0047 lNFORS (log foreign sales) 3.4410 3.6562 0.5620 2.6466 0.0135
During crisis (08-09) lNTOTA (log total asset) 7.1257 1.8086 5.0041 1.7559 0.0000 lNSALES (log total sales) 6.2981 2.4203 2.2498 3.4914 0.0000 LEV (gearing ratio) 0.4342 0.4288 0.2818 0.5925 0.0752 LIQ (liquidity ratio) 0.2065 0.8163 0.3282 1.2121 0.4798 PE (PE ratio) 32.7593 131.2418 0.0761 86.0318 0.1423 lNFORS (log foreign sales) 3.6795 3.7950 0.6712 3.1227 0.0001
Page | 25
Table 3: The use of foreign currency derivatives in reducing exchange rate exposure This table presents the results of the following equations:
+ + (3)
+ * + * + (4)
+ + (5)
+ * + * + (6)
where is the raw exchange rate coefficient estimated from equation (1), USE is the dummy variable taking a value of unity if a firm uses FCD in a financial year and zero otherwise. ( ) is a dummy variable set equal to unity if an observation is made before (during) the global financial crisis in Dec 2007 and zero otherwise. EXTENT is the total notional amount of foreign currency derivatives contracts scaled by total assets and foreign sales. Equation (3) and (5) estimate the exchange rate exposure and the use and extent of FCD as in whole period without any year dummy. Panel A reports the exchange rate exposure and the use of FCD. Panel B and C reports the exchange rate exposure and the extent of FCD usage. T-statistics are shown in parentheses.
Panel A: Exchange rate exposure and the use of FCD Whole period Pre and during crisis
Constant 1.1548a 1.1548a (12.7066) (12.7067)
USE (FCD) -0.4418a (-2.9405)
FCD (pre crisis) -0.5598a (-2.9310)
FCD (during crisis) -0.3203c (-1.6589)
R-squared 0.0431 0.0481
Panel B: Exchange rate exposure and the extent of FCD as measured by FCD/TA Constant 0.9928a 1.0140a
(12.8369) (12.9562) Extent (FCD/TA) 0.0222
(0.0158) FCD/TA (pre crisis) -5.9270
(-1.4510) FCD/TA (during crisis) 0.6692
(0.4587) R-squared 0.0000 0.0124
Panel C: Exchange rate exposure and the extent of FCD as measured by FCD/FS Constant 0.9973a 1.0395a
(13.2378) (13.7993) Extent (FCD/FS) -0.4839
(-0.6306) FCD/FS (pre crisis) -16.0173a
(-2.9641) FCD/FS (during crisis) -0.2484
(-0.3280) R-squared 0.0021 0.0445
a, b and c denoted significance at the 1, 5 and 10% levels, respectively.

Page | 26
Table 4: Cross-sectional analysis of exchange rate exposure This table reports the results of the following regressions:
+ + ∑ + (7)
+ * * ∑ * ∑ * + (8)
+ + ∑ + (9)
+ * * ∑ * ∑ * + (10)
where is the raw exchange rate coefficient estimated from equation (1), is the dummy variable taking a value of unity if a firm uses FCD in a financial year and zero otherwise. ( ) is a dummy variable set equal to unity if an observation is made before (during) the global financial crisis in Dec 2007 and zero otherwise. EXTENT is the total notional amount of foreign currency derivatives contracts scaled by total assets and foreign sales. is a vector of the independent variables. These variables comprise: lnsize, lev, liq and pe. Insize is total assets. Lev is leverage: the ratio of total debt to total equity. Liq is the liquidity: the ratio of cash flow to total assets. Pe is price per earnings ratio. Equations (7) and (9) estimate the exchange rate exposure and the use and extent of FCD as in whole period without any year dummy. Panel A reports the exchange rate exposure and the use of FCD. Panel B and C reports the exchange rate exposure and the extent of FCD usage. T-statistics are shown in parentheses.
Panel A: Exchange rate exposure and the use of FCD
Whole period Pre and during crisis Constant 1.6595a 1.7228a
(8.1261) (8.1740) USE (FCD) -0.2184
(-1.2610) FCD (pre crisis) -0.1990
(-0.7767) FCD (during crisis) -0.1291
(-0.5422) LNSIZE -0.1161a
(-2.8553) LNSIZE (pre crisis) -0.1548a
(-3.1528) LNSIZE (during crisis) -0.1001b
(-2.2136) LEV 0.0948
(1.4633) LEV (pre crisis) 0.1298c
(1.8742) LEV (during crisis) -0.0638
(-0.3146) LIQ -0.0316
(-1.2186) LIQ (pre crisis) -0.0283
(-1.0806) LIQ (during crisis) -0.2017
(-1.5624) a, b and c denoted significance at the 1, 5 and 10% levels, respectively.

Page | 27
Table 4 - Continued
Panel A: Exchange rate exposure and the use of FCD
Whole period Pre and during crisis PE 0.0002
(0.2283) PE (pre crisis) -0.0005
(-0.3532) PE (during crisis) 0.0002
(0.1912) R-squared 0.0870 0.1127
a, b and c denoted significance at the 1, 5 and 10% levels, respectively.
Panel B: Exchange rate exposure and the extent of FCD as measured by FCD/TA
Whole period Pre and during crisis
Constant 1.7053a 1.7601a (8.4661) (8.4888)
Extent (FCD/TA) 0.7998 (0.5779)
FCD/TA (pre crisis) -1.6936 (-0.3926)
FCD/TA (during crisis) 1.2094 (0.8122)
LNSIZE -0.1429a (-3.9608)
LNSIZE (pre crisis) -0.1749a (-4.1702)
LNSIZE (during crisis) -0.1194a (-2.9349)
LEV 0.1022 (1.5723)
LEV (pre crisis) 0.1345c (1.9493)
LEV (during crisis) -0.0482 (-0.2369)
LIQ -0.0341 (-1.3136)
LIQ (pre crisis) -0.0297 (-1.1361)
LIQ (during crisis) -0.2252c (-1.7137)
PE 0.0000 (-0.0171)
PE (pre crisis) -0.0006 (-0.4832)
PE (during crisis) 0.0001 (0.0578)
R-squared 0.0809 0.1123

Page | 28
Table 4 – Continued
Panel C: Exchange rate exposure and the extent of FCD as measured by FCD/FS
Whole period Pre and during crisis
Constant 1.7030a 1.7159a (8.4158) (8.2584)
Extent (FCD/FS) -0.0479(-0.0635)
FCD/FS (pre crisis) -10.4258c (-1.7349)
FCD/FS (during crisis) -0.0909 (-0.1199)
LNSIZE -0.1401a (-3.8558)
LNSIZE (pre crisis) -0.1545a (-3.6152)
LNSIZE (during crisis) -0.1068a (-2.6262)
LEV 0.0959 (1.4688)
LEV (pre crisis) 0.1281c (1.8643)
LEV (during crisis) -0.0722 (-0.3568)
LIQ -0.0334 (-1.2836)
LIQ (pre crisis) -0.0281 (-1.0786)
LIQ (during crisis) -0.1992 (-1.5499)
PE 0.0001 (0.1008)
PE (pre crisis) 0.0000 (0.0310)
PE (during crisis) 0.0001 (0.1298)
R-squared 0.0786 0.1225 a, b and c denoted significance at the 1, 5 and 10% levels, respectively.

Page | 29
Table 5: Descriptive statistics of 1st portfolio and 2nd portfolio firms
Table 5 presents descriptive statistics for the first top half 49 sample firms (1st portfolio) and the second half 48 sample firms (2nd portfolio) in terms of their market capitalization pre-crisis and during crisis. FCD stands for foreign currency derivatives. FCD/TA is the notional amount of foreign currency derivative contracts scaled by total assets. FCD/FS is the notional amount of foreign currency derivative contracts scaled by foreign sales. EXP stands for foreign exchange rate exposure.
Panel A: Foreign currency derivatives usage of 1st portfolio Whole period
06-09 Before crisis
06-07 During crisis
08-09 Number of FCD users 53 28 25 Number of FCD non-users 45 21 24
FCD/TA - Mean 4.56% 2.74% 6.59% FCD/FS - Mean 5.60% 1.53% 9.99% EXP - Mean 0.90 0.81 0.99
Panel B: Foreign currency derivatives usage of 2nd portfolio Whole period
06-09 Before crisis
06-07 During crisis
08-09 Number of FCD users 18 8 10 Number of FCD non-users 78 40 38
FCD/TA - Mean 3.90% 2.01% 5.42% FCD/FS - Mean 2.31% 1.92% 2.63% EXP - Mean 1.09 1.10 1.08

Page | 30
Table 6: Extended Cross-sectional analysis of exchange rate exposure by firm market capitalization Table 6 presents the results of the first top half 49 sample firms (1st portfolio) and the second half 48 sample firms (2nd portfolio) according to their market capitalization.
This table reports the results of the following regressions:
+ + ∑ + (7)
+ * * ∑ * ∑ * + (8)
+ + ∑ + (9)
+ * * ∑ * ∑ * + (10)
where is the raw exchange rate coefficient estimated from equation (1), is the dummy variable taking a value of unity if a firm uses FCD in a financial year and zero otherwise. ( ) is a dummy variable set equal to unity if an observation is made before (during) the global financial crisis in Dec 2007 and zero otherwise. EXTENT is the total notional amount of foreign currency derivatives contracts scaled by total assets and foreign sales. is a vector of the independent variables. These variables comprise: lnsize, lev, liq and pe. Insize is total assets. Lev is leverage: the ratio of total debt to total equity. Liq is the liquidity: the ratio of cash flow to total assets. Pe is price per earnings ratio. Equations (7) and (9) estimate the exchange rate exposure and the use and extent of FCD as in whole period without any year dummy. Panel A and D reports the exchange rate exposure and the use of FCD of 1st and 2nd portfolio. Panel B and C; E and F reports the exchange rate exposure and the extent of FCD of 1st and 2nd portfolio, respectively. T-statistics are shown in parentheses.
Panel A: Cross-sectional analysis of 1st portfolio Whole period Pre and during crisis
Constant 1.9336a 2.1055a (4.0799) (4.1815)
USE (FCD) -0.2780 (-1.3046)
FCD (pre crisis) -0.1944 (-0.6238)
FCD (during crisis) -0.2333 (-0.7771)
R-squared 0.1366 0.1906
Panel B: Cross-sectional analysis of 1st portfolio measured by FCD/TA Constant 1.9578a 2.1050a
(4.1452) (4.2002) Extent (FCD/TA) 2.1675
(1.3669) FCD/TA (pre crisis) -0.5142
(-0.1105) FCD/TA (during crisis) 2.0237
(1.1903) R-squared 0.1382 0.1946
a, b and c denoted significance at the 1, 5 and 10% levels, respectively.16
16 The coefficients and the t-statistics of the control variables are not reported in Table 6 to conserve space.

Page | 31
Table 6 – Continued
Panel C: Cross-sectional analysis of 1st portfolio measured by FCD/FS Whole period Pre and during crisis
Constant 1.9636a 2.1056a -4.093 -4.0444
Extent (FCD/FS) 0.2364 -0.3148
FCD/FS (pre crisis) -1.5709 (-0.1813)
FCD/FS (during crisis) -0.0475 (-0.0626)
R-squared
0.1173
0.1774
Panel D: Cross-sectional analysis of 2nd portfolio Constant 1.5709a 1.6464a
-4.6724 -4.6538 USE (FCD) -0.2675
(-0.8578) FCD (pre crisis) -0.3667
(-0.7304) FCD (during crisis) -0.1906
(-0.4276) R-squared
0.0581
0.0757
Panel E: Cross-sectional analysis of 2nd portfolio measured by FCD/TA Constant 1.6428a 1.6927a
-5.0287 -4.9581 Extent (FCD/TA) -3.8402
(-1.3812) FCD/TA (pre crisis) -23.6061c
(-1.7334) FCD/TA (during crisis) -2.0903
(-0.6741) R-squared
0.0701
0.1045
Panel F: Cross-sectional analysis of 2nd portfolio measured by FCD/FS Constant 1.5967a 1.7050a
-5.0246 -5.1084 Extent (FCD/FS) -13.3067
(-2.6881) FCD/FS (pre crisis) -18.9076b
(-2.0431) FCD/FS (during crisis) -11.6100c
(-1.8539) R-squared 0.1209 0.1447 a, b and c denoted significance at the 1, 5 and 10% levels, respectively.


