
Excellence in Obstetrics A MULTI-SITE AHRQ DEMONSTRATION PROJECT Ann Hendrich, RN, PhD, F.A.A.N Vice...
16
Excellence in Obstetrics A MULTI-SITE AHRQ DEMONSTRATION PROJECT Ann Hendrich, RN, PhD, F.A.A.N Vice President, Clinical Excellence Operations Executive Director, Patient Safety Organization September 2011
-
Upload
reynard-mccarthy -
Category
Documents
-
view
214 -
download
0
Transcript of Excellence in Obstetrics A MULTI-SITE AHRQ DEMONSTRATION PROJECT Ann Hendrich, RN, PhD, F.A.A.N Vice...

Excellence in Obstetrics
A MULTI-SITE AHRQ DEMONSTRATION PROJECT
Ann Hendrich, RN, PhD, F.A.A.NVice President, Clinical Excellence Operations
Executive Director, Patient Safety OrganizationSeptember 2011

Ascension Health
We are the largest Catholic health system, the largest private not-for-profit system and the third largest system (based on revenues) in the United States, operating in 20 states and the District of Columbia.
Facilities and Staff Locations
500+ Acute Care Hospitals 70
Available Beds 17,836
Physicians 30,000
Care of Persons Who Are Poor and Community Benefit $1 Billion
Financial Information (FY10)
Total Assets $18 Billion
Operating Revenue $14.8 Billion
Operating Income $569 Million
Net Income $1.2 Billion
Investment $723 Million

3
Ascension Health’s Vision


The Business Case for Perinatal Safety
Potentially Preventable Birth Injury Events
• 77 Birth Injury Events were reported as Claims between 7/1/04 to 1/1/06.
• 52 (68%) of the 77 Birth Injuries were potentially preventable based upon clinical review.
Known Birth Injury Events 7/1/2004 to 1/1/2006
Total Events = 77
Other = 23 30%
Brachial Plexus = 13
17%
Death = 2330%
Neurological Injury = 18
23%
6

The Business Case for Perinatal Safety
Malpractice Cost Projections• 76,000 Deliveries Per Year
• Approximately 30% of Exposures (Risk Adjusted) are Related to OB
• FY07 Obstetric Malpractice Expense was $36 Million
7
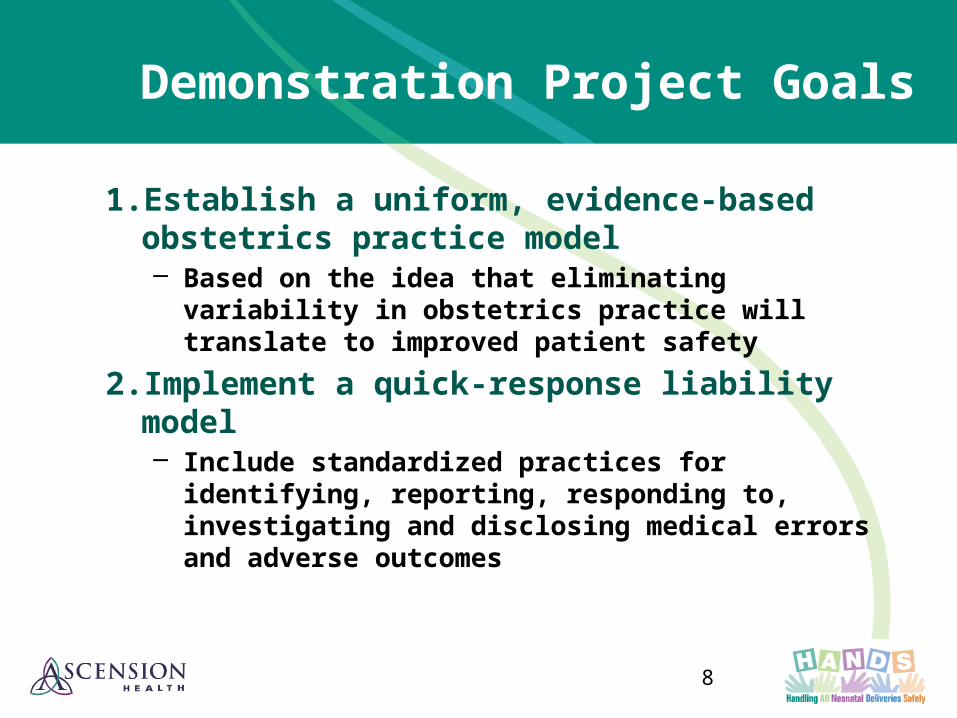
Demonstration Project Goals
1.Establish a uniform, evidence-based obstetrics practice model – Based on the idea that eliminating variability
in obstetrics practice will translate to improved patient safety
2.Implement a quick-response liability model– Include standardized practices for identifying,
reporting, responding to, investigating and disclosing medical errors and adverse outcomes
8

Demonstration Project Goals
3.Create the Ministry Intelligence Center (MIC)/OB Dashboard– IT infrastructure, portals, dashboards and
data warehouses – Provide target sites and central administration
with Key Performance Indicators – Allow ad hoc data queries and predictive
modeling capabilities
9
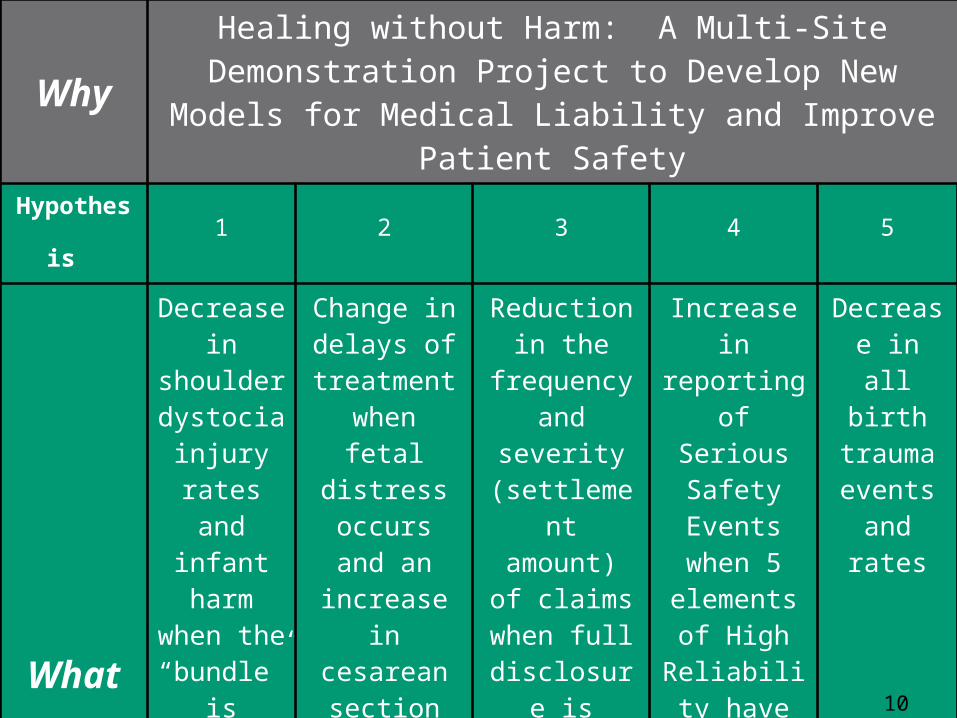
WhyHealing without Harm: A Multi-Site
Demonstration Project to Develop New Models for Medical Liability and Improve Patient Safety
Hypothe
sis 1 2 3 4 5
What
Decrease in
shoulder dystocia
injury rates and
infant harm
when the “bundle”
is introduce
d
Change in delays of treatment when fetal
distress occurs and an increase in cesarean
section effectivene
ss (necessity
and timeliness) when the protocol
guidelines are followed
Reduction in the
frequency and
severity (settlement amount) of
claims when full disclosure
is implement
ed
Increase in reporting of Serious
Safety Events when 5
elements of High
Reliability have been adopted
Decrease in all birth
trauma events
and rates
10

Healing without Harm – Year OneMajor Milestones
• 593 nurses/physicians trained on multiple interventions
• 5,800+ mothers consented between January-Septmeber 2011
• Average Consent Enrollment Rate at Five Sites– 88%
• Race/ethnicity breakdown of consented mothers– 59% White – 20% Black– 9% Hispanic– 2% Asian/Pacific– 2% Other– 7% Unknown

Healing without Harm – Year One Interventions for Clinical & Cultural
Change• Electronic Fetal Monitoring (EFM) e-learning
module– 202 physicians and 321 nurses trained
• Shoulder Dystocia Bundle and Training– Shoulder dystocia bundle tool developed
– 224 physicians and 349 nurses trained
• TeamSTEPPSTM and simulation training with hi-fidelity birthing simulators– 243 physicians and 414 nurses trained
• Coordinated communication (disclosure) training – 302 clinicians trained
• Cause Analysis training– 76 clinicians trained

Healing without Harm – Year One Interventions for Clinical & Cultural
Change
0%
10%
20%
30%
40%
50%
60%
70%
80%
90%
100%
Training Rates - Aggregate
EFM training - Physicians
EFM training - Nurses
Shoulder Dystocia training - Physicians
Shoulder Dystocia training - Nurses
Simulation Training - Physicians
Simulation Training - Nurses
Cause Analysis Training
Disclosure Training

Event Response Model
Obstetric Event Response Team Model
Risk Manager
Nurse
Coder
Neonate Provider
Obstetrician
System Reporting and Management
14
Wood-D630
This slide seems out of place. The following slides don't flow for me. I may be missing something.

1/0
6-1
2/0
6
2/0
6-1
/07
3/0
6-2
/07
4/0
6-3
/07
5/0
6-4
/07
6/0
6-5
/07
7/0
6-6
/07
8/0
6-7
/07
9/0
6-8
/07
10
/06
-9/0
7
11
/06
-10
/07
12
/06
-11
/07
1/0
7-1
2/0
7
2/0
7-1
/08
3/0
7-2
/08
4/0
7-3
/08
5/0
7-4
/08
6/0
7-5
/08
7/0
7-6
/08
8/0
7-7
/08
9/0
7-8
/08
10
/07
-9/0
8
11
/07
-10
/08
12
/07
-11
/08
1/0
8-1
2/0
8
2/0
8-1
/09
3/0
8-2
/09
4/0
8-3
/09
5/0
8-4
/09
6/0
8-5
/09
7/0
8-6
/09
8/0
8-7
/09
9/0
8-8
/09
10
/08
-9/0
9
11
/08
-10
/09
12
/08
-11
/09
1/0
9-1
2/0
9
2/0
9-1
/10
3/0
9-2
/10
4/0
9-3
/10
5/0
9-4
/10
6/0
9-5
/10
7/0
9-6
/10
8/0
9-7
/10
9/0
9-8
/10
10
/09
-9/1
0
11
/09
-10
/10
12
/09
-11
/10
1/1
0-1
2/1
0
2/1
0-1
/11
3/1
0-2
/11
4/1
0-3
/11
5/1
0-4
/11
6/1
0-5
/11
7/1
0-6
/11
0
1
2
3
4
5
6
7
8
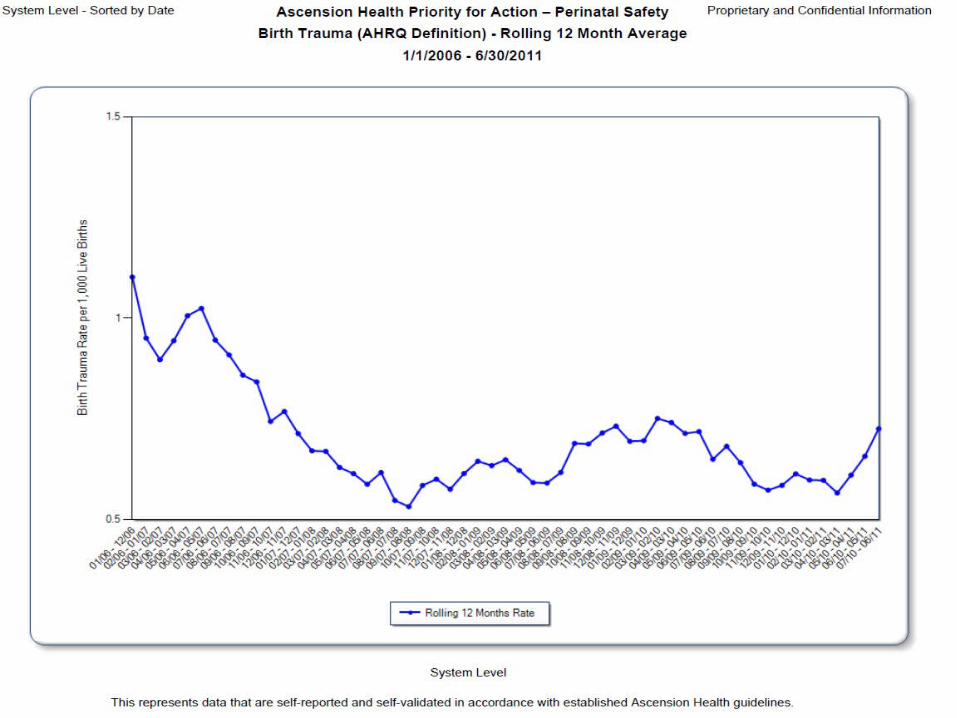
AHRQ HANDS Perinatal Safety PerformanceBirth Trauma Rate
Site 1 Site 2 Site 3 Site 4 Site 5
Rolling 12-Month Period
Rat
e p
er 1
,000
Liv
e B
irth
s
July 2010Grant Start
1/0
6-1
2/0
6
2/0
6-1
/07
3/0
6-2
/07
4/0
6-3
/07
5/0
6-4
/07
6/0
6-5
/07
7/0
6-6
/07
8/0
6-7
/07
9/0
6-8
/07
10
/06
-9/0
7
11
/06
-10
/07
12
/06
-11
/07
1/0
7-1
2/0
7
2/0
7-1
/08
3/0
7-2
/08
4/0
7-3
/08
5/0
7-4
/08
6/0
7-5
/08
7/0
7-6
/08
8/0
7-7
/08
9/0
7-8
/08
10
/07
-9/0
8
11
/07
-10
/08
12
/07
-11
/08
1/0
8-1
2/0
8
2/0
8-1
/09
3/0
8-2
/09
4/0
8-3
/09
5/0
8-4
/09
6/0
8-5
/09
7/0
8-6
/09
8/0
8-7
/09
9/0
8-8
/09
10
/08
-9/0
9
11
/08
-10
/09
12
/08
-11
/09
1/0
9-1
2/0
9
2/0
9-1
/10
3/0
9-2
/10
4/0
9-3
/10
5/0
9-4
/10
6/0
9-5
/10
7/0
9-6
/10
8/0
9-7
/10
9/0
9-8
/10
10
/09
-9/1
0
11
/09
-10
/10
12
/09
-11
/10
1/1
0-1
2/1
0
2/1
0-1
/11
3/1
0-2
/11
4/1
0-3
/11
5/1
0-4
/11
6/1
0-5
/11
7/1
0-6
/11
0.0
0.5
1.0
1.5
2.0
2.5
3.0
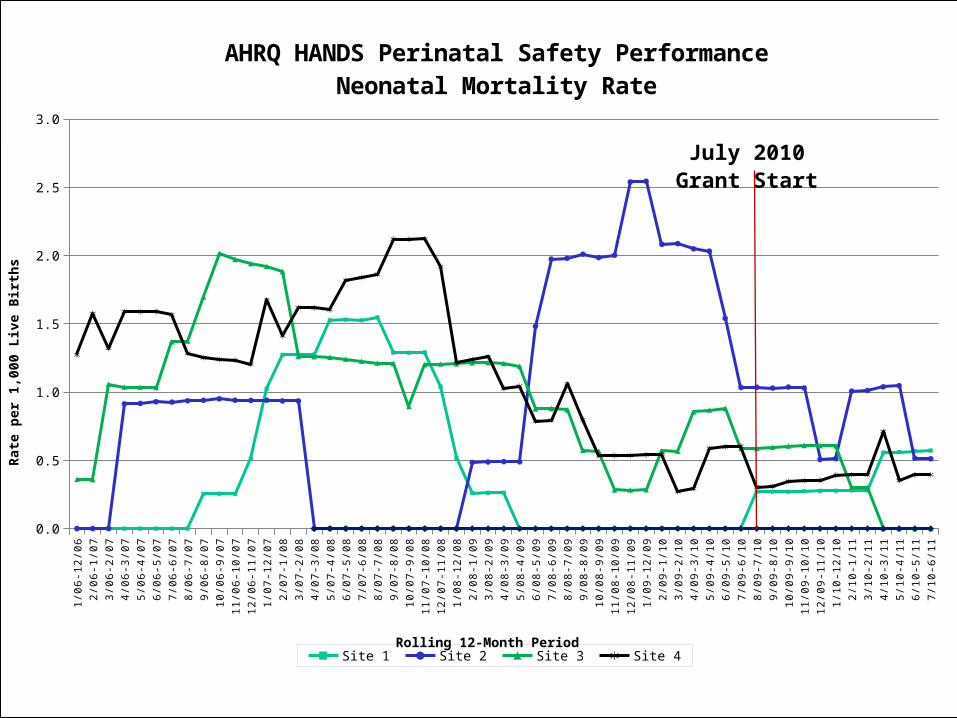
AHRQ HANDS Perinatal Safety PerformanceNeonatal Mortality Rate
Site 1 Site 2 Site 3 Site 4 Site 5
Rolling 12-Month Period
Rat
e p
er 1
,000
Liv
e B
irth
s
July 2010Grant Start


