Excellence In Access Let The Data Lead The Way Hfma Philly 2 16 10
29
Achieving Healthcare’s True Return Apollo Health Street partners with hospitals and healthcare organizations across the country to achieve healthcare’s True Return – the financial strength to offer excellent patient care today and tomorrow. Achieving Healthcare’s True Return Presented by Michael S. Friedberg, FACHE, CHAM Associate Vice President, Patient Access Services Excellence in Access: Let the Data Lead the Way
-
Upload
mfriedberg -
Category
Documents
-
view
492 -
download
1
Transcript of Excellence In Access Let The Data Lead The Way Hfma Philly 2 16 10

Achieving Healthcare’s True Return
Apollo Health Street partners with hospitals and healthcare organizations across the country to achieve healthcare’s True Return – the financial strength to offer excellent patient care today and tomorrow.
Achieving Healthcare’s True Return
Presented by
Michael S. Friedberg, FACHE, CHAMAssociate Vice President, Patient Access Services
Excellence in Access:Let the Data Lead the Way

What is the Revenue Cycle?
Excellence in Access: Let the Data Lead the Way | Page 2

What is the Revenue Cycle?
Excellence in Access: Let the Data Lead the Way | Page 3

Background
• Hospitals can benchmark their revenue cycle
performance against other facilities using HARA and
other benchmark data
• The most effective method to identify areas of opportunity
within your revenue cycle is to manage your trends
through Key Performance Indicators (KPI)
Excellence in Access: Let the Data Lead the Way | Page 4
Excellence in Access: Let the Data Lead the Way | Page 5
Proactive Reactive
Excellence in Access: Let the Data Lead the Way | Page 6
What are KPI’s?Key Performance Indicators are the
metrics that illustrate how to improve
your revenue cycle
Why We Use KPI’s?
• Keep a record – tell a story
• Proactive – not reactive approach
• Manage trends – not single period results
• Illustrates relationship between certain KPI’s
• Can establish realistic goals based upon real life trends
• Fosters accountability
Excellence in Access: Let the Data Lead the Way | Page 7

Accountability
Excellence in Access: Let the Data Lead the Way | Page 8

How Do You Get Started?
• Keep a record – tell a story
• Begin with a Daily Dashboard – snapshot of your department
• Assign ownership
• If it is important …measure it
• If you decide to measure it – manage what you measure
• Use as a tool at revenue cycle meetings
Excellence in Access: Let the Data Lead the Way | Page 9

Daily Dashboard Components
• Mix of indicators and goals
• It’s up to you!
• Easy to obtain
Excellence in Access: Let the Data Lead the Way | Page 10

Daily Dashboard: Example Part 1
DateDaily Census @ 9:00 am
ER HoldsQA Quality Score MTD
Failed
Bill $Staff Call Outs
POS Cash POS Cash MTD
5/1/06
5/2/06
5/3/06
5/4/06
Excellence in Access: Let the Data Lead the Way | Page 11

Daily Dashboard: Example Part 2
DatePOS Cash as a % of Goal
Complaints to Administration
MPI Duplicates Created
Patients in House >30 Days
% of Eligible Patients Scheduled
5/1/06
5/2/06
5/3/06
5/4/06
Excellence in Access: Let the Data Lead the Way | Page 12
Flexibility
• New Jersey clients and charity care
• Pennsylvania client and subscriber name
• New York client and UT authorizations
Excellence in Access: Let the Data Lead the Way | Page 13

Excellence in Access: Let the Data Lead the Way | Page 14
Drilling further down
Monthly Denials
• Overall denials
• Clinical denials by reason
• Technical denials by reason
• Denials as a % of net revenue
• Must determine if denials are included in aged accounts
receivable – communicate with the business office
Excellence in Access: Let the Data Lead the Way | Page 15

Bad Debt and Charity Care
• The uninsured is rising
• Measure as a % of total volume
• Monitor monthly
Excellence in Access: Let the Data Lead the Way | Page 16

Point of Service Collections
• CASH IS KING
• Increased co-pays and deductibles
• Now more than ever, hospitals must
focus on POS collections
• Track by month; by area
• Set goals
• The British are coming!
Excellence in Access: Let the Data Lead the Way | Page 17
Clean Claims %
• > 90% of claims are billed electronically
• Clean claim target 95% - 100%
• Claims with errors = manual intervention
• Manual intervention = payment delays or incorrect payment and a
higher cost to collect
• Drill down to reasons for manual intervention
Excellence in Access: Let the Data Lead the Way | Page 18
Vendor Performance
• Successful revenue cycles
utilize a combination of internal
and external resources
• Must manage outsourcing
partners performance
Excellence in Access: Let the Data Lead the Way | Page 19

Benchmarking
• Standard by which something can be measured or judged
• Where can we get data?
• The Access Dilemma
• Why benchmark?
Excellence in Access: Let the Data Lead the Way | Page 20

Scheduling Benchmarking
Excellence in Access: Let the Data Lead the Way | Page 21
Item Standard
Scheduling rate of patients eligible for scheduling 100%
Scheduling for ambulatory surgery patients 100%
Scheduling for high dollar outpatients 100%
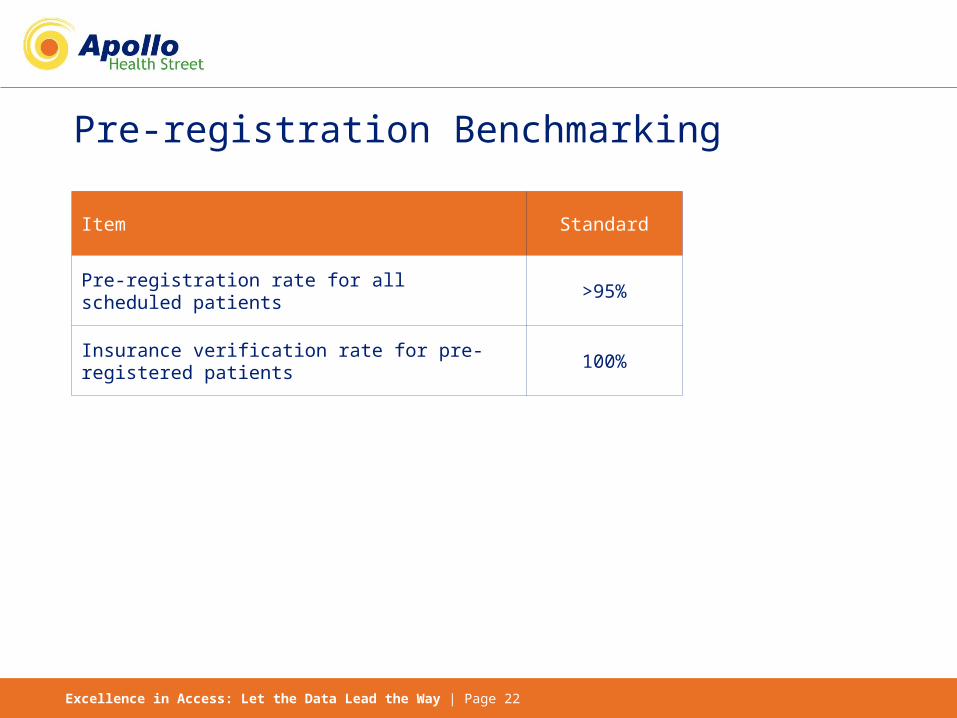
Pre-registration Benchmarking
Excellence in Access: Let the Data Lead the Way | Page 22
Item Standard
Pre-registration rate for all scheduled patients >95%
Insurance verification rate for pre-registered patients 100%

Registration Benchmarking
Excellence in Access: Let the Data Lead the Way | Page 23
Item Standard
Average registration interview duration new patient 15 minutes
Average registration interview duration repeat patient
< 5 minutes
Average patient wait time to be registered < 10 minutes
Maximum wait time for any patient 15 minutes
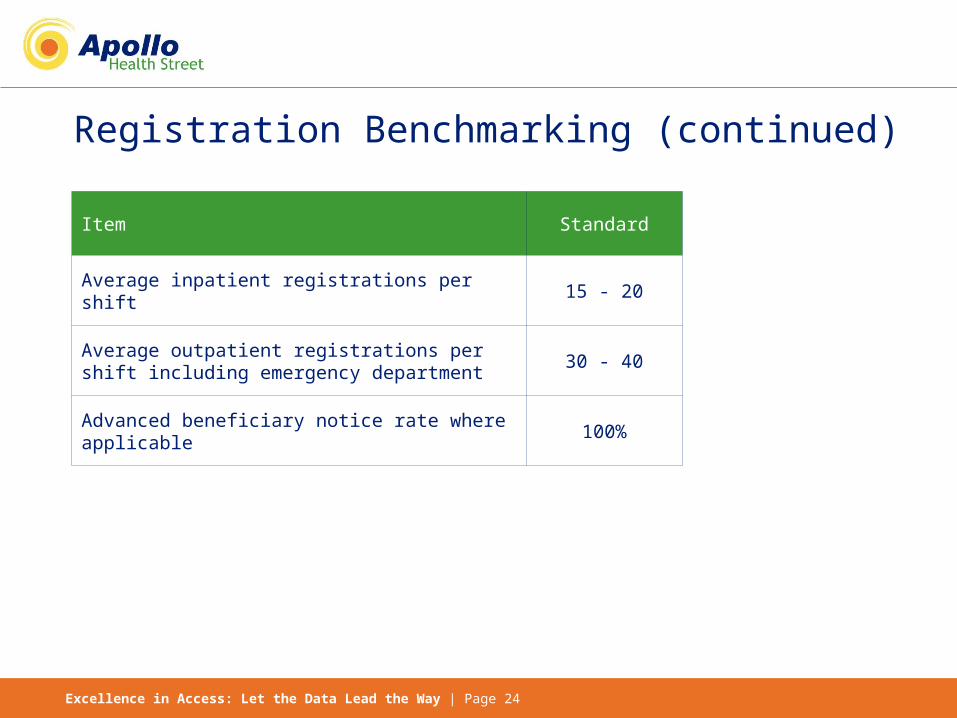
Registration Benchmarking (continued)
Excellence in Access: Let the Data Lead the Way | Page 24
Item Standard
Average inpatient registrations per shift 15 - 20
Average outpatient registrations per shift including emergency department
30 - 40
Advanced beneficiary notice rate where applicable 100%

Denials Benchmarking
Excellence in Access: Let the Data Lead the Way | Page 25
Item Standard
Overall denial rate < 4%
Technical denial rate < 3%
Eligibility denials rate < 75%
Appeals overturn rate 40% - 60%

Benchmarking Sources
• HFM article by David Hammer July 2005
• Aspen Publishing Registration Newsletter 2006
• Local HFMA chapters
• Local NAHAM chapters
Excellence in Access: Let the Data Lead the Way | Page 26

Closing Thoughts
• KPI implementation may be a cultural change for some
• KPI’s do create a culture of accountability – but also reward
• KPI’s do simplify the nature of our work
• Investment in the success of your revenue cycle
Excellence in Access: Let the Data Lead the Way | Page 27

Shameless Self-promotion
Staff Competency in Patient Access: Tools, Tests and Tips for Building a Successful Team
1.877.727.1728
www.hcmarketplace.com
Excellence in Access: Let the Data Lead the Way | Page 28

Achieving Healthcare’s True Return
Michael S. Friedberg, FACHE, CHAM
Associate Vice President, Patient Access Services
Office: 973.233.7644
Mobile: 732.809.0260
Email: [email protected]
Learn more at www.apollohealthstreet.com
Apollo Health Street partners with healthcare
organizations across the country to achieve
healthcare’s True Return – the financial
strength you need to offer excellent patient
care today and tomorrow.