
EXCEL 2013 INSTRUCTIONS - Cengage · 4 Excel 2013 Instructions NEL Chapter 10: Introduction to...
7
1 Excel 2013 Instructions NEL Chapter 2: Graphical and Tabular Descriptive Techniques PAGE 15 INSTRUCTIONS 1. Type or import the data into one or more col- umns. (Open Xm02-01.) 2. Activate any empty cell and type 5 COUNTIF ([Input range], [Criteria]) Input range is the cells that contain the data. In this example, the range is B1:B286. The criteria are the codes you want to count: (1) (2) (3) (4) (5) (6) (7). To count the number of 1s (Molson Canadian), type 5 COUNTIF (B1:B286, 1) and the frequency will appear in the dialogue box. Change the criteria to produce the frequency of the other categories. *PAGE 17 INSTRUCTIONS 1. After creating the frequency distribution, high- light the column of frequencies. 2. For a bar chart, click Insert. In the group of icons named Charts, choose Insert Column Chart, then the first 2-D Column. 3. Click inside the box containing the bar chart. A large “+” sign will appear at the top right of it. Click on it to make changes to the chart. We removed the Gridlines and Chart Title. Clicking on Data Labels adds the height of each column and clicking Axis Titles permits you to label the axes. 4. For a pie chart, click Pie and Chart Tools to edit the graph. *PAGE 21 INSTRUCTIONS 1. Type or import the data into one column. (Open Xm02-02.) In another column, type the upper limits of the class intervals. Excel calls them bins. (You can put any name in the first row; we typed “Bills.”) 2. Click Data, Data Analysis, and Histogram. If Data Analysis does not appear in the menu box, see Web site Appendix A1. 3. Specify the Input Range (A1:A201) and the Bin Range. Click Labels if the first row contains names. Click Chart Output and OK. To remove the gaps, place the cursor over one of the rectangles and click the right button of the mouse. With the left button, click Format Data Series . . . . Move the pointer to Gap Width and use the slider to change the number from 150 to 0. *PAGE 24 INSTRUCTIONS 1. Type or import the data into one column. (Open Xm02-02.) 2. Click Data, Data Analysis Plus, and Stem-and- Leaf Display. 3. Specify the Input Range (A1:A201). Click one of the values of Increment (the increment is the difference between stems) (10). *PAGE 26 INSTRUCTIONS 1. Type or import the data into one column. (Open Xm02-03.) 2. Highlight the column of data. Click Insert. In the group of icons named Charts, choose Insert Line Chart and the first 2-D Line. Under Chart Tools you can make whatever changes you wish. You can draw two or more line charts (for two or more variables) by highlighting all columns of data you wish to graph. *PAGE 31 INSTRUCTIONS 1. Type or import the data into two adjacent col- umns. Store variable X in the first column and variable Y in the next column. (Open Xm02-05.) 2. Highlight the column of data. Click Insert. In the group of icons named Charts, choose Insert Scatter (X,Y) or Bubble Chart, then Scatter. 3. To make cosmetic changes, use the Design and Format tools under Chart Tools. EXCEL 2013 INSTRUCTIONS
-
Upload
nguyenmien -
Category
Documents
-
view
216 -
download
3
Transcript of EXCEL 2013 INSTRUCTIONS - Cengage · 4 Excel 2013 Instructions NEL Chapter 10: Introduction to...

1E x c e l 2 0 1 3 I n s t r u c t i o n sNEL
Chapter 2: Graphical and Tabular Descriptive TechniquesPAGE 15 INSTRUCTIONS
1. Type or import the data into one or more col-umns. (Open Xm02-01.)
2. Activate any empty cell and type
5 COUNTIF ([Input range], [Criteria])
Input range is the cells that contain the data. In this example, the range is B1:B286. The criteria are the codes you want to count: (1) (2) (3) (4) (5) (6) (7). To count the number of 1s (Molson Canadian), type
5 COUNTIF (B1:B286, 1)
and the frequency will appear in the dialogue box. Change the criteria to produce the frequency of the other categories.
*PAGE 17 INSTRUCTIONS
1. After creating the frequency distribution, high-light the column of frequencies.
2. For a bar chart, click Insert. In the group of icons named Charts, choose Insert Column Chart, then the first 2-D Column.
3. Click inside the box containing the bar chart. A large “+” sign will appear at the top right of it. Click on it to make changes to the chart. We removed the Gridlines and Chart Title. Clicking on Data Labels adds the height of each column and clicking Axis Titles permits you to label the axes.
4. For a pie chart, click Pie and Chart Tools to edit the graph.
*PAGE 21 INSTRUCTIONS
1. Type or import the data into one column. (Open Xm02-02.) In another column, type the upper limits of the class intervals. Excel calls them bins. (You can put any name in the first row; we typed “Bills.”)
2. Click Data, Data Analysis, and Histogram. If Data Analysis does not appear in the menu box, see Web site Appendix A1.
3. Specify the Input Range (A1:A201) and the Bin Range. Click Labels if the first row contains names. Click Chart Output and OK.
To remove the gaps, place the cursor over one of the rectangles and click the right button of the mouse. With the left button, click Format Data Series . . . . Move the pointer to Gap Width and use the slider to change the number from 150 to 0.
*PAGE 24 INSTRUCTIONS
1. Type or import the data into one column. (Open Xm02-02.)
2. Click Data, Data Analysis Plus, and Stem-and-Leaf Display.
3. Specify the Input Range (A1:A201). Click one of the values of Increment (the increment is the difference between stems) (10).
*PAGE 26 INSTRUCTIONS
1. Type or import the data into one column. (Open Xm02-03.)
2. Highlight the column of data. Click Insert. In the group of icons named Charts, choose Insert Line Chart and the first 2-D Line. Under Chart Tools you can make whatever changes you wish.
You can draw two or more line charts (for two or more variables) by highlighting all columns of data you wish to graph.
*PAGE 31 INSTRUCTIONS
1. Type or import the data into two adjacent col-umns. Store variable X in the first column and variable Y in the next column. (Open Xm02-05.)
2. Highlight the column of data. Click Insert. In the group of icons named Charts, choose Insert Scatter (X,Y) or Bubble Chart, then Scatter.
3. To make cosmetic changes, use the Design and Format tools under Chart Tools.
EXCEL 2013 INSTRUCTIONS
Excel 2013 update.indd 1 2015-07-13 12:23 PM

E x c e l 2 0 1 3 I n s t r u c t i o n s2 NEL
Chapter 3: Numerical Descriptive TechniquesPAGE 41 INSTRUCTIONS (MEAN)
Type or import the data into one or more columns. (Open Xm02-02.) Type into any empty cell
5 AVERAGE ([Input range])
For Example 3.2, we would type into any cell
5 AVERAGE (A1:A201)
The active cell would store the mean as 43.5876.
MEDIAN
To calculate the median, substitute MEDIAN in place of AVERAGE in the instructions for the mean. The median is reported as 26.905.
MODEExcel reports that the mode is 0.
PAGE 42 INSTRUCTIONS
1. Type or import the data into one column. (Open Xm02-02.)
2. Click Data, Data Analysis, and Descriptive Statistics.
3. Specify the Input Range (A1:A201) and click Summary statistics.
*PAGE 45 INSTRUCTIONS
Follow the instructions to compute the mean (page 41), except type VAR instead of AVERAGE.
This gives the sample variance. If the population variance is desired, use the command VAR.P.
PAGE 49 INSTRUCTIONS
Follow the instructions for Descriptive Statistics (pages 42–43). In the dialogue box, click Kth Largest and type in the integer closest to n/4. Repeat for Kth Smallest, typing in the integer closest to n/4.
PAGE 51 INSTRUCTIONS
1. Type or import the data into one column or two or more adjacent columns. (Open Xm02-02.)
2. Click Add-Ins, Data Analysis Plus, and Box Plot.
3. Specify the Input Range (A1:A201).
A box plot will be created for each column of data that you have specified or highlighted.
Notice that the quartiles produced in the Box Plot are not exactly the same as those produced by Descriptive Statistics. The Box Plot command uses a slightly different method than the Descriptive Methods command.
*PAGE 55 INSTRUCTIONS
Type or import the data into two columns. (Open Xm02-05.) Type the following into any empty cell.
5 CORREL[Input range of one variable], [Input range of second variable])
In this example, we would enter
5 CORREL (A1:A13, B1:B13)
To calculate the covariance, replace CORREL with COVARIANCE.P (for population covariance) or COVARIANCE.S (for sample covariance). The abbreviated command COVAR defaults to popula-tion covariance.
Chapter 4: Data Collection and SamplingPAGE 65 INSTRUCTIONS
1. Click Data, Data Analysis, and Random Number Generation.
2. Specify the Number of Variables (1) and the Number of Random Numbers (50).
3. Select Uniform Distribution.
4. Specify the range of the uniform distribution (Parameters): 0 and 1.
5. Click OK. Column A will fill with 50 numbers that range between 0 and 1.
6. Multiply column A by 1,000 and store the prod-ucts in column B.
7. Make cell C1 active, and click fx, Math & Trig, ROUNDUP, and OK.
8. Specify the first number to be rounded. (B1)
9. Type the number of digits (decimal places) (0). Click OK.
10. Complete column C.
Excel 2013 update.indd 2 2015-07-13 12:23 PM

3E x c e l 2 0 1 3 I n s t r u c t i o n sNEL
Chapter 6: Random Variables and Discrete Probability DistributionsPAGE 99 INSTRUCTIONS
Type the following into any empty cell.
5BINOMDIST([x], [n], [p], [True] or [False])
Typing “True” calculates a cumulative probability, and typing “False” computes the probability of an individual value of X. For Example 6.4a, type
5BINOMDIST(0, 10, .2, False)
For Example 6.5, enter
5BINOMDIST(4, 10, .2, True)
*PAGE 102 INSTRUCTIONS
Type the following into any empty cell:
5POISSON([x], [m], [True] or [False])
We calculate the probability in Example 6.7 by typing
5POISSON(0, 1.5, False)
For Example 6.8b, we type
5POISSON(5, 6, True)
PAGE 103 INSTRUCTIONS
Type the following into any empty cell:
5HYPGEOM.DIST([x], [n], [A], [N], [True] or [False])
We calculate the probability in Example 6.9 by typing
5HYPGEOM.DIST(3, 5, 7, 20, False)
Chapter 7: Continuous Probability DistributionsPAGE 120 INSTRUCTIONS
We can use Excel to compute probabilities as well as values of X and Z. To compute cumulative normal probabilities P(X < x), type (in any cell)
5 NORMDIST ([X], [µ], [σ], True)
(Typing “True” yields a cumulative probability. Typing “False” will produce the value of the normal density function, a number with little meaning.)
If you type 0 for m and 1 for s, you will obtain standard normal probabilities. Alternatively, type NORMSDIST instead of NORMDIST and enter the value of z.
In Example 7.2, we found P(X < 1,100) 5 P(Z < 1.00) 5 .8413. To instruct Excel to calculate this probability, we enter
5 NORMDIST (1100, 1000, 100, True)
or
5 NORMSDIST (1.00)
To calculate a value for ZA, type
5 NORMSINV ([1 2 A])
In Example 7.4, we would type
5 NORMSINV (.95)
and produce 1.6449. We calculated Z.05 5 1.645.
Chapter 9: Introduction to Estimation*PAGE 145 INSTRUCTIONS
1. Type or import the data into one column. (Open Xm09-01.)
2. Click Add-Ins, Data Analysis Plus, and Z Esti-mate: Proportion.
3. Fill in the dialogue box: Input Range (A1:A694), click Labels if the first row contains the name of the variable, and specify the confidence level by typing the value of a(.05). Specify the Code for Success by entering the value 2.
Excel 2013 update.indd 3 2015-07-13 12:23 PM
E x c e l 2 0 1 3 I n s t r u c t i o n s4 NEL
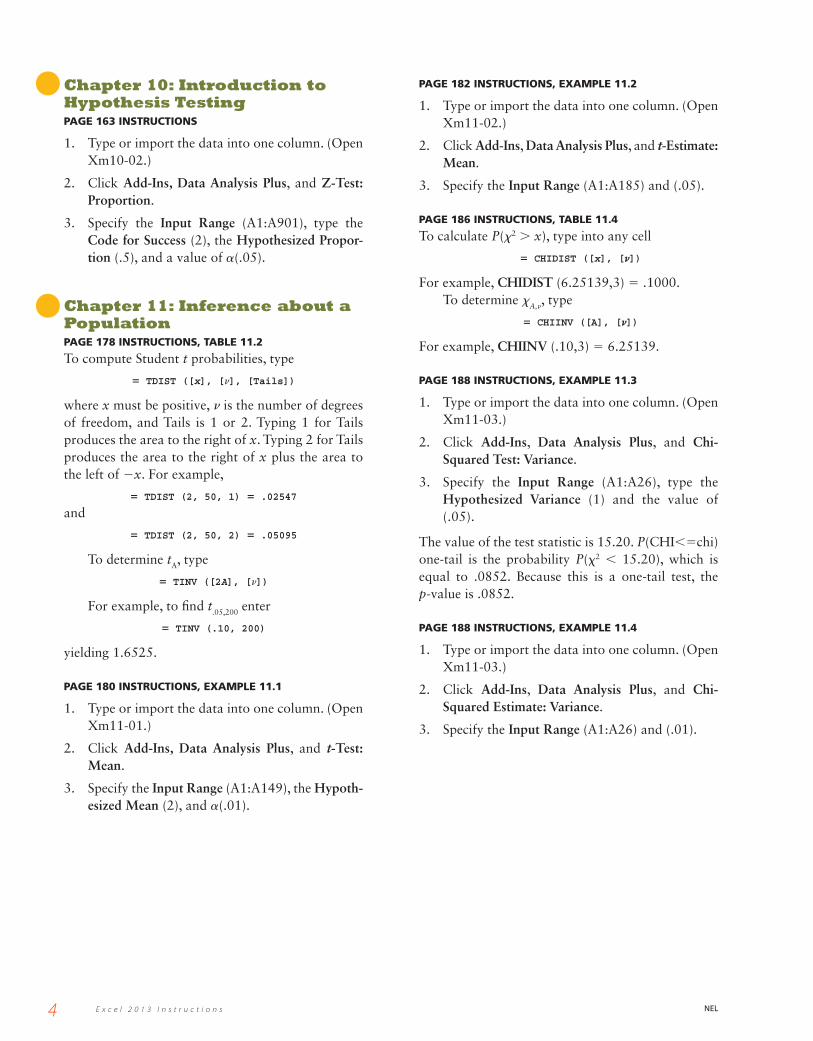
Chapter 10: Introduction to Hypothesis TestingPAGE 163 INSTRUCTIONS
1. Type or import the data into one column. (Open Xm10-02.)
2. Click Add-Ins, Data Analysis Plus, and Z-Test: Proportion.
3. Specify the Input Range (A1:A901), type the Code for Success (2), the Hypothesized Propor-tion (.5), and a value of a(.05).
Chapter 11: Inference about a PopulationPAGE 178 INSTRUCTIONS, TAblE 11.2
To compute Student t probabilities, type
5 TDIST ([x], [n], [Tails])
where x must be positive, n is the number of degrees of freedom, and Tails is 1 or 2. Typing 1 for Tails produces the area to the right of x. Typing 2 for Tails produces the area to the right of x plus the area to the left of 2x. For example,
5 TDIST (2, 50, 1) 5 .02547
and
5 TDIST (2, 50, 2) 5 .05095
To determine tA, type
5 TINV ([2A], [n])
For example, to find t.05,200 enter
5 TINV (.10, 200)
yielding 1.6525.
PAGE 180 INSTRUCTIONS, ExAMPlE 11.1
1. Type or import the data into one column. (Open Xm11-01.)
2. Click Add-Ins, Data Analysis Plus, and t-Test: Mean.
3. Specify the Input Range (A1:A149), the Hypoth-esized Mean (2), and a(.01).
PAGE 182 INSTRUCTIONS, ExAMPlE 11.2
1. Type or import the data into one column. (Open Xm11-02.)
2. Click Add-Ins, Data Analysis Plus, and t-Estimate: Mean.
3. Specify the Input Range (A1:A185) and (.05).
PAGE 186 INSTRUCTIONS, TAblE 11.4
To calculate P(x2 . x), type into any cell
5 CHIDIST ([x], [n])
For example, CHIDIST (6.25139,3) = .1000.To determine xA,n, type
5 CHIINV ([A], [n])
For example, CHIINV (.10,3) = 6.25139.
PAGE 188 INSTRUCTIONS, ExAMPlE 11.3
1. Type or import the data into one column. (Open Xm11-03.)
2. Click Add-Ins, Data Analysis Plus, and Chi-Squared Test: Variance.
3. Specify the Input Range (A1:A26), type the Hypothesized Variance (1) and the value of (.05).
The value of the test statistic is 15.20. P(CHI,5chi) one-tail is the probability P(x2 , 15.20), which is equal to .0852. Because this is a one-tail test, the p-value is .0852.
PAGE 188 INSTRUCTIONS, ExAMPlE 11.4
1. Type or import the data into one column. (Open Xm11-03.)
2. Click Add-Ins, Data Analysis Plus, and Chi-Squared Estimate: Variance.
3. Specify the Input Range (A1:A26) and (.01).
Excel 2013 update.indd 4 2015-07-13 12:23 PM
5E x c e l 2 0 1 3 I n s t r u c t i o n sNEL
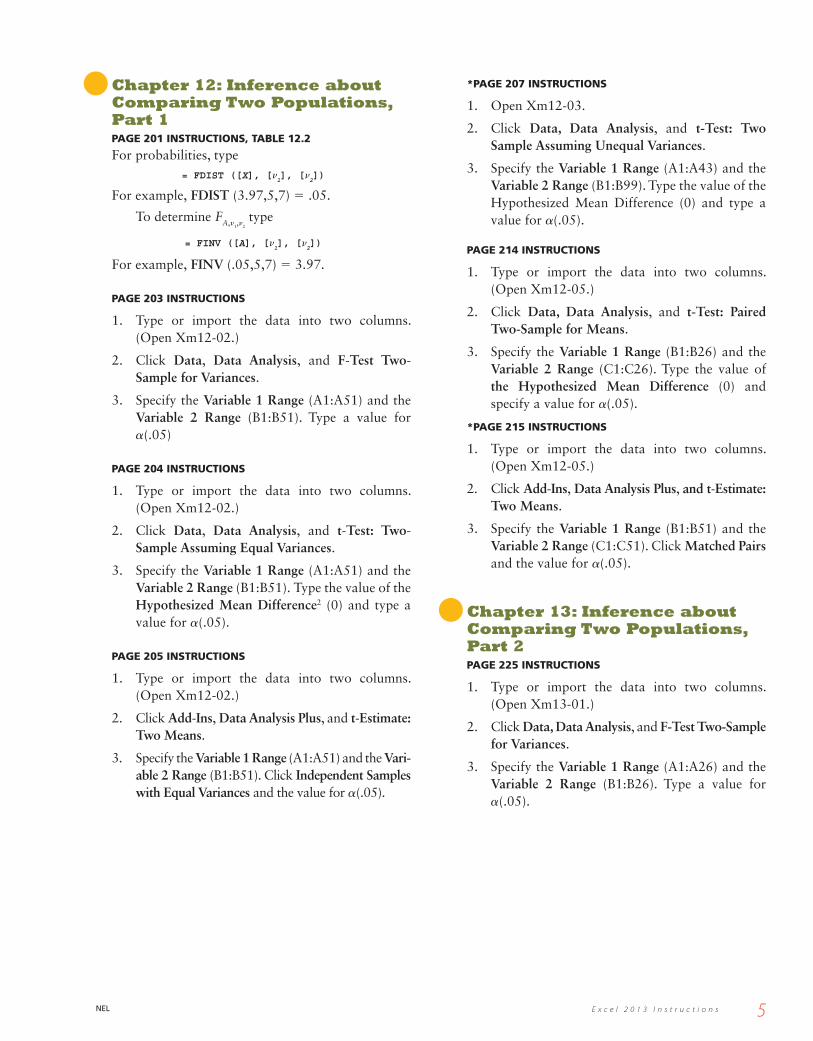
Chapter 12: Inference about Comparing Two Populations, Part 1PAGE 201 INSTRUCTIONS, TAblE 12.2
For probabilities, type= FDIST ([X], [n
1], [n
2])
For example, FDIST (3.97,5,7) 5 .05.
To determine FA,n1,n2
type
= FINV ([A], [n1], [n
2])
For example, FINV (.05,5,7) 5 3.97.
PAGE 203 INSTRUCTIONS
1. Type or import the data into two columns. (Open Xm12-02.)
2. Click Data, Data Analysis, and F-Test Two-Sample for Variances.
3. Specify the Variable 1 Range (A1:A51) and the Variable 2 Range (B1:B51). Type a value for a(.05)
PAGE 204 INSTRUCTIONS
1. Type or import the data into two columns. (Open Xm12-02.)
2. Click Data, Data Analysis, and t-Test: Two-Sample Assuming Equal Variances.
3. Specify the Variable 1 Range (A1:A51) and the Variable 2 Range (B1:B51). Type the value of the Hypothesized Mean Difference2 (0) and type a value for a(.05).
PAGE 205 INSTRUCTIONS
1. Type or import the data into two columns. (Open Xm12-02.)
2. Click Add-Ins, Data Analysis Plus, and t-Estimate: Two Means.
3. Specify the Variable 1 Range (A1:A51) and the Vari-able 2 Range (B1:B51). Click Independent Samples with Equal Variances and the value for a(.05).
*PAGE 207 INSTRUCTIONS
1. Open Xm12-03.
2. Click Data, Data Analysis, and t-Test: Two Sample Assuming Unequal Variances.
3. Specify the Variable 1 Range (A1:A43) and the Variable 2 Range (B1:B99). Type the value of the Hypothesized Mean Difference (0) and type a value for a(.05).
PAGE 214 INSTRUCTIONS
1. Type or import the data into two columns. (Open Xm12-05.)
2. Click Data, Data Analysis, and t-Test: Paired Two-Sample for Means.
3. Specify the Variable 1 Range (B1:B26) and the Variable 2 Range (C1:C26). Type the value of the Hypothesized Mean Difference (0) and specify a value for a(.05).
*PAGE 215 INSTRUCTIONS
1. Type or import the data into two columns. (Open Xm12-05.)
2. Click Add-Ins, Data Analysis Plus, and t- Estimate: Two Means.
3. Specify the Variable 1 Range (B1:B51) and the Variable 2 Range (C1:C51). Click Matched Pairs and the value for a(.05).
Chapter 13: Inference about Comparing Two Populations, Part 2PAGE 225 INSTRUCTIONS
1. Type or import the data into two columns. (Open Xm13-01.)
2. Click Data, Data Analysis, and F-Test Two-Sample for Variances.
3. Specify the Variable 1 Range (A1:A26) and the Variable 2 Range (B1:B26). Type a value for a(.05).
Excel 2013 update.indd 5 2015-07-13 12:23 PM

E x c e l 2 0 1 3 I n s t r u c t i o n s6 NEL
PAGE 226 INSTRUCTIONS
1. Type or import the data into two columns. (Open Xm13-01.)
2. Click Add-ins, Data Analysis Plus, and F Esti-mate 2 Variances.
3. Specify the Variable 1 Range (A1:A26) and the Variable 2 Range (B1:B26). Type a value for a(.05).
PAGE 229 INSTRUCTIONS
1. Type or import the data into two adjacent col-umns. (Open Xm13-02.)
2. Click Add-Ins, Data Analysis Plus, and Z-Test: 2 Proportions.
3. Specify the Variable 1 Range (A1:A905) and the Variable 2 Range (B1:B1039). Type the Code for Success (9077), the Hypothesized Difference (0), and a value for a(.05).
PAGE 230 INSTRUCTIONS
Use the same commands we used previously, except specify that the Hypothesized Difference is .03. Excel will apply the Case 2 test statistic when a nonzero value is typed.
PAGE 231 INSTRUCTIONS
1. Type or import the data into two adjacent col-umns. (Open Xm13-02.)
2. Click Add-Ins, Data Analysis Plus, and Z- Estimate: 2 Proportions.
3. Specify the Variable 1 Range (A1:A905) and the Variable 2 Range (B1:B1039). Specify the Code for Success (9077) and a value for a(.05).
Chapter 14: Analysis of VariancePAGE 241 INSTRUCTIONS
1. Type or import the data into adjacent columns. (Open Xm14-01.)
2. Click Data, Data Analysis, and Anova: Single Factor.
3. Specify the Input Range (A1:D132) and a value for a(.05).
PAGE 251 INSTRUCTIONS
1. Type or import the data into adjacent columns. (Open Xm14-03.)
2. Click Data, Data Analysis . . . , and Anova: Two-Factor Without Replication.
3. Specify the Input Range (A1:E26). Click Labels if applicable. If you do, both the treatments and blocks must be labelled (as in Xm14-03). Specify the value of a(.05).
Chapter 15: Chi-Squared TestsPAGE 259 INSTRUCTIONS
1. Type the observed values into one column and the expected values into another column. (If you wish, you can type the cell probabilities speci-fied in the null hypothesis and let Excel convert these into expected values by multiplying by the sample size.)
2. Activate an empty cell and type
= CHITEST ([Actual_range], [Expected_range])
*PAGE 263 INSTRUCTIONS (RAW DATA)
1. Type or import the data into two adjacent col-umns. (Open Xm15-01.) The codes must be pos-itive integers greater than 0.
2. Click Add-Ins, Data Analysis Plus, and Chi-Square Test of a Contingency Table (Raw Data).
3. Specify the Input Range (A1:B153) and specify the value of a(.05).
*PAGE 263 INSTRUCTIONS (COMPlETED TAblE)
1. Type the frequencies into adjacent columns.
2. Click Add-Ins, Data Analysis Plus, and Chi-Square Test of a Contingency Table.
3. Specify the Input Range. Click Labels if the first row and first column of the input range contain the names of the categories. Specify the value for a.
Excel 2013 update.indd 6 2015-07-13 12:23 PM

7E x c e l 2 0 1 3 I n s t r u c t i o n sNEL
Chapter 16: Simple Linear Regression and CorrelationPAGE 275 INSTRUCTIONS
1. Type or import data into two columns, one storing the dependent variable and the other the independent variable. (Open Xm16-02.)
2. Click Data, Data Analysis, and Regression.
3. Specify the Input Y Range (A1:A101) and the Input X Range (B1:B101).
PAGE 285 INSTRUCTIONS
1. Type or import the data into two adjacent col-umns. (Open Xm16-02.)
2. Click Add-ins, Data Analysis Plus, and Correla-tion (Pearson).
3. Specify the Variable 1 Input Range (A1:A101), Variable 2 Input Range (B1:B101), and a(.05).
*PAGE 287 INSTRUCTIONS
1. Type or import the data into two columns. (Open Xm16-02.)
2. Type the given value of x into any cell. We sug-gest the next available row in the column con-taining the independent variable.
3. Click Add-Ins, Data Analysis Plus, and Predic-tion Interval.
4. Specify the Input Y Range (A1:A101), the Input X Range (B1:B101), the Given X Range (B102), and Alpha (.05).
Chapter 17: Multiple RegressionPAGE 297 INSTRUCTIONS
1. Type or import the data so that the independent variables are in adjacent columns. Note that all rows with blanks (missing data) must be deleted.
2. Click Data, Data Analysis, and Regression.
3. Specify the Input Y Range, the Input X Range, and a value for a(.05).
PAGE 302 INSTRUCTIONS
See the instructions on page 287. In cells B284 to I284, we input the values 50 12 40 40 50 2 2 5, respectively. We specified 95% confidence.
PAGE 303 INSTRUCTIONS
Proceed with the three steps of regression analysis described on page 297. Before clicking OK, select Residuals and Standardized Residuals. The predicted values, residuals, and standardized residuals will be printed.
Excel 2013 update.indd 7 2015-07-13 12:23 PM


![POGS ISIS Excel INSTRUCTIONS[1].pptx](https://static.fdocuments.net/doc/165x107/55cf9d6a550346d033ad8560/pogs-isis-excel-instructions1pptx.jpg)


