Example of calming measures
15
Example of calming measures To ensure increased neighborhood support: 1) Neighbors shouldn’t inadvertently become the target of new actions 2) Non-Residents should no longer want to use our roads 3) New measures should work - not just become another stop sign that gets ignored
description
Example of calming measures. To ensure increased neighborhood support: Neighbors shouldn’t inadvertently become the target of new actions Non-Residents should no longer want to use our roads New measures should work - not just become another stop sign that gets ignored. - PowerPoint PPT Presentation
Transcript of Example of calming measures
Example of calming measures
To ensure increased neighborhood support:
1) Neighbors shouldn’t inadvertently become the target of new actions2) Non-Residents should no longer want to use our roads3) New measures should work - not just become another stop sign that gets ignored
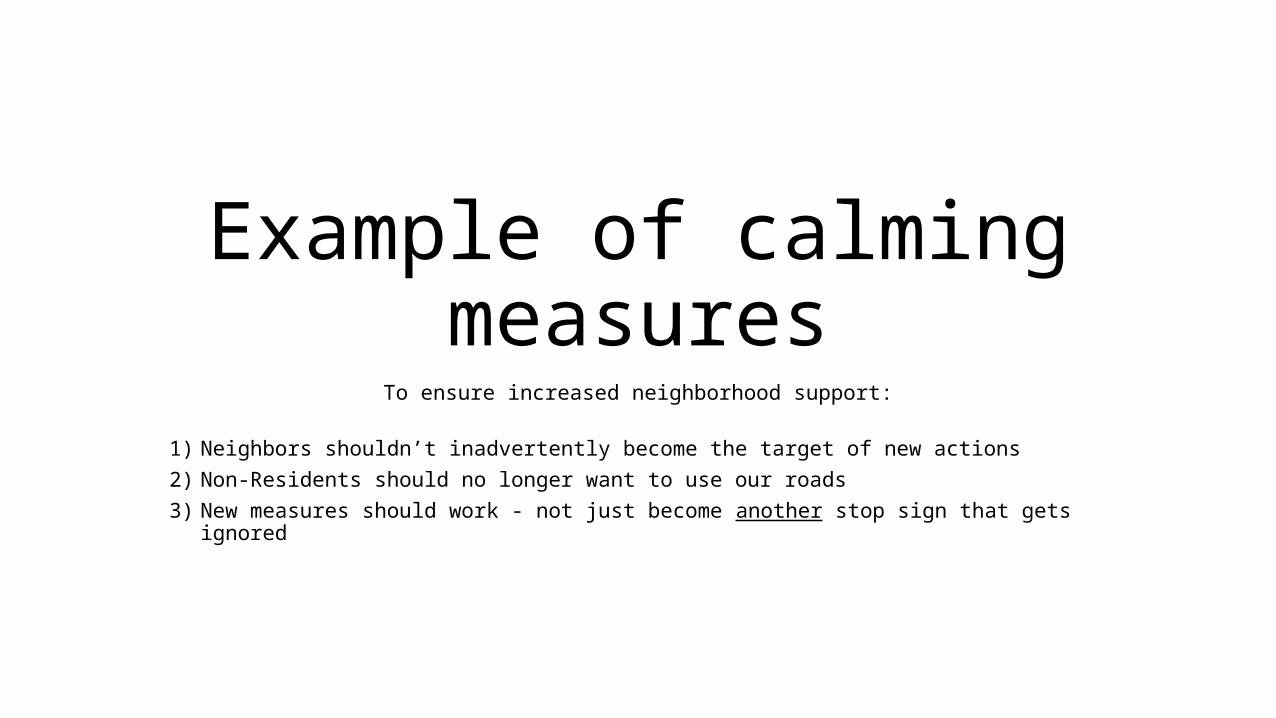
A real-life calming measure that worked
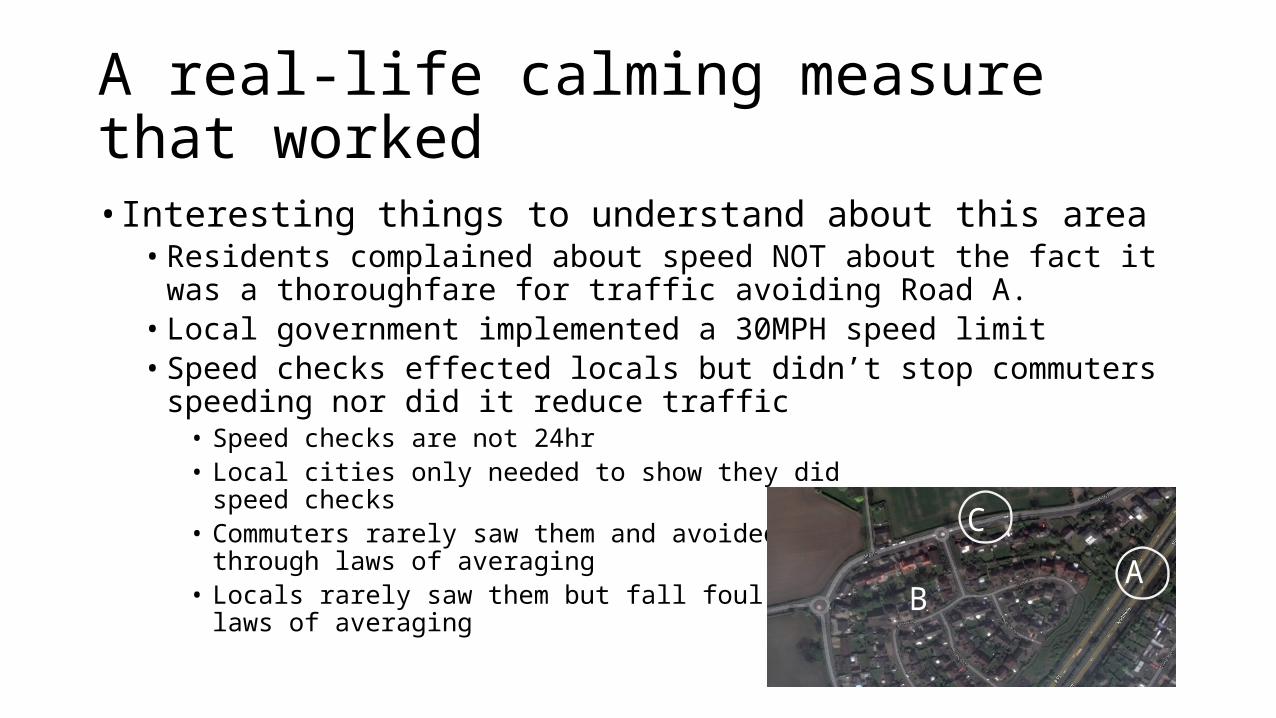
• A: Main road similar to Bascom
• B:Residential area flanked by a hospital
• C: Through-fare favored by commuters avoiding backlogs on A
A
C
B
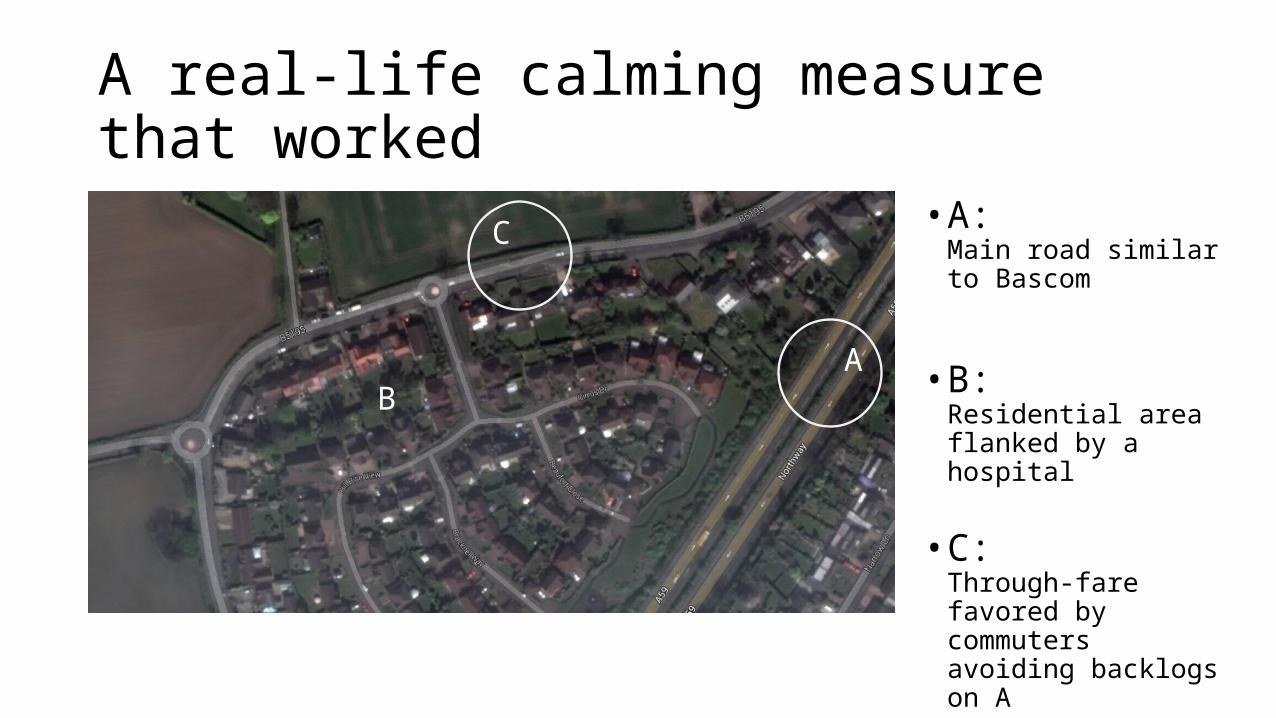
A real-life calming measure that worked• Interesting things to understand about this area• Road A is a dual lane carriageway (meaning two lanes in each direction) and
allows for 50 MPH• Road A is a main commuter road between Liverpool and Ormskirk• Road C bypasses a section of Road A that often backs up• Road C doesn’t have a speed designation, this means users can use the road
at the ‘national speed limit; 70MPH’• Road C runs along side a small residential
area and is flanked by a major hospital• Road C is a single lane carriageway
(meaning one lane in each direction)A
C
B
A real-life calming measure that worked• Interesting things to understand about this area• Residents complained about speed NOT about the fact it was a thoroughfare for
traffic avoiding Road A.• Local government implemented a 30MPH speed limit• Speed checks effected locals but didn’t stop commuters speeding nor did it
reduce traffic• Speed checks are not 24hr• Local cities only needed to show they did
speed checks• Commuters rarely saw them and avoided them
through laws of averaging• Locals rarely saw them but fall foul due to
laws of averaging
A
C
B
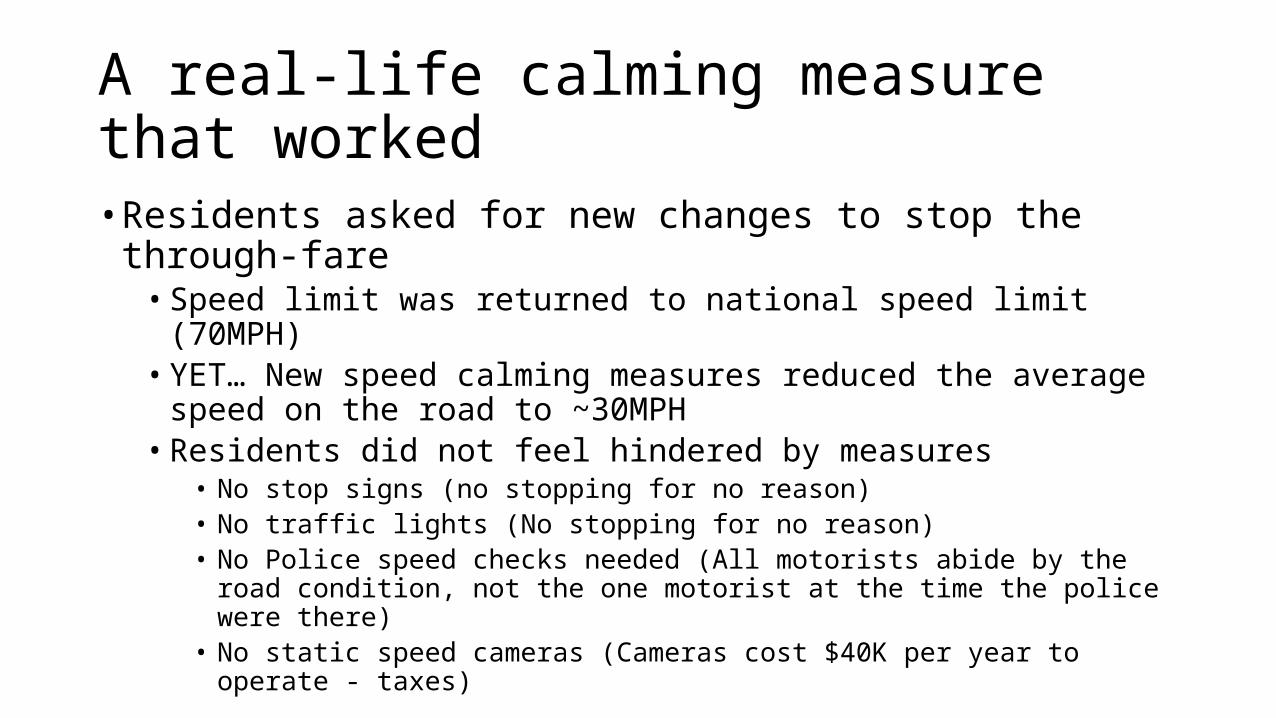
A real-life calming measure that worked• Residents asked for new changes to stop the through-fare• Speed limit was returned to national speed limit (70MPH)• YET… New speed calming measures reduced the average speed on the road to
~30MPH• Residents did not feel hindered by measures
• No stop signs (no stopping for no reason)• No traffic lights (No stopping for no reason)• No Police speed checks needed (All motorists abide by the road condition, not the one
motorist at the time the police were there)• No static speed cameras (Cameras cost $40K per year to operate - taxes)
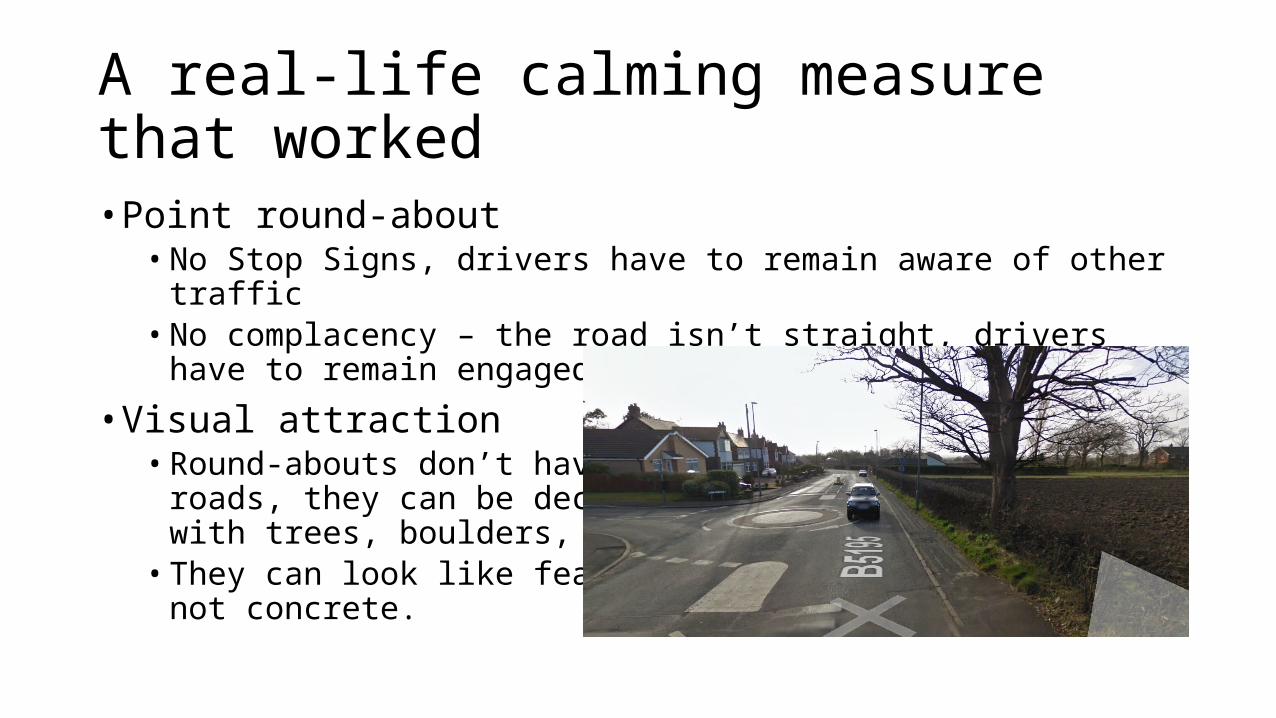
A real-life calming measure that worked• Point round-about• No Stop Signs, drivers have to remain aware of other traffic• No complacency – the road isn’t straight, drivers have to remain engaged with
the task at hand
• Visual attraction• Round-abouts don’t have to be
roads, they can be decoratedwith trees, boulders, etc.• They can look like features,
not concrete.
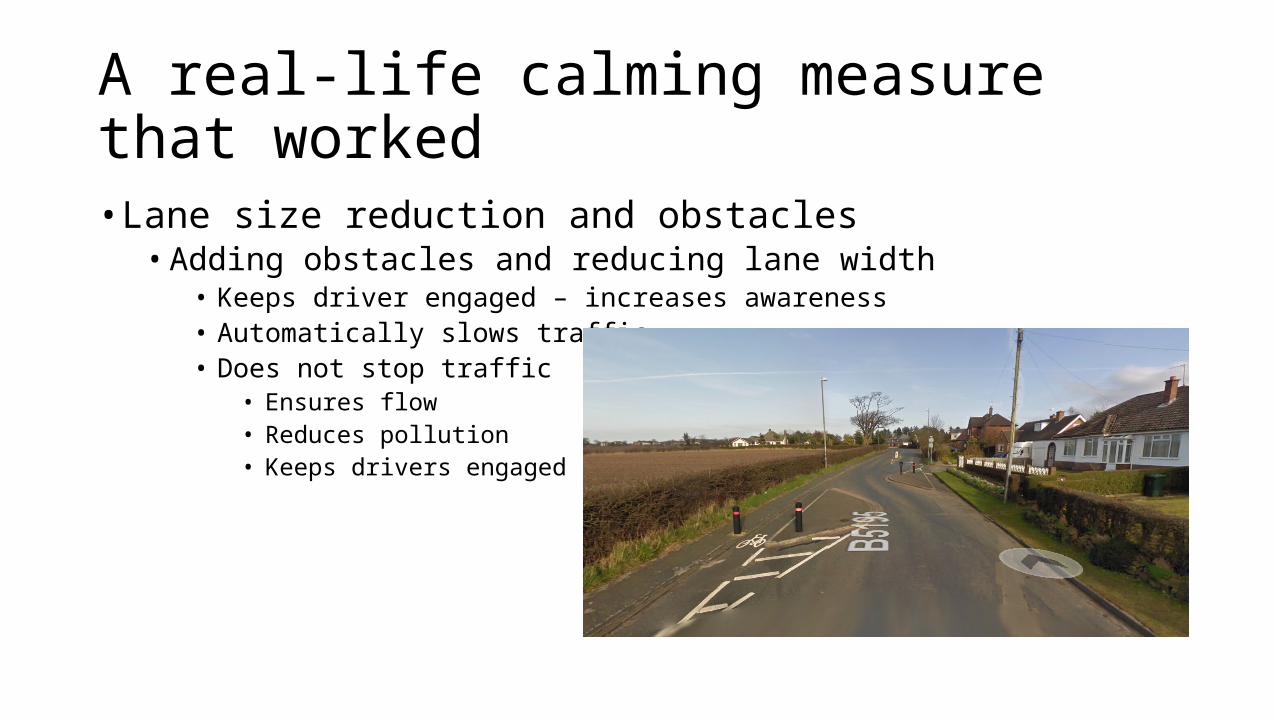
A real-life calming measure that worked• Lane size reduction and obstacles• Adding obstacles and reducing lane width
• Keeps driver engaged – increases awareness• Automatically slows traffic• Does not stop traffic
• Ensures flow• Reduces pollution• Keeps drivers engaged
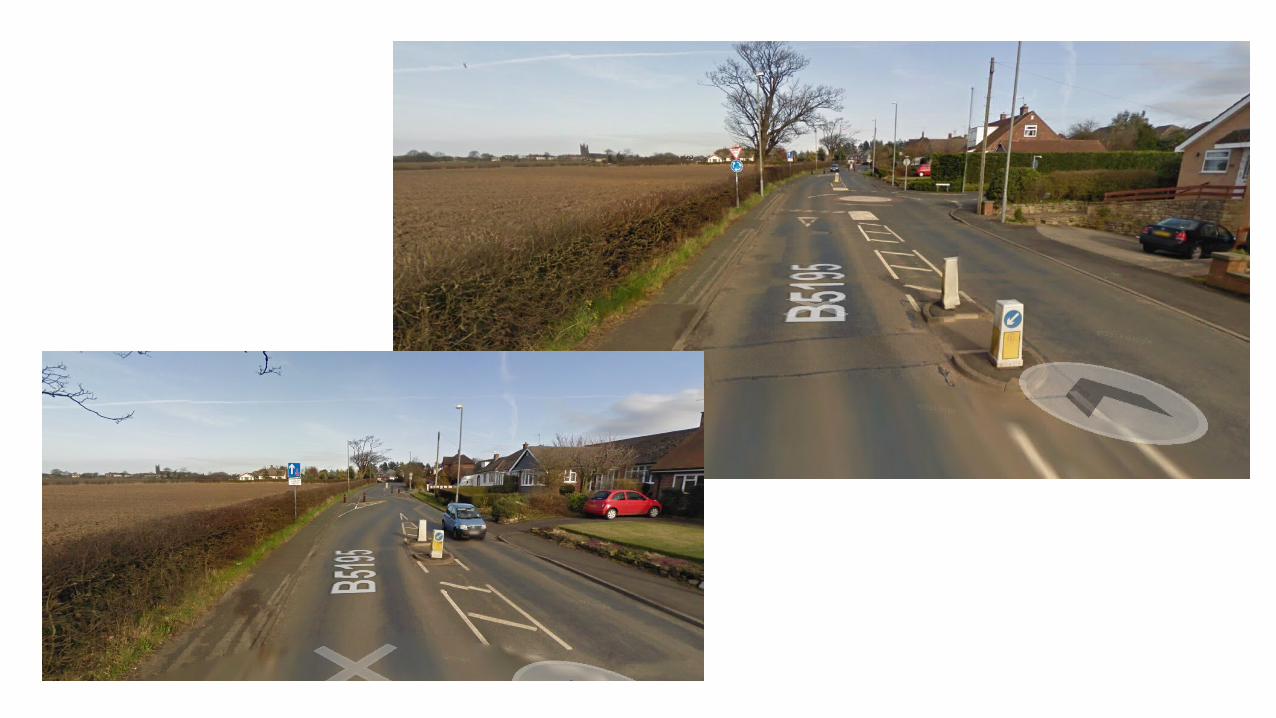
Real-life calming measures that didn’t work• Speed Cameras
• Speed cameras are common in Europe• They are permanent installations mounted at the side of the road
• Numbers• In 2001, The Dept. of Transport declared UK having the safest roads in the world
per KM• In 2011, the UK had the highest number of speed cameras in the world
• UK – 10,040• Germany – 9863• France - 8722• Italy - 5650• Spain - 2302
Real-life calming measures that didn’t work• 2012
• Static speed cameras deemed a success in terms of revenue generation• One UK camera raised USD $6.5 million over 4 years
• Static speed cameras deemed a failure in terms of speed reduction• 1 in 5 UK motorists have been caught by a speed camera• Typical motoring habits in UK have not changed since the national roll-out of the camera in the UK (2001)• Camera locations are known. • Drivers simply accelerate between cameras and brake hard for cameras • Drivers distract themselves looking for cameras rather than looking for the real issues
• Result: • Local government made to paint cameras bright yellow to advise motorists of danger zones. Now if caught
by camera, penalties higher• Local governments removing static cameras as safety didn’t change and revenues dwindle.• Speed averaging cameras replacing static cameras
• (Speed averaging cameras record license plates. If a license plate is seen in two different locations a time/distance calculation is performed. This method removed the hard braking fast accelerating phenomena)
Real-life calming measures that didn’t work• Stop Signs• Stop signs are similar to static speed cameras
• People accelerate hard and brake hard but the space in the middle is a race course• People focus in on the stop sign, they don’t look around
• Yield signs maintain moving targets, drivers maintain awareness over other traffic• Over use of the stop sign has resulted in complacency, they are no longer taken seriously
• Interesting sites questioning whether stop signs work to control speed• http://www.louisvilleky.gov/PublicWorks/stopsignstrafficcontrol.htm• http://www.theatlantic.com/magazine/archive/2008/07/distracting-miss-daisy/306873/• http://www.averillwoods.org/do-stop-signs-work.html
Recommendations• Don’t focus on measures that effect locals primarily
• Locals will pay the price by laws of averaging• Commuters will barely see the difference and may continue with their habits
• Focus on measures that discourage commuters from the area• Enable measures that keep drivers engaged• Restrictions will only encourage a ‘No Vote’ • Focusing on the wrong thing WON’T solve the
problem• ‘Speeding’ is an arbitrary number. What makes people
drive at a given speed is the environment. Change that, but change it wisely.
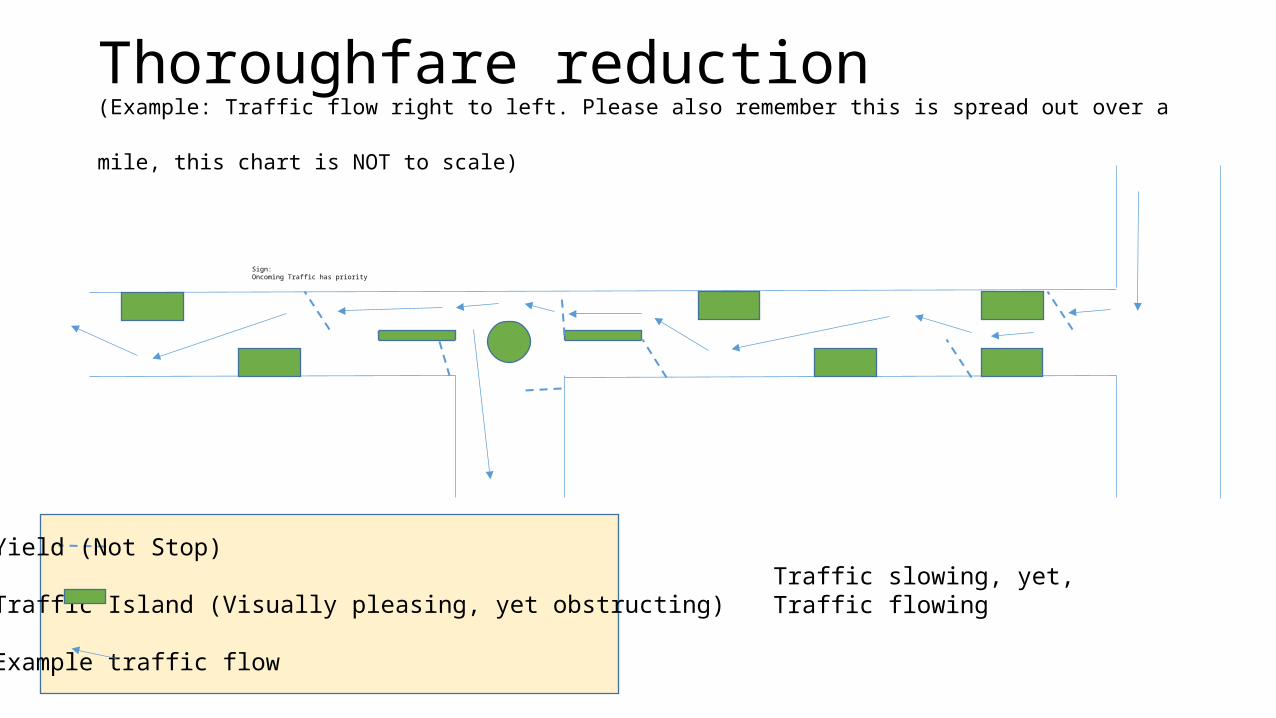
Thoroughfare reduction (Example: Traffic flow right to left. Please also remember this is spread out over a mile, this chart is
NOT to scale)
Yield (Not Stop)
Traffic Island (Visually pleasing, yet obstructing)
Example traffic flow
Traffic slowing, yet,Traffic flowing
Sign: Oncoming Traffic has priority
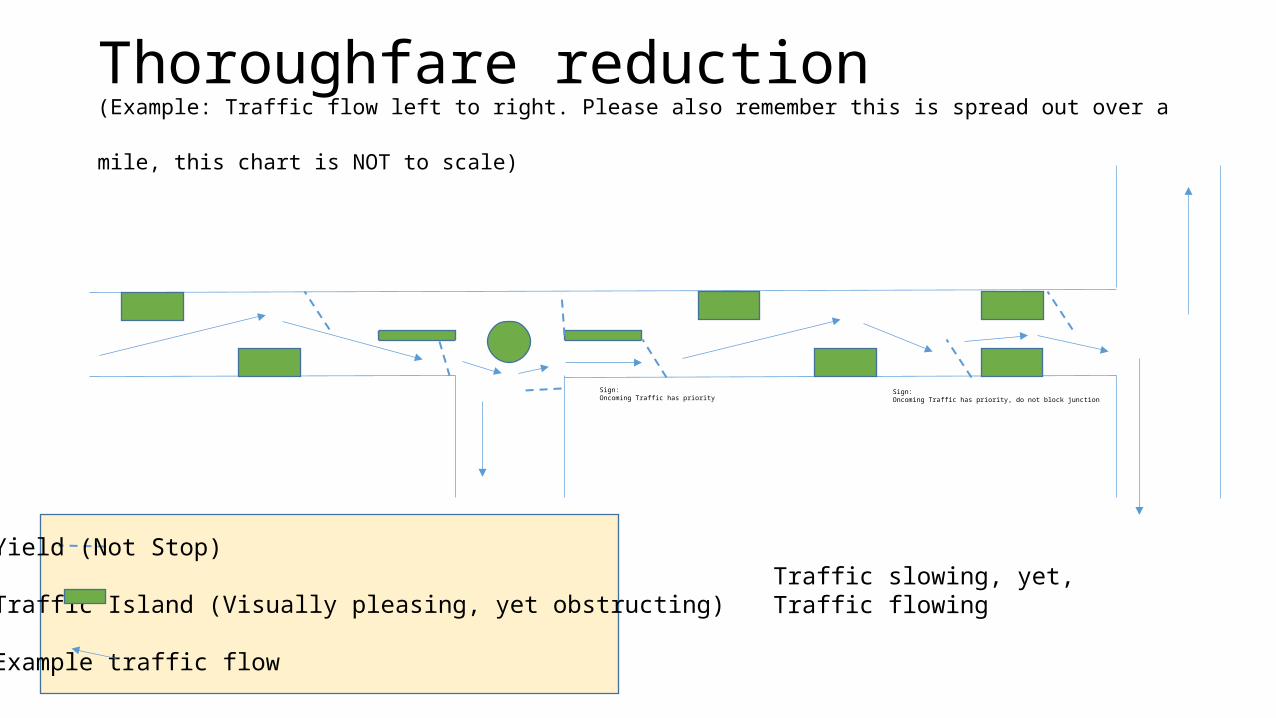
Yield (Not Stop)
Traffic Island (Visually pleasing, yet obstructing)
Example traffic flow
Traffic slowing, yet,Traffic flowing
Sign: Oncoming Traffic has priority
Sign: Oncoming Traffic has priority, do not block junction
Thoroughfare reduction (Example: Traffic flow left to right. Please also remember this is spread out over a mile, this chart is
NOT to scale)
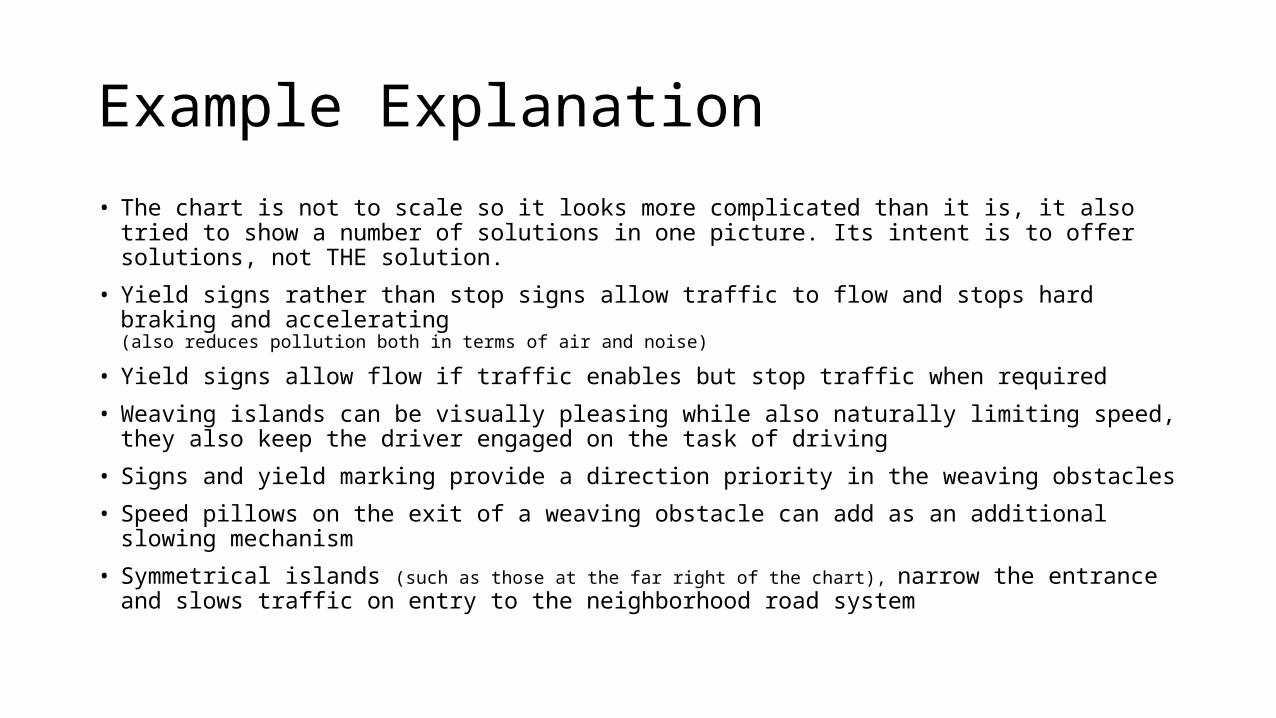
Example Explanation• The chart is not to scale so it looks more complicated than it is, it also tried to show a number of solutions in
one picture. Its intent is to offer solutions, not THE solution.
• Yield signs rather than stop signs allow traffic to flow and stops hard braking and accelerating (also reduces pollution both in terms of air and noise)
• Yield signs allow flow if traffic enables but stop traffic when required
• Weaving islands can be visually pleasing while also naturally limiting speed, they also keep the driver engaged on the task of driving
• Signs and yield marking provide a direction priority in the weaving obstacles
• Speed pillows on the exit of a weaving obstacle can add as an additional slowing mechanism
• Symmetrical islands (such as those at the far right of the chart), narrow the entrance and slows traffic on entry to the neighborhood road system