Examining English Learner Testing, Proficiency, and Growth ...
19
Examining English Learner Testing, Proficiency, and Growth: Before and Throughout the COVID-19 Pandemic Prepared by Narek Sahakyan and H. Gary Cook Wisconsin Center for Education Research, University of Wisconsin–Madison Research Report No. RR-2021-1 October 2021
Transcript of Examining English Learner Testing, Proficiency, and Growth ...

Examining English Learner Testing, Proficiency, and Growth: Before and Throughout the COVID-19 PandemicPrepared by Narek Sahakyan and H. Gary Cook Wisconsin Center for Education Research, University of Wisconsin–Madison
Research ReportNo. RR-2021-1 October 2021

This report examines English learners’ testing, proficiency, and growth during the three most recent academic years, in order to shed light on the impact of the COVID-19 pandemic on Els’ educational outcomes.
WIDA ResearchWIDA advances academic language development and academic achievement for children and youth who are linguistically diverse through high quality standards, assessments, research, and professional learning for educators.
The overarching goal of research at WIDA is to promote educational equity and academic achievement for linguistically and culturally diverse students.
To achieve this goal, we work in partnership with districts, states, and national experts to conduct research focused on understanding and explaining the educational experiences and outcomes of language learners. Through our research, we also aim to inform the decision-making needs of educators and policymakers who serve these children and youth.
The WIDA research team is housed within the Wisconsin Center for Education Research (WCER). Located at the highly ranked School of Education at the University of Wisconsin–Madison, WCER is one of the first and most productive education research centers in the world.
Suggested citation: Sahakyan, N. & Cook, H. G. (2021). Examining English Learner Testing, Proficiency, and Growth: Before and Throughout the COVID-19 Pandemic. (WIDA Research Report No. RR-2021-1). Wisconsin Center for Education Research.

3WIDA Research Report October 2021
ContentsIntroduction . . . . . . . . . . . . . . . . . . . . . . . . . . . . . . . . . . . . . . . . . . . . . . . . . . . . . . . . . . . . . . . 5
English Learner Testing . . . . . . . . . . . . . . . . . . . . . . . . . . . . . . . . . . . . . . . . . . . . . . . . . . . . . 6
English Learner Proficiency . . . . . . . . . . . . . . . . . . . . . . . . . . . . . . . . . . . . . . . . . . . . . . . . . . 7
English Learner Growth . . . . . . . . . . . . . . . . . . . . . . . . . . . . . . . . . . . . . . . . . . . . . . . . . . . . . 9
Summary . . . . . . . . . . . . . . . . . . . . . . . . . . . . . . . . . . . . . . . . . . . . . . . . . . . . . . . . . . . . . . . . . 13
Appendix A: Demographic Profiles . . . . . . . . . . . . . . . . . . . . . . . . . . . . . . . . . . . . . . . . . . 14
Appendix B: Data and Tables . . . . . . . . . . . . . . . . . . . . . . . . . . . . . . . . . . . . . . . . . . . . . . 15

4WIDA Research Report October 2021
Figures and TablesFigure 1: Number of ELs tested online by grade . . . . . . . . . . . . . . . . . . . . . . . . . . . . . . . 6
Figure 2: EL proficiency by grade . . . . . . . . . . . . . . . . . . . . . . . . . . . . . . . . . . . . . . . . . . . . 7
Figure 3: EL proficiency in individual domains . . . . . . . . . . . . . . . . . . . . . . . . . . . . . . . . . 8
Figure 4: EL growth by grade . . . . . . . . . . . . . . . . . . . . . . . . . . . . . . . . . . . . . . . . . . . . . . . 9
Figure 5: EL growth in individual domains . . . . . . . . . . . . . . . . . . . . . . . . . . . . . . . . . . . . 10
Figure 6: EL growth by grade-level cluster . . . . . . . . . . . . . . . . . . . . . . . . . . . . . . . . . . . . 11
Figure 7: EL growth by individual domain and grade-level cluster . . . . . . . . . . . . . . 12
Figure A1 : Demographic profile of tested students . . . . . . . . . . . . . . . . . . . . . . . . . . . 14
Table B1: Number of ELs tested online by grade . . . . . . . . . . . . . . . . . . . . . . . . . . . . . . 15
Table B2: EL proficiency by grade (overall composite) . . . . . . . . . . . . . . . . . . . . . . . . . 15
Table B3: EL proficiency by grade and domain (scale scores) . . . . . . . . . . . . . . . . . . 15
Table B4: EL growth by grade . . . . . . . . . . . . . . . . . . . . . . . . . . . . . . . . . . . . . . . . . . . . . . 16
Table B5: EL growth by grade and domain (in scale score gains) . . . . . . . . . . . . . . . 17
Table B6: EL growth by grade-level cluster (overall composite) . . . . . . . . . . . . . . . . 17
Table B7: EL growth by grade-level cluster and domain . . . . . . . . . . . . . . . . . . . . . . . 17
Table B8: Demographic profile of tested students . . . . . . . . . . . . . . . . . . . . . . . . . . . . 18

5WIDA Research Report October 2021
IntroductionThis report examines English learners’ (EL) testing, proficiency, and growth in the academic years of 2018–19, 2019–20, and 2020–21, using population-level data from ACCESS for ELLs Online (hereafter referred to as ACCESS), administered across the WIDA Consortium to students identified as ELs. The objective of the report is to shed light on the impact of the COVID-19 pandemic on ELs’ educational outcomes. To this end, the presented data and figures measure ELs’ performance on ACCESS before and after the pandemic forced the closure of schools, comparing ELs’ testing, proficiency, and growth results in the academic years 2018–19 and 2019–20 (hereafter referred to as 2019 and 2020, respectively) to that of academic year 2020–21 (hereafter referred to as 2021).
The report is organized into three sections. First, we present the overall number of tested EL students in the 3 years from 2019 to 2021. We take a closer look at the profile of the tested students across the years for the demographic variables that WIDA collects (presented in Appendix A). The second part of the report focuses on EL proficiency and compares EL students’ average composite scale scores across years by grade (for grades 1–12), both for overall composite and by individual domain (Reading, Listening, Speaking, and Writing).
The final part of the report examines EL growth, using average scale score gains across academic years for the growth cycles 2019–2020 and 2020–2021, presented by grade, both for overall composite and by individual domain. We also present a view of EL growth by grade-level cluster, broken down by overall composite and individual domain, and provide a summary to conclude. The data presented in the figures is given in tables in Appendix B.

6WIDA Research Report October 2021
English Learner TestingFewer ELs were tested online in 2021 compared to 2019 and 2020.1 Overall, the number of students tested online in the 2021 sample was about 30% lower compared to previous years. Figure 1 presents the number of tested ELs by grade, across the three years.
Figure 1: Number of ELs tested online by grade
Figure 1 shows that the number of tested students declined in all grades. Elementary grades (grades 1–5) and high school grades (grades 9–12) had larger proportions of “missing” students compared to middle school grades (grades 6–8). With a decline of about 30% in the number of tested students in the 2021 sample compared to the previous 2 years, it is important to examine the demographic composition of the tested population. Appendix A presents proportions of tested students for the demographic variables that WIDA collects during the administration of ACCESS. Importantly, WIDA does not collect data on students’ socioeconomic status, which has been shown to affect educational outcomes. To ensure a consistent and fair year-to-year comparison of average EL proficiency and growth, states and districts should examine the demographic makeup of students tested in their locale and consider the ELs who did not get the opportunity to take the assessment.
1 The data includes only those students who completed all four domains of ACCESS (for overall composite scale score calculations). The 2021 sample is based on student testing as of September 7, 2021.
7WIDA Research Report October 2021
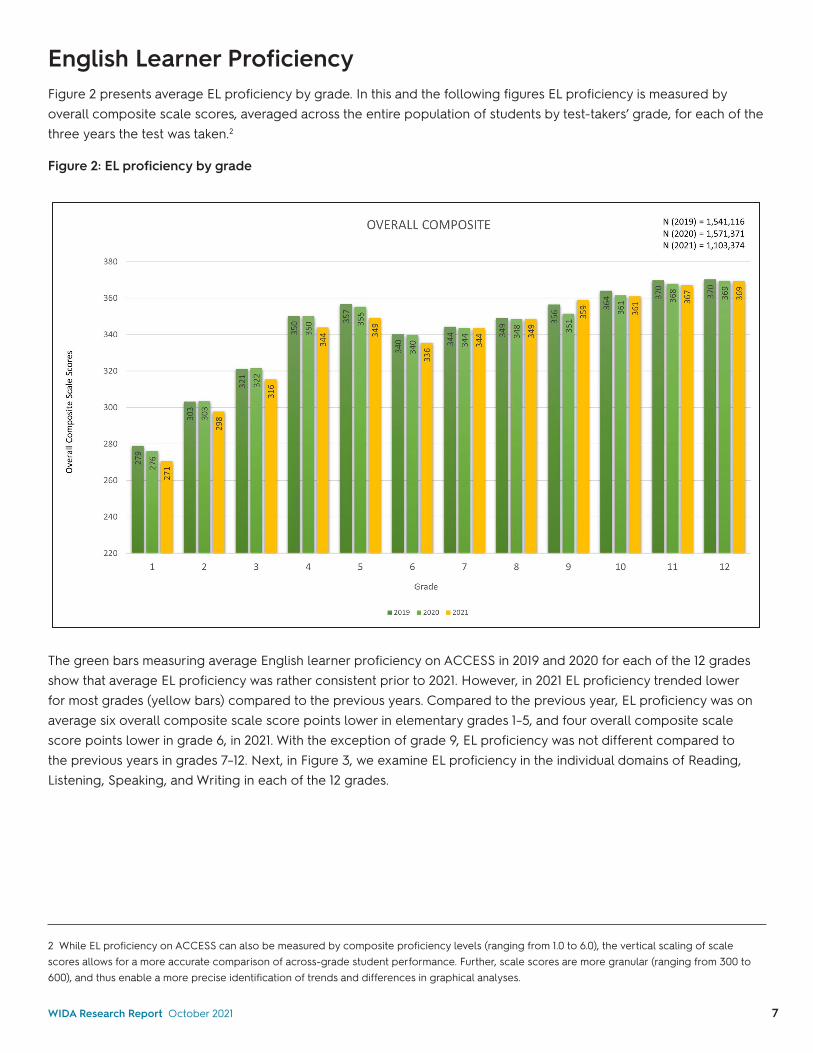
English Learner ProficiencyFigure 2 presents average EL proficiency by grade. In this and the following figures EL proficiency is measured by overall composite scale scores, averaged across the entire population of students by test-takers’ grade, for each of the three years the test was taken.2
Figure 2: EL proficiency by grade
The green bars measuring average English learner proficiency on ACCESS in 2019 and 2020 for each of the 12 grades show that average EL proficiency was rather consistent prior to 2021. However, in 2021 EL proficiency trended lower for most grades (yellow bars) compared to the previous years. Compared to the previous year, EL proficiency was on average six overall composite scale score points lower in elementary grades 1–5, and four overall composite scale score points lower in grade 6, in 2021. With the exception of grade 9, EL proficiency was not different compared to the previous years in grades 7–12. Next, in Figure 3, we examine EL proficiency in the individual domains of Reading, Listening, Speaking, and Writing in each of the 12 grades.
2 While EL proficiency on ACCESS can also be measured by composite proficiency levels (ranging from 1.0 to 6.0), the vertical scaling of scale scores allows for a more accurate comparison of across-grade student performance. Further, scale scores are more granular (ranging from 300 to 600), and thus enable a more precise identification of trends and differences in graphical analyses.

8WIDA Research Report October 2021
Figure 3: EL proficiency in individual domains
Proficiency in Reading decreased slightly in some elementary and middle school grades, while it increased slightly in first grade and in grade 9-12. Proficiency in Speaking decreased in the elementary and middle school grades and remained about the same in high school. Proficiency in Listening decreased in grades 1–5 and slightly increased in grades 6–12. Proficiency in Writing decreased in all grades, with the larger relative decline in average scale scores in the lower grades (grades 1–6).
While scale scores are not strictly comparable across language domains, a comparison of 2021 scale scores in individual domains in 2021 to those of 2019 and 2020 shows that Writing, followed by Speaking, were the domains with relatively larger decreases in average scale scores. Similar to patterns revealed in Figure 2, the decline in average proficiency was more substantial in the lower grades in all of the four domains.
In the next section we provide a similar by-grade and by-domain breakdown of average EL performance with respect to their annual growth.

9WIDA Research Report October 2021
English Learner GrowthWe measure EL growth by calculating ELs’ average annual scale score gains, in the overall composite and individual domains, within each of the twelve grades. This requires matching individual students across two adjacent years: in 2019 and 2020 for calculating the (by-grade average) 2020 growth, and in 2020 and 2021, for calculating 2021 growth. Therefore, the unrestricted and unmatched sample that underlies the EL proficiency results in the previous section is somewhat different from the matched-across-adjacent-years sample that is used to examine EL growth below.3
Figure 4: EL growth by grade
English learners’ growth, as measured in overall composite scale score gains across adjacent years, decreased compared to that in the previous year. Achieving high growth was especially difficult for English learners in elementary and middle school grades, while the average gains made in the high school grades were similar to the growth recorded in the previous year. The negative average growth reported in the transition from fifth to sixth grade is troubling, especially since it had doubled in 2020-2021 to -9 scale score points.4 Next, in Figure 5, we present EL growth in each of the four individual domains by grade.
3 Similar to EL proficiency calculations, EL growth results include only those students who received an overall composite scale score on ACCESS. 4 A combination of factors could contribute to the negative growth recorded in grade 6. First, the transition from elementary to middle school can be difficult for many students, especially those that are still learning English. Second, because of the clustered structure of the ACCESS test (K, 1-2, 3-5, 6-8 and 9-12), some discontinuities in student growth in grades 1, 3, 6 and 9 may be expected (observed in grades 1, 6 and 9). Third, by fifth grade many EL students who started in kindergarten reach reclassification-level proficiency and exit EL status (a large proportion of ELs starts in K). This would imply that the 5th grade sample includes proportionally fewer “higher ability” students, which, in turn could cause the negative growth that we observe in the transition to the 6th grade.

10WIDA Research Report October 2021
Figure 5: EL growth in individual domains
Examining EL growth by individual domain and grade reveals some interesting patterns. First, the small differences in the blue and orange bars for the average growth in the Reading domain for most grades imply that ELs’ growth in Reading has not been substantially affected by the pandemic. While growth in Reading was slightly lower (compared to the previous year) in grades 3–8, it was about the same in grades 1–2 and grades 9–12. EL growth was slightly lower in all grades in 2020–2021 compared to that in 2019–2020 in the Listening domain. Similar trends can be observed in the Writing domain, where most of the decline in growth was in earlier grades, while there was some improvement in the (small) average growth made by ELs in high school grades.

11WIDA Research Report October 2021
Growth in Speaking, on the other hand, was substantially lower in all grades. It is quite troubling that after 2020 very little growth was recorded in Speaking in grades 5–12 (under 5 scale score points, on average), while the negative growth recorded from kindergarten to first grade nearly doubled in 2020–2021.5 Interestingly, despite the negative average growth in overall composite gains, Speaking was the only domain where sixth grade ELs exhibited positive growth. Overall, the patterns revealed in Figure 5 show that while average EL growth has been affected in almost all domains and grades, the larger relative declines were recorded in the lower grades, and in the domain of Speaking.
Next, in Figures 6 and 7, we examine EL growth by grade-level cluster. In these figures, instead of averaging the scale score gains in the overall composite and individual domains within each grade, scale score gains are averaged within grade-level clusters (1–2, 3–5, 6–8, and 9–12).
Figure 6: EL growth by grade-level cluster
Figure 6 shows that achieving growth was most challenging for the middle school grade-level cluster. After 2020, EL growth declined by six scale score points in the 1–2 grade-level cluster, and by nine scale score points in the 3–5 grade-level cluster. The largest relative decline (67%) was in the 6–8 grade-level cluster, where average growth dropped from 6 scale score points to 2 scale score points. Next, Figure 7 shows average EL growth by individual domain.
5 The large difference in students’ average kindergarten and first grade speaking scores could be due to the kindergarten Speaking test being a paper test scored locally, while the first grade test is administered online and is scored centrally.

12WIDA Research Report October 2021
Figure 7: EL growth by individual domain and grade-level cluster
Differences in average growth recorded by ELs in the Reading domain across the two growth cycles reveal that the pandemic has not substantially affected the elementary and high school grade-level clusters. Growth in Listening declined in all grade-level clusters, with the 3–5 grade-level cluster reporting the largest drop (11 scale score points) in average growth between the two growth cycles. Growth in Writing declined in the 1–2 and 3–5 grade-level clusters, while it remained about the same and increased slightly in the 6–8 and 9–12 grade-level clusters.
Mirroring the findings from the by-grade and by-domain examination of student growth in Figure 5, Speaking was the domain where there were relatively larger declines in average EL growth. While there was relatively little growth in Speaking in the 1–2, 6–8, and 9–12 grade-clusters even prior to the pandemic, after 2020 growth in Speaking declined further and was negative in the 1–2 grade-level cluster, and close to zero in the 6–8 and 9–12 grade-level clusters.6
6 The negative growth in Speaking of the 1-2 grade-level cluster is due to the large negative growth recorded by the first grade-cohort, as explored further in footnote 5.

13WIDA Research Report October 2021
SummaryThis report examines English Learners’ testing, proficiency, and growth in the academic years of 2018–19, 2019–20, and 2020–21, using population-level data from ACCESS for ELLS Online, administered across the WIDA Consortium to students identified as ELs. The data reveals an overall downward trend in student proficiency and growth in 2021, as compared to 2019 and 2020. The impact of the pandemic on ELs’ test scores varied by grade and domain, with the relatively larger declines recorded in elementary and middle school grades (first and sixth grades), and in the domain of Speaking.
Several factors should be considered when comparing aggregated and averaged test scores across years. First, for many EL students, the 2020–21 administration of the ACCESS for ELLs assessment was implemented under vastly different circumstances compared to past years. In addition to contextual and varied individual testing circumstances that affected student testing and performance, in response to challenges brought about by the pandemic, several WIDA Consortium member states and districts substantially shifted and extended their assessment administration windows, resulting in many students being tested at irregular times (e.g., 9 to 15 months apart, instead of 12 months apart). Therefore, students who tested in states and districts that administered ACCESS earlier than usual had a shorter time available for instruction and learning and would tend to show lower proficiency and growth.7 Indeed, we observed higher proficiency and growth among students that tested into the end of the summer.
Further, when examining and comparing aggregate student data, it is important to consider those students who were not tested in 2020–21 due to factors caused by the pandemic. Compared to the previous years, the 2020–21 sample recorded about a 30% decline in the number of tested ELs across the WIDA Consortium. While there are still some WIDA states in testing (for 2020–2021 school year) into October of 2021, many ELs did not participate in ACCESS testing in 2021. Therefore, for states, districts, and schools examining their students’ average proficiency and growth across years, it is imperative to consider any substantial differences in the profile (sample characteristics) of their tested students, as the pandemic has affected the educational opportunities and academic outcomes of EL students disproportionately.
7 Moreover, some WIDA Consortium member states and districts adjusted their testing policies, placing a higher priority on the testing of their higher proficiency ELs, to avoid missing important decisions regarding potential student reclassification.

14WIDA Research Report October 2021
Appendix A: Demographic ProfilesWIDA collects demographic data for students who take ACCESS for ELLs, though individual WIDA Consortium member states may limit what data they collect. Demographic categories are as follows:
• Hispanic/Latino• American Indian/Alaskan Native• Asian• Black/African American• Pacific Islander/Hawaiian• White• Male• Female• Individualized Education Plan (IEP) status
Figure A1 : Demographic profile of tested students

15WIDA Research Report October 2021
Appendix B: Data and Tables8 Table B1: Number of ELs tested online by grade
Grade/YearNumber of tested students
2019 2020 2021
1 189,843 187,178 137,144
2 195,089 194,459 131,013
3 195,621 192,231 130,168
4 188,171 184,853 135,071
5 151,077 149,279 106,632
6 109,060 123,223 87,998
7 97,878 111,342 87,971
8 90,898 97,000 78,501
9 104,676 110,210 66,162
10 86,166 87,107 58,584
11 76,554 72,243 47,644
12 56,083 62,246 36,486
TOTAL 1,541,116 1,571,371 1,103,374
Table B2: EL proficiency by grade (overall composite)
Grade/YearEL Proficiency (overall composite scale scores)
2019 2020 2021
1 279 276 271
2 303 303 298
3 321 322 316
4 350 350 344
5 357 355 349
6 340 340 336
7 344 344 344
8 349 348 349
9 356 351 359
10 364 361 361
11 370 368 367
12 370 369 369
8 In all tables average scale scores are rounded to the closest integer.

16WIDA Research Report October 2021
Table B3: EL proficiency by grade and domain (scale scores)
DOMAIN READING LISTENING SPEAKING WRITING
Grade/Year 2019 2020 2021 2019 2020 2021 2019 2020 2021 2019 2020 2021
1 292 287 288 325 320 315 252 255 248 258 255 244
2 319 319 317 326 325 319 260 268 261 297 294 285
3 334 333 327 349 350 343 272 283 278 317 314 308
4 355 355 348 412 411 407 308 313 303 337 335 330
5 360 359 352 421 418 411 310 314 303 346 343 339
6 344 346 343 392 396 395 313 314 308 326 320 314
7 350 352 352 397 399 401 313 314 313 330 325 323
8 356 358 358 402 404 406 314 317 316 334 329 329
9 371 370 380 387 386 395 305 301 310 351 340 344
10 379 380 382 391 394 397 311 312 311 360 350 345
11 385 387 388 396 401 403 315 319 318 366 356 352
12 386 388 390 396 402 405 316 319 320 367 358 354
Table B4: EL growth by grade
Grade/YearEL Growth (overall composite scale score gain)
2019–2020 2020–2021
1 60 54
2 30 24
3 25 16
4 37 27
5 20 11
6 -4 -9
7 10 6
8 12 8
9 18 16
10 8 8
11 7 6
12 2 2

17WIDA Research Report October 2021
Table B5: EL growth by grade and domain (in scale score gains)
DOMAIN READING LISTENING SPEAKING WRITING
Grade2019-2020
2020-2021
2019-2020
2020-2021
2019-2020
2020-2021
2019-2020
2020-2021
1 102 103 -16 -24 53 46 54 41
2 31 32 21 8 8 2 42 32
3 20 11 30 14 34 23 25 18
4 28 19 48 24 72 62 27 21
5 16 8 21 1 25 14 21 16
6 -2 -6 18 5 -10 -11 -13 -17
7 13 8 9 0 14 8 5 5
8 15 9 13 3 18 11 7 8
9 25 26 5 -1 2 -1 21 21
10 12 12 10 5 12 10 1 4
11 10 9 10 3 13 11 -1 3
12 5 5 5 -2 9 6 -6 -1
Table B6: EL growth by grade-level cluster (overall composite)
Grade-level cluster/Year
EL Growth (overall composite scale score gain)
2019–2020 2020–2021
1–2 45 39
3–5 27 18
6–8 6 2
9–12 8 8
Table B7: EL growth by grade-level cluster and domain
DOMAIN READING LISTENING SPEAKING WRITING
Grade-level cluster
2019-2020
2020-2021
2019-2020
2020-2021
2019-2020
2020-2021
2019-2020
2020-2021
1–2 66 67 2 -8 30 24 48 36
3–5 21 13 33 13 44 33 24 19
6–8 9 4 13 2 7 3 0 -2
9–12 13 13 7 1 9 7 4 7

18WIDA Research Report October 2021
Table B8: Demographic profile of tested students
Demographic Subgroup Variable 2018–2019 2019–2020 2020–2021
Ethnicity Hispanic/Latino 64% 64% 66%
Gender Female 45% 45% 45%
IEP Status IEP 12% 12% 12%
Race
White 39% 37% 42%
Black/African American
7% 7% 7%
Asian 11% 11% 11%
Native American/Alaskan Native
8% 8% 8%
Pacific Islander/Hawaiian
2% 2% 2%
Unknown 35% 37% 32%

Wisconsin Center for Education Research University of Wisconsin–Madison
1025 West Johnson St., MD #23 Madison, WI 53706
Client Services Center toll free: (866) 276-7735
wida.wisc.edu
Research ReportNo. RR-2021-1 October 2021