Examining DIF, DDF, and Omit Rate by Discrete Disability ......Examining DIF, DDF, and Omit Rate by...
41
Partnership for Accessible Reading Assessment Examining DIF, DDF, and Omit Rate by Discrete Disability Categories
Transcript of Examining DIF, DDF, and Omit Rate by Discrete Disability ......Examining DIF, DDF, and Omit Rate by...
Partnership for AccessibleReading Assessment
Examining DIF, DDF, and Omit Rate by Discrete Disability Categories
Examining DIF, DDF, and Omit Rate by Discrete Disability Categories
Kentaro Kato, Ross Moen, and Martha Thurlow
December 2007
All rights reserved. Any or all portions of this document may be reproduced and distributed without prior permission, provided the source is cited as:
Kato, K., Moen, R., & Thurlow, M. (2007). Examining DIF, DDF, and omit rate by discrete disability categories. Minneapolis, MN: University of Minnesota, Partnership for Accessible Reading Assessment.
N A T I O N A LC E N T E R O NEDUCATIONALO U T C O M E S
This work is supported, in part, by the
U.S. Department of Education, Institute of
Education Sciences, National Center for
Special Education Research—Grant No. H324F040002. Opinions expressed do not necessarily
reflect those of the U.S. Department of Education or offices within it.
The University of Minnesota is committed to the policy that all persons shall have equal access to its programs, facilities, and employment without regard to race, color, creed, religion, national origin, sex, age, marital status, dis-ability, public assistance status, veteran status, or sexual orientation.
This document is available in alternative formats upon request.
Partnership for Accessible Reading AssessmentUniversity of Minnesota350 Elliott Hall75 E. River RoadMinneapolis, MN 55455
http://[email protected]
Curriculum andInstruction
PartnershipforAccessibleReadingAssessment �
Introduction
States need to include students with disabilities in their assessment and accountability systems. The No Child Left Behind Act of 2001 (NCLB) requires it; equitable treatment of these students demands it. Excluding these students from assessment reporting would leave them outside the accountability systems intended to identify places and ways that education needs to be improved.
The participation of students with disabilities in state assessments has increased greatly within the past two decades. A 1993 National Center on Educational Outcomes (NCEO) survey showed that in the early 1990s, most states included fewer than 10% of their students with disabilities in state assessments (Shriner, Spande, & Thurlow, 1994). Recent analyses of state annual performance reports show nearly all states reporting at least 95% of their students with disabilities participating in state assessments (Thurlow, Moen, & Wiley, 2005).
Ensuring that students with disabilities are included in assessment and accountability systems is an important step, but it is just a beginning step. Studies such as those by Abedi, Leon, and Mirocha (2003), Klein, Wiley, and Thurlow (2006), and Ysseldyke et al. (1998) report that when the performance levels of students with disabilities have been compared with performance levels of students without disabilities, the performance levels of students with disabilities are lower than those of students without disabilities. If test performance is low because students cannot in fact do what is required, then the tests are doing exactly the job they are supposed to do. By drawing attention to low performance, tests reveal areas that may need additional efforts to improve student learning. On the other hand, if test performance is low because features of the assessment prevent students with disabilities from showing what they can do, then the assessment needs to change.
Various attempts have been made to change assessment practices to remove inappropriate barriers to performing well. Elliott, Thurlow, Ysseldyke, and Erickson (1997) described a variety of accommodations that are used to overcome assessment barriers. Thompson, Johnstone, and Thurlow (2002) described ways principles of universal design can be employed to help develop assessments from the outset that reduce barriers without requiring accommodations or that make it easier to apply needed accommodations.
A particular challenge for assessing reading is that many accommodations and principles for universal design of assessment (UDA) used in mathematics and other content areas rely on reducing inappropriate test difficulty caused by unnecessary reading demands. These same practices cannot be directly applied to reading assessments. Consequently, assessing reading requires looking at different accommodations and UDA principles than are used in other content areas or looking differently at ones that are used in other areas. The Partnership for Accessible Reading Assessment (PARA) is one part of a

� ExaminingDIF,DDF,andOmitRatebyDiscreteDisabilityCategories
national effort to find ways of making reading assessment accessible for students with disabilities.
As part of the PARA project, Abedi, Leon, and Kao (2007a, 2007b) have been examining test item characteristics that could cause or signal inappropriate barriers to successful test performance for students with disabilities. They have been using a research model that says that if examinees in one group (e.g., students with specific disabilities) are more or less likely to answer a test item correctly than examinees in another group (e.g., students without disabilities) because of some characteristic of the test item or testing situation that is not relevant to the testing purpose, item bias is said to occur (Zumbo, 1999). If a substantial number of items in a test show item bias, then the test is also likely to be biased (test bias), lacking equity for all groups of students.
One of the commonly used methods to detect potential item bias in a systematic way is the analysis of differential item functioning (DIF). DIF means that examinees in different groups show differing probabilities of answering the item correctly after matching on the ability level that the item is intended to measure (Zumbo, 1999). The focus of DIF is on the behavior of correct responses, which is most directly related to test outcomes (test scores) and test characteristics (reliability, validity, etc.). Green, Crone, and Folk (1989) extend the concept of DIF to distractors (i.e., incorrect response options in multiple-choice items). The purpose of differential distractor functioning (DDF) analysis is to flag test items in which distractors are chosen differently by different groups of examinees. As long as individual items are scored dichotomously (i.e., correct vs. incorrect), which is the case for most tests, the behavior of distractors and their group differences does not always affect resulting scores and their interpretations. When we observe DDF, however, it suggests that those items probably mean something different for different groups of examinees, and the test scores cannot be interpreted in the same manner for all groups (Green et al., 1989). More importantly, if examinees in one group tend to choose a certain distractor instead of a correct response more often than those in the other group, it does affect resulting scores. Thus, DIF and DDF analyses are both important to identify potentially biased items.
In usual DIF analysis, the proportion of correct responses is compared between the reference and target groups conditional on some kind of overall test score (number-correct scores, scale scores, ability scores in the item response theory, etc.) that represents the ability that the test is intended to measure (hereafter it is called the ability proxy). This is because a test is usually constructed so that correct responses to individual items have high correlation with the ability proxy, and observed (unconditional) difference in proportion of correct responses between the reference and target groups of examinees may be simply due to different average ability levels. Thus, factors that may lead to item bias should be examined only after controlling for the effect of ability proxy on item responses. The same principle may be applied to DDF analysis as well. As Green et al. (1989) state, item analysis often reveals that “different distractors are chosen by persons of different ability levels” (p. 148). Thus, group comparisons should be made conditionally on ability in DDF analysis as well.

PartnershipforAccessibleReadingAssessment �
Some studies specifically focus on DDF using incorrect responses only (e.g., Abedi et al., 2007b; Green et al., 1989). This approach is appealing because it enables simple interpretations and including the correct response in the model sometimes overwhelms subtle DDF (Green et al., 1989). However, DIF and DDF are not exclusive to each other. An item exhibiting DIF is likely to show DDF for one or more other response options, because responses to different response options are dependent on each other (i.e., a larger proportion for a response option implies a smaller proportion for at least one other response option). Moreover, DDF is more serious if it triggers DIF, that is, examinees in one group are attracted by a distractor more easily than those in another group and as a result they are less likely to choose the correct response.
Given the above considerations, this study will employ multinomial logistic regression. By multinomial logistic regression we model the probabilities of all response options in each test item as functions of the ability proxy. This lets us draw a whole picture of the behavior of all response options, whether correct or incorrect, for each item; that is, we can examine DIF and DDF simultaneously. In contrast, Abedi et al. (2007b) employed binary logistic regression, in which they only focused on one particular distractor for each item. Although this approach may be more sensitive to DDF of that particular distractor, it may overlook DDF for other distractors and DIF for the correct response.
This study is also concerned with the pattern of omitted responses as another important characteristic of test items. Although several explanations are possible such as fatigue and limited testing time, a general explanation is that cognitive demands of test items overwhelm examinees’ motivation and ability to complete a test (e.g., Stone, Stone, & Gueutal, 1990, for general cognitive ability testing). Omitted responses are usually taken as incorrect responses, or at least not counted as correct, leading to underestimation of total test scores and lower precision of those scores. Thus, if an item is omitted by one group of examinees more often than by examinees in other groups, resulting test scores may not be equivalent across groups and the cause should be investigated.
This study also differs from earlier test item analysis studies in the PARA project in that data in this study permits analyses by discrete disability categories. Previous studies have been limited to findings regarding the entire group of students with disabilities. The data in this study lets us see whether different findings are obtained for students with different kinds of disabilities.
The purpose of this study is to flag potentially biased items for students with various kinds of disabilities, using data from state reading assessments. Although DIF, DDF, or differential omission frequency (DOF) do not immediately imply item bias, results provide clues to review characteristics of extant items that could cause biases and to design test items that are equally accessible to all students.

� ExaminingDIF,DDF,andOmitRatebyDiscreteDisabilityCategories
Research Questions
This study investigates the following research questions:
1. Do items in the reading tests exhibit differential item functioning (DIF) or differential distractor functioning (DDF) for students with disabilities?
2. Are the amounts of DIF/DDF affected by item locations? Is there any systematic difference in terms of the pattern of DIF/DDF across different disability groups?
3. Does occurrence of omitted responses differ for students with disabilities? Is it affected by item locations?
4. Are the above differences, if any, different between the 3rd and 5th graders?
Methodology
Data Source
The Minnesota Department of Education provided two data sets that are analyzed in this study. Both are part of Minnesota’s spring 2003 administration of statewide reading assessments. One dataset is for 3rd graders, and the other dataset for 5th graders. These datasets are analyzed separately.
The grade 3 data contain demographic information and item responses from 57,071 students who had valid test scores on the 2003 state reading test. The gender percentages of these students were 51.1% males and 48.9% females. Ethnic make up included American Indian (2.0%), Asian (5.7%), Hispanic (4.9%), African-American (7.8%), and Caucasian (79.7%). Disability information for these students shows 88.1% of the students without disabilities and 11.9% with disabilities. Among those who have disabilities, 35.9% (or 4.3% of all students) were classified as having speech/language impairments (SLI), 33.1% (or 3.9% of all students) as having learning disabilities (LD), and 11.3% (or 1.3% of all students) as having emotional behavior disorders (EBD). Each of the other types of disabilities categories had less than 1% of all students. The population percentages of disabilities reported for this state for the 26th Annual Report to Congress on the Implementation of the Individuals with Disabilities Education Act (U.S. Department of Education, 2006) showed that 11.0% of all students of age 6-17 in the state in the fall of 2002 had disabilities and that among those who had disabilities, 16.7% (or 1.8% of all students) had SLI, 37.7% (or 4.2% of all students) had LD, and 17.6% (or 1.9% of all students) had EBD. We did not request explanations for the discrepancies between the population percentages and the proportions of students with SLI, LD, and EBD who took this test. Item characteristics are compared between the students without disabilities (the reference group; N = 50,290) and each of the disability groups (SLI, LD, and EBD—the
28
Table 1. Percentage of State Blueprints or Specifications Dedicated to Assessment Purposes*
Grade 4 Grade 8 Purpose (Construct) Count Percentage Count Percentage Foundational Skills Vocabulary 17 35 17 35 Word Identification 14 29 6 12 Word Analysis 8 16 8 16 Fluency 4 8 4 8 Comprehension Reading Comprehension 28 57 29 59 Comprehension: Literary Text 12 24 13 27 Comprehension: Expository Text 8 16 11 22 Analysis and Interpretation Analysis and Interpretation (general) 18 37 18 37 Analysis: Literary Text 12 24 13 27 Analysis: Expository Text 10 20 10 20
*Based on 49 states
PartnershipforAccessibleReadingAssessment �
target groups; N = 2,436, 2,242, and 768, respectively).
The Grade 3 Reading Test consisted of 49 items, out of which there were 46 multiple-choice items and 3 constructed-response items. All multiple-choice items have four response options, denoted by A, B, C, and D. Only the multiple-choice items are analyzed in this study. For the 46 multiple-choice items, the average number-correct score was 36.0 with standard deviation 8.51. Cronbach’s alpha, which indicated reliability of the 46-item test, was .92; thus, the test items were highly internally consistent. Scale scores were also provided in the data, with mean 1513 and standard deviation 202.4. Scale scores were standardized and used as an ability proxy in the DIF/DDF and DOF analyses described below.
The grade 5 data contained demographic information and item responses from 60,364 students (51.1% males and 48.9% females) who had valid test scores on the 2003 state reading test. Ethnic background of these students was American Indian (2.2%), Asian (5.5%), Hispanic (4.1%), African-American (7.7%), and Caucasian (80.5%). Disability information indicated that 86.4% of the students did not have a disability and 13.6% do. Among those who had disabilities, 35.3% (or 4.8% of all students) were categorized as having LD, 26.9% (or 3.6% of all students) as SLI, 14.6% (or 2.0% of all students) as EBD. Each of the other types of disabilities rounded to 1% or less of all students. As with the grade 3 test data, these disability percentages were somewhat different from the population percentages reported in the 26th Annual Report to Congress on the Implementation of the Individuals with Disabilities Education Act (U.S. Department of Education, 2006). That report showed that 11.0% of all students of age 6-17 in the state in the fall of 2002 had disabilities and that among those who have disabilities, 16.7% (or 1.8% of all students) had SLI, 37.7% (or 4.2% of all students) had LD, and 17.6% (or 1.9% of all students) had EBD. Item characteristics are compared between the students without disabilities (N = 52,177) and each of the SLI, LD, and EBD groups (N = 2,201, 2,889, and 1,192, respectively).
The Grade 5 Reading Test consisted of 49 items, out of which there were 46 multiple-choice items and 3 constructed-response items. All multiple-choice items had four response options. Only the multiple-choice items were analyzed in this study. For the 46 multiple-choice items, the average number-correct score was 36.7 with standard deviation 8.06. Cronbach’s alpha was .91; thus, the test items were highly internally consistent. Scale scores were also provided in the data (mean 1567, standard deviation 226.7). They were standardized and used as an ability proxy in the DIF/DDF and DOF analyses described below.
Both grade 3 and grade 5 tests were administered in three sessions. In each section, two or three passages were presented and examinees answered five to seven items for each passage. Tables 1 and 2 show how individual items are organized under sessions and passages for grades 3 and 5, respectively. All items were administered in the same order for all examinees.

� ExaminingDIF,DDF,andOmitRatebyDiscreteDisabilityCategories
Table 1. Composition of Grade 3 Reading Test
Session Passage Item Number of Items1 1 1-5 5
2 6-10 53 11-17 6 (7)
2 4 18-23 65 24-29 66 30-35 5 (6)
3 7 36-42 78 43-49 6 (7)
Note. Items 17, 35, and 49 are constructed-response items and are not used in the analyses. The last column indicates the numbers of items that are used in the analyses; the actual numbers of items in the test are shown in parentheses.
Table 2. Composition of Grade 5 Reading Test
Session Passage Item Number of Items1 1 1-7 7
2 8-13 63 14-19 5 (6)
2 4 21-26 65 27-33 76 34-38 4 (5)
3 7 39-44 68 45-50 5 (6)
Note. Items 19, 38, and 50 are constructed-response items and item 20 is not a test question. These items are not used in the analyses. The last column indicates the numbers of items that are used in the analyses; the actual numbers of items in the test are shown in parentheses.
Differential Item/Distractor Functioning Analysis
In this study, DIF and DDF were examined at the same time by multi-step multinomial logistic regression analysis. The dependent variable is the raw item response, which is a categorical variable with four possible values corresponding to the four response options. The multi-step analysis is conducted in two steps as follows. In the first step, the ability proxy is entered in the model as the only independent variable (Model 1). Standardized scale scores1 are used as the ability proxy. The multinomial logistic regression model estimates a response characteristic curve (RCC) for each response option, which represents the probability of choosing the response option as a function of the ability
1Scale scores are provided by the state, and reflect information not only from multiple-choice items but also from constructed-response items that are included in the tests. They are not number-correct or simple total scores.
PartnershipforAccessibleReadingAssessment �
proxy. Pseudo R2 (Nagelkerke’s R2; Nagelkerke, 1991), which is an analogue to R2 in the normal linear regression, is calculated to approximate the variance explained by the ability proxy. In the second step, a grouping variable that separates students without disabilities (the reference group) and students with disabilities (the target group: SLI, LD, or EBD) is entered in the model as a main effect and an interaction with the ability proxy (Model 2) and the corresponding pseudo R2 is obtained. Model 2 assumes that RCCs vary across groups, while in Model 1 RCCs are assumed to be the same for the entire sample. Then, Models 1 and 2 are compared by the likelihood ratio test and by calculating the difference between the pseudo R2s from the two models. Items for which the likelihood ratio test is significant at α = .01 and the pseudo R2 difference is no smaller than .003 are flagged for DIF/DDF.2 The pseudo R2 difference is a measure of effect size independent of the sample size, and used in addition to the significance test to avoid picking up trivially significant cases due to the large sample sizes. In order to examine the effect of item location on DIF/DDF, pseudo R2 differences are plotted against item locations for each disability category (SLI, LD, and EBD).
Flagged items are then subjected to further analysis to examine what contributed to the observed differential functioning – DIF, DDF, or both. For this purpose, discrepancy between RCCs from two groups is computed for each response option for each item using the mean absolute difference (MAD), which denotes how far one RCC is departed from the other on average over the entire ability scale. Response options with larger MADs are considered to contribute to the observed differential functioning. If the correct response option exhibits the largest MAD, then the differential functioning is mainly due to DIF, while incorrect response options yielding larger MADs contribute to DDF. Details of the above analyses are given in Appendix A.
Differential Omission Frequency Analysis
A strategy that is basically the same as the DIF/DDF analysis is taken for the DOF analysis. The dependent variable is binary: whether the response is omitted or not. Accordingly, the multinomial logistic regression in the DIF/DDF analysis is now simplified to the ordinary binary logistic regression, by which an omitted response curve (ORC) is estimated for each item for each group of examinees. Since ability may be responsible for occurrence of omitted responses (for example, examinees of lower ability may skip items more easily; Stone et al., 1990), the ability proxy is entered in the model (Model 1). Then, another model in which a main effect of the grouping variable and its interaction with the ability proxy are added is fitted (Model 2). Pseudo R2 differences are plotted against item locations, and items that are significant at .01 level on the likelihood ratio test between Models 1 and 2 and yield pseudo R2 difference no smaller than .003 are flagged. Details are given in Appendix A.
2This threshold value is adopted from Abedi et al. (2007b) for consistency, on the ground that decent regression coefficients (odds ratios) are usually present when the R2 difference exceeds .003.
� ExaminingDIF,DDF,andOmitRatebyDiscreteDisabilityCategories
Results
Grade 3 DIF/DDF Analysis
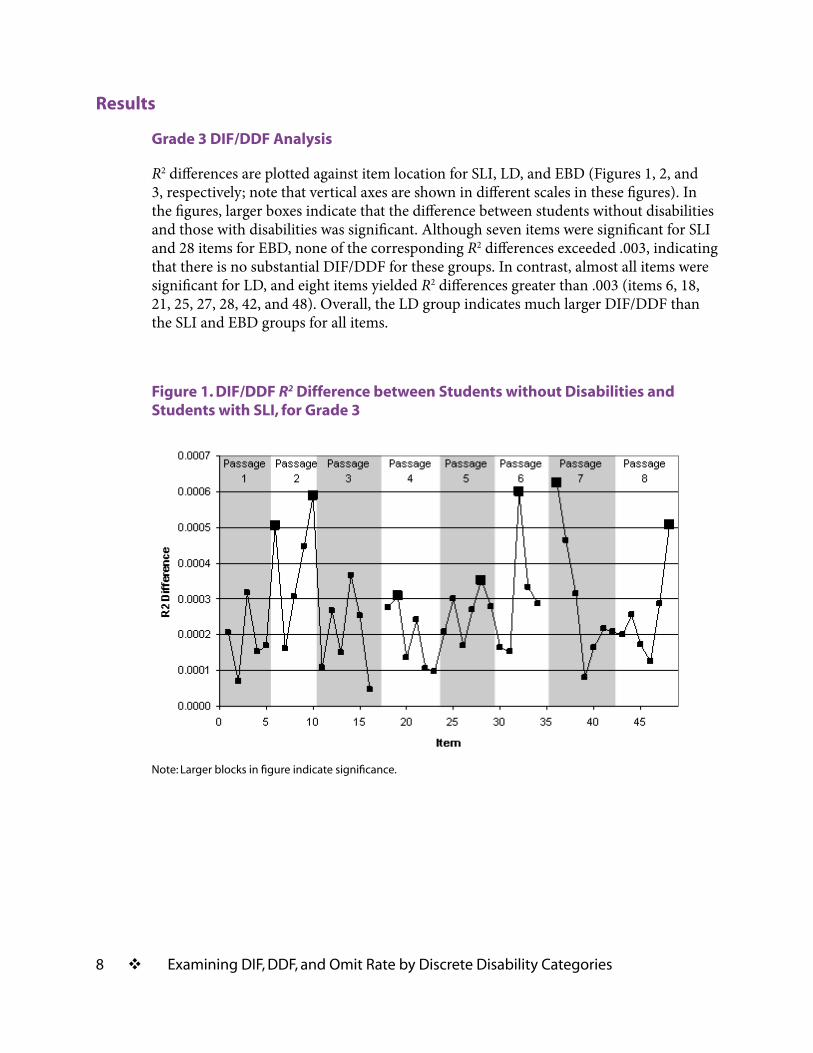
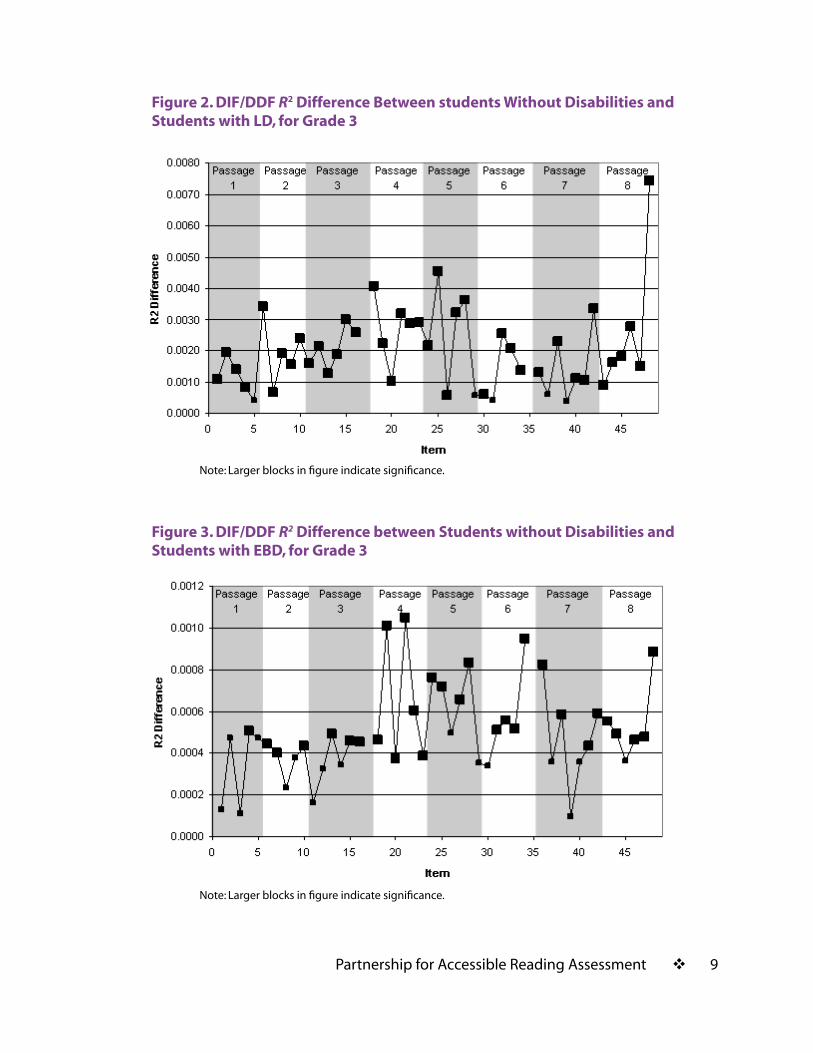
R2 differences are plotted against item location for SLI, LD, and EBD (Figures 1, 2, and 3, respectively; note that vertical axes are shown in different scales in these figures). In the figures, larger boxes indicate that the difference between students without disabilities and those with disabilities was significant. Although seven items were significant for SLI and 28 items for EBD, none of the corresponding R2 differences exceeded .003, indicating that there is no substantial DIF/DDF for these groups. In contrast, almost all items were significant for LD, and eight items yielded R2 differences greater than .003 (items 6, 18, 21, 25, 27, 28, 42, and 48). Overall, the LD group indicates much larger DIF/DDF than the SLI and EBD groups for all items.
Figure 1. DIF/DDF R2 Difference between Students without Disabilities and Students with SLI, for Grade 3
Note:Largerblocksinfigureindicatesignificance.
PartnershipforAccessibleReadingAssessment �
Figure 2. DIF/DDF R2 Difference Between students Without Disabilities and Students with LD, for Grade 3
Figure 3. DIF/DDF R2 Difference between Students without Disabilities and Students with EBD, for Grade 3
Note:Largerblocksinfigureindicatesignificance.
Note:Largerblocksinfigureindicatesignificance.
�0 ExaminingDIF,DDF,andOmitRatebyDiscreteDisabilityCategories
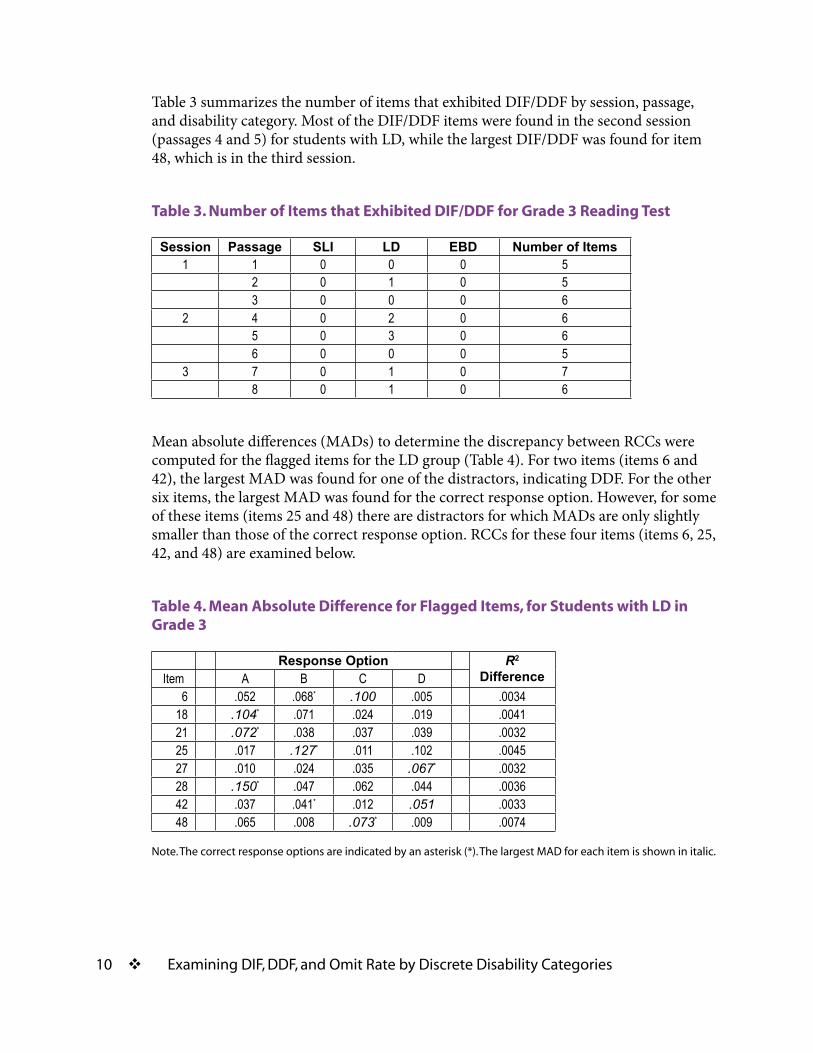
Table 3 summarizes the number of items that exhibited DIF/DDF by session, passage, and disability category. Most of the DIF/DDF items were found in the second session (passages 4 and 5) for students with LD, while the largest DIF/DDF was found for item 48, which is in the third session.
Table 3. Number of Items that Exhibited DIF/DDF for Grade 3 Reading Test
Session Passage SLI LD EBD Number of Items1 1 0 0 0 5
2 0 1 0 53 0 0 0 6
2 4 0 2 0 65 0 3 0 66 0 0 0 5
3 7 0 1 0 78 0 1 0 6
Mean absolute differences (MADs) to determine the discrepancy between RCCs were computed for the flagged items for the LD group (Table 4). For two items (items 6 and 42), the largest MAD was found for one of the distractors, indicating DDF. For the other six items, the largest MAD was found for the correct response option. However, for some of these items (items 25 and 48) there are distractors for which MADs are only slightly smaller than those of the correct response option. RCCs for these four items (items 6, 25, 42, and 48) are examined below.
Table 4. Mean Absolute Difference for Flagged Items, for Students with LD in Grade 3
Response Option R2
DifferenceItem A B C D6 .052 .068* .100 .005 .0034
18 .104* .071 .024 .019 .004121 .072* .038 .037 .039 .003225 .017 .127* .011 .102 .004527 .010 .024 .035 .067* .003228 .150* .047 .062 .044 .003642 .037 .041* .012 .051 .003348 .065 .008 .073* .009 .0074
Note.Thecorrectresponseoptionsareindicatedbyanasterisk(*).ThelargestMADforeachitemisshowninitalic.
PartnershipforAccessibleReadingAssessment ��
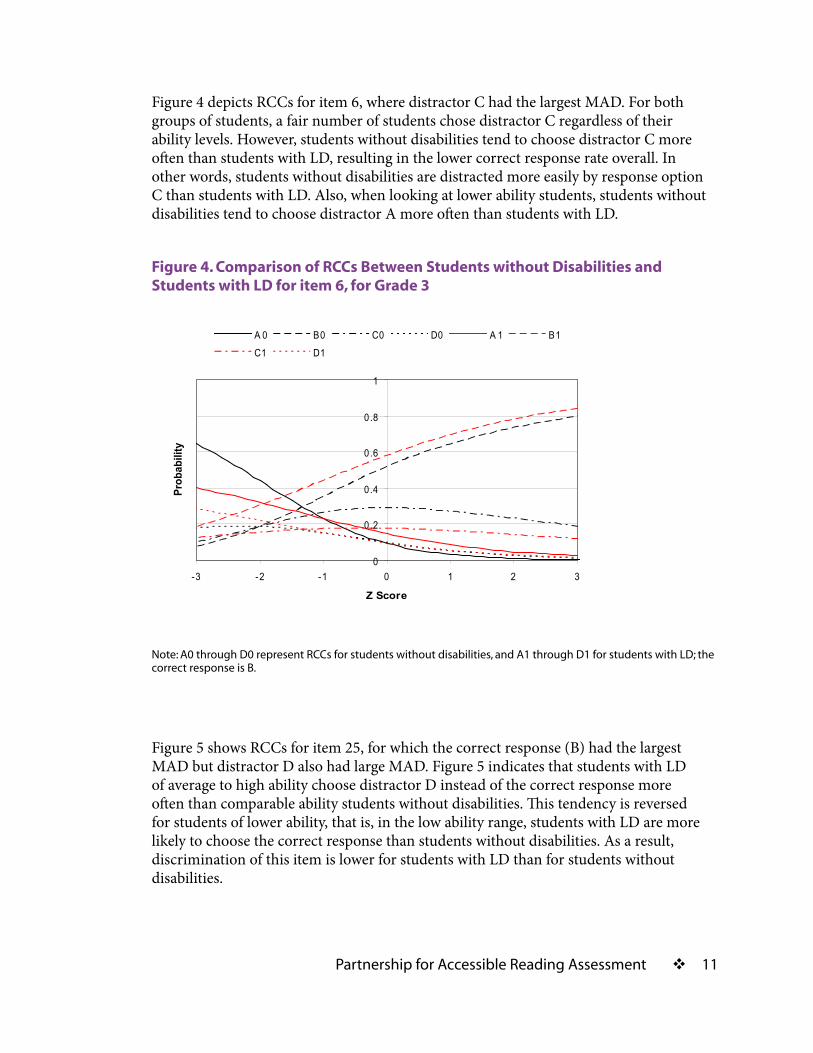
Figure 4 depicts RCCs for item 6, where distractor C had the largest MAD. For both groups of students, a fair number of students chose distractor C regardless of their ability levels. However, students without disabilities tend to choose distractor C more often than students with LD, resulting in the lower correct response rate overall. In other words, students without disabilities are distracted more easily by response option C than students with LD. Also, when looking at lower ability students, students without disabilities tend to choose distractor A more often than students with LD.
Figure 4. Comparison of RCCs Between Students without Disabilities and Students with LD for item 6, for Grade 3
0
0.2
0.4
0.6
0.8
1
-3 -2 -1 0 1 2 3
Z Score
Prob
abili
ty
A 0 B0 C0 D0 A 1 B1C1 D1
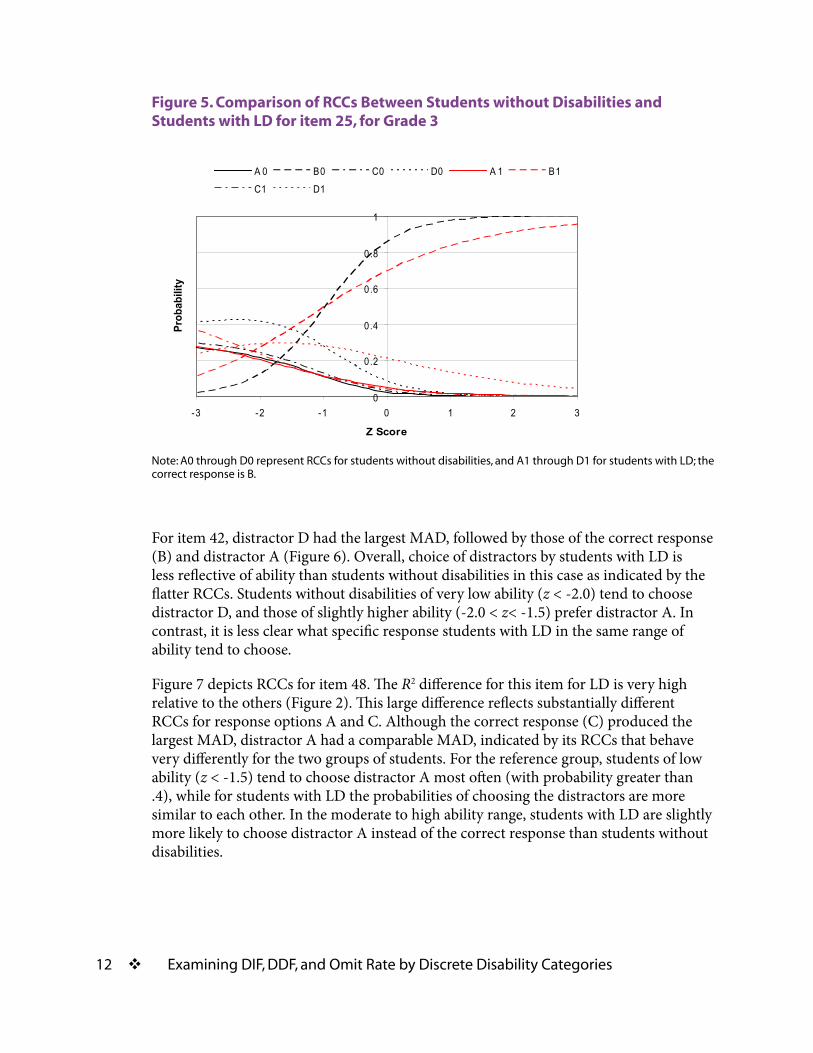
Figure 5 shows RCCs for item 25, for which the correct response (B) had the largest MAD but distractor D also had large MAD. Figure 5 indicates that students with LD of average to high ability choose distractor D instead of the correct response more often than comparable ability students without disabilities. This tendency is reversed for students of lower ability, that is, in the low ability range, students with LD are more likely to choose the correct response than students without disabilities. As a result, discrimination of this item is lower for students with LD than for students without disabilities.
Note:A0throughD0representRCCsforstudentswithoutdisabilities,andA�throughD�forstudentswithLD;thecorrectresponseisB.
�� ExaminingDIF,DDF,andOmitRatebyDiscreteDisabilityCategories
Figure 5. Comparison of RCCs Between Students without Disabilities and Students with LD for item 25, for Grade 3
0
0.2
0.4
0.6
0.8
1
-3 -2 -1 0 1 2 3
Z Score
Prob
abili
tyA 0 B0 C0 D0 A 1 B1C1 D1
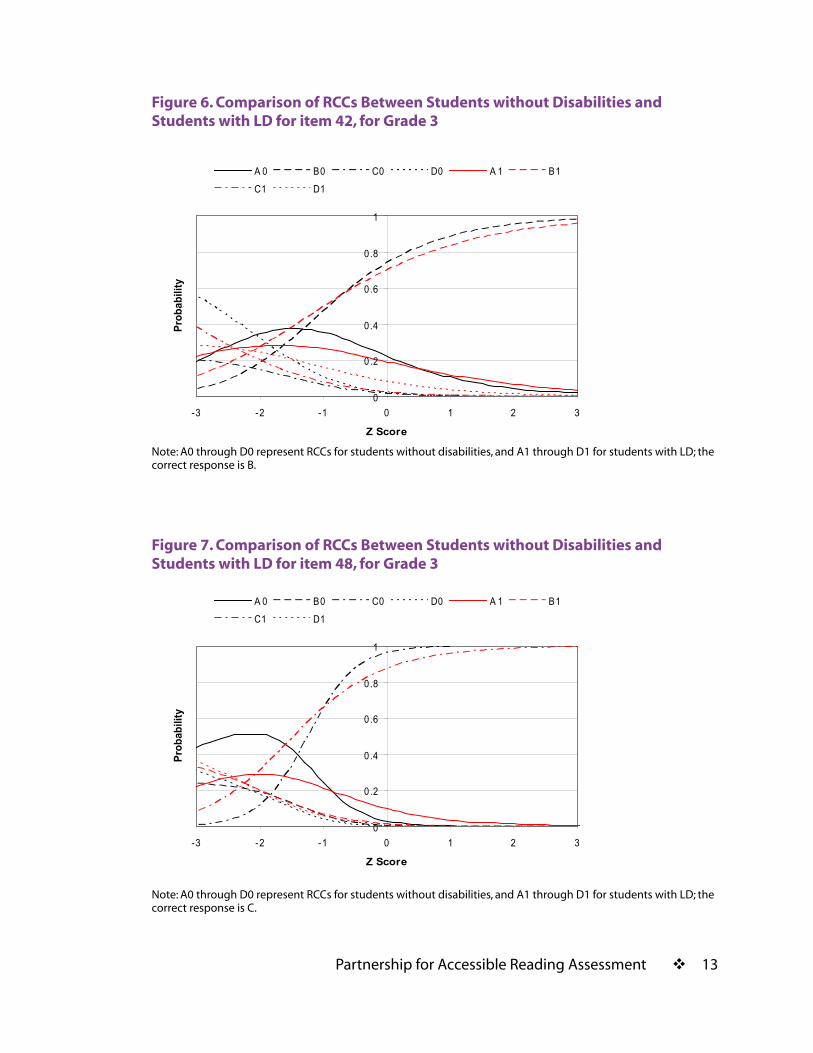
For item 42, distractor D had the largest MAD, followed by those of the correct response (B) and distractor A (Figure 6). Overall, choice of distractors by students with LD is less reflective of ability than students without disabilities in this case as indicated by the flatter RCCs. Students without disabilities of very low ability (z < -2.0) tend to choose distractor D, and those of slightly higher ability (-2.0 < z< -1.5) prefer distractor A. In contrast, it is less clear what specific response students with LD in the same range of ability tend to choose.
Figure 7 depicts RCCs for item 48. The R2 difference for this item for LD is very high relative to the others (Figure 2). This large difference reflects substantially different RCCs for response options A and C. Although the correct response (C) produced the largest MAD, distractor A had a comparable MAD, indicated by its RCCs that behave very differently for the two groups of students. For the reference group, students of low ability (z < -1.5) tend to choose distractor A most often (with probability greater than .4), while for students with LD the probabilities of choosing the distractors are more similar to each other. In the moderate to high ability range, students with LD are slightly more likely to choose distractor A instead of the correct response than students without disabilities.
Note:A0throughD0representRCCsforstudentswithoutdisabilities,andA�throughD�forstudentswithLD;thecorrectresponseisB.
PartnershipforAccessibleReadingAssessment ��
Figure 6. Comparison of RCCs Between Students without Disabilities and Students with LD for item 42, for Grade 3
0
0.2
0.4
0.6
0.8
1
-3 -2 -1 0 1 2 3
Z Score
Prob
abili
tyA 0 B0 C0 D0 A 1 B1C1 D1
Figure 7. Comparison of RCCs Between Students without Disabilities and Students with LD for item 48, for Grade 3
0
0.2
0.4
0.6
0.8
1
-3 -2 -1 0 1 2 3
Z Score
Prob
abili
ty
A 0 B0 C0 D0 A 1 B1C1 D1
Note:A0throughD0representRCCsforstudentswithoutdisabilities,andA�throughD�forstudentswithLD;thecorrectresponseisB.
Note:A0throughD0representRCCsforstudentswithoutdisabilities,andA�throughD�forstudentswithLD;thecorrectresponseisC.
�� ExaminingDIF,DDF,andOmitRatebyDiscreteDisabilityCategories
Grade 3 DOF Analysis
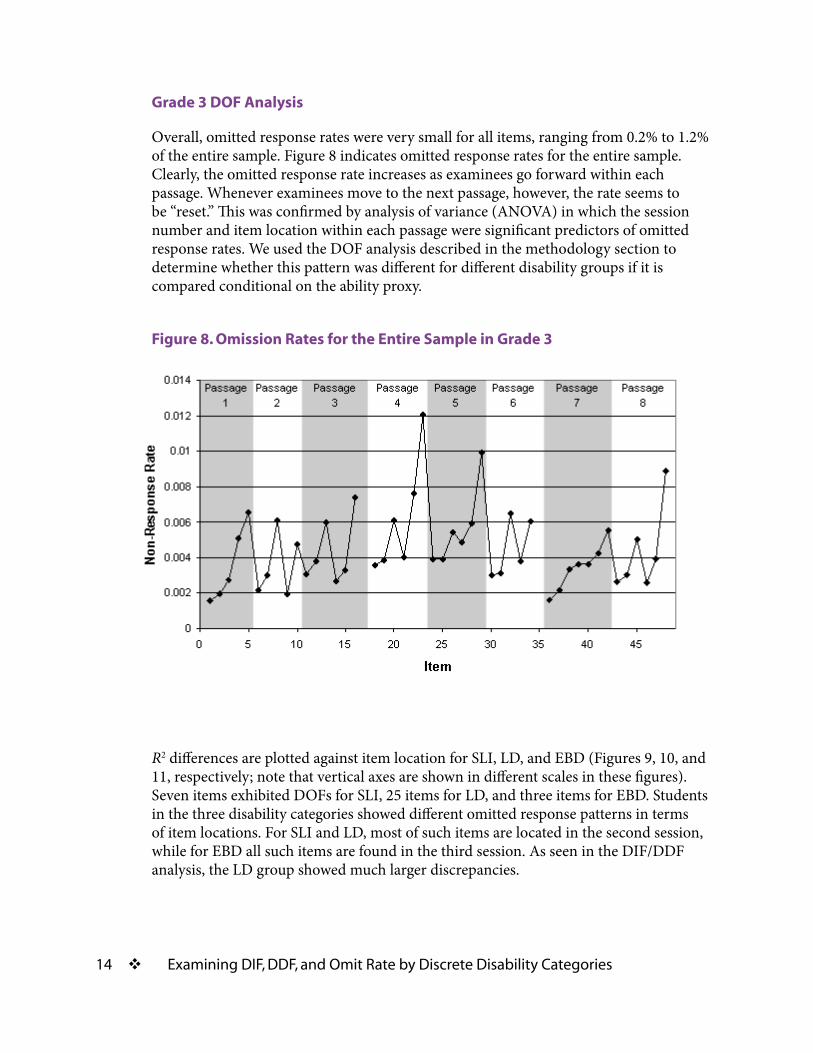
Overall, omitted response rates were very small for all items, ranging from 0.2% to 1.2% of the entire sample. Figure 8 indicates omitted response rates for the entire sample. Clearly, the omitted response rate increases as examinees go forward within each passage. Whenever examinees move to the next passage, however, the rate seems to be “reset.” This was confirmed by analysis of variance (ANOVA) in which the session number and item location within each passage were significant predictors of omitted response rates. We used the DOF analysis described in the methodology section to determine whether this pattern was different for different disability groups if it is compared conditional on the ability proxy.
Figure 8. Omission Rates for the Entire Sample in Grade 3
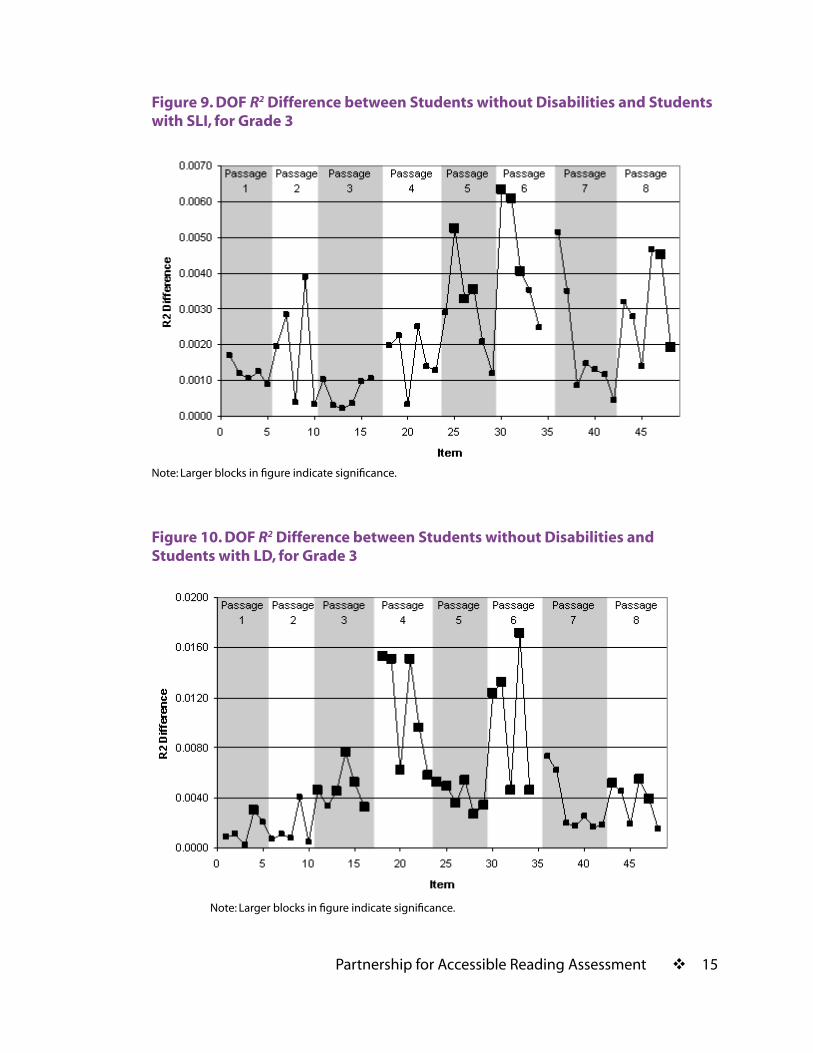
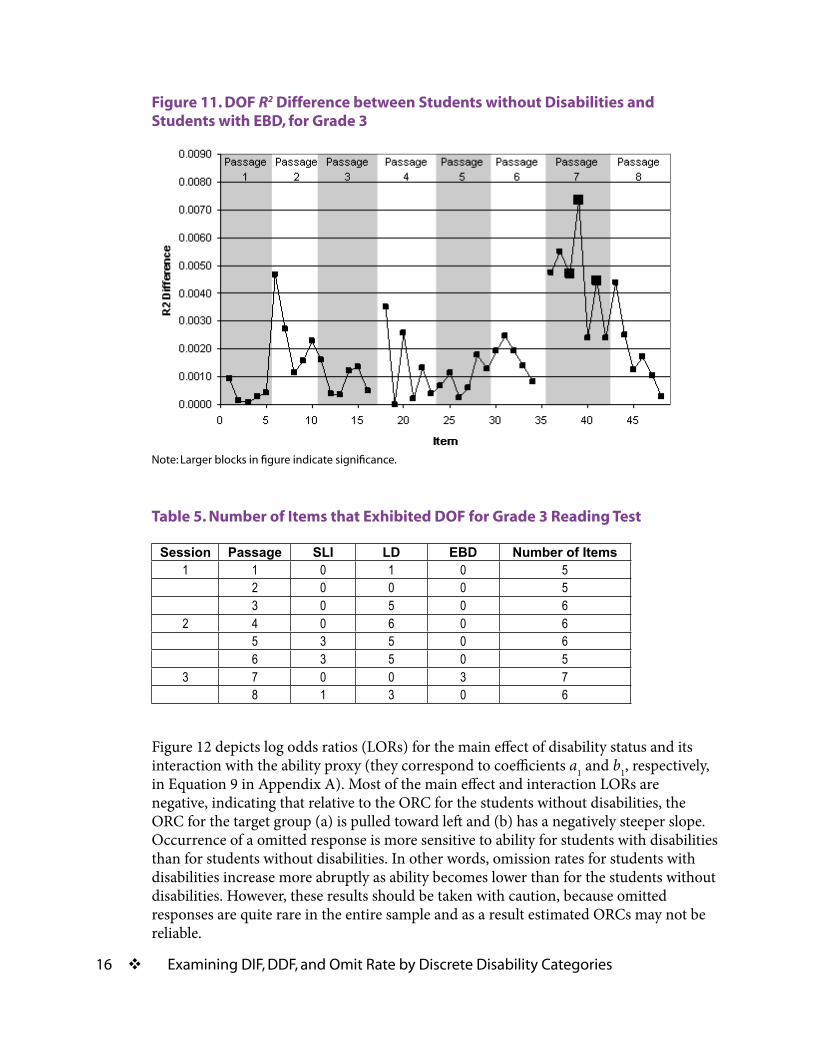
R2 differences are plotted against item location for SLI, LD, and EBD (Figures 9, 10, and 11, respectively; note that vertical axes are shown in different scales in these figures). Seven items exhibited DOFs for SLI, 25 items for LD, and three items for EBD. Students in the three disability categories showed different omitted response patterns in terms of item locations. For SLI and LD, most of such items are located in the second session, while for EBD all such items are found in the third session. As seen in the DIF/DDF analysis, the LD group showed much larger discrepancies.
PartnershipforAccessibleReadingAssessment ��
Figure 9. DOF R2 Difference between Students without Disabilities and Students with SLI, for Grade 3
Figure 10. DOF R2 Difference between Students without Disabilities and Students with LD, for Grade 3
Note:Largerblocksinfigureindicatesignificance.
Note:Largerblocksinfigureindicatesignificance.
�� ExaminingDIF,DDF,andOmitRatebyDiscreteDisabilityCategories
Figure 11. DOF R2 Difference between Students without Disabilities and Students with EBD, for Grade 3
Table 5. Number of Items that Exhibited DOF for Grade 3 Reading Test
Session Passage SLI LD EBD Number of Items1 1 0 1 0 5
2 0 0 0 53 0 5 0 6
2 4 0 6 0 65 3 5 0 66 3 5 0 5
3 7 0 0 3 78 1 3 0 6
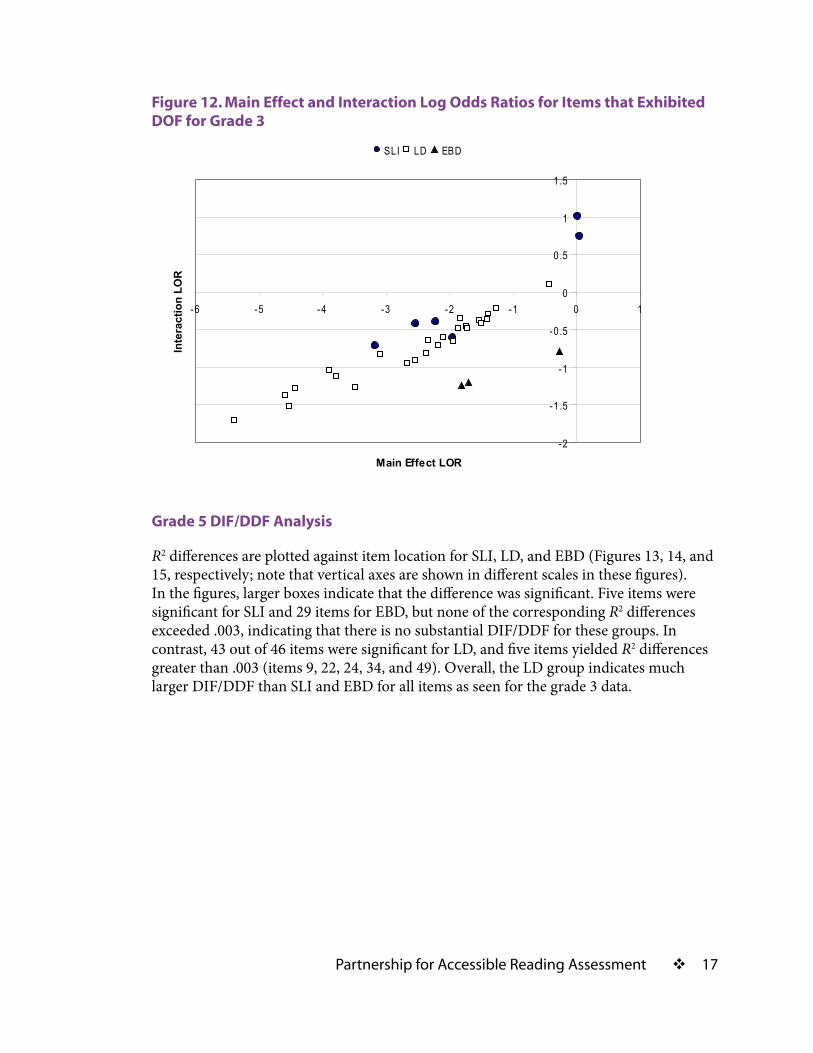
Figure 12 depicts log odds ratios (LORs) for the main effect of disability status and its interaction with the ability proxy (they correspond to coefficients a1 and b1, respectively, in Equation 9 in Appendix A). Most of the main effect and interaction LORs are negative, indicating that relative to the ORC for the students without disabilities, the ORC for the target group (a) is pulled toward left and (b) has a negatively steeper slope. Occurrence of a omitted response is more sensitive to ability for students with disabilities than for students without disabilities. In other words, omission rates for students with disabilities increase more abruptly as ability becomes lower than for the students without disabilities. However, these results should be taken with caution, because omitted responses are quite rare in the entire sample and as a result estimated ORCs may not be reliable.
Note:Largerblocksinfigureindicatesignificance.
PartnershipforAccessibleReadingAssessment ��
Grade 5 DIF/DDF Analysis
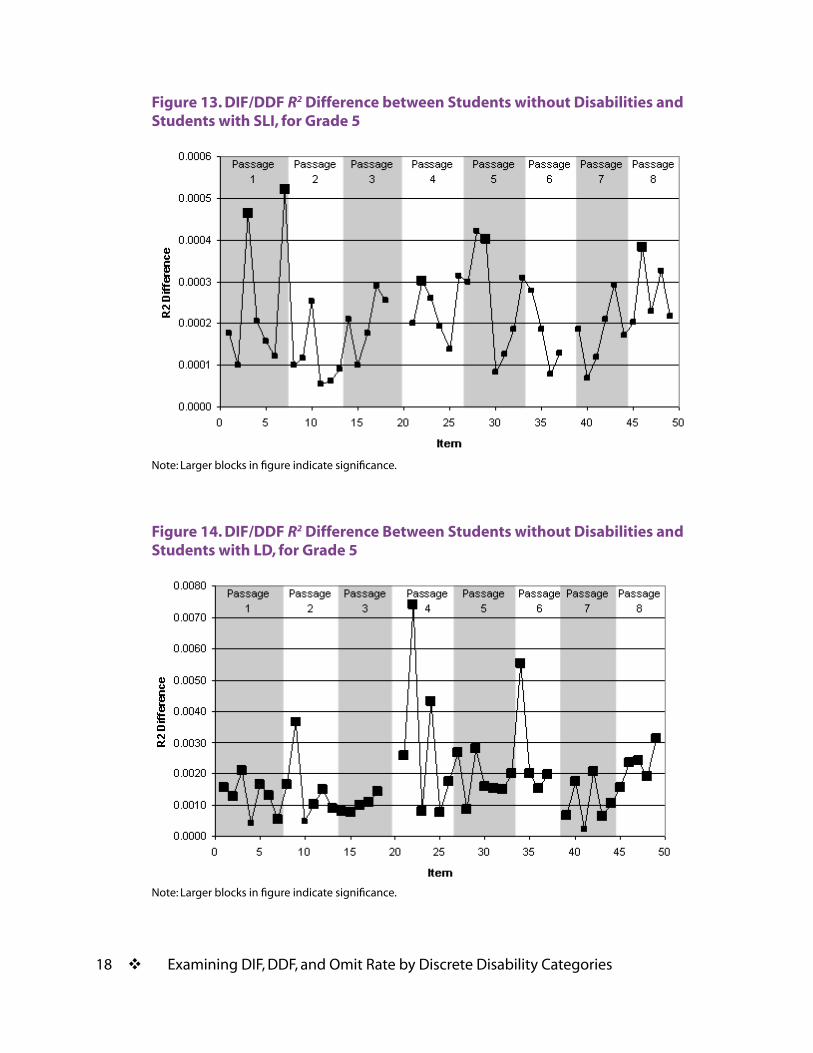
R2 differences are plotted against item location for SLI, LD, and EBD (Figures 13, 14, and 15, respectively; note that vertical axes are shown in different scales in these figures). In the figures, larger boxes indicate that the difference was significant. Five items were significant for SLI and 29 items for EBD, but none of the corresponding R2 differences exceeded .003, indicating that there is no substantial DIF/DDF for these groups. In contrast, 43 out of 46 items were significant for LD, and five items yielded R2 differences greater than .003 (items 9, 22, 24, 34, and 49). Overall, the LD group indicates much larger DIF/DDF than SLI and EBD for all items as seen for the grade 3 data.
Figure 12. Main Effect and Interaction Log Odds Ratios for Items that Exhibited DOF for Grade 3
-2
-1.5
-1
-0.5
0
0.5
1
1.5
-6 -5 -4 -3 -2 -1 0 1
Main Effect LOR
Inte
ract
ion
LOR
SLI LD EBD
�� ExaminingDIF,DDF,andOmitRatebyDiscreteDisabilityCategories
Figure 13. DIF/DDF R2 Difference between Students without Disabilities and Students with SLI, for Grade 5
Figure 14. DIF/DDF R2 Difference Between Students without Disabilities and Students with LD, for Grade 5
Note:Largerblocksinfigureindicatesignificance.
Note:Largerblocksinfigureindicatesignificance.
PartnershipforAccessibleReadingAssessment ��
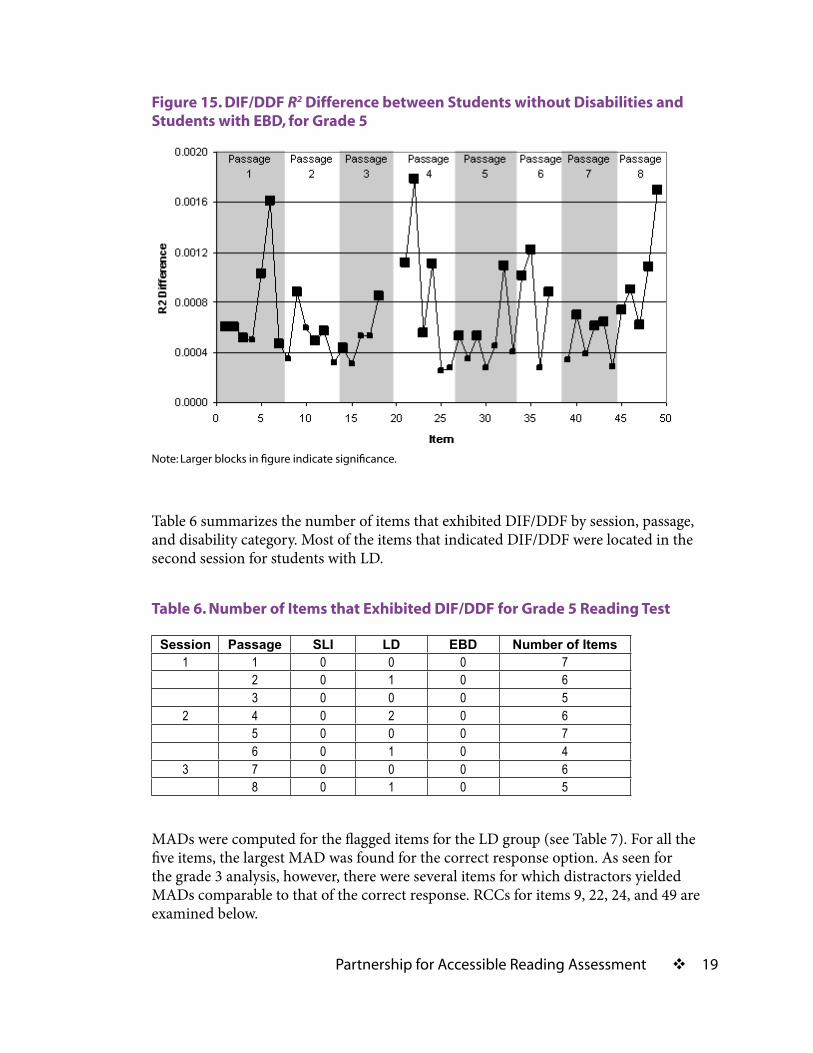
Figure 15. DIF/DDF R2 Difference between Students without Disabilities and Students with EBD, for Grade 5
Table 6 summarizes the number of items that exhibited DIF/DDF by session, passage, and disability category. Most of the items that indicated DIF/DDF were located in the second session for students with LD.
Table 6. Number of Items that Exhibited DIF/DDF for Grade 5 Reading Test
Session Passage SLI LD EBD Number of Items1 1 0 0 0 7
2 0 1 0 63 0 0 0 5
2 4 0 2 0 65 0 0 0 76 0 1 0 4
3 7 0 0 0 68 0 1 0 5
MADs were computed for the flagged items for the LD group (see Table 7). For all the five items, the largest MAD was found for the correct response option. As seen for the grade 3 analysis, however, there were several items for which distractors yielded MADs comparable to that of the correct response. RCCs for items 9, 22, 24, and 49 are examined below.
Note:Largerblocksinfigureindicatesignificance.
�0 ExaminingDIF,DDF,andOmitRatebyDiscreteDisabilityCategories
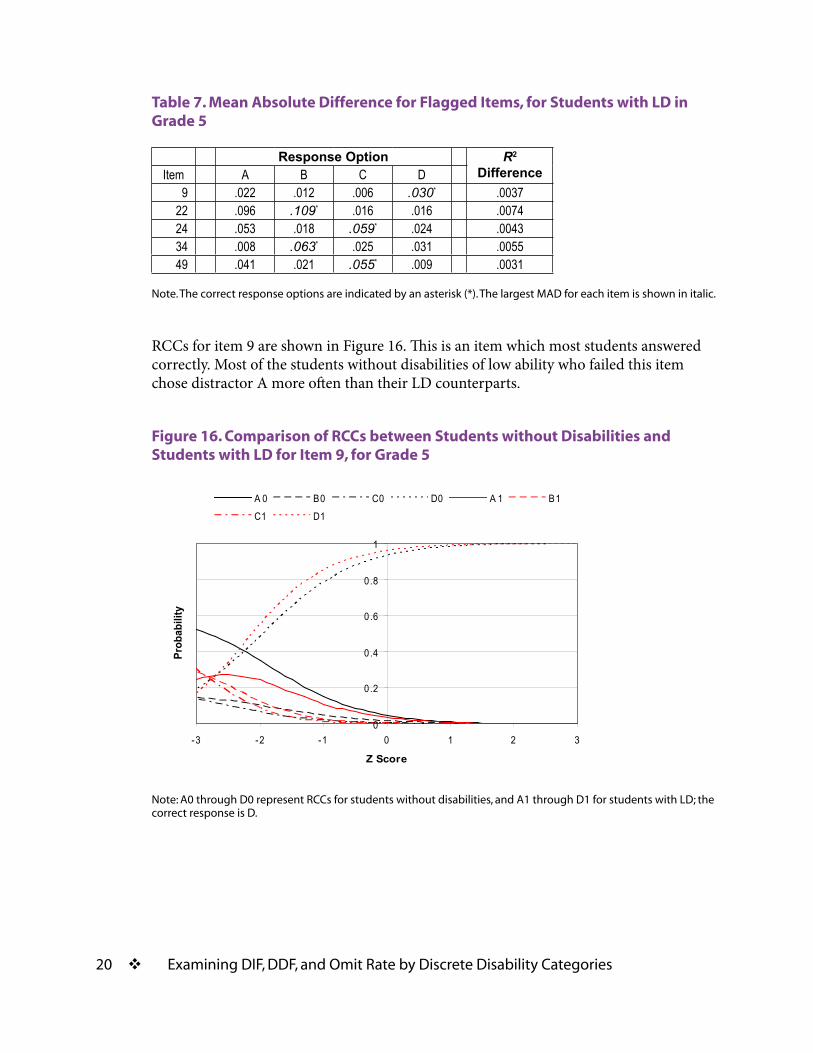
Table 7. Mean Absolute Difference for Flagged Items, for Students with LD in Grade 5
Response Option R2
DifferenceItem A B C D9 .022 .012 .006 .030* .0037
22 .096 .109* .016 .016 .007424 .053 .018 .059* .024 .004334 .008 .063* .025 .031 .005549 .041 .021 .055* .009 .0031
Note.Thecorrectresponseoptionsareindicatedbyanasterisk(*).ThelargestMADforeachitemisshowninitalic.
RCCs for item 9 are shown in Figure 16. This is an item which most students answered correctly. Most of the students without disabilities of low ability who failed this item chose distractor A more often than their LD counterparts.
Figure 16. Comparison of RCCs between Students without Disabilities and Students with LD for Item 9, for Grade 5
0
0.2
0.4
0.6
0.8
1
-3 -2 -1 0 1 2 3
Z Score
Prob
abili
ty
A 0 B0 C0 D0 A 1 B1C1 D1
Note:A0throughD0representRCCsforstudentswithoutdisabilities,andA�throughD�forstudentswithLD;thecorrectresponseisD.
PartnershipforAccessibleReadingAssessment ��
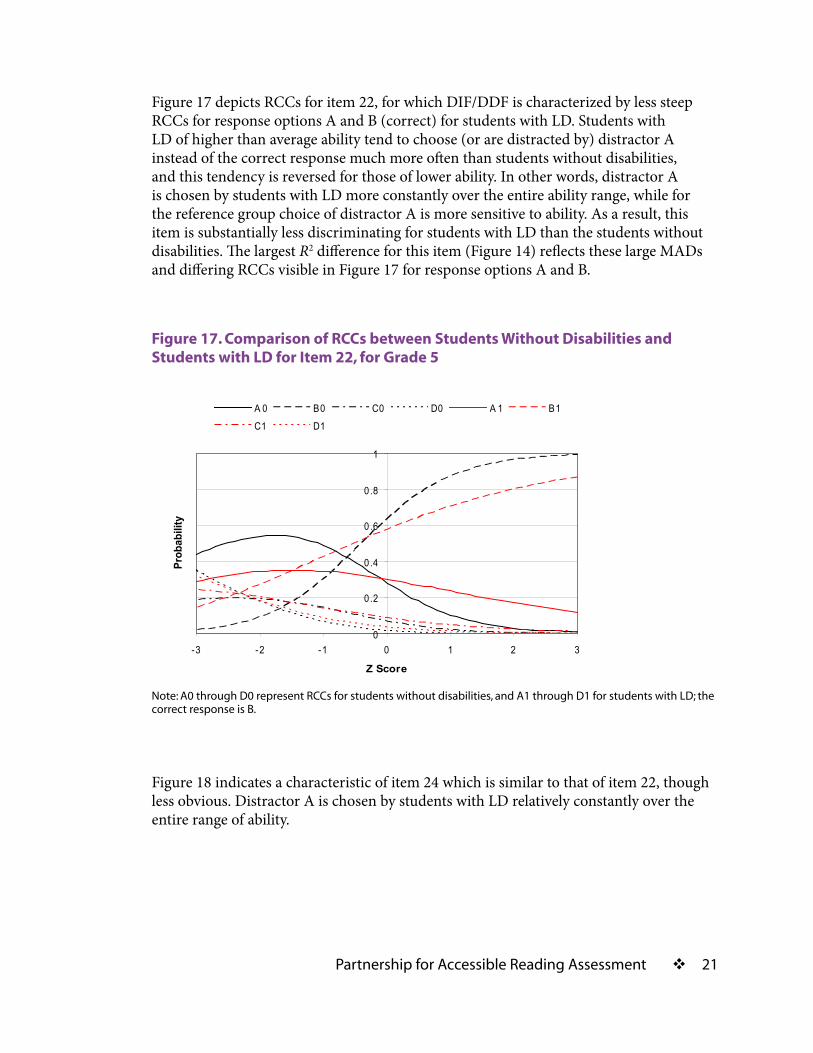
Figure 17 depicts RCCs for item 22, for which DIF/DDF is characterized by less steep RCCs for response options A and B (correct) for students with LD. Students with LD of higher than average ability tend to choose (or are distracted by) distractor A instead of the correct response much more often than students without disabilities, and this tendency is reversed for those of lower ability. In other words, distractor A is chosen by students with LD more constantly over the entire ability range, while for the reference group choice of distractor A is more sensitive to ability. As a result, this item is substantially less discriminating for students with LD than the students without disabilities. The largest R2 difference for this item (Figure 14) reflects these large MADs and differing RCCs visible in Figure 17 for response options A and B.
Figure 17. Comparison of RCCs between Students Without Disabilities and Students with LD for Item 22, for Grade 5
0
0.2
0.4
0.6
0.8
1
-3 -2 -1 0 1 2 3
Z Score
Prob
abili
ty
A 0 B0 C0 D0 A 1 B1C1 D1
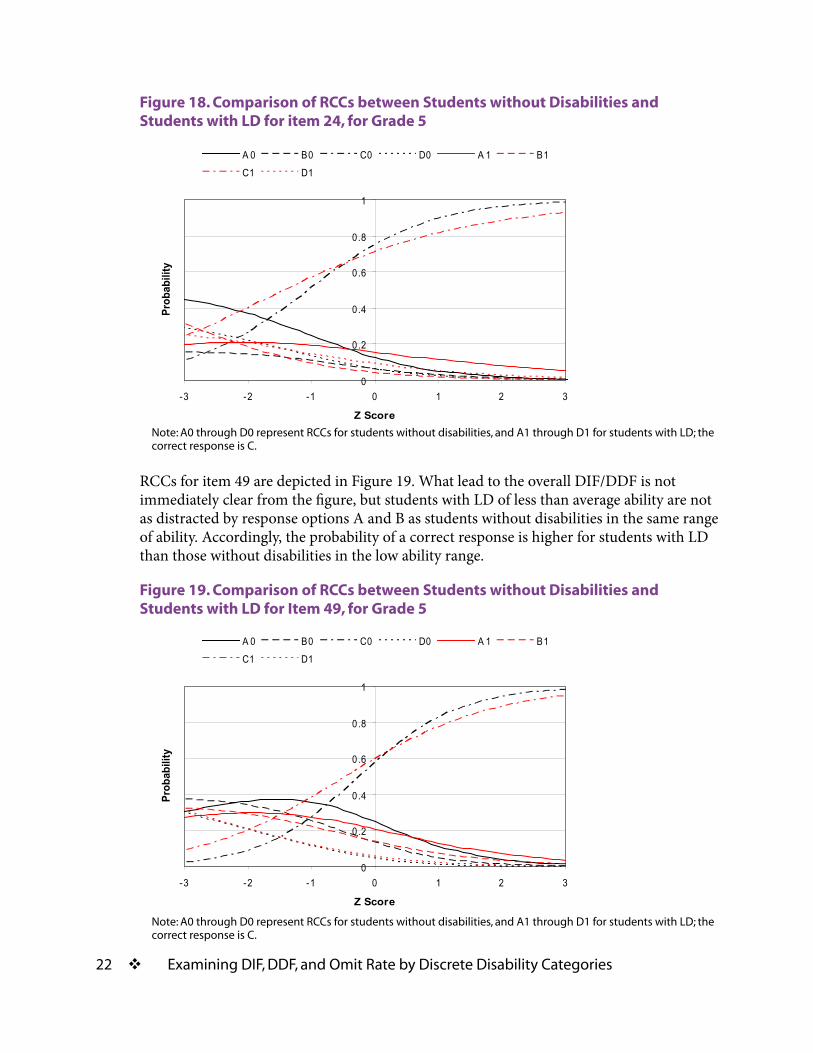
Figure 18 indicates a characteristic of item 24 which is similar to that of item 22, though less obvious. Distractor A is chosen by students with LD relatively constantly over the entire range of ability.
Note:A0throughD0representRCCsforstudentswithoutdisabilities,andA�throughD�forstudentswithLD;thecorrectresponseisB.
�� ExaminingDIF,DDF,andOmitRatebyDiscreteDisabilityCategories
Figure 18. Comparison of RCCs between Students without Disabilities and Students with LD for item 24, for Grade 5
0
0.2
0.4
0.6
0.8
1
-3 -2 -1 0 1 2 3
Z Score
Prob
abili
tyA 0 B0 C0 D0 A 1 B1C1 D1
RCCs for item 49 are depicted in Figure 19. What lead to the overall DIF/DDF is not immediately clear from the figure, but students with LD of less than average ability are not as distracted by response options A and B as students without disabilities in the same range of ability. Accordingly, the probability of a correct response is higher for students with LD than those without disabilities in the low ability range.
Figure 19. Comparison of RCCs between Students without Disabilities and Students with LD for Item 49, for Grade 5
0
0.2
0.4
0.6
0.8
1
-3 -2 -1 0 1 2 3
Z Score
Prob
abili
ty
A 0 B0 C0 D0 A 1 B1C1 D1
Note:A0throughD0representRCCsforstudentswithoutdisabilities,andA�throughD�forstudentswithLD;thecorrectresponseisC.
Note:A0throughD0representRCCsforstudentswithoutdisabilities,andA�throughD�forstudentswithLD;thecorrectresponseisC.
PartnershipforAccessibleReadingAssessment ��
Grade 5 DOF Analysis
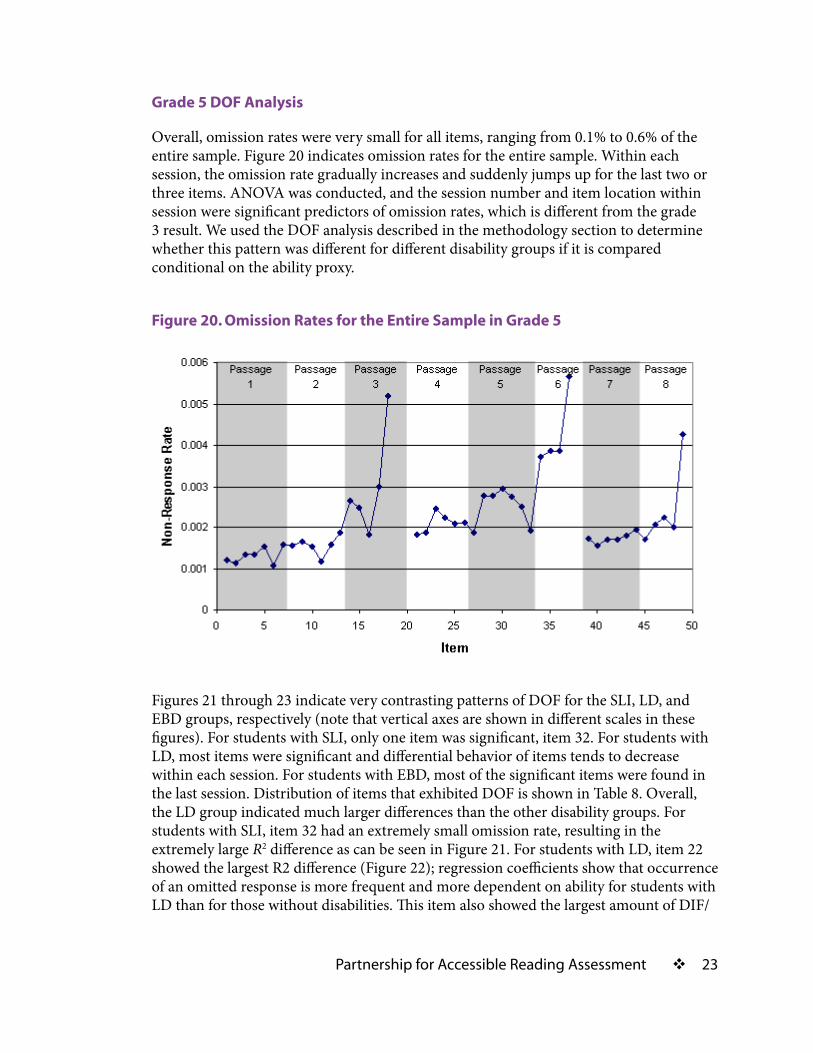
Overall, omission rates were very small for all items, ranging from 0.1% to 0.6% of the entire sample. Figure 20 indicates omission rates for the entire sample. Within each session, the omission rate gradually increases and suddenly jumps up for the last two or three items. ANOVA was conducted, and the session number and item location within session were significant predictors of omission rates, which is different from the grade 3 result. We used the DOF analysis described in the methodology section to determine whether this pattern was different for different disability groups if it is compared conditional on the ability proxy.
Figure 20. Omission Rates for the Entire Sample in Grade 5
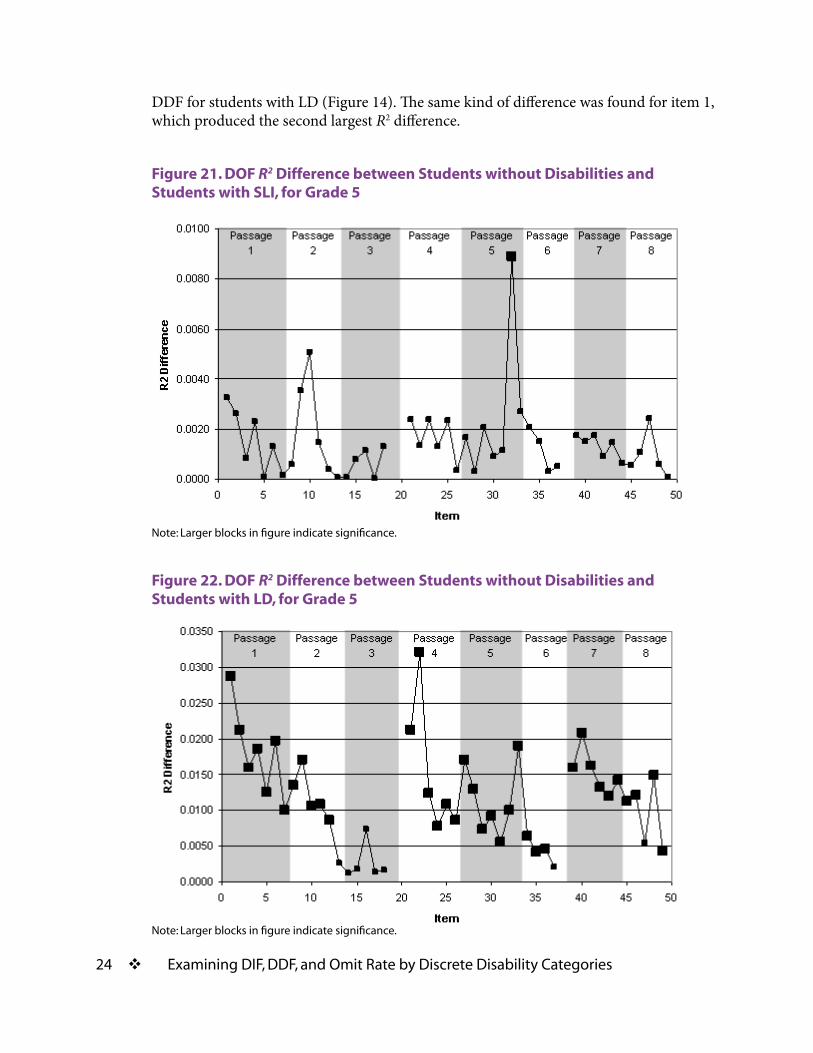
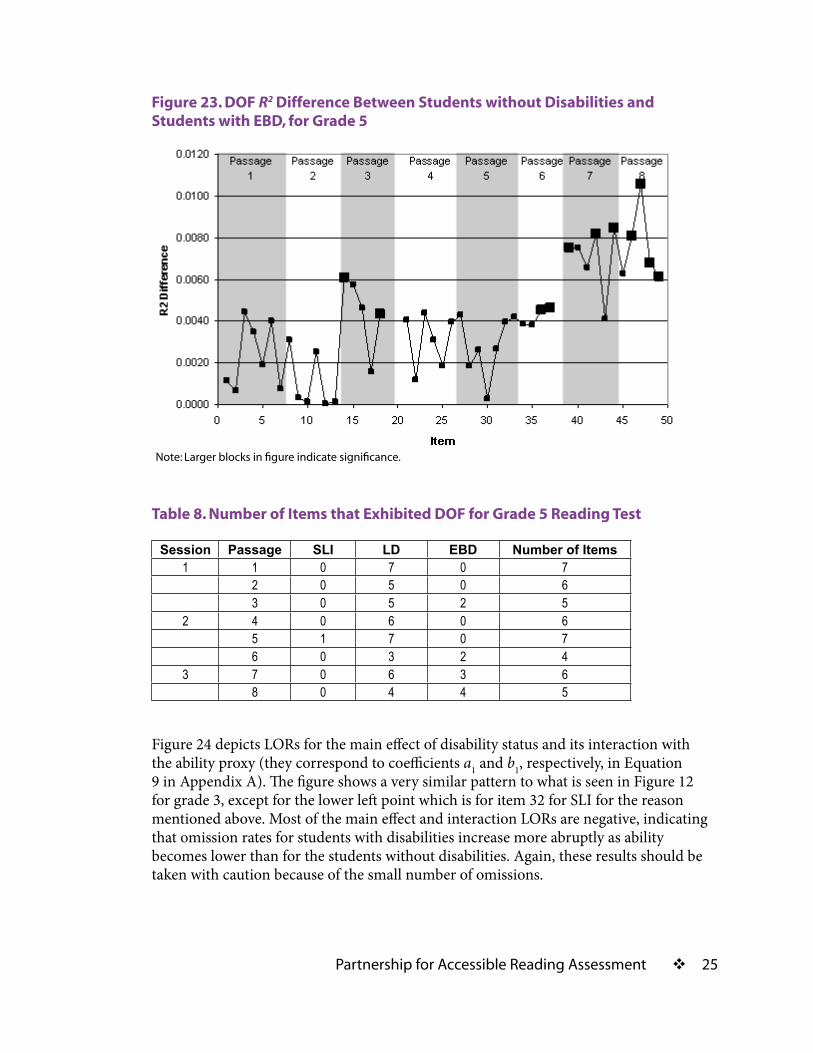
Figures 21 through 23 indicate very contrasting patterns of DOF for the SLI, LD, and EBD groups, respectively (note that vertical axes are shown in different scales in these figures). For students with SLI, only one item was significant, item 32. For students with LD, most items were significant and differential behavior of items tends to decrease within each session. For students with EBD, most of the significant items were found in the last session. Distribution of items that exhibited DOF is shown in Table 8. Overall, the LD group indicated much larger differences than the other disability groups. For students with SLI, item 32 had an extremely small omission rate, resulting in the extremely large R2 difference as can be seen in Figure 21. For students with LD, item 22 showed the largest R2 difference (Figure 22); regression coefficients show that occurrence of an omitted response is more frequent and more dependent on ability for students with LD than for those without disabilities. This item also showed the largest amount of DIF/
�� ExaminingDIF,DDF,andOmitRatebyDiscreteDisabilityCategories
DDF for students with LD (Figure 14). The same kind of difference was found for item 1, which produced the second largest R2 difference.
Figure 21. DOF R2 Difference between Students without Disabilities and Students with SLI, for Grade 5
Figure 22. DOF R2 Difference between Students without Disabilities and Students with LD, for Grade 5
Note:Largerblocksinfigureindicatesignificance.
Note:Largerblocksinfigureindicatesignificance.
PartnershipforAccessibleReadingAssessment ��
Figure 23. DOF R2 Difference Between Students without Disabilities and Students with EBD, for Grade 5
Table 8. Number of Items that Exhibited DOF for Grade 5 Reading Test
Session Passage SLI LD EBD Number of Items1 1 0 7 0 7
2 0 5 0 63 0 5 2 5
2 4 0 6 0 65 1 7 0 76 0 3 2 4
3 7 0 6 3 68 0 4 4 5
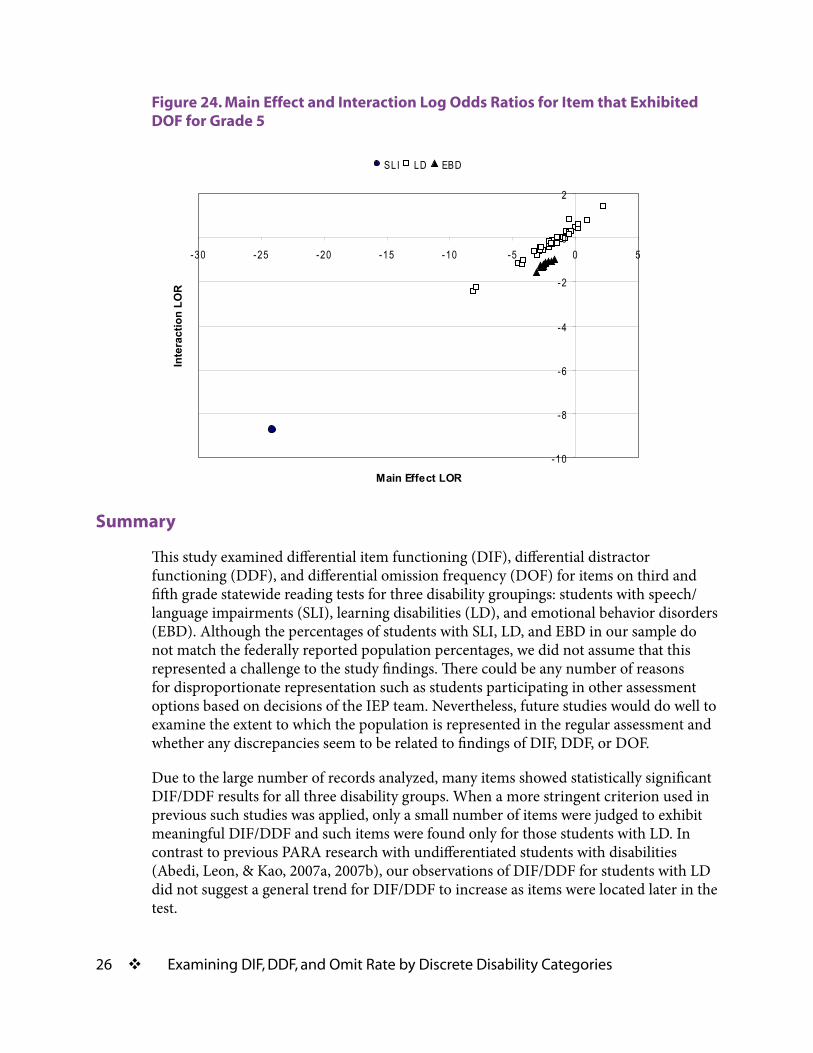
Figure 24 depicts LORs for the main effect of disability status and its interaction with the ability proxy (they correspond to coefficients a1 and b1, respectively, in Equation 9 in Appendix A). The figure shows a very similar pattern to what is seen in Figure 12 for grade 3, except for the lower left point which is for item 32 for SLI for the reason mentioned above. Most of the main effect and interaction LORs are negative, indicating that omission rates for students with disabilities increase more abruptly as ability becomes lower than for the students without disabilities. Again, these results should be taken with caution because of the small number of omissions.
Note:Largerblocksinfigureindicatesignificance.
�� ExaminingDIF,DDF,andOmitRatebyDiscreteDisabilityCategories
Figure 24. Main Effect and Interaction Log Odds Ratios for Item that Exhibited DOF for Grade 5
-10
-8
-6
-4
-2
0
2
-30 -25 -20 -15 -10 -5 0 5
Main Effect LOR
Inte
ract
ion
LOR
SLI LD EBD
Summary
This study examined differential item functioning (DIF), differential distractor functioning (DDF), and differential omission frequency (DOF) for items on third and fifth grade statewide reading tests for three disability groupings: students with speech/language impairments (SLI), learning disabilities (LD), and emotional behavior disorders (EBD). Although the percentages of students with SLI, LD, and EBD in our sample do not match the federally reported population percentages, we did not assume that this represented a challenge to the study findings. There could be any number of reasons for disproportionate representation such as students participating in other assessment options based on decisions of the IEP team. Nevertheless, future studies would do well to examine the extent to which the population is represented in the regular assessment and whether any discrepancies seem to be related to findings of DIF, DDF, or DOF.
Due to the large number of records analyzed, many items showed statistically significant DIF/DDF results for all three disability groups. When a more stringent criterion used in previous such studies was applied, only a small number of items were judged to exhibit meaningful DIF/DDF and such items were found only for those students with LD. In contrast to previous PARA research with undifferentiated students with disabilities (Abedi, Leon, & Kao, 2007a, 2007b), our observations of DIF/DDF for students with LD did not suggest a general trend for DIF/DDF to increase as items were located later in the test.
PartnershipforAccessibleReadingAssessment ��
As with DIF/DDF, many items showed statistically significant DOF for all three disability categories. Applying the more stringent criterion used with DIF/DDF made little difference in these findings. Nevertheless, the large number of records and the small magnitude of omissions dictate caution in generalizing. As with DIF/DDF, students with LD exhibited more DOFs than the other disability groups in both grades 3 and 5. The tendency found among all groups for lower performing students to have higher omissions rates was stronger for students with disabilities than for students without disabilities. Item location such as session, passage, and location within passage seemed to affect omission rates for all students, both those with and without disabilities. There was less indication that item location affected DOF consistently across the three groups of students with disabilities.
Discussion and Implications
A first point to note is that different disability groups showed different results. Items showed DIF and DDF results that merited closer examination only for students with learning disability. No such items were identified for students with speech/language or emotional/behavioral disabilities. This underscores the importance of recognizing the limitations of treating all students with disabilities as a single homogeneous group and suggests that the behavior of students with different kinds of disabilities needs to be examined separately whenever possible. This concern about the heterogeneity of students who share a common label led the Partnership for Accessible Reading Assessment (PARA) to prepare a short literature review on the challenges of instructing and assessing reading for students with various disabilities (PARA, 2006a, 2006b, 2006c, 2006d, 2006e, 2006f, 2007) and to undertake an examination of the different ways that students’ disabilities may affect their performance on reading tests (Moen, Thurlow, & Liu, 2007).
A second observation is that examining response characteristic curves (RCC) charts helps clarify the implications of DIF and DDF. The RCC pattern that would raise the strongest concerns about distractor bias would be if higher performing students with disabilities, those plotted toward the right side of the charts, proportionally selected a particular distractor more than other students. This would suggest that there might be something about the distractor that was a particular problem for students with disabilities. This pattern was rarely observed. More often, the charts showed differential selection of distractors by the low performing students. In most cases the pattern showed that low performing students without disabilities were disproportionately more likely to select a particular distractor. For low performing students with disabilities, this often meant that all of the choices, including the correct choice, had roughly equal chances of being selected. One plausible interpretation of this pattern is that while low performing students without disabilities have been seduced into making a wrong choice, low performing students with disabilities are making random choices. Following up on this observation would likely entail examining other aspects of the test performance of students with learning disabilities.
�� ExaminingDIF,DDF,andOmitRatebyDiscreteDisabilityCategories
Finally, although several items showed DIF and DDF that merited examination, no evidence of serious test bias was found for the particular state reading assessment examined in this study. Even items that exceeded the criterion that was more stringent than mere statistical significance did not show large effect sizes. Those items that had the largest effect sizes showed patterns where the DDF was attributable to low performing students without disabilities being seduced by a false distractor more than comparable performing students with disabilities. This pattern is not indicative of items that are biased against students with disabilities.
PartnershipforAccessibleReadingAssessment ��
References
Abedi, J., Leon, S., & Kao, J. (2007a). Examining differential item functioning in reading assessments for students with disabilities. Minneapolis, MN: University of Minnesota, Partnership for Accessible Reading Assessment. Available at http://www.readingassessment.info/resources/publications/examiningDIFreport.pdf
Abedi, J., Leon, S., & Kao, J. (2007b). Examining differential distractor functioning in reading assessments for students with disabilities. Minneapolis, MN: University of Minnesota, Partnership for Accessible Reading Assessment. Available at http://www.readingassessment.info/resources/publications/examiningDDFreport.pdf
Abedi, J., Leon, S., & Mirocha, J. (2003). Impact of student language background on content-based performance: Analyses of extant data (CSE Tech. Rep. No. 603). Los Angeles: University of California, National Center for Research on Evaluation, Standards, and Student Testing.
Elliott, J., Thurlow, M., Ysseldyke, J., & Erickson, R. (1997). Providing assessment accommodations for students with disabilities in state and district assessments (Policy Directions 7). Minneapolis, MN: University of Minnesota, National Center on Educational Outcomes. Retrieved August 28, 2007, from http://education.umn.edu/NCEO/OnlinePubs/Policy7.html
Green, B. F., Crone, C. R., & Folk, V. G. (1989). A method for studying differential distractor functioning. Journal of Educational Measurement, 26, 147-160.
Klein, J. A., Wiley, H. I., & Thurlow, M. L. (2006). Uneven transparency: NCLB tests take precedence in public assessment reporting for students with disabilities (Technical Report 43). Minneapolis, MN: University of Minnesota, National Center on Educational Outcomes.
Moen, R. M., Thurlow, M. L., & Liu, K. L. (2007). Less accurately measured students. Presentation at the Council of Chief State School Officers Large Scale Assessment Conference, Nashville, TN.
Nagelkerke, N. J. D. (1991). A note on a general definition of the coefficient of determination. Biometrika, 78, 691-692.
No Child Left Behind Act of 2001, Pub. L. No. 107–110, 115 Stat. 1425 (2002).
Partnership for Accessible Reading Assessment (PARA). (2006a). Reading and students with autism. Retrieved August 14, 2007, from http://www.readingassessment.info/resources/publications/readingandautism.htm
�0 ExaminingDIF,DDF,andOmitRatebyDiscreteDisabilityCategories
Partnership for Accessible Reading Assessment (PARA). (2006b). Reading and students with emotional or behavioral disabilities. Retrieved August 14, 2007, from http://www.readingassessment.info/resources/publications/readingandemotbehav.htm
Partnership for Accessible Reading Assessment (PARA). (2006c). Reading and students with specific learning disabilities. Retrieved August 14, 2007, from http://www.readingassessment.info/resources/publications/readingandld.htm
Partnership for Accessible Reading Assessment (PARA). (2006d). Reading and students with speech or language impairments. Retrieved August 14, 2007, from http://www.readingassessment.info/resources/publications/readingandspeech.htm
Partnership for Accessible Reading Assessment (PARA). (2006e). Reading and students with mental retardation. Retrieved August 14, 2007, from http://www.readingassessment.info/resources/publications/mentalretardation.htm
Partnership for Accessible Reading Assessment (PARA). (2006f). Reading and students with visual impairments or blindness. Retrieved August 14, 2007, from http://www.readingassessment.info/resources/publications/visualimpairment.htm
Partnership for Accessible Reading Assessment (PARA). (2007). Reading and students who are deaf or hard of hearing. Retrieved August 14, 2007, from http://www.readingassessment.info/resources/publications/deafOrhardofhearning.html
Shriner, J. G., Spande, G., & Thurlow, M. L. (1994). State special education outcomes 1993. Minneapolis, MN: University of Minnesota, National Center on Educational Outcomes.
Stone, E. F., Stone, D. L., & Gueutal, H. G. (1990). Influence of cognitive ability on responses to questionnaire measures: Measurement precision and missing response problems. Journal of Applied Psychology, 75, 418-427.
Swaminathan, H., & Rogers, H. J. (1990). Detecting differential item functioning using logistic regression procedures. Journal of Educational Measurement, 27, 360-370.
Thissen, D., Steinberg, L., & Fitzpatrick, A. R. (1989). Multiple-choice models: The distractors are also part of the item. Journal of Educational Measurement, 26, 161-176.
Thompson, S. J., Johnstone, C. J., & Thurlow, M. L. (2002). Universal design applied to large-scale assessments (Synthesis Report 44). Minneapolis, MN: University of Minnesota, National Center on Educational Outcomes.
Thurlow, M. L., Moen, R. & Wiley, H. I. (2005). Annual performance reports: 2002-2003 state assessment data. Minneapolis, MN: University of Minnesota, National Center on Educational Outcomes. Available at www.nceo.info/OnlinePubs/APRsummary2006.pdf
PartnershipforAccessibleReadingAssessment ��
U.S. Department of Education. (2006). 26th Annual (2004) Report to Congress on the Implementation of the Individuals with Disabilities Education Act, vol. 2. Washington, DC: U.S. Department of Education, Office of Special Education and Rehabilitative Services, Office of Special Education Programs.
Ysseldyke, J., Thurlow, M., Langenfeld, K., Nelson, J. R., Teelucksingh, E., & Seyfarth, A. (1998). Educational results for students with disabilities: What do the data tell us? (Technical Report 23). Minneapolis, MN: University of Minnesota, National Center on Educational Outcomes.
Zumbo, B. D. (1999). A handbook on the theory and methods of differential item functioning (DIF): Logistic regression modeling as a unitary framework for binary and Likert-type (ordinal) item scores. Ottawa, ON: Directorate of Human Resources Research and Evaluation, Department of National Defense. Retrieved January 8, 2007, from http://educ.ubc.ca/faculty/zumbo/DIF/handbook.pdf

�� ExaminingDIF,DDF,andOmitRatebyDiscreteDisabilityCategories
PartnershipforAccessibleReadingAssessment ��
Appendix A
Differential Item/Distractor Analysis
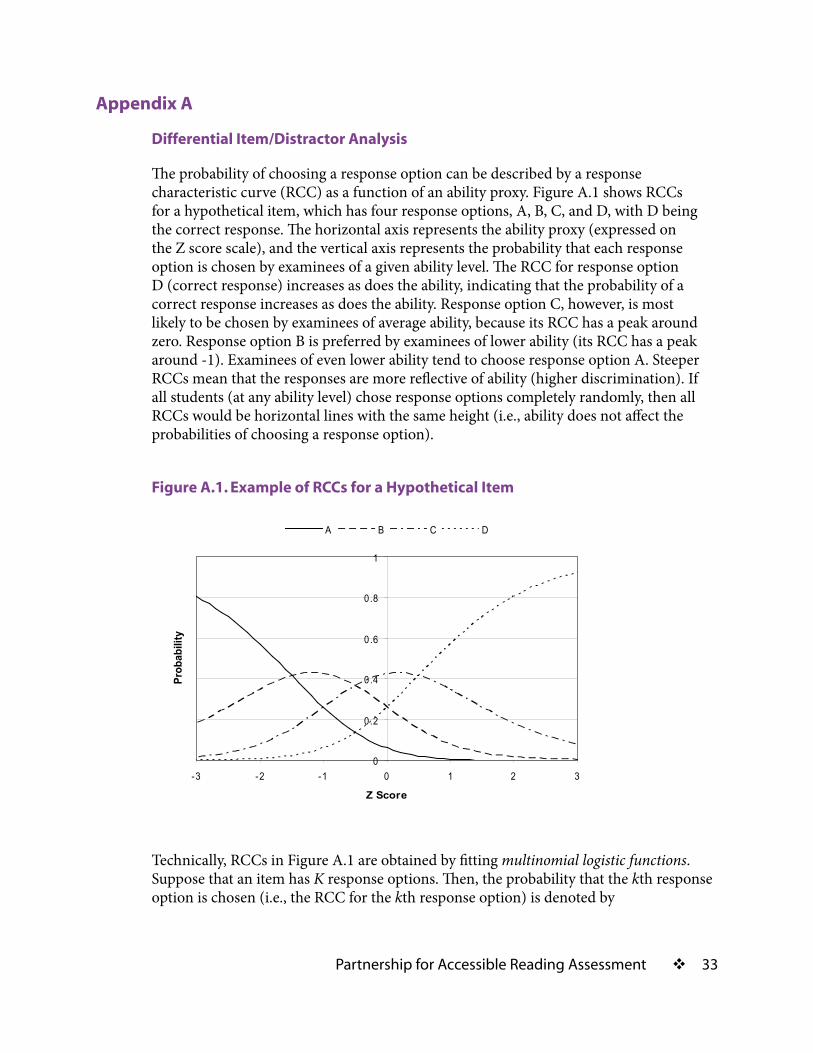
The probability of choosing a response option can be described by a response characteristic curve (RCC) as a function of an ability proxy. Figure A.1 shows RCCs for a hypothetical item, which has four response options, A, B, C, and D, with D being the correct response. The horizontal axis represents the ability proxy (expressed on the Z score scale), and the vertical axis represents the probability that each response option is chosen by examinees of a given ability level. The RCC for response option D (correct response) increases as does the ability, indicating that the probability of a correct response increases as does the ability. Response option C, however, is most likely to be chosen by examinees of average ability, because its RCC has a peak around zero. Response option B is preferred by examinees of lower ability (its RCC has a peak around -1). Examinees of even lower ability tend to choose response option A. Steeper RCCs mean that the responses are more reflective of ability (higher discrimination). If all students (at any ability level) chose response options completely randomly, then all RCCs would be horizontal lines with the same height (i.e., ability does not affect the probabilities of choosing a response option).
Figure A.1. Example of RCCs for a Hypothetical Item
0
0.2
0.4
0.6
0.8
1
-3 -2 -1 0 1 2 3
Z Score
Prob
abili
ty
A B C D
Technically, RCCs in Figure A.1 are obtained by fitting multinomial logistic functions. Suppose that an item has K response options. Then, the probability that the kth response option is chosen (i.e., the RCC for the kth response option) is denoted by
�� ExaminingDIF,DDF,andOmitRatebyDiscreteDisabilityCategories
∑ =+
+= K
l ll
kkk
zbazba
zp1
)exp()exp(
)( , k = 1,…, K, (1)
where z denotes the ability proxy, and coefficients aks and bks are the parameters that determine the shape of RCCs. On the one hand, values of bks determine the relative order of response options within the item; if b1 > b2, then the response option 1 is preferred by examinees of higher ability than the response option 2. Usually, bk for the correct response is the highest of all bks for an item, because the corresponding RCC (representing the probability of a correct response) should be increasing as a function of z. On the other hand, values of aks determine the relative size of response options within the item. When z = 0, Equation 1 simplifies to ∑= )exp()exp()( lkk aazp . Thus, response options with larger aks are more likely to be chosen by examinees of average ability (i.e., examinees with z = 0) than response options with smaller aks. This does not necessarily hold at an arbitrary value of z as z departs from zero, but the same interpretation approximately holds for overall response rates (i.e., response rates averaged over all ability values) (Thissen, Steinberg, & Fitzpatrick, 1989). Note that all values of aks and bks are relative; their values can be compared only within each item and usually one of the (ak, bk) pairs is fixed to zero in order for them to be estimated uniquely. In the current study, coefficients for the correct response option are fixed to zero for all items.
When item characteristics are summarized by multiple RCCs as described above, the aim of DIF/DDF analysis is to detect differing RCCs between the reference and target groups of examinees (e.g., students without disabilities and students with specific disabilities) for each item. Different RCCs are indicated by different coefficients (i.e., aks and bks) between groups. In order to evaluate differences in coefficients statistically, a grouping variable, g, is introduced in the model. It represents examinee groups; let g = 0 for the reference group (e.g., students without disabilities) and g = 1 for the target group (e.g., students with disabilities).
For simplicity, Equation 1 can be rewritten as
zbazpzp
kkk
k +=)()(
ln'
, (2)
where ln is the natural logarithm, and k’ denotes the base response option for which ak’ and bk’ are set to zero (which is the correct response option in this study). From the right-hand side of Equation 2, the problem can be regarded as generalized linear regression with z being the predictor. Now, introduce the categorical variable g and the new model equation is
ln
PartnershipforAccessibleReadingAssessment ��
zgbzbgaagzpgzp
kkkkk
k1010
' ),(),(
ln +++= . (3)
Coefficients a1k and b1k denote the main effect of disability status and the interaction between disability status and the ability proxy, respectively. Since g = 0 for the reference group and g = 1 for the target group, Equation 3 becomes
zbagzpgzp
kkk
k00
' )0,()0,(
ln +===
(4)
for the reference group. Thus, a0k and b0k are the intercept and slope for the reference group. For the target group, Equation 3 becomes
zbbaagzpgzp
kkkkk
k )()()1,()1,(
ln 1010'
+++===
. (5)
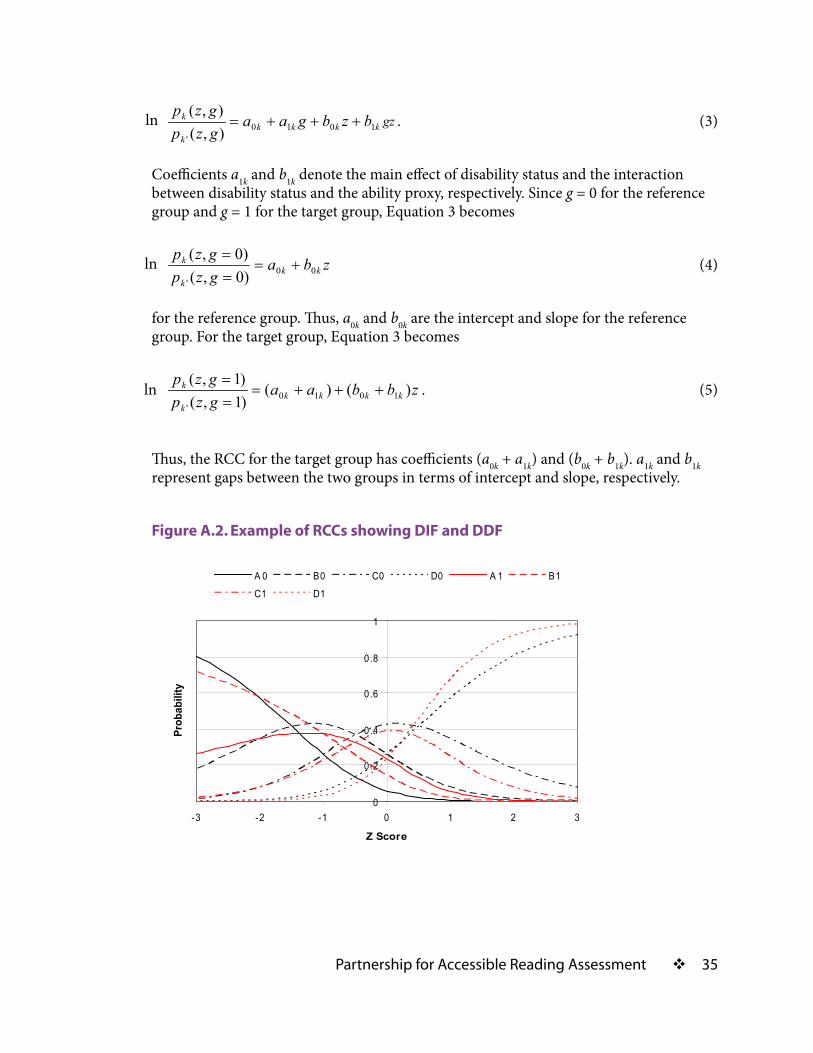
Thus, the RCC for the target group has coefficients (a0k + a1k) and (b0k + b1k). a1k and b1k represent gaps between the two groups in terms of intercept and slope, respectively.
Figure A.2. Example of RCCs showing DIF and DDF
0
0.2
0.4
0.6
0.8
1
-3 -2 -1 0 1 2 3
Z Score
Prob
abili
ty
A 0 B0 C0 D0 A 1 B1C1 D1
ln
ln
ln
gz
�� ExaminingDIF,DDF,andOmitRatebyDiscreteDisabilityCategories
Figure A.2 depicts different sets of RCCs for two groups. The RCCs for the first group (shown in black, curves A0 through D0) are the same as those depicted in Figure A.1, while the RCCs for the second group (shown in red, curves A1 through D1) are different from the first group. Since RCCs for correct and incorrect responses are all different, this item indicates both DIF and DDF.
DIF/DDF is tested by fitting and comparing two models. The first model is the base model (Model 1), which contains no group variable and interaction and thus represents no DIF/DDF (Equation 2). The second model (Model 2) assumes that both slopes and intercepts are allowed to vary across groups (nonzero a1k and b1k in Equation 5). In this model, the order of RCCs can vary across groups as well as their sizes.
Zumbo (1999) describes a multistep procedure for detecting DIF (or DDF in the current context; also see Swaminathan & Rogers, 1990) using binary or multinomial logistic regression models. Although this procedure is intended for dichotomously scored test items and is based on item response theory models (i.e., the latent ability score is used as an ability proxy), it is applicable to the current DIF/DDF analysis as well. Whether the model fit significantly improves when varying intercepts and slopes are introduced is evaluated by the likelihood ratio test. No significance implies that there is no difference in response choice between the two groups of examinees. The significance level is set to .01 in this study.
If significance is found for an item, the item may be indicating DIF, DDF, or both. Then, further analyses are required to examine (a) to what extent the item’s response options behave differently, and (b) what contributed to the discrepancy, DIF or DDF, if the amount of DIF/DDF turns out to be substantial.
The amount of DIF/DDF is indicated by pseudo R2, which is a measure of effect size in logistic regression and imitates R2 in normal linear regression. There is a variety of pseudo R2 measures in binary or multinomial logistic regression, but they all approximate the proportion of variance explained by the given model. Specifically, Nagelkerke’s R2 is used in this study (Nagelkerke, 1991). Difference in pseudo R2 between Models 1 and 2 represents the additional amount of variance explained by introducing the group difference into RCCs in Model 1. Items for which R2 difference is no smaller than .003 for any comparison of models will be flagged for possible DIF/DDF (cf., Abedi et al., 2007b). Also, values of difference pseudo R2 will be plotted against item number to visualize and examine the differential effect of item locations on DIF/DDF.
Items which are significant and show R2 difference no smaller than .003 are subjected to further analysis to determine the nature of their differential functioning. For each of those items, RCCs are plotted for visual inspection. At the same time, discrepancies of RCCs between two groups are examined. A discrepancy between two RCCs for response option k for an item is measured by the mean absolute difference (MAD), which is defined as
PartnershipforAccessibleReadingAssessment ��
∑==−==
N
i ikikk NgzpgzpMAD1
)1,()0,( , (6)
where zi is the ability proxy value of examinee i, N is the total sample size, and pk(z, g) denotes an estimated RCC for response option k (defined in Equations 4 and 5). MAD represents the average difference between two RCCs. A zero MAD indicates that the two RCCs are the same. If the largest MAD is found for the correct response option, the differential functioning is attributed to DIF. However, if RCCs for distractors indicate larger MADs, then the differential functioning is due to DDF.
Differential Omission Frequency Analysis
A strategy similar to the DIF/DDF analysis is taken for the DOF analysis. Since the ability may be responsible for occurrence of omitted responses (for example, examinees of lower ability may skip items more readily), it is entered in the model as a covariate and a logistic curve is fitted. The outcome variable is binary: whether the response is omitted or not. Therefore, the multinomial logistic regression model in Equation 1 reduces to the ordinary binary logistic regression model, in which the omission rate, given the ability proxy z, is denoted by
)exp(1)exp()(
bzabzazp++
+= , (7)
or equivalently,
bzazp
zp+=
− )(1)(ln . (8)
Now, each item has only one omitted response curve (ORC) for the omission rate. The slope parameter b represents the effect of the overall score, and the intercept parameter a determines the location of the ORC. If the group difference is introduced, we have
zgbzbgaagzp
gzp1010),(1
),(ln +++=−
, (9)
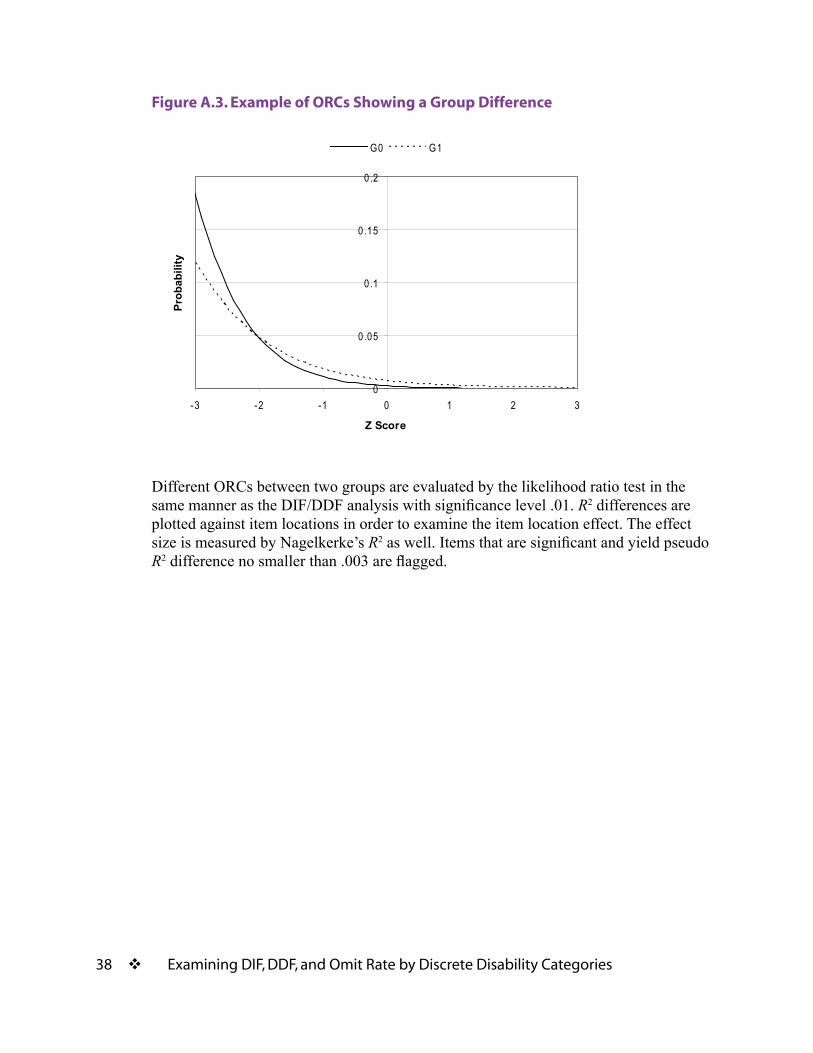
which corresponds to Equation 3 in the multinomial case. a1 and b1 represent the location and slope differences between the two groups, respectively. If these parameters are nonzero, the corresponding ORCs may look like Figure A.3, which shows a situation in which the omission rate decreases as the overall score increases for both groups, but the reference group (G0) has a steeper slope than the target group (G1).
ln
ln
bz
bz
bz
gz
�� ExaminingDIF,DDF,andOmitRatebyDiscreteDisabilityCategories
Figure A.3. Example of ORCs Showing a Group Difference
0
0.05
0.1
0.15
0.2
-3 -2 -1 0 1 2 3
Z Score
Prob
abili
ty
G0 G1
Different ORCs between two groups are evaluated by the likelihood ratio test in the same manner as the DIF/DDF analysis with significance level .01. R2 differences are plotted against item locations in order to examine the item location effect. The effect size is measured by Nagelkerke’s R2 as well. Items that are significant and yield pseudo R2 difference no smaller than .003 are flagged.