Examiner Characteristics and the Patent Grant Ratemartinprosperity.org/media/agrawal/5Bhaven paper...
34
Examiner Characteristics and the Patent Grant Rate * Mark Lemley† and Bhaven N. Sampat ‡ †William H. Neukom Professor, Stanford Law School; of counsel, Keker & Van Nest LLP ‡Assistant Professor, Department of Health Policy and Management Mailman School of Public Health, Columbia University January 3, 2009 Abstract In this paper, we show that there are important differences across patent examiners at the U.S. Patent and Trademark Ofce (USPTO), and that these relate to the most important decision made by the USPTO: whether or not to grant a patent. We nd that more experienced exam- iners, and those who systematically cite less prior art, are more likely to grant patent applications. These results are not encouraging as a matter of public policy. But they do point to human resource policies as poten- tially important levers in patent system reform. (JEL Keywords: O34 - Intellectual Property Rights; O38 - Government Policy) * We thank Iain Cockburn, Wes Cohen, Ernie Beffel, Chris Cotropia, Al Engleberg, Sherry Glied, John Golden, Stuart Graham, Matt Neidell, Arti Rai, Scott Stern, and participants at the NBER Productivity Lunch, the 2008 NBER Summer Institute, the Georgia Tech Roundtable on Entrepreneurship Research (REER), and UNC Law School Conference on Empirical Patent Scholarship for useful comments. Sarah Craven, Reuven Garrett, Mayank Dabral, and Matthew Wasserman provided excellent research assistance. Patrick Crosby at xblabs.com helped obtain some the data used in this analysis. Sampat thanks the Ford Foun- dation for nancial support. 1
Transcript of Examiner Characteristics and the Patent Grant Ratemartinprosperity.org/media/agrawal/5Bhaven paper...
Examiner Characteristics and the PatentGrant Rate*
Mark Lemley† and Bhaven N. Sampat ‡
†William H. Neukom Professor, Stanford Law School; ofcounsel, Keker & Van Nest LLP
‡Assistant Professor, Department of Health Policy andManagement Mailman School of Public Health, Columbia
University
January 3, 2009
Abstract
In this paper, we show that there are important differences acrosspatent examiners at the U.S. Patent and Trademark Of!ce (USPTO), andthat these relate to the most important decision made by the USPTO:whether or not to grant a patent. We !nd that more experienced exam-iners, and those who systematically cite less prior art, are more likely togrant patent applications. These results are not encouraging as a matterof public policy. But they do point to human resource policies as poten-tially important levers in patent system reform. (JEL Keywords: O34 -Intellectual Property Rights; O38 - Government Policy)
*We thank Iain Cockburn, Wes Cohen, Ernie Beffel, Chris Cotropia, Al Engleberg, SherryGlied, John Golden, Stuart Graham, Matt Neidell, Arti Rai, Scott Stern, and participantsat the NBER Productivity Lunch, the 2008 NBER Summer Institute, the Georgia TechRoundtable on Entrepreneurship Research (REER), and UNC Law School Conference onEmpirical Patent Scholarship for useful comments. Sarah Craven, Reuven Garrett, MayankDabral, and Matthew Wasserman provided excellent research assistance. Patrick Crosby atxblabs.com helped obtain some the data used in this analysis. Sampat thanks the Ford Foun-dation for !nancial support.
1
1 IntroductionUnder the standard economic rationale, patents provide incentives to conductresearch and to disclose inventions, in return for a limited right to excludeothers from making, selling, or using these inventions (Nordhaus, 1969). Un-der optimally designed patent systems the static social costs from the mar-ket power conferred by patents are offset by the dynamic welfare gains fromincreased invention and disclosure. From this perspective, if patents weregranted on inventions that were already known, they would create harmswithout concomitant social gains (Lemley and Shapiro, 2005). In the UnitedStates, examiners at the Patent and Trademark Of!ce (USPTO are chargedwith serving as gatekeepers to ensure that only novel and non--obvious inven-tions are granted patents.1
In this paper, using information from several novel datasets, we show thatthere are important differences across patent examiners, and that these relateto the most important decision made by the USPTO: whether or not to grant apatent. In particular we !nd that examiners differ in signi!cant and importantways in their experience and the depth of their prior art searching, and thatthese examiner characteristics have qualitatively and statistically signi!cantimpacts on whether a patent application is granted.
The results are not encouraging as a public policy matter, because theysuggest that the decision to allow or reject a patent application may not bedriven by the merits of that application, but rather by the luck of the draw.At the same time, they suggest that human resource policies and incentivestructures at the USPTO could affect patent grant rates, an important !ndingamidst growing concern that it grants too many "low quality'' patents and isin need of signi!cant reform (Jaffe and Lerner 2004; NAS 2004; FTC 2005).
Several scholars have previously studied examiner heterogeneity and its ef-fects on patenting. Cockburn, Kortum and Stern studied the effect of particu-lar examiners on the characteristics of issued patents and their survival in liti-gation. (Cockburn et al. 2003) They !nd that examiner !xed effects explain asigni!cant percentage of the variation in the characteristics of issued patents,and that examiner differences affected litigation outcomes ------ patents issued
1 Or, as Thomas Jefferson--who as Secretary of State was among the nation's !rst patentexaminers--suggested (in considering the originality of an 1813 invention on "Elevators, Con-veyors, and Hopper--Boys,'') patent examiners have the dif!cult job of "drawing a line be-tween the things which are worth to the public the embarrassment of an exclusive patent, andthose which are not." (The Writings of Thomas Jefferson, p. 355).
2
by certain examiners were more likely to be upheld in court than those issuedby others. They conclude that "there may be as many patent of!ces as thereare patent examiners.'' In another study, Doug Lichtman studied the role ofthe PTO in compelling amendments during the prosecution process, an issuedirectly relevant to prosecution history estoppel and the application of thedoctrine of equivalents (Lichtman 2004). Lichtman identi!ed the extent towhich issued claims differed from the claims as originally drafted. This study,too, found examiner effects to be important: whether an applicant amendedits claims depended in signi!cant measure on which examiner reviewed the ap-plication. Lichtman concluded that different examiners had different "styles,''with some examiners systematically more likely than others to compel appli-cants to narrow their claims.
In this paper, rather than looking at issued patents, we identify a groupof patent applications and follow them through the process to examine theimpact of examiner characteristics on patent application outcomes. Speci!-cally, we collected every original utility patent application !led in the monthof January 2001 and published before April 2006. After eliminating plant,design, and reissue patents, PCT applications directed at foreign !ling, andcontinuations, divisionals, and CIPs based on earlier applications, we wereleft with 9,960 applications. We then collected information on the status ofthese applications as of June 2008, and other information about the prosecu-tion process as of April 2006.2 Evaluating applications rather than just issuedpatents allows us to obtain richer data on the behavior of examiners, data thatwas not available before 2001.
As reported in Lemley and Sampat (2009), 70.5 percent of the applicationshad resulted in patents by June 2008. About a quarter of the applications, 27.3percent, were not patented because they were abandoned by the applicant.These abandonments could be because the applicant could not overcome anexaminers rejection, but the applications could also be abandoned for otherreasons (e.g. the applicants !rm went out of business).3 The remaining 2.2percent of the applications were pending as of June 2008.
In this paper, we focus on the set of these applications that have recived a2Unfortunately, changes to the PAIR interface make it dif!cult to update the prosecution
data beyond April 2006.3There is no actual way for the PTO to !nally reject a patent (Lemley and Moore, 2004).
We consider a patent application to have been !nally abandoned if the applicant has !led anotice of abandonment or has not responded to a PTO rejection or !led an appeal within sixmonths, the time limit for doing so.
3
!nal disposition, i.e. the 98% of the applications that are patented or aban-doned. We relate whether these 9744 applications were granted by June 2008to examiner--speci!c characteristics, including examiner experience and priorart searching tendencies. In the next section, we describe the patent prosecu-tion process, both to provide context for our analysis and to motivate con-struction of the variables we examine. In Section 3, we describe how we col-lected the examiner data. In Section 4, we provide descriptive statistics on,and explore relationships between, the key independent variables. Section 5presents results from linear probability models relating examiner and appli-cation charactertistics to the probability an application is granted. There, wealso relate examiner characteristics to another measure of examination rigor,whether applications were amended during prosecution.
One concern about our analysis is selection: if speci!c types of applica-tions are assigned to speci!c examiners, this could bias our results. Section 6examines this possibility, and suggests that our results are not driven by selec-tion bias. Section 7 explores some possible mechanisms driving our results.Section 8 concludes.
2 The Patent Prosecution ProcessRoughly 450,000 new patent applications are !led every year. Each of theseapplications contains, among other things, written descriptions of the inven-tion and speci!c claims de!ning the boundaries of the property right the ap-plicant hopes to obtain. In the United States, applicants also have a duty ofcandor to disclose any previous patents and publications, or "prior art'', thatare material to patentability of the claimed invention. Accordingly, most (butnot all) patent applicants also disclose patent and non--patent prior art as partof their patent application. Though there is a duty of disclosure in the UnitedStates, there is no af!rmative requirement that applicants conduct prior artsearches; Sampat (2009) and Alcacer et al. (2009) argue that incentives forapplicants to do so vary across inventions and industries.
Once applications arrive at the USPTO, they are divided by the PTO intotechnology classes, or Art Units. Supervisory Patent Examiners (SPEs) withineach of the art units assign particular applications to particular examinersbased on a rather loose set of rules (MPEP sec. 903.08(b)). One issue rele-vant to our empirical analyses below is whether there is sorting, i.e. whetherparticular types of applications are assigned to particular types of examin-
4
ers. Merges (2001) suggests that while sorting could be good from a pol-icy perspective, there is a strong "all patents are created equal'' tradition atthe PTO militating against this. Our interviews with SPEs suggest that thereis some sorting, but that familiarity with particular technologies and docket"owmanagement, rather than judgments of an application's quality or patent--worthiness, are the dominant considerations.
The patent examiner assigned the application reviews it and conducts hisor her own search for prior art that might make the application unpatentable.This involves searching databases of previous U.S. patents, either manuallyor through algorithms available to examiners. Examiners may also searchforeign patents and the non--patent literature (e.g., scienti!c and technicaljournals) to !nd prior art that might compromise patentability. Searchingthe non--patent prior art in particular may be more dif!cult: Thomas (2001)argues that "[i]n comparison to much of the secondary literature [non--patentprior art], patents are readily accessible, conveniently identi!ed, and printedin a common format. Identi!cation of a promising secondary reference, andfull comprehension of its contents, often prove to be more dif!cult tasks.''(318)
Examiners then assess the novelty and non--obviousness of the claims inthe appliaction, relative to what is disclosed in the complete list of prior art,i.e. the prior art references from the applicant plus any discovered throughthe examiners own search. Examiners generally issue an initial rejection of theapplication, setting out the problems they !nd in one or more of the claims.(Lemley & Sampat, 2008). The applicant responds, generally by amendingthe patent claims or by disputing the rejection. After the response, the ex-aminer may then allow the application or issue a "!nal rejection.'' Even a!nal rejection is not really !nal, however; applicants can respond by amend-ing their application, or by requesting an interview with the examiner to presstheir case. They may also !le one of a variety of "continuation'' applicationsto continue to argue for patentability.
If the patent issues, the front page includes a range of bibliographic data,including the !nal claims, and information on the applicant and examinerinvolved in examination. Issued patents also list all of the prior art referencesconsidered during the prosecution process, and, since 2001, indications ofwhether these references came from applicant disclosures or examiner searches(Alcacer and Gittleman 2006; Sampat 2009; Alcacer, et al. 2009).
The large number of applications facing the PTOmeans that examiners aresubject to sharp time constraints; the entire process of reading and evaluating
5
an application, searching for prior art, writing a rejection, responding to anamendment with a second of!ce action, having an interview, and ful!llingvarious formal requirements can take 3--4 years on average (Allison&Lemley,2000), but the examiner spends an average of only 18 hours over those yearsworking on any given application. (Lemley, 2001).
The incentives facing examiners are complicated, and the object of consid-erable policy debate (Jaffe and Lerner 2004; GAO 2005). Examiners' promo-tion and bonus decisions are tied to the number of "counts'' they accumulate.These counts can be earned by !rst of!ce actions, or by disposal of cases,which occur when an application is granted or abandoned. Other examineractivities, including searching for prior art, compelling further amendmentsafter a !rst of!ce action, or issuing !nal rejections, are not rewarded by thecount system. Some have argued that these rules create a bias towards grant-ing rather than rejecting applications (Jaffe and Lerner 2004).
Moreover, these incentives operate differently over an examiner's career.Examiners are hired at different grades (GS--5, GS--7, GS--9, or GS--11) on thegovernment employee pay schedule, depending on their technical experienceand educational background. The counts per hour they are required to attainto achieve satisfactory performance reviews (and thus further promotion) andannual bonuses increase sharply with pay grade.4 Another difference betweenmore junior and senior examiner is the scrutiny they receive. Junior examinerswork is subject to review from more senior examiners; indeed, though theydo the bulk of the examination, they are listed as secondary examiners onapplications they examine. Once promoted to the GS--14 level (generallybetween 4 and 6 years of hire, depending on what level they were hired at)they receive signatory authority, or the right to sign off on an applicationindependently.
4 A recent GAO report provides this illustration: "a GS--12 patent examiner work-ing on data processing applications is expected to achieve two counts in 31.6 hours,whereas a GS--12 patent examiner working on plastic molding applications is expectedto do so in 20.1 hours. GS--7 patent examiners working on those types of applica-tions, however, are expected to achieve two counts in 45.1 and 28.7 hours, respectively.''http://www.gao.gov/htext/d08527t.html
6
3 Examiner CharacteristicsThis discussion suggests that an examiner's propensity to search for prior art,and her experience, might affect how she handles patent applications they areassigned. To construct data on prior art search patterns, we began by linkingthe examiners in our January 2001 sample to patents they issued over the2001--2006 period. We used information on whether the citations in these2001--2006 patents (to previous patents and to non--patent literature) wereprovided by the examiner or by applicants to construct measures of examinersearch intensity, as we discuss in detail below.
Since the PTO employs its examiners, examiner names are listed in PAIR,and examiner names are listed on the front page of issued patents, it mightseem straightforward to identify the examiners associated with each applica-tion, and to link these to other examiner characteristics constructed from dataon the front page of subsequently issued patents. However, while the PAIRexaminer name data are cleanly linked to the standardized names in the of-!cial USPTO employee directory, the front page examiner data are reportedin a haphazard format and are rife with errors, as Cockburn et al. (2003)point out. (One source of error is that the large--sample front page patentdata provided by the USPTO appears to be constructed via optical characterrecognition of the patent images.) To take just one example, we identi!ed oneexaminer whose name was spelled no less than 20 different ways on the frontpage of issued patents.5
To solve this problem, we acquired the USPTO Employee Directories from1992 to the present. These Directories list the examiner name in the samestandardized format as in the PAIR data. We used a combination of program-ming and manual correction to match each of these clean examiner names tothe noisy names listed on patents issued over the 2001----2006 period. Col-lectively, the 2,803 examiners in our sample were listed on these later issuedpatents in 13,772 name variants. Access to the employee directories also al-lowed us to determine exactly when the examiner !rst began working at the
5 Ponnathapura Achutamurthy's name was listed as Achutamurthy Donnathapu, Achuta-murthy P., Achutamurthy Ponnathapau, Achuta--murthy Ponnathapu, Achutamurthy Pon-nathapua, Achutamurthy Ponnathapuea, Achutamurthy Ponnathapur, Achutamurthy Pon-nathapura, Achutamurthy Ponnathaput, Achutamurthy Ponnathupura, Achutamurthy Pun-nathapu, Achutamurtry Ponnathapu, Achutamurty Ponnathapu, Achuthamurthy Pon-nathapu, Achutmurthy Ponnathapu, Achutyamurthy Ponnathapu, Murthy Ponnathapu,Murthy Ponnathapu Achuta, Murthy Ponnathapuachut, and Ponnathapuachuta.
7
USPTO, which we used to construct experience measures. These measures areright--censored, since we lack access to Employee Directories before 1992.
In our empirical analyses, we treat the examiner for each application orpatent as the examiner who did the most direct work on that application: thesecondary examiner if there was one, or the primary examiner if there wasno secondary assigned.6 Using front--page data from issued patents, we con-structed two measures of examiner search intensity. Using data on citations inall patents issued by an examiner over the 2001--2006 period (cf. Thompson2006; Alcacer and Gittelman 2006) we contructed a measure of the shareof all citations to (a) patents, and (b) non--patent prior art that came fromthe examiner rather than the applicant. Previous research has used patentcitations by applicants as proxies for how well they are searching prior art(Sampat 2009; Alcacer et al. 2009). Here, we use the average examiner shareof references (taken as an average, across all patents issued by that examiner)as proxies for an examiners propensity to search for prior art. Speci!cally,we construct the variable US_SHARE as a measure of how thoroughly theexaminer seaches U.S. patents, andNP_SHARE de!ned analogously for non--patent prior art.
The theory here is that examiners who conduct more thorough searchesare, on average, likely to contribute a greater share of prior art references inpatents they issue over the 2001--2006 period, relative to other examinersin their art units. Because it is an average, this measure is more precise forexaminers who issue more patents. To account for this, in the models withthe search intensity measures we exclude applications where the examiner hadfewer than ten patents issued over the 2001--6 period, which leads us to drop89 examiners and 714 of the January 2001 patent applications.7
We also used information in the examiner directory to construct experiencemeasures. Though the applications were !led in 2001, there can be lags before
6Given the high turnover rate at the USPTO, it is not surprising that there are some appli-cations for which the examiner changed over the prosecution period. Our data are on the lastexaminer associated with an application, the one associated with patent issuance or with rejec-tion/abandonment. Based on manual inspection of a sample of 1,637 applications for whichthe image !le wrappers were available, we determined that there were examiner switches forabout 244 of these, or slightly less than 15 percent, and there were no qualitatively or sta-tistically signi!cant differences in the characteristics of original versus !nal examiners whohandled these applications.
7 We also estimated models including these examiners/applications and controlling for thecount of patents they issued over the 2001--6 period. These models produce qualitativelysimilar results, and are available on request.
8
they are docketed to an examiner. (Ninety percent of the applications in oursample were docketed by the end of 2001, and 98 percent by the end of 2002.)Accordingly, in our analyses we calculate experience as the difference betweenthe !rst year an examiner appears in the Employee Directory and the year theapplication is docketed to the examiner.8
This experience measure is also right--censored, since we lack employee di-rectories prior to FY1992. In view of the censoring, in our empirical analyseswe examine the effects of examiner experience non--parametrically, includ-ing dummy variables for ZERO YEARS EXPERIENCE, 2--4 YEARS EX-PERIENCE, 5--7 YEARS EXPERIENCE, AND 8+ YEARS EXPERIENCE,though the main results are similar if we use different cohort groupings ortreat "experience'' as a continuous variable.
4 Descriptive statistics -- examiner citation patternsTable 1 shows descriptive statistics on each of the main independent variables,calculated at the examiner level. The modal experience cohort is the !rst,i.e. most examiners on our January 2001 patents are relatively new. Alsonotable is that there are few examiners in the 5--7 year cohort, consistent withconcerns that numerous examiners leave the USPTO relatively early in theircareers (GAO 2005). But over a quarter of the examining corps are veterans,having stayed with the Of!ce for over 8 years.
On average, examiners accounted for 43.6 percent of citations to patentedprior art in their issued patents, but only 9.5 percent of all citations to non--patent prior art. These !gures are consistent with the !gures reported inSampat (2009), and with the arguments that examiners are better at search-ing patented prior art than non--patent prior art. But for each of these mea-sures, there is considerable variation around the mean, suggesting heterogene-ity across patent examiners. The bivariate correlation between these two mea-sures is positive and signi!cant but weak (r=.29, p<.001), indicating theymovetogether but that each may be picking up different information about searchbehavior.
8 For a non--trivial share of the applications, 16.95 percent, this experience measure wasnegative, in most of these cases taking on a value of --1. This is because the Employee Di-rectories are by !scal rather than calendar years, and also that they are occasionally updatedwith lags. In these cases, we recoded experience to zero. Note also that all of our main resultsare unchanged if we instead use 2001 minus year !rst in directory as our experience measure.
9
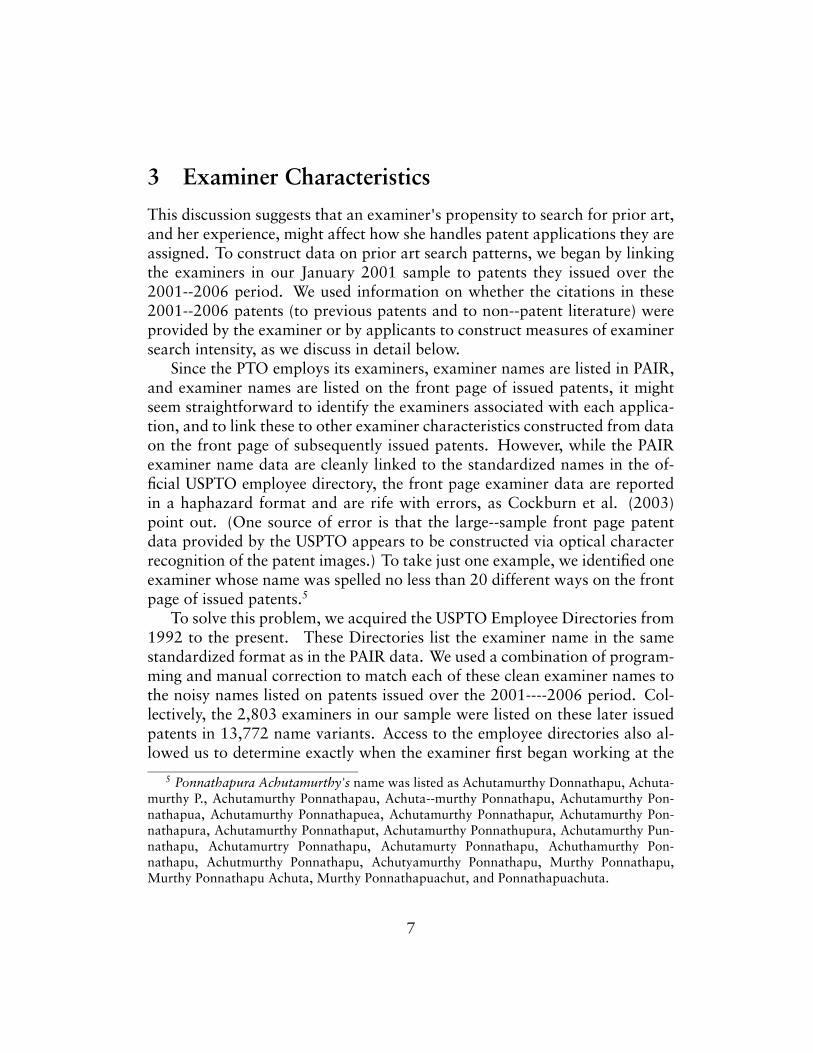
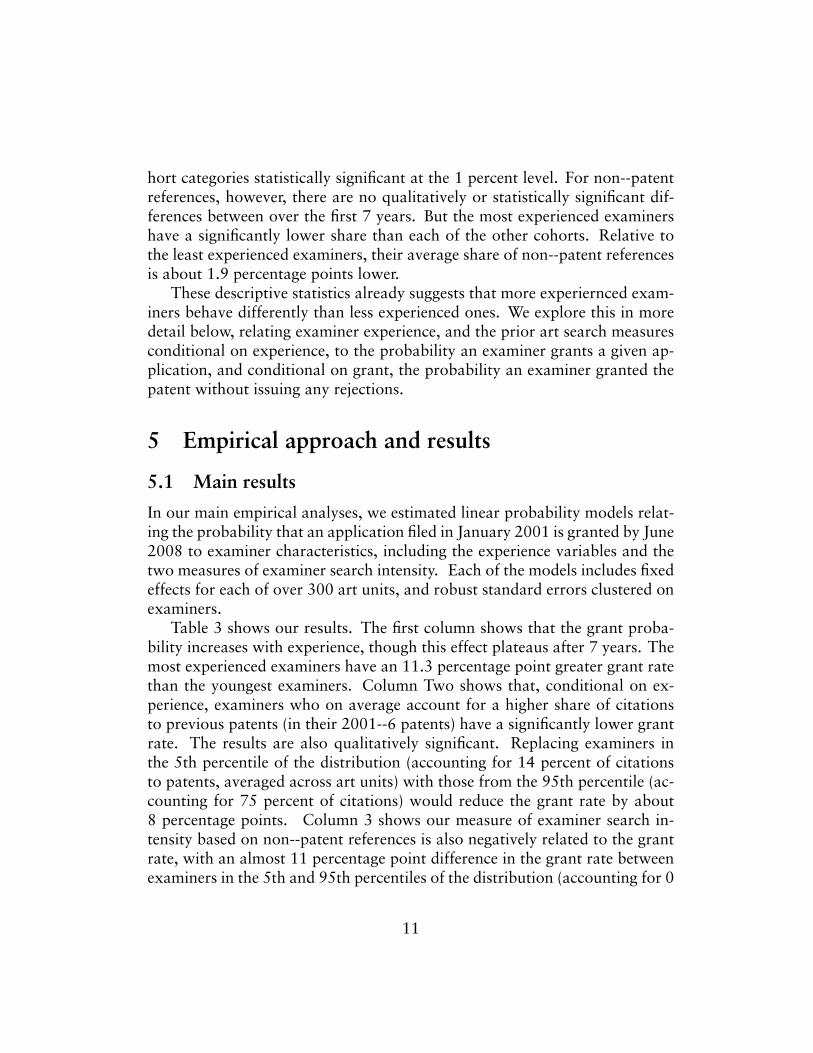
There is also considerable within-- and across--!eld variation in these mea-sures. Figure 1 shows experience by art unit. (Here, for expositional con-venience, we use six broad art units, rather than the 300--plus detailed artunits employed in the regressions.) In the computer art units examiners areoverwhelmingly new hires. There are also a large proportion of new hires incommunications. This may re"ect either greater turnover in those art units (afunction in part of other job opportunities in those industries) or the growthin the number of applications (and thus hiring) in those !elds. By contrast, ex-aminers in the chemical and the mechanical art units have substantially moretenure, and indeed the largest number of them have been at the PTO for morethan eight years. The biotechnology and organic chemistry art unit also in-cludes a large number of examiners with a long tenure at the PTO, though notas many as in the mechanical and chemical industries.
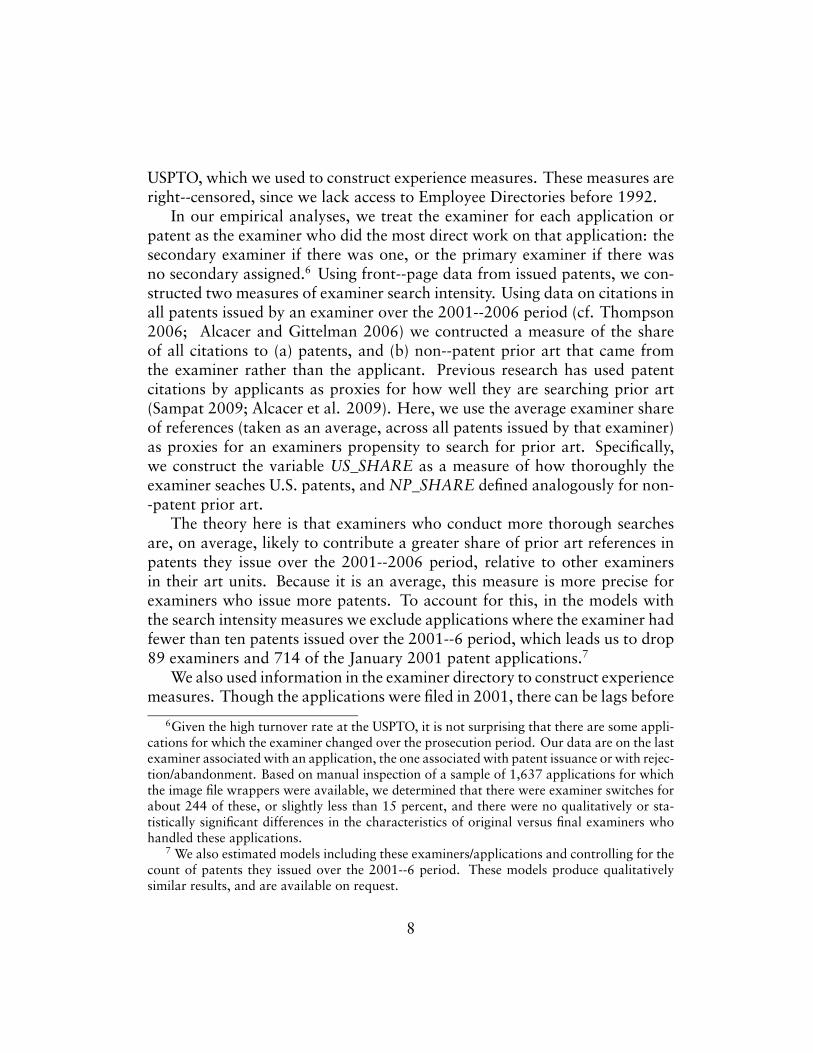
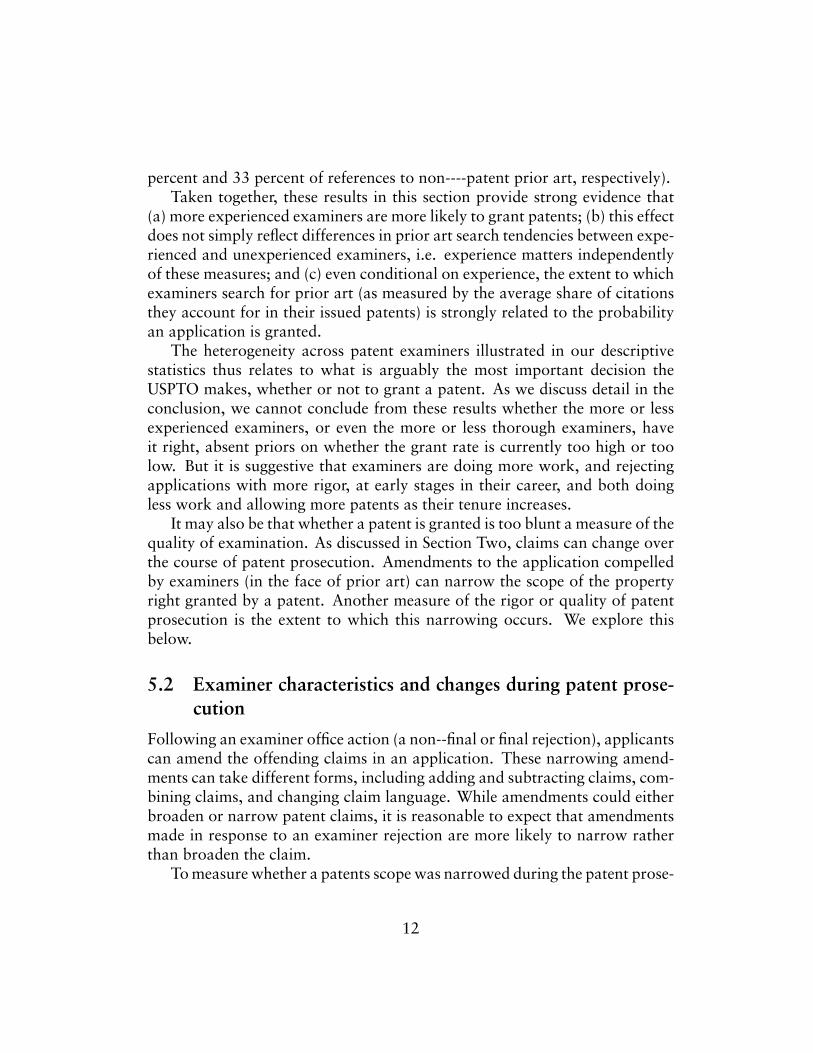
Figure 2 signi!cant cross--!eld variation in the pattern of prior art cita-tions. In most industries, the average examiner share of citations to previouspatents is roughly normally distributed, though the means differ across !elds.In general, the share is higher in the computing and communication arenas;Sampat (2009) and Alcacer et al. (2009) suggest this may re"ect lower incen-tives for applicants in these !elds to search for prior art rather than additionalwork by examiners in those !elds. By contrast, in biotechnology the averageexaminer share of citations is lower, suggesting that applicants in that indus-try conduct prior art searches and that examiners either rely on the submittedresults or are unable to !nd relevant art beyond that submitted by the appli-cant. But even within !elds there is considerable variation around the mean,indicating examiner heterogeneity.
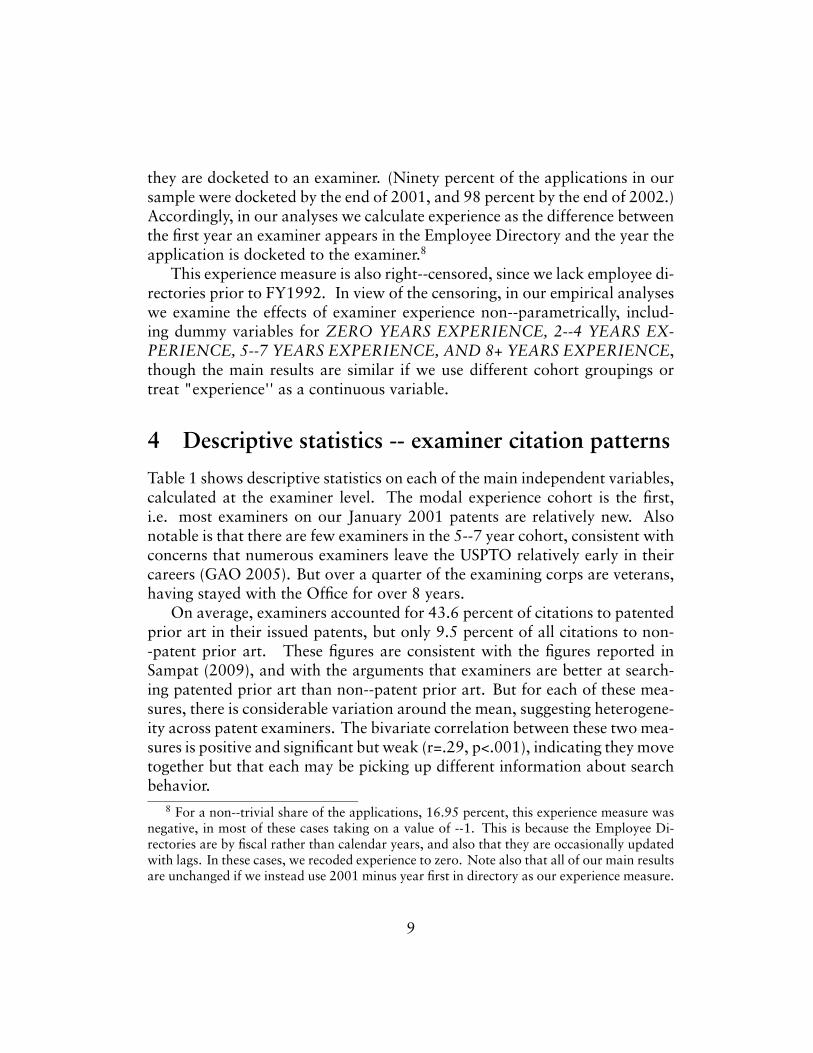
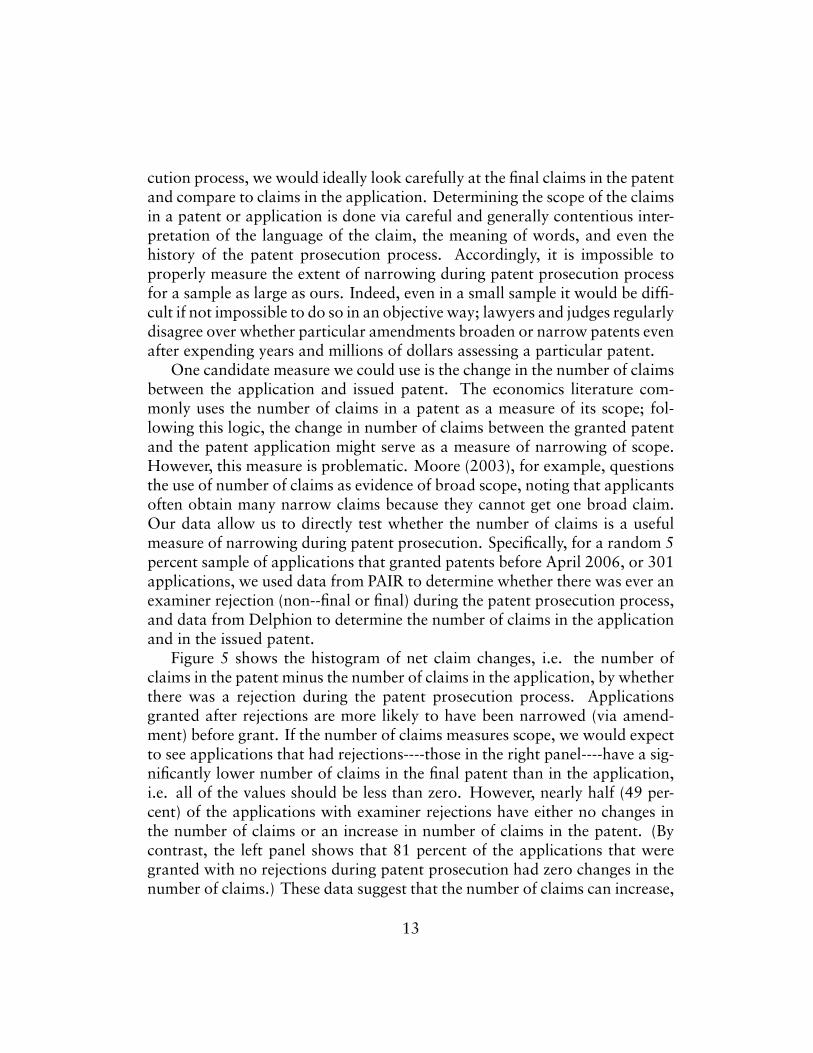
Figure 3 shows that the distribution of citations to non--patent prior art areheavily skewed toward applicant submission in every industry. This may be afunction of the time constraints under which examiners operate, and that is itharder for examiners to !nd for non--patent prior art for the reasons discussedabove. Here again there is variation in the examiner averages within !elds,suggesting that some examiners are systematically more active in searchingnon--patent prior art than others.
Finally, Table 2 shows regression results relating our two measures of ex-aminer search intensity to experience, after controlling for detailed art uniteffects. The !rst column shows that the examiner's average share of patent ref-erences decreases monotonically with experience, with the most experiencedexaminers' share 10.2 percentage points less than that of the least experiencedexaminers (the left out category), and the differences between each of the co-
10
hort categories statistically signi!cant at the 1 percent level. For non--patentreferences, however, there are no qualitatively or statistically signi!cant dif-ferences between over the !rst 7 years. But the most experienced examinershave a signi!cantly lower share than each of the other cohorts. Relative tothe least experienced examiners, their average share of non--patent referencesis about 1.9 percentage points lower.
These descriptive statistics already suggests that more experiernced exam-iners behave differently than less experienced ones. We explore this in moredetail below, relating examiner experience, and the prior art search measuresconditional on experience, to the probability an examiner grants a given ap-plication, and conditional on grant, the probability an examiner granted thepatent without issuing any rejections.
5 Empirical approach and results
5.1 Main resultsIn our main empirical analyses, we estimated linear probability models relat-ing the probability that an application !led in January 2001 is granted by June2008 to examiner characteristics, including the experience variables and thetwo measures of examiner search intensity. Each of the models includes !xedeffects for each of over 300 art units, and robust standard errors clustered onexaminers.
Table 3 shows our results. The !rst column shows that the grant proba-bility increases with experience, though this effect plateaus after 7 years. Themost experienced examiners have an 11.3 percentage point greater grant ratethan the youngest examiners. Column Two shows that, conditional on ex-perience, examiners who on average account for a higher share of citationsto previous patents (in their 2001--6 patents) have a signi!cantly lower grantrate. The results are also qualitatively signi!cant. Replacing examiners inthe 5th percentile of the distribution (accounting for 14 percent of citationsto patents, averaged across art units) with those from the 95th percentile (ac-counting for 75 percent of citations) would reduce the grant rate by about8 percentage points. Column 3 shows our measure of examiner search in-tensity based on non--patent references is also negatively related to the grantrate, with an almost 11 percentage point difference in the grant rate betweenexaminers in the 5th and 95th percentiles of the distribution (accounting for 0
11
percent and 33 percent of references to non----patent prior art, respectively).Taken together, these results in this section provide strong evidence that
(a) more experienced examiners are more likely to grant patents; (b) this effectdoes not simply re"ect differences in prior art search tendencies between expe-rienced and unexperienced examiners, i.e. experience matters independentlyof these measures; and (c) even conditional on experience, the extent to whichexaminers search for prior art (as measured by the average share of citationsthey account for in their issued patents) is strongly related to the probabilityan application is granted.
The heterogeneity across patent examiners illustrated in our descriptivestatistics thus relates to what is arguably the most important decision theUSPTO makes, whether or not to grant a patent. As we discuss detail in theconclusion, we cannot conclude from these results whether the more or lessexperienced examiners, or even the more or less thorough examiners, haveit right, absent priors on whether the grant rate is currently too high or toolow. But it is suggestive that examiners are doing more work, and rejectingapplications with more rigor, at early stages in their career, and both doingless work and allowing more patents as their tenure increases.
It may also be that whether a patent is granted is too blunt a measure of thequality of examination. As discussed in Section Two, claims can change overthe course of patent prosecution. Amendments to the application compelledby examiners (in the face of prior art) can narrow the scope of the propertyright granted by a patent. Another measure of the rigor or quality of patentprosecution is the extent to which this narrowing occurs. We explore thisbelow.
5.2 Examiner characteristics and changes during patent prose-cution
Following an examiner of!ce action (a non--!nal or !nal rejection), applicantscan amend the offending claims in an application. These narrowing amend-ments can take different forms, including adding and subtracting claims, com-bining claims, and changing claim language. While amendments could eitherbroaden or narrow patent claims, it is reasonable to expect that amendmentsmade in response to an examiner rejection are more likely to narrow ratherthan broaden the claim.
Tomeasure whether a patents scope was narrowed during the patent prose-
12
cution process, we would ideally look carefully at the !nal claims in the patentand compare to claims in the application. Determining the scope of the claimsin a patent or application is done via careful and generally contentious inter-pretation of the language of the claim, the meaning of words, and even thehistory of the patent prosecution process. Accordingly, it is impossible toproperly measure the extent of narrowing during patent prosecution processfor a sample as large as ours. Indeed, even in a small sample it would be dif!-cult if not impossible to do so in an objective way; lawyers and judges regularlydisagree over whether particular amendments broaden or narrow patents evenafter expending years and millions of dollars assessing a particular patent.
One candidate measure we could use is the change in the number of claimsbetween the application and issued patent. The economics literature com-monly uses the number of claims in a patent as a measure of its scope; fol-lowing this logic, the change in number of claims between the granted patentand the patent application might serve as a measure of narrowing of scope.However, this measure is problematic. Moore (2003), for example, questionsthe use of number of claims as evidence of broad scope, noting that applicantsoften obtain many narrow claims because they cannot get one broad claim.Our data allow us to directly test whether the number of claims is a usefulmeasure of narrowing during patent prosecution. Speci!cally, for a random 5percent sample of applications that granted patents before April 2006, or 301applications, we used data from PAIR to determine whether there was ever anexaminer rejection (non--!nal or !nal) during the patent prosecution process,and data from Delphion to determine the number of claims in the applicationand in the issued patent.
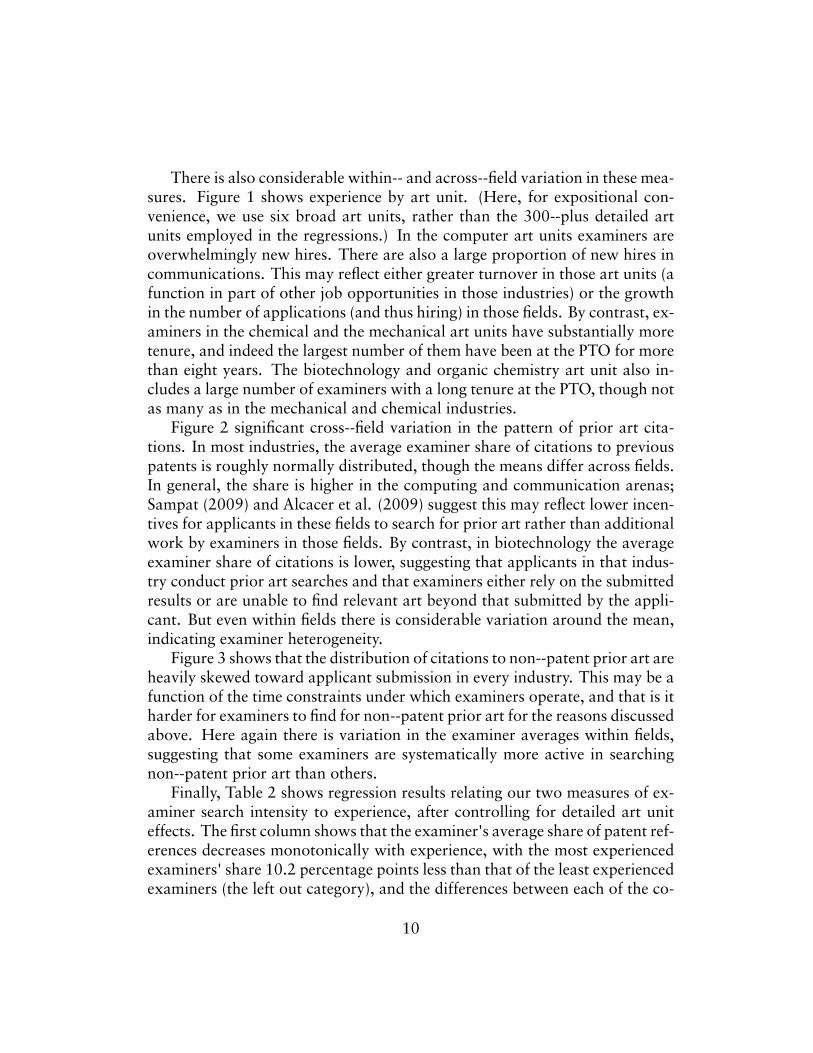
Figure 5 shows the histogram of net claim changes, i.e. the number ofclaims in the patent minus the number of claims in the application, by whetherthere was a rejection during the patent prosecution process. Applicationsgranted after rejections are more likely to have been narrowed (via amend-ment) before grant. If the number of claims measures scope, we would expectto see applications that had rejections----those in the right panel----have a sig-ni!cantly lower number of claims in the !nal patent than in the application,i.e. all of the values should be less than zero. However, nearly half (49 per-cent) of the applications with examiner rejections have either no changes inthe number of claims or an increase in number of claims in the patent. (Bycontrast, the left panel shows that 81 percent of the applications that weregranted with no rejections during patent prosecution had zero changes in thenumber of claims.) These data suggest that the number of claims can increase,
13
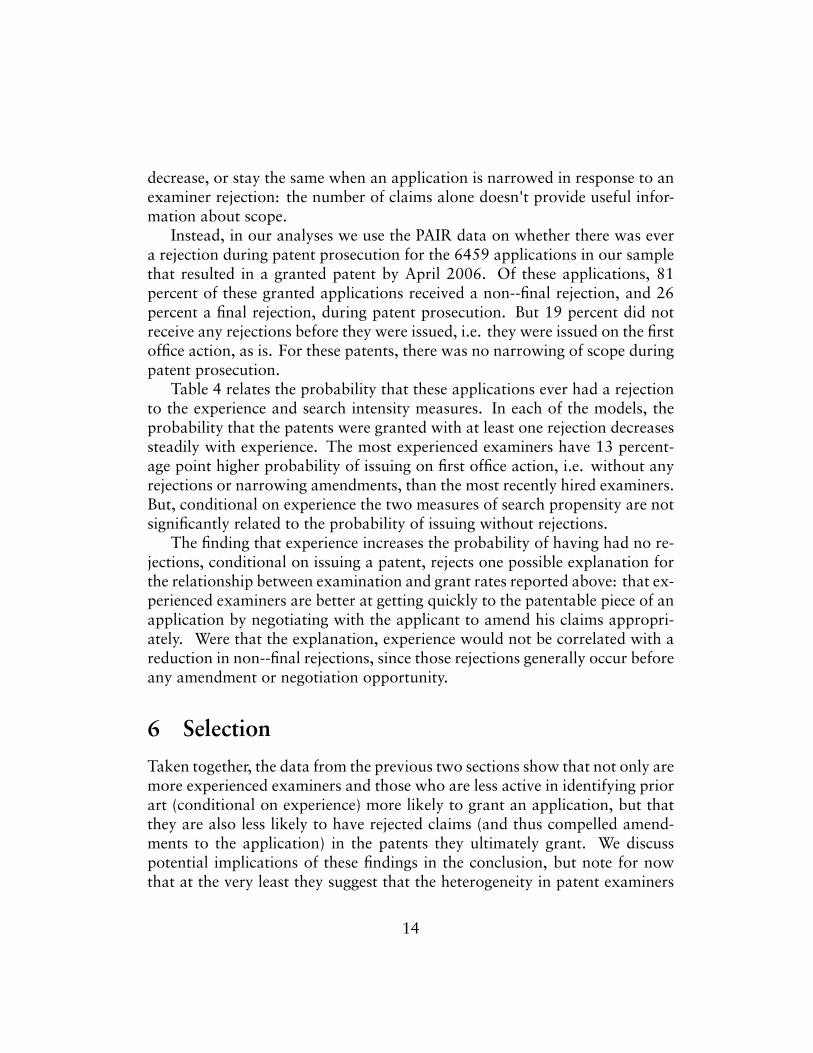
decrease, or stay the same when an application is narrowed in response to anexaminer rejection: the number of claims alone doesn't provide useful infor-mation about scope.
Instead, in our analyses we use the PAIR data on whether there was evera rejection during patent prosecution for the 6459 applications in our samplethat resulted in a granted patent by April 2006. Of these applications, 81percent of these granted applications received a non--!nal rejection, and 26percent a !nal rejection, during patent prosecution. But 19 percent did notreceive any rejections before they were issued, i.e. they were issued on the !rstof!ce action, as is. For these patents, there was no narrowing of scope duringpatent prosecution.
Table 4 relates the probability that these applications ever had a rejectionto the experience and search intensity measures. In each of the models, theprobability that the patents were granted with at least one rejection decreasessteadily with experience. The most experienced examiners have 13 percent-age point higher probability of issuing on !rst of!ce action, i.e. without anyrejections or narrowing amendments, than the most recently hired examiners.But, conditional on experience the two measures of search propensity are notsigni!cantly related to the probability of issuing without rejections.
The !nding that experience increases the probability of having had no re-jections, conditional on issuing a patent, rejects one possible explanation forthe relationship between examination and grant rates reported above: that ex-perienced examiners are better at getting quickly to the patentable piece of anapplication by negotiating with the applicant to amend his claims appropri-ately. Were that the explanation, experience would not be correlated with areduction in non--!nal rejections, since those rejections generally occur beforeany amendment or negotiation opportunity.
6 SelectionTaken together, the data from the previous two sections show that not only aremore experienced examiners and those who are less active in identifying priorart (conditional on experience) more likely to grant an application, but thatthey are also less likely to have rejected claims (and thus compelled amend-ments to the application) in the patents they ultimately grant. We discusspotential implications of these !ndings in the conclusion, but note for nowthat at the very least they suggest that the heterogeneity in patent examiners
14
we identi!ed above is strongly related to important outcomes.One potential threat to the validity of these results is selection. If different
examiners are systematically assigned to "easier" or "harder" applications, orthosemore or less patent--worthy, our estimates would be biased. As discussedabove, our interviews with Supervisory Examiners suggest that an examinersfamiliarity with a speci!c technology appears to play a role in assignmentdecisions. But for selection bias to explain our results, a different type ofselection effect would be necessary. It would require, !rst, that the SPEs bein a position at the outset to assess whether an application was more or lesslikely to be patentable, and second, that they would be motivated to give thosemore likely to be patentable to the most experienced examiners and those whoare less thorough in their prior art searching.
But our interviews reveal no evidence that SPEs do any kind of substantiveevaluation of the applications before assigning them to particular examiners,and the press of work makes it implausible that they could do enough of areview to make a judgment as to whether an incoming application was likelyto make it through the of!ce. Nor would such a selection bias be logical; ifSPEs were in fact engaged in some sort of sorting, we would expect it to workin the opposite direction than our data suggest, with the toughest applicationsrather than the easiest being assigned to the more seasoned examiners.
Nonetheless, in this section we explore selection more systematically. First,using both the application data and granted patent data, we look for evidenceof selection on observables such as the length of the patent, family size, ornumber of claims or prior art citations. Second, we directly control for how"patent--worthy" an application is by looking at whether the same applica-tions were granted in Europe (at the European Patent Of!ce, or EPO).
6.1 Selection on ObservablesThere are two dif!culties in examining potential selection on observable vari-ables. A !rst is that for patent applications, much of the front--page dataavailable for issued patents (including citations and assignee information) isnot available. Accordingly, in addition to examining selection on observablesfor our applications, we also do supplementary analyses on the subset thateventually issued as patents.
More generally, for both applications and patents, it is dif!cult to iden-tify variables that would measure the "patent--worthiness" of an invention.Patent--worthiness is ultimately based on a reading of the claims and a judg-
15
ment (ideally, by a person having ordinary skill in the art) about whether theyare novel and non--obvious in light of the prior art.9
Lacking the ability to make that determination for each of the patents inour sample, we instead collected data on things we could measure to test forselection on observable characteristics. We started with examining the twovariables on which we do have data at the time of application: the number ofpages in the application and the patent family size, i.e. the number of coun-tries in which an application was !led. The latter has been used as a measureof patent value in the applied literature. Table 5 shows the effects of thesevariables on our three examiner characteristics: years of experience (Models1 and 2), the examiners average share of citations to patents (Models 3 and 4)and the examiners average share of citations to non----patent references (Mod-els 5 and 6). In none of the models do these application level variables havea qualitatively and statistically signi!cant relationship to the examiner char-acteristics. This is consistent with our impression that there is no applicationlevel sorting at the USPTO.10
To examine this further, we also looked at application level characteristicsfor granted patents, focusing again on the patents that were granted by 2006for which we have comprehensive data. This analysis requires characteristicsof the application that could plausibly in"uence patent--worthiness, but whichwould not themselves be associated with the effects of examiner characteristicson patent prosecution or features of the granted patents. Accordingly, wedo not examine measures that could re"ect the impact of patent prosecutionprocess itself (like forward citation counts to an issued patent); we insteadfocus on "time zero" measures that re"ect characteristics of the application as!led, rather than the patent as granted.
Speci!cally, we examine the number of references to patented prior art pro-vided by the applicant as part of the application, the number of references tonon--patented prior art, and the number of patents the applicant was issuedin the previous year (2000), a measure of the applicant's experience. Table6 shows results from regressing examiner characteristics on these variables.Models 1 through 3 show that none of these measures have a qualitatively orstatistically signi!cant relationship with examiner experience. Models 4 and 5
9 If there were a ready variable or set of variables that proxied for this, the USPTO's taskwould be much easier.
10 Model 5 does show a statistically signi!cant relationship between number of pages inthe application and the examiner's average share of cites to non--patent prior art, but themagnitude of this relationship is tiny.
16

do show negative and statistically signi!cant relationships between the volumeof citations (to both patented and non--patent prior art) provided by an appli-cant and our measure of examiner propensity to cite U.S. patents. This couldsuggest that applications with less patented prior art are assigned to examin-ers who tend to be more thorough in their searches, providing some evidenceof selection. But while statistically signi!cant these effects are qualitativelysmall: essentially very precisely estimated zeroes. For example, increasing thenumber of applicant references to patents from its 5th to its 95th percentile (anincrease from 0 to 20 applicant citations) would be associated with only a 0.4percentage point difference in the examiners average share of patent citations.A similar increase for the number of applicant non--patent references (from 0to 6 references) would be associated with a 0.36 percentage point difference.Moreover, Models 7 through 9 show that we dont see similar effects for ourother measure of examiner search propensity, an examiners average share ofcitations to non--patent literature.
The analyses thus show little evidence of selection on observables, usingeither the limited observables we have for applications overall, or the morecomprehensive set of application--level measures we have for applications thateventually mature into patents. But none of these variables is a perfect measureof the patent--worthiness of the application. For reasons discussed above, it islikely impossible to measure patent--worthiness directly.11 In the next section,we examine a proxy variable, whether the same application was granted in bythe EPO.
6.2 Selection: Evidence from the EPOWe collected information from Delphion on whether the applications in oursample were also !led at the European Patent Of!ce (EPO), which examinesand grants European patents for the 32 States in the European Patent Con-vention. For applications that were not granted by the EPO, we supplementedthe Delphion data with information from the European Register on whetherthey were rejected/withdrawn or currently pending. Following Webster et al.(2007), we limited our sample to the 8905 applications !led in January 2001that had a single priority application, to be certain that the corresponding EPOapplications were on the same invention.
11For the same reason it is unlikely that SPEs are judging patent--worthiness either, in de-ciding how to distribute applications across examiners.
17
Of these U.S. applications, 2,761 were !led at the EPO, which had grantedpatents on 46 percent of them as of June 2008. Table 7 shows a cross--tabulation of EPO and USPTO outcomes as of June 2008. Of the applicationsthat were granted in the U.S., slightly more than half (52.1 percent) have beengranted by the EPO.12 By contrast, of those granted by the EPO, the vast ma-jority (88 percent) were also granted by the USPTO.
Table 8 shows the effects of the experience and search intensity measureson probability of U.S. grant, conditional on EPO status (As in the main analy-ses above, we drop the small number of applications still pending in the U.S.)Model 1 shows that relative to applications patented at the EPO (the left outcategory), applications rejected at the EPO have a 27 percentage point lowerprobability of being patented in the U.S. But controlling for EPO status, moreexperienced examiners have a statistically and qualitatively higher likelihoodof grant than less experienced examiners. Similarly, Models 2 and 3 showthat conditional on experience and EPO status, our two measures of exam-iner search intensity are negatively and signi!cantly related to probability ofgrant in the U.S.
These models control for EPO status. In Table 9, we also assess the ef-fects of experience on likelihood of U.S. patent grant separately for applica-tions that were (a) patented at the EPO and (b) rejected at the EPO. Model 1shows that examiner experience doesn't affect the likelihood that applicationspatented at the EPO are patented in the U.S.: there is no statistically signi!cantdifference between older and newer examiners probability of approving ap-plications that were also approved by the EPO. By contrast, Model 2 showsthat more experienced examiners are more likely to grant applications thatwere rejected by the EPO.
We are reluctant to treat EPO decisions as a gold standard to which U.S.decisions should be compared, given that the EPO too faces concerns aboutlax patent quality. But it is interesting the experience effect does not re"ectyounger examiners being more likely to reject applications patented at theEPO, but instead that older examiners are more likely to patent applicationsrejected by the EPO. And our !nding that the experience effect persists whenwe control for EPO decisions is further reason to believe there is not a selection
12This number differs somewhat from that in Jensen et al. (2006), who show that 63percent of granted applications in the U.S. are also granted by the EPO in the most recentcohort for which they have data (priority year 1995). But this !gure is trending downwardover time (from 1990 to 1995) in their data, and, based on our data from 2001, appears tohave continued to do so.
18
effect at work.
7 Other explanations for the experience effectThe analyses in the previous section suggest that the experience effect does notre"ect sorting of applications across examiners. What then, is its source?
One possible explanation is selective retention. As we pointed out above,the PTO faces signi!cant employee attrition, particularly among examinerswho have been with the agency less than 5 years (GAO 2008). If examinerswho were more diligent, more thorough, more technically sophisticated, ormore highly educated were more likely to leave the USPTO earlier in their ca-reers, perhaps because they have better job opportunities, this could provideone explanation for our results. Under this interpretation, the experience ef-fect would re"ect different features of examiners who stay versus leave, notanything about changing incentives or capabilities facing a given examinerover her career at the USPTO.
Since we lack any additional demographic information about our examin-ers, this is dif!cult to assess directly. Moreover, since we only have a cross--section of applications at a given point in time, we cannot examine changesin an examiner's grant behavior over her career.
However, the USPTO Employee Directories do give us information onwhen and if the examiners in our January 2001 sample left the agency, as-suming this happened before 2007. Using these data, we determined that 20.1percent of the examiners in our sample had left by the end of 2006. Attritionis more pronounced for the newest examiners (consistent with the !gures inGAO 2008) with 27.1 percent of the examiners hired in 2001 having left bythe end of 2006.
To assess whether examiners who would exit are different from others, weestimated models relating the two measures of search intensity and grant ratesto a dummy variable indicating whether the examiner would leave the USPTOby 2006. Table 10 shows the results. Models 1 and 2 respectively regressan examiner's average share of patent references and non--patent referenceson whether the examiner would exit, for examiners hired in 2001. Model3, estimated at the patent application level, relates whether an application isgranted to whether the examiner would exit, again only for examiners hiredin 2001. In none of these models do examiners who would exit the USPTOwithin !ve years look different from the others hired at the same time. Models
19
4 through 6 are similar, but include all examiners (not just those hired in 2001),and indicator variables for each of the experience categories (not reported).The estimated coef!cients show that those who would leave have indeed havesigni!cantly higher shares of patent and non--patent citations (Columns 4 and5), but that their grant rates are similar to those who did not leave (Model 6).These results suggest that selective retention is unlikely to be the source of theexperience effect we documented above.
Another possibility is examiner tenure. After promotion, examiners arenot subject to the same level of scrutiny. Among other things, with full sig-natory authority they can sign off on their own applications without review.This could plausibly cause them to be more lax.
It is dif!cult to test for a tenure effect directly. A !rst problem is data: welack direct information about whether examiners are tenured or untenured.But we can determine which examiners were de!nitely tenured by 2001, usingdata from issued patents. Speci!cally, we can infer an examiner's probabletenure year as the !rst year after which she was listed as primary examiner onall the patents she issued that were applied for in that year. In other words,we determined the !rst application year after which an examiner consistentlyhad signatory authority.
Not surprisingly, the likelihood an examiner is tenured increases sharplywith experience, with 9.6 percent of examiners with 2--4 years of experiencetenured by 2001, 41.6 percent of examiners with 5--7 years of experience,and 90.7 percent of examiners with 8 or more years experience. The strongrelationship between tenure and experience also make it dif!cult to separatelyidentify a tenure effect separate from an experience effect. More importantlytenure is non--random: for a given level of experience, those that are tenuredare likely to be systematically different from those who are not.
While we cannot rule out a tenure effect, our !nding that there are dif-ferences in prior art searching tendencies,, grant probabilities, and likelihoodof granting on !rst of!ce action even between the 2--4 year cohort (the bulkof whom are not tenured) and brand new examiners suggest that it alone isunlikely to drive the experience effect.
Another potential explanation is the quota system, which imposes increas-ing demands on examiners, and decreased time per count, as they accumu-late experience at the USPTO. It may be that more experienced examiners aredoing less prior art searching and granting more patents because they are re-quired to process more applications in the same time frame. Still another pos-sible explanation is that more senior examiners are less familiar with current
20
trends in their !eld, and therefore more likely to !nd applications patentable.Whether the experience effect documented in the main models re"ects thequota system, technological obsolescence, or tenure, it suggests that humanresource policies at the USPTO could affect outcomes, as we discuss in moredetail below.
8 DiscussionConsistent with the qualitative and quantitative results of Cockburn et al.(2003), our data show considerable examiner--level heterogeneity both withinand across art units. Moreover, this variation is related to the most importantdecision made by the USPTO: whether or not to grant a patent. In particular,we !nd that more experienced examiners are signi!cantly more likely to grant,and, conditional on experience, examiners that conduct more intensive priorart searches are least likely to grant.
Taken alone, the result that more senior examiners are more likely to grantcould suggest that they can more quickly !gure out what is patentable in anapplication. But our data on prior art citation patterns do not support thatconclusion. The !nding that more senior examiners systematically cite lessprior art reinforces the inference that senior examiners are doing less work,rather than that they are merely getting it right more often than junior ex-aminers.13 And the fact that seniority is correlated with more !rst--actionallowances is also inconsistent with the idea that more experienced examinersare simply negotiating the applicant to a narrower, patentable outcome; in the!rst--action allowance cases there is no negotiation at all.
We show that these results are unlikely to re"ect either sorting of appli-cations across examiners or selective retention of examiners. But our datacannot separately distinguish between a technological obsolescence effect, anexperience effect driven by the count/quota requirements over an examiner'scareer, or a tenure effect, each of which would have different policy implica-tions. But under any of these explanations, our results suggest that humanresource policies have important effects on USPTO outcomes. The tenure sys-tem, the count system, and examiner recruitment and retention policies should
13 Similarly, while one might have sought to explain the lower citation patterns by moreexperienced examiners as greater parsimony learned from experience, the fact that those re-duced citations are accompanied by a greater propensity to grant patents undermines thatexplanation.
21
be a more prominent part of current patent reform deliberations.Our !ndingsmay also have signi!cant implications for the industry--speci!c
results we discussed in our prior paper (Lemley and Sampat 2008). Whilethere is no question that there are industry--speci!c differences throughoutpatent prosecution, some of the differences we identi!ed in the prior articlemay turn out to owe their origin to differences in examiners. In this study, wedetermined that the computer industry had by far the highest percentage ofnew examiners: more than 60 percent of examiners in that art unit had lessthan a year of experience, compared with less than 20 percent in mechanicsand chemistry. In our prior paper, we found that the computer industry hada surprisingly low grant rate: lower than any other industry. At least someof that result may be explained by the prevalance of new examiners in thatindustry. If it is generalizable, this result may have another effect: booms inpatenting in new industries may be self--limiting. The more applications are!led in an art unit, the more new examiners the art unit will have to hire. Andbecause new examiners are more likely to reject patents, this will drive downthe grant rate in that art unit, limiting the number of patents that result.
We also show, we believe for the !rst time in a large sample analysis, thatidenti!cation of prior art matters for patent of!ce outcomes. Examiners thattend to identify more prior art reject more applications. While the welfareimplications of these !ndings depend on the costs of identifying additionalprior art, and ones beliefs on whether the PTO currently makes too manyType I or Type II errors, our !ndings provide support for the feasibility ofcurrent initiatives (e.g. the Peer to Patent initiative, or post--grant opposition)aimed at affecting the grant rate by bringing more prior art to the attentionof examiners. Indeed, they may also support more dramatic proposals, suchas the idea (currently under consideration in Congress) that applicants shouldbe forced to conduct a diligent search for prior art when they !le a patentapplication.14
Finally, our data suggest that whether the PTO grants or rejects a patentis signi!cantly related to the happenstance of which examiner is assigned theapplication. That is not an encouraging result if our goal is a system thatrewards deserving patent applicants while denying patents to the rest. Nor
14 This policy proposal presupposes that applicant searches and examiner searches aresubstitutes. That may not be so. If it is the act of searching that engages an examiner withthe application, increasing the rigor of the examination process, outsourcing search to theapplicant, to another patent of!ce, or to a third party may not produce the same result. Ourdata do not provide evidence on this issue.
22
is it clear that, in this environment, all issues patents should enjoy the samepresumption of validity.
9 SourcesAlcacer, J. andM. Gittleman (2006)."How do I knowwhat you know? Patentexaminers and the generation of patent citations.'' Review of Economics andStatistics 84(4): 774-779.
Alcacer, Gittleman, et al. (2009)."Applicant and Examiner citations topatents; an exploration and overview'' Forthcoming, Research Policy.
Allison, J. R. and M. A. Lemley (2000)."Who's Patenting What? An Em-pirical Exploration of Patent Prosecution'' Vanderbilt Law Review 53(2099).
Cockburn, I., S. Kortum, et al. (2003). "Are All Patent Examiners Equal?Examiners, Patent Characteristics, and Litigation Outcomes'' Patents in theKnowledge-Based Economy: 46-47.
Crouch, D. (2008). "Extending the Patent Term: Most Patents are Ex-tendedDue to PTODelay,'' http://www.patentlyo.com/patent/2008/03/extending-the-p.html.
Federal Trade Commission. (2003) To promote innovation: The properbalance of competition and patent law and policy.
Jaffe, A. B. and J. Lerner (2004). Innovation and Its Discontents: Howour broken patent system is endangering innovation and progress, and whatto do about it. Princeton, Princeton University Press.
Jensen, P. H., A. Palangkaraya, et al. (2006)."Disharmony in internationalpatent of!ce decisions.'' Federal Circuit Bar Journal 15 (4) 679(704).
Lanjouw and Schankerman (2001). "Characteristics of Patent Litigation:a window on competition.'' RAND Journal of Economics 32(1): 129-151.
Lemley, M. A. (2001). "Rational Ignorance at the Patent Of!ce.'' North-western University Law Review 95(1495).
23
Lemley, M. A. and K. A. Moore (2004). "Ending Abuse of Patent Contin-uations.'' Boston University Law Review 82(77).
Lemley, M.A. and Carl Shapiro (2005) "Probabilistic Patents'' Journal ofEconomic Perspectives 19(2), 2005.
Lemley, M. A. and B. Sampat (2009). "Is the Patent Of!ce a RubberStamp.'' Emory Law Journal forthcoming
Lichtman, D. (2004). "Rethinking Prosecution History Estoppel'' Univer-sity of Chicago Law Review 71(151).
A. A. Lipscomb and A. E. Bergh, editors. The Writings of Thomas Jeffer-son. The Writings of Thomas Jefferson. Thomas Jefferson Memorial Associ-ation, Washington.
Merges (2001). "As Many as Six Impossible Patents Before Breakfast:Property Rights for Business Concepts and Patent System Reform'' BerkeleyTechnology Law Journal 14: 577-615.
Moore (2003). "Xenophobia in American Courts.'' Northwestern Uni-versity Law Review 97(1497).
Nordhaus, W. (1969) Invention, Growth, and Welfare: A TheoreticalTreatment of Technological Change. Cambridge, MA.
Patel, R. P., D. R. Brownstone, et al. (2003). "Understanding After Finaland After Allowance Patent Practice.''
Sampat (2009). "When do applicants search for prior art?'' Mimeo,Columbia University.
Thomas (2001). "Collusion and Collective Action in the Patent System:A Proposal for Patent Bounties.'' University of Illinois Law Review 2001(1):305-353.
24
Thompson, Peter. (2006) "Patent Citations and the Geography of Knowl-edge Spillovers: Evidence from Inventor and Applicant Added Citations'' Re-view of Economics and Statistics. Vol. 88, No. 2: 383-388.
U.S. General Accountability Of!ce. (2005) "USPTO Has Made Progressin Hiring Examiners, but Challenges to Retention Remain''
Webster, E., A. Palangkaraya, et al. (2007). "Characteristics of interna-tional patent application outcomes.'' Economic Letters 95 362(368).
25
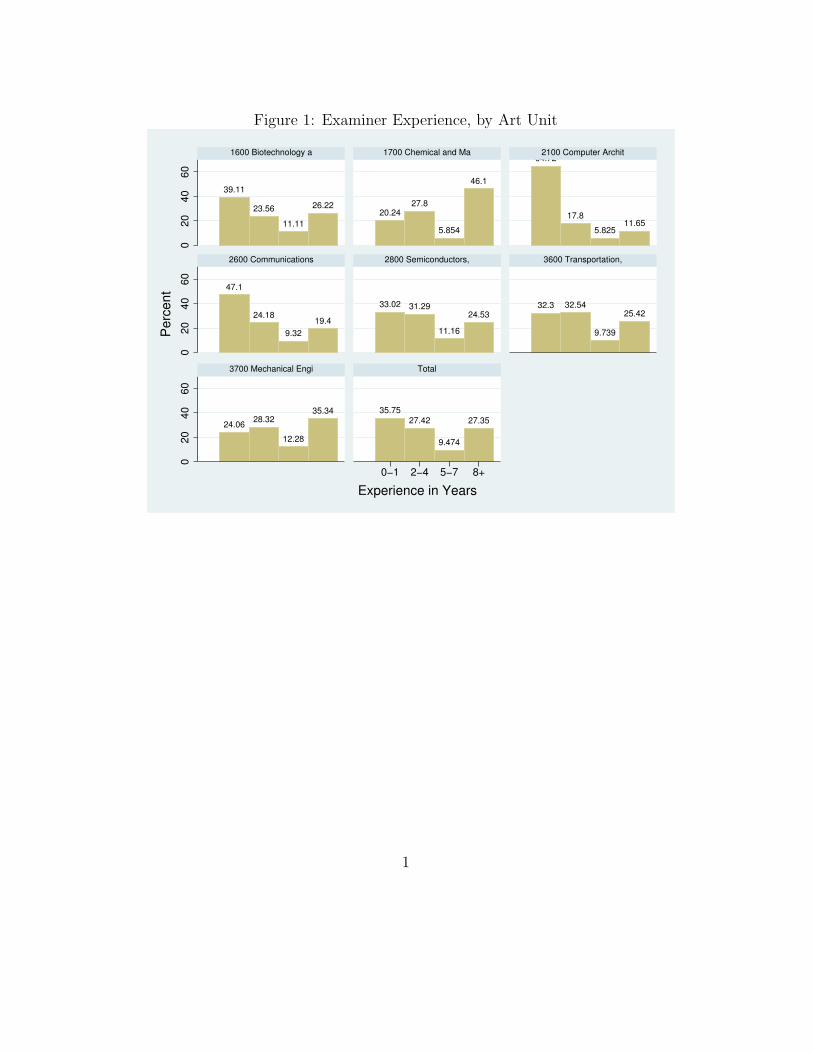
Figure 1: Examiner Experience, by Art Unit
39.11
23.5611.11
26.2220.24
27.8
5.854
46.1
64.72
17.85.825
11.65
47.1
24.18
9.3219.4
33.02 31.29
11.1624.53
32.3 32.54
9.739
25.42
24.06 28.32
12.28
35.34 35.7527.42
9.474
27.35
020
4060
020
4060
020
4060
0!1 2!4 5!7 8+
1600 Biotechnology a 1700 Chemical and Ma 2100 Computer Archit
2600 Communications 2800 Semiconductors, 3600 Transportation,
3700 Mechanical Engi Total
Perc
ent
Experience in Years
1
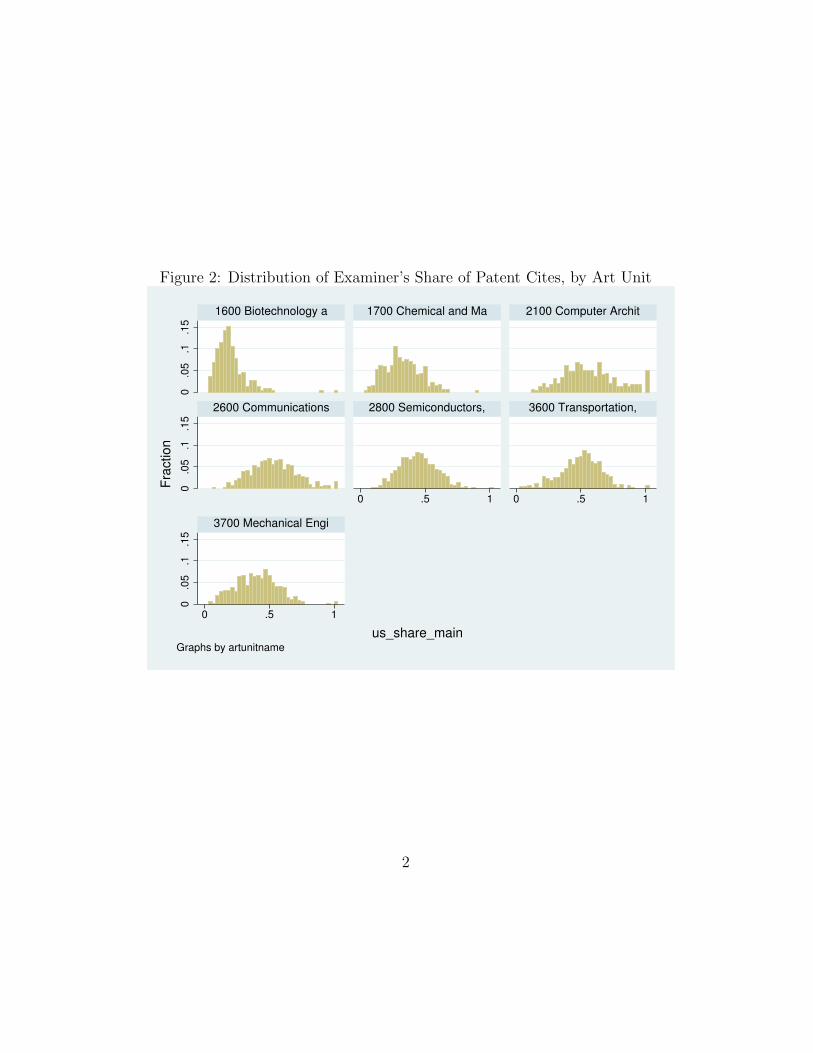
Figure 2: Distribution of Examiner’s Share of Patent Cites, by Art Unit
0.0
5.1
.15
0.0
5.1
.15
0.0
5.1
.15
0 .5 1 0 .5 1
0 .5 1
1600 Biotechnology a 1700 Chemical and Ma 2100 Computer Archit
2600 Communications 2800 Semiconductors, 3600 Transportation,
3700 Mechanical Engi
Frac
tion
us_share_mainGraphs by artunitname
2
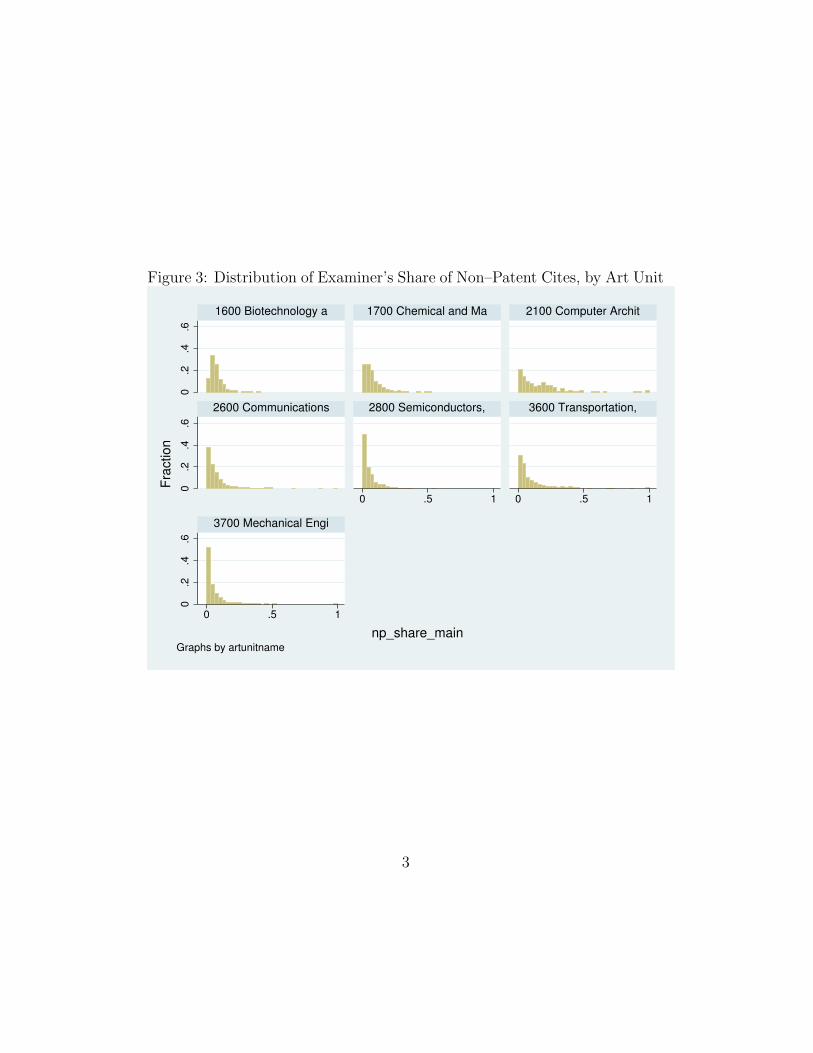
Figure 3: Distribution of Examiner’s Share of Non–Patent Cites, by Art Unit
0.2
.4.6
0.2
.4.6
0.2
.4.6
0 .5 1 0 .5 1
0 .5 1
1600 Biotechnology a 1700 Chemical and Ma 2100 Computer Archit
2600 Communications 2800 Semiconductors, 3600 Transportation,
3700 Mechanical Engi
Frac
tion
np_share_mainGraphs by artunitname
3
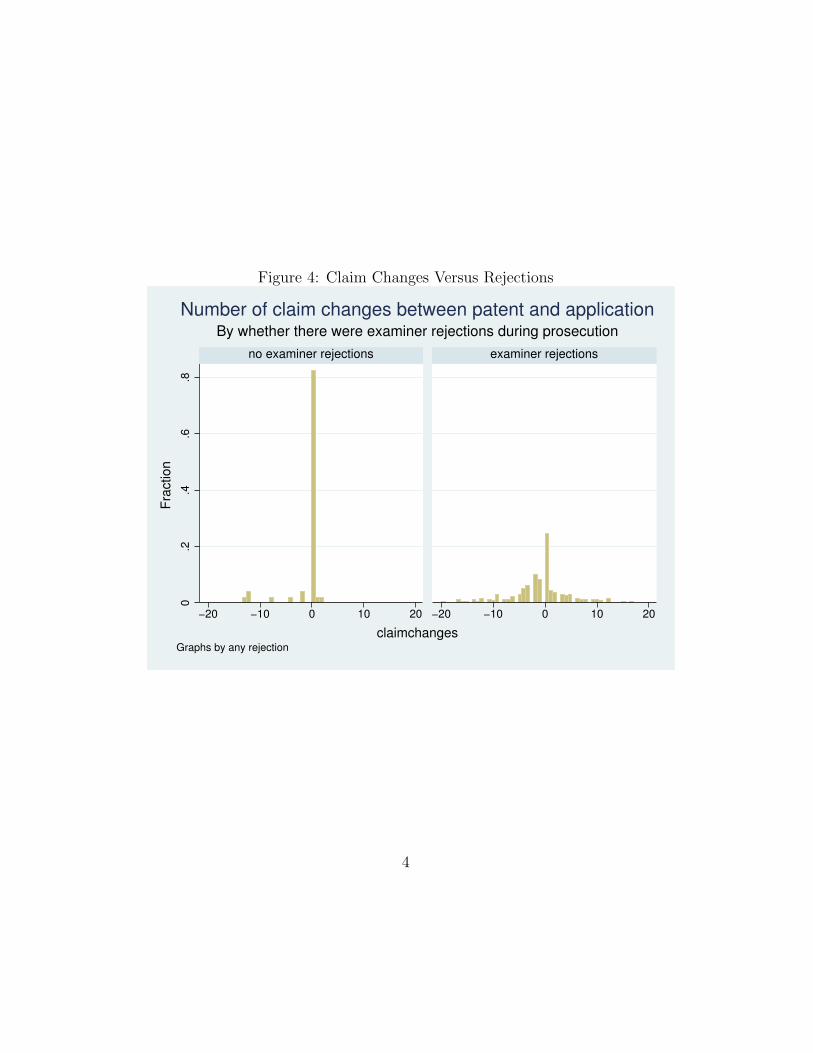
Figure 4: Claim Changes Versus Rejections
0.2
.4.6
.8
!20 !10 0 10 20 !20 !10 0 10 20
no examiner rejections examiner rejections
Frac
tion
claimchangesGraphs by any rejection
By whether there were examiner rejections during prosecutionNumber of claim changes between patent and application
4
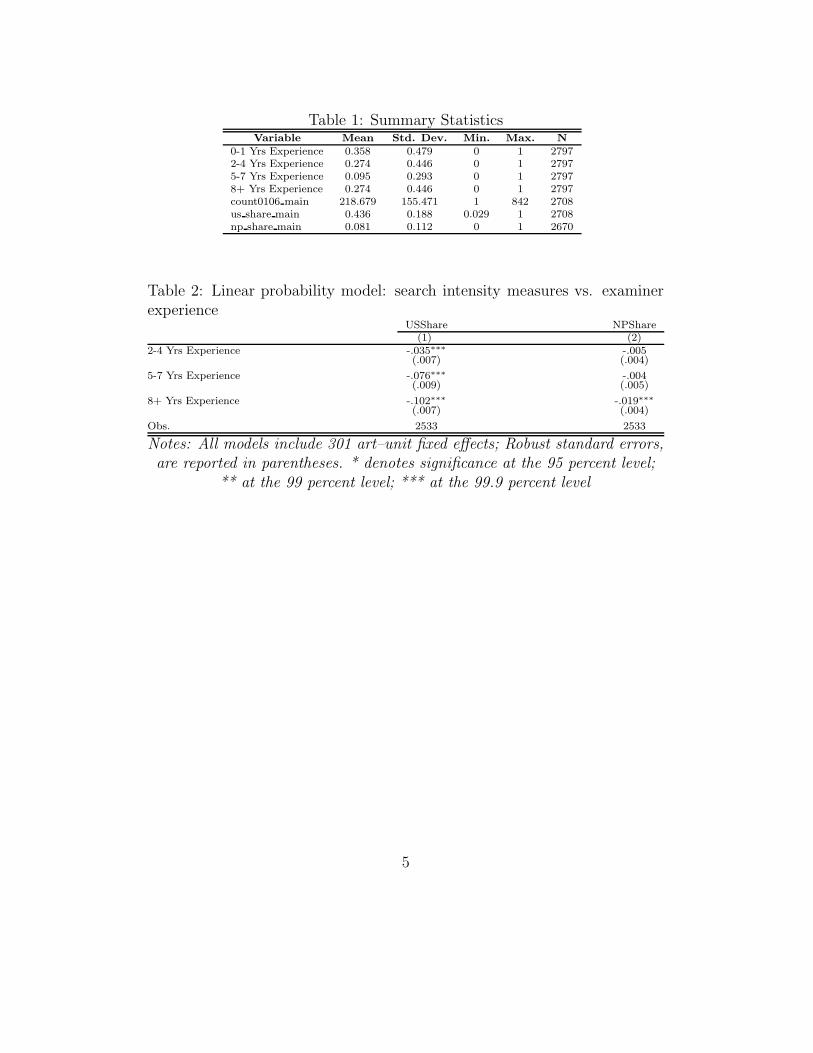
Table 1: Summary StatisticsVariable Mean Std. Dev. Min. Max. N
0-1 Yrs Experience 0.358 0.479 0 1 27972-4 Yrs Experience 0.274 0.446 0 1 27975-7 Yrs Experience 0.095 0.293 0 1 27978+ Yrs Experience 0.274 0.446 0 1 2797count0106 main 218.679 155.471 1 842 2708us share main 0.436 0.188 0.029 1 2708np share main 0.081 0.112 0 1 2670
Table 2: Linear probability model: search intensity measures vs. examinerexperience
USShare NPShare(1) (2)
2-4 Yrs Experience -.035!!! -.005(.007) (.004)
5-7 Yrs Experience -.076!!! -.004(.009) (.005)
8+ Yrs Experience -.102!!! -.019!!!(.007) (.004)
Obs. 2533 2533
Notes: All models include 301 art–unit fixed e!ects; Robust standard errors,are reported in parentheses. * denotes significance at the 95 percent level;
** at the 99 percent level; *** at the 99.9 percent level
5
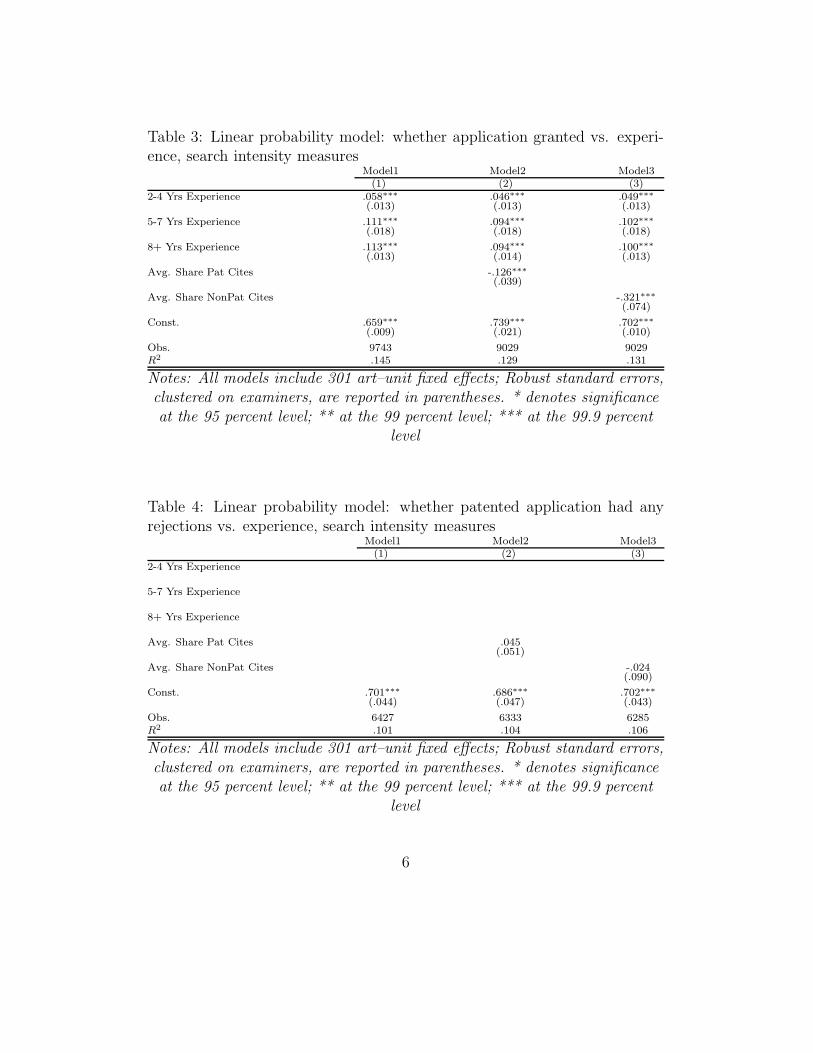
Table 3: Linear probability model: whether application granted vs. experi-ence, search intensity measures
Model1 Model2 Model3(1) (2) (3)
2-4 Yrs Experience .058!!! .046!!! .049!!!(.013) (.013) (.013)
5-7 Yrs Experience .111!!! .094!!! .102!!!(.018) (.018) (.018)
8+ Yrs Experience .113!!! .094!!! .100!!!(.013) (.014) (.013)
Avg. Share Pat Cites -.126!!!(.039)
Avg. Share NonPat Cites -.321!!!(.074)
Const. .659!!! .739!!! .702!!!(.009) (.021) (.010)
Obs. 9743 9029 9029R2 .145 .129 .131
Notes: All models include 301 art–unit fixed e!ects; Robust standard errors,clustered on examiners, are reported in parentheses. * denotes significanceat the 95 percent level; ** at the 99 percent level; *** at the 99.9 percent
level
Table 4: Linear probability model: whether patented application had anyrejections vs. experience, search intensity measures
Model1 Model2 Model3(1) (2) (3)
2-4 Yrs Experience
5-7 Yrs Experience
8+ Yrs Experience
Avg. Share Pat Cites .045(.051)
Avg. Share NonPat Cites -.024(.090)
Const. .701!!! .686!!! .702!!!(.044) (.047) (.043)
Obs. 6427 6333 6285R2 .101 .104 .106
Notes: All models include 301 art–unit fixed e!ects; Robust standard errors,clustered on examiners, are reported in parentheses. * denotes significanceat the 95 percent level; ** at the 99 percent level; *** at the 99.9 percent
level
6
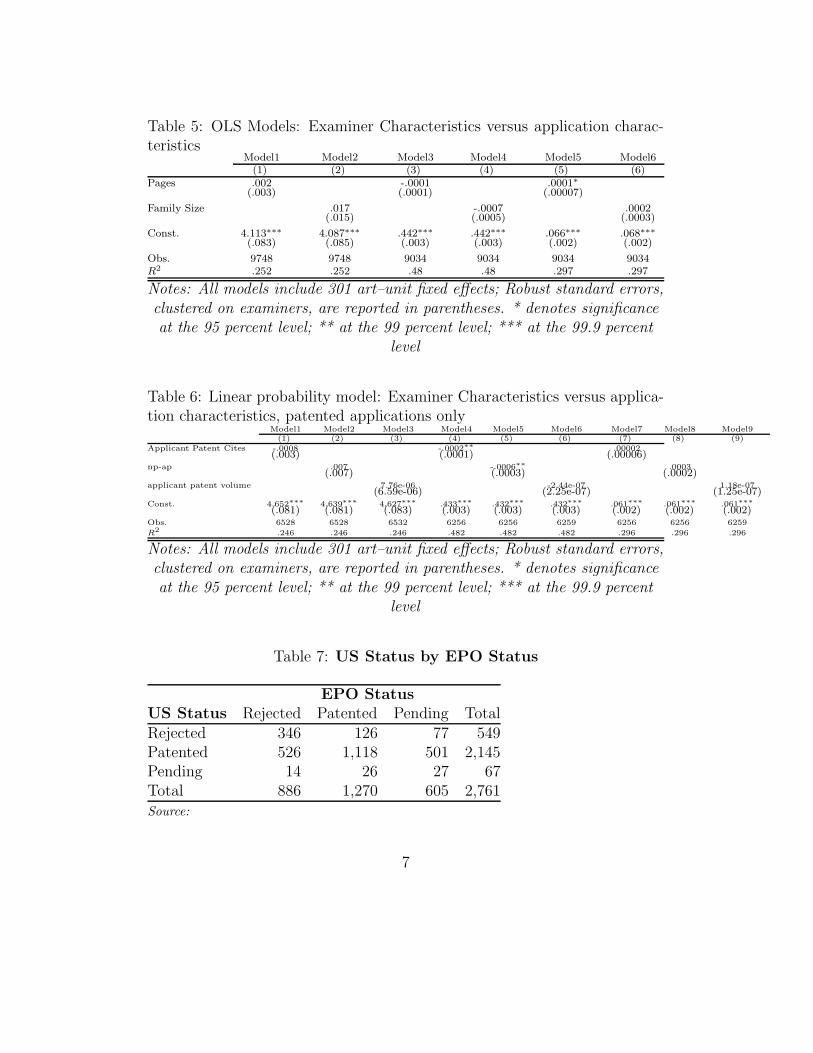
Table 5: OLS Models: Examiner Characteristics versus application charac-teristics
Model1 Model2 Model3 Model4 Model5 Model6(1) (2) (3) (4) (5) (6)
Pages .002 -.0001 .0001!(.003) (.0001) (.00007)
Family Size .017 -.0007 .0002(.015) (.0005) (.0003)
Const. 4.113!!! 4.087!!! .442!!! .442!!! .066!!! .068!!!(.083) (.085) (.003) (.003) (.002) (.002)
Obs. 9748 9748 9034 9034 9034 9034R2 .252 .252 .48 .48 .297 .297
Notes: All models include 301 art–unit fixed e!ects; Robust standard errors,clustered on examiners, are reported in parentheses. * denotes significanceat the 95 percent level; ** at the 99 percent level; *** at the 99.9 percent
level
Table 6: Linear probability model: Examiner Characteristics versus applica-tion characteristics, patented applications only
Model1 Model2 Model3 Model4 Model5 Model6 Model7 Model8 Model9(1) (2) (3) (4) (5) (6) (7) (8) (9)
Applicant Patent Cites -.0008 -.0002!! .00002(.003) (.0001) (.00006)
np-ap .007 -.0006!! .0003(.007) (.0003) (.0002)
applicant patent volume 7.76e-06 -2.44e-07 1.18e-07(6.59e-06) (2.25e-07) (1.25e-07)
Const. 4.652!!! 4.639!!! 4.627!!! .433!!! .432!!! .432!!! .061!!! .061!!! .061!!!(.081) (.081) (.083) (.003) (.003) (.003) (.002) (.002) (.002)
Obs. 6528 6528 6532 6256 6256 6259 6256 6256 6259R
2 .246 .246 .246 .482 .482 .482 .296 .296 .296
Notes: All models include 301 art–unit fixed e!ects; Robust standard errors,clustered on examiners, are reported in parentheses. * denotes significanceat the 95 percent level; ** at the 99 percent level; *** at the 99.9 percent
level
Table 7: US Status by EPO Status
EPO Status
US Status Rejected Patented Pending Total
Rejected 346 126 77 549Patented 526 1,118 501 2,145Pending 14 26 27 67Total 886 1,270 605 2,761
Source:
7
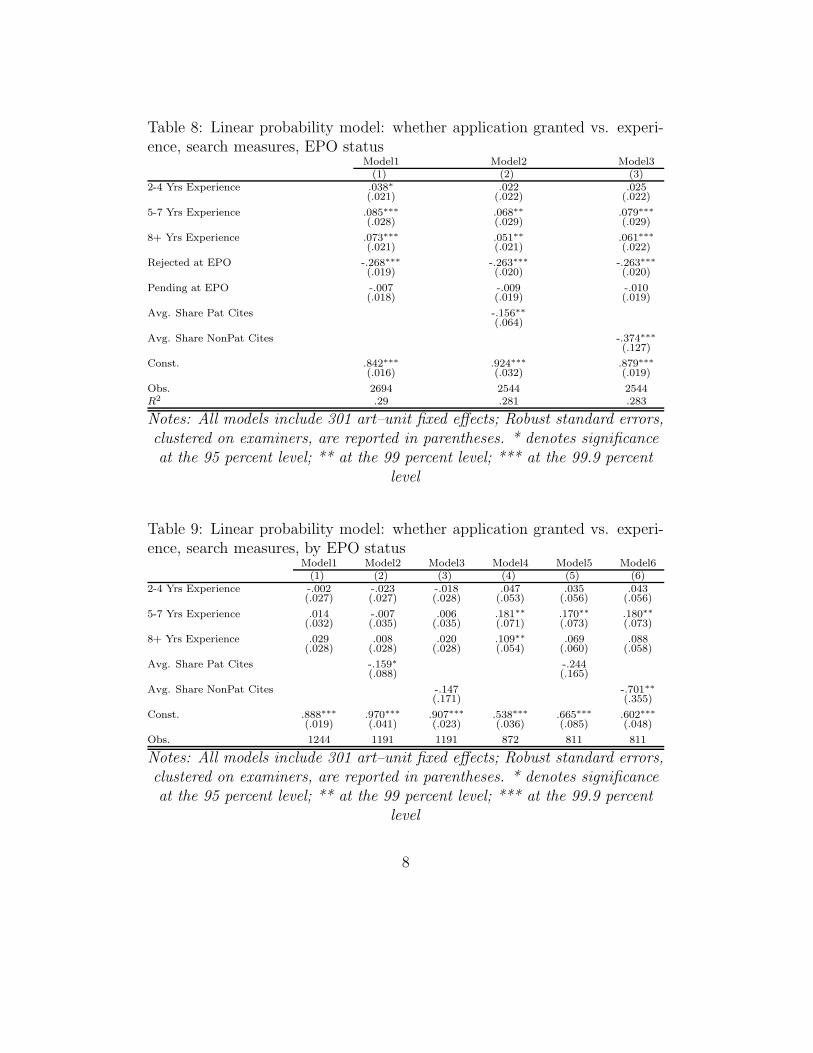
Table 8: Linear probability model: whether application granted vs. experi-ence, search measures, EPO status
Model1 Model2 Model3(1) (2) (3)
2-4 Yrs Experience .038! .022 .025(.021) (.022) (.022)
5-7 Yrs Experience .085!!! .068!! .079!!!(.028) (.029) (.029)
8+ Yrs Experience .073!!! .051!! .061!!!(.021) (.021) (.022)
Rejected at EPO -.268!!! -.263!!! -.263!!!(.019) (.020) (.020)
Pending at EPO -.007 -.009 -.010(.018) (.019) (.019)
Avg. Share Pat Cites -.156!!(.064)
Avg. Share NonPat Cites -.374!!!(.127)
Const. .842!!! .924!!! .879!!!(.016) (.032) (.019)
Obs. 2694 2544 2544R2 .29 .281 .283
Notes: All models include 301 art–unit fixed e!ects; Robust standard errors,clustered on examiners, are reported in parentheses. * denotes significanceat the 95 percent level; ** at the 99 percent level; *** at the 99.9 percent
level
Table 9: Linear probability model: whether application granted vs. experi-ence, search measures, by EPO status
Model1 Model2 Model3 Model4 Model5 Model6(1) (2) (3) (4) (5) (6)
2-4 Yrs Experience -.002 -.023 -.018 .047 .035 .043(.027) (.027) (.028) (.053) (.056) (.056)
5-7 Yrs Experience .014 -.007 .006 .181!! .170!! .180!!(.032) (.035) (.035) (.071) (.073) (.073)
8+ Yrs Experience .029 .008 .020 .109!! .069 .088(.028) (.028) (.028) (.054) (.060) (.058)
Avg. Share Pat Cites -.159! -.244(.088) (.165)
Avg. Share NonPat Cites -.147 -.701!!(.171) (.355)
Const. .888!!! .970!!! .907!!! .538!!! .665!!! .602!!!(.019) (.041) (.023) (.036) (.085) (.048)
Obs. 1244 1191 1191 872 811 811
Notes: All models include 301 art–unit fixed e!ects; Robust standard errors,clustered on examiners, are reported in parentheses. * denotes significanceat the 95 percent level; ** at the 99 percent level; *** at the 99.9 percent
level
8
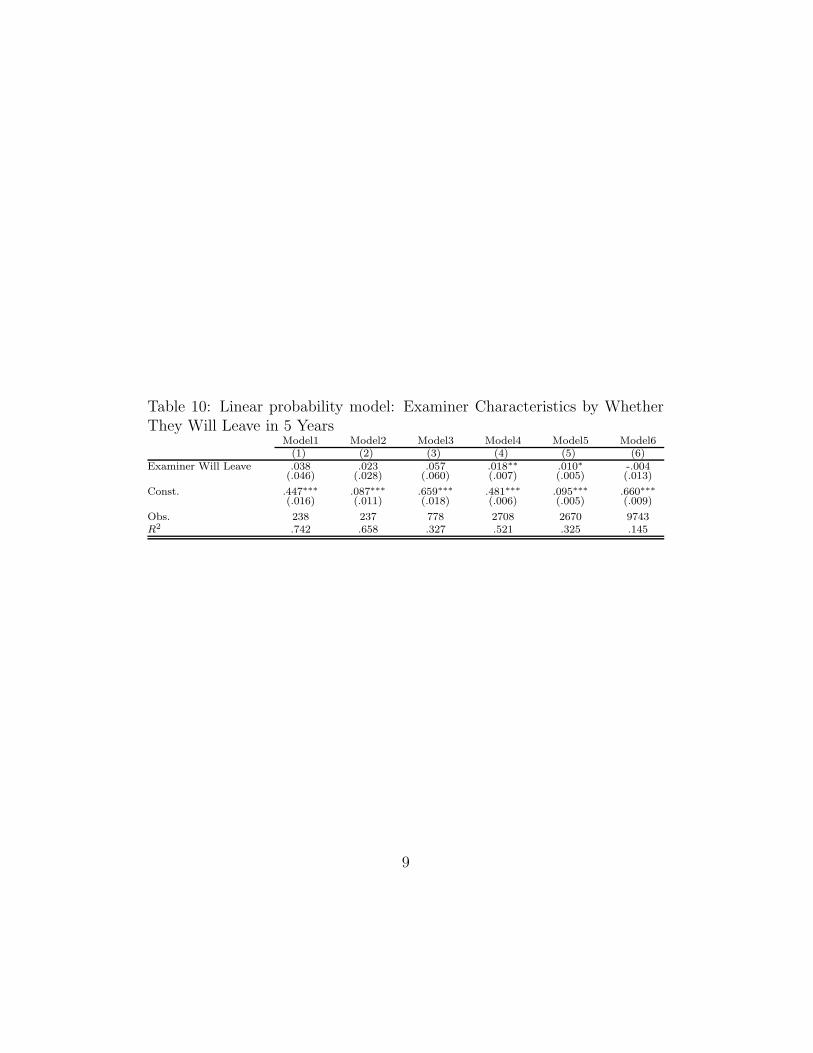
Table 10: Linear probability model: Examiner Characteristics by WhetherThey Will Leave in 5 Years
Model1 Model2 Model3 Model4 Model5 Model6(1) (2) (3) (4) (5) (6)
Examiner Will Leave .038 .023 .057 .018!! .010! -.004(.046) (.028) (.060) (.007) (.005) (.013)
Const. .447!!! .087!!! .659!!! .481!!! .095!!! .660!!!(.016) (.011) (.018) (.006) (.005) (.009)
Obs. 238 237 778 2708 2670 9743R2 .742 .658 .327 .521 .325 .145
9