Exadata Health and Resource Utilization Monitoring · Exadata Health and Resource Utilization...
45
Exadata Health and Resource Utilization Monitoring Exadata Database Machine KPIs ORACLE WHITE PAPER | September 2016
Transcript of Exadata Health and Resource Utilization Monitoring · Exadata Health and Resource Utilization...
Exadata Health and Resource Utilization Monitoring
Exadata Database Machine KPIs ORACLE WHITE PAPER | September 2016

1 | EXADATA DATABASE MACHINE KEY PERFORMANCE INDICATORS
Contents
Introduction .................................................................................................................................................. 2
Exadata Overview ........................................................................................................................................ 2
Storage Server Architecture .......................................................................................................................... 3
Key Performance Indicators .......................................................................................................................... 5
Enterprise Manager Terms ........................................................................................................................... 6
Metric Extensions.......................................................................................................................................... 7
Storage Server KPIs ....................................................................................................................................... 8
Creating Storage Server KPI Metric Extensions ........................................................................................ 9
Creating Storage Server Grid Service ...................................................................................................... 22
Creating Storage Server Grid Service Performance Metrics ................................................................... 24
Compute Node KPIs .................................................................................................................................... 27
CPU Utilization ........................................................................................................................................ 27
Memory ................................................................................................................................................... 31
Swap Utilization ...................................................................................................................................... 34
Load Average........................................................................................................................................... 36
Infiniband Switch KPIs ................................................................................................................................. 38
Creating Infiniband Switch KPI Metric Extension .................................................................................... 38
Conclusion ................................................................................................................................................... 43
2 | EXADATA DATABASE MACHINE KEY PERFORMANCE INDICATORS
Introduction
Oracle Exadata provides customers with a tightly-integrated hardware and software stack. The
components work together, making the solution extremely performant. Having an understanding of the
components and setting up appropriate monitoring are key tasks for Exadata administrators. In this
whitepaper the components of the Exadata I/O stack will be discussed, key performance indicators
identified, and Oracle’s world class monitoring solution, Enterprise Manager, will be used to provide a
holistic approach to making sure the environment is functioning properly.
Exadata Overview
Figure 1 shows an Exadata rack layout for a typical two-socket system (e.g. X5-2). This system would be
classified as a full rack as there are eight compute nodes/database servers and fourteen storage servers.
Notice there are three InfiniBand switches as well as a Cisco Ethernet switch. Two of the InfiniBand (IB)
switches, also known as leaf switches, serve as primary and backup switches for the InfiniBand fabric
local to the rack. The third switch, also known as a spine switch, is used for connectivity between racks.
(Note that starting with the Exadata X4 series, the spine switch is optional and no longer shipped as a
standard component.) If the Exadata rack in question is an eight socket system (e.g. X5-8) the rack would
be similar; however only two larger (4 RU) compute nodes would be present. In addition to full racks,
half, quarter, eighth, and elastic configuration racks can also be ordered. Elastic configurations allow
Oracle Exadata racks to have customer-defined combinations of database servers and Exadata Storage
Servers. For example, Oracle Exadata Database Machine X5-2 Elastic Configuration can have zero to 22
database servers, zero to 19 Exadata Storage Servers, or a combination of database servers and Exadata
Storage Servers.

3 | EXADATA DATABASE MACHINE KEY PERFORMANCE INDICATORS
Figure 1
Storage Server Architecture
Figure 2 is an image of an Exadata Storage Server. X4 and previous generation Exadata Storage Servers
consisted exclusively of physical disks for persistent storage. However, starting with X5 generation
servers, Exadata Storage Servers can be ordered with either physical disks or flash disks. Standard
Storage Servers contain 12 physical disks and 4 PCI-E flash memory cards. Extreme Flash Storage Servers
contain 8 PCI-E flash memory cards.
Figure 2

4 | EXADATA DATABASE MACHINE KEY PERFORMANCE INDICATORS
The amount of memory on each card will vary depending on the generation of the server. Smart Flash
Cache for the Storage Server uses memory on the flash cards.
There are several layers of abstraction for the devices in the Storage Server.
Physical Device – The actual physical spinning drive or PCI-E flash card.
LUN – A logical abstraction of the physical device. Multiple LUNs can exist on one disk.
The first two LUNs on the first two physical devices are used for storing the operating
system of the Storage Server.
Cell Disk – A layer of abstraction on top of the LUN. A cell disk by default is comprised of
one LUN.
Grid Disk – A grid disk is comprised of all or part of a cell disk. One or more grid disks can
be created on a cell disk. The first grid disk that is created upon a cell disk is placed on
the outer sectors of the underlying hard disk, providing it with the best performance. By
default, three grid disks are created on each cell disk: DATA, RECO and DBFS with the
exception of the first two cell disks which are smaller due to placement of the operating
system. The first two cell disks do not by default have DBFS grid disks placed on them.
ASM Disk group – Disk groups are created on top of the grid disks and are setup in much
the same way as with a non-Exadata system. ASM accesses the grid disks via the
InfiniBand fabric in the rack.
Physical devices used for Smart Flash Cache will not have Grid Disks or ASM Disk groups created on
them.
The PCI-E flash cards in the Storage Server comprise the Exadata Smart Flash Cache and Smart Flash Log.
Exadata Smart Flash Cache understands the different types of Database I/O operations and makes cache
decisions accordingly. Exadata Smart Flash Cache can operate in two modes:
Write Through – Provides the ability to cache read I/Os. Write operations go straight to
disk.
Write Back – In addition to caching read/IOs, provides the ability to cache write I/Os
directly to PCI flash.
Exadata Smart Flash logging allows the Exadata flash storage to serve as a secondary destination for
redo log writes.

5 | EXADATA DATABASE MACHINE KEY PERFORMANCE INDICATORS
Key Performance Indicators
A Key Performance Indicator (KPI) is a measurement used to define and evaluate successful operation.
In the context of this whitepaper KPIs are defined and used to evaluate if compute node, storage server
and Infiniband switch performance are within acceptable ranges.
A relatively simple generic example of a KPI would be CPU utilization. If a given system’s performance
degrades when CPU usage exceeds 95%, then 95% would be the critical threshold for the KPI. Many
times it is useful to have a threshold not only for when levels are critical but before they are critical as
well. A warning threshold should be set so that administrators can be notified early enough to correct
the issue before it becomes critical. For example, the warning threshold could be 90%. These are only
example values to differentiate critical and warning thresholds.
Defining thresholds for metrics can be a challenging task. Threshold values for some metrics will be
easily determined as opposed to others which may vary depending on workload, business rules, etc.
Although some sample thresholds are provided in the following sections, it will be necessary to carefully
evaluate every environment to setup the best possible monitoring. Refer to the MAA white paper
Exadata Health and Resource Utilization Monitoring - Adaptive Thresholds for details on how to define
thresholds accurately.
In the CPU example above it is relatively easy to set the thresholds because CPU usage is well
understood and in most cases the threshold would be close to the same between servers and
environments. Unfortunately, many other KPIs are more difficult to define, especially KPIs that relate to
I/O. Not only can the thresholds be difficult to define but in some instances the KPIs themselves are hard
to identify. Looking at an Exadata Storage Server, there can be over 3,000 Storage Server metrics.
Sorting through the data and identifying which ones are important can be very challenging!
When looking at a system or subsystem holistically, often one KPI isn’t enough to identify issues. Take
for example a vanilla Oracle Linux server. What would be necessary to identify if the server is performing
within specification? In the above example, CPU was identified as a KPI. However, there are other areas
of server performance that would need to be taken into account such as memory, paging, disk, etc. The
same holds true for the Exadata I/O subsystem. Although there are many metrics that are valid and
important, no single metric can identify when the I/O system is at capacity.
For example, one indicator that is often looked at is I/Os per second (IOPS). IOPS shows the number of
read and write operations to a disk. It might seem that this would be a finite number upon which it
would be easy to base a threshold. However, the nature of the workload can affect the maximum
number of IOPS a disk can perform. For example, a disk can perform far more small I/Os than large I/Os
in a given period. So combining IOPS with other Storage Server metrics gives us a more comprehensive
look at the environment.

6 | EXADATA DATABASE MACHINE KEY PERFORMANCE INDICATORS
Enterprise Manager Terms
Enterprise Manager (EM) provides extensive monitoring capabilities for Oracle Exadata. The following
section will describe the basic concepts of monitoring an Exadata environment in Enterprise Manager
using EM’s Extensibility features to define the KPIs discussed earlier. Before digging in deeply there are a
few EM terms that should be defined.
Agent – A process that runs on a host to monitor the status, health, and performance of all managed components (also referred to as targets) on that host. In Exadata, the agents run only on the compute nodes. The Storage Server servers are monitored via the compute node agents.
Plug-In – A Plug-in is a group of files (such as target definition files, collection scripts to collect
metrics from targets, and any custom user interface (UI) components). In the following
discussion, the Exadata Plug-In will be used extensively. Plug-Ins are deployed to the OMS(s) and
to the agent(s) requiring them.
Target – A component monitored by Enterprise Manager through an agent.
Metric – Measurement used to monitor target conditions or state.
Metric Extension – Provides the capability to extend Enterprise Manager monitoring to
conditions specific to particular environments via custom scripts, SQL queries, and function calls.
Threshold – A value defined for a metric. This value sets the level at which notifications or
actions occur for the metric. There are two levels of thresholds: warning and critical.
Service – An entity that provides a useful function to its users. In Enterprise Manager, services
can be defined and monitored. Services can be used to monitor things such as the end-to-end
availability of an application (Database, Servers, Web Tier, etc.). For the purposes of this
document services will be used to monitor an Exadata I/O subsystem.
This document assumes that the Enterprise Manager environment used is version 13.1 or greater.

7 | EXADATA DATABASE MACHINE KEY PERFORMANCE INDICATORS
Metric Extensions
Metric Extensions allow users to extend Enterprise Manager capabilities by defining custom metrics to
cover critical information specific to the operation of their environment. There are two types of Metric
Extensions available which are defined below:
Repository-side metric extensions: This type of Metric Extension allows use of SQL scripts to
extract information directly from the Enterprise Manager repository and raise alerts for the
target against which the repository-side extension is run.
Metric Extensions (default): This type of Metric Extension allows for the creation of a script that
will be deployed to the host of the monitoring agent for the chosen target. A wide variety of
target types can be chosen. The Exadata target types are Compute Node, Cisco Switch, ILOM,
PDU, KVM and the Storage Server.
Both types of Metric Extensions will be used throughout this paper. For a complete overview of Metric
Extensions please refer to Enterprise Manager Cloud Control Administrator Guide.

8 | EXADATA DATABASE MACHINE KEY PERFORMANCE INDICATORS
Storage Server KPIs
Although EM has a wide range of metrics available for Exadata Storage Servers, it is necessary to
aggregate some of the information using the Metric Extensions listed in Figure 3 below to give an idea of
whether the Storage Server infrastructure is at capacity. Figure 3 lists 10 Metric Extensions (five for Hard
Disk and five for Flash) that compose the necessary KPIs for an Exadata Storage Grid. Two of the metrics,
Exadata Storage Server HardDisk I/O Health and Exadata Storage Server FlashDisk I/O Health, are
created as a function of the other new Metric Extensions. These metrics will evaluate the other KPI
metrics to see how many are exceeding their thresholds. Evaluating multiple metrics together allows
more accurate identification of whether an issue is occurring.
Keep in mind that the roll up of all the data so far is still at the individual Storage Server level. At this
point there is still no way to evaluate the Exadata Storage Server Grid as a whole.
The warning and critical thresholds below will vary depending on many factors including rack size,
Exadata version, application workload, etc. Initial values can be set using the information in Figure 3 and
in the product datasheets available at:
http://www.oracle.com/technetwork/database/exadata/overview/index.html.
Metric Name Description Warning Critical Unit
Total Cell Flash IOPS
Combines Aggregated total Flash read and write IOPS on a cell
112,500 125,000 IOPS
Total Cell HardDisk IOPS
Combines Aggregated total HardDisk read and write IOPS on a cell
3,240
3,600 IOPS
Total Cell Flash Throughput
Combines Aggregated total Celldisk read and write throughput for Flash on a cell
14,400 16,000 MB/s
Total Cell HardDisk Throughput
Combines Aggregated total Celldisk read and write throughput for HardDisk on a cell
4,860 5,400 MB/s
Total Avg Flash Response Time
Combines Aggregated average Celldisk read and write latency of Flash on a cell
8 10 ms per request
Total Avg HardDisk Response Time
Combines Aggregated average Celldisk read and write latency of HardDisks on a cell
15 20 ms per request

9 | EXADATA DATABASE MACHINE KEY PERFORMANCE INDICATORS
Total Avg Flash Load Average IO Load for Flash on a cell 8 10 CPU queue length
Total Avg HardDisk Load
Average IO Load for HardDisk on a cell 8 10 CPU queue length
Exadata Storage Server FlashDisk IO Health
Number of identified performance metrics that are exceeding their defined critical thresholds for FlashDisk
2 3 KPI Metrics
Exadata Storage Server HardDisk IO Health
Number of identified performance metrics that are exceeding their defined critical thresholds for HardDisk
2 3 KPI Metrics
Figure 3
Once initial warning and critical values are set, metric data should be monitored during peak usage to
determine settings specific to the environment, and updated with appropriate values. In environments
with multiple Database Machines, each target should have KPIs setup using the process described
above; thresholds cannot be assumed to be consistent between environments. Refer to Exadata Health
and Resource Utilization Monitoring - Adaptive Thresholds for more information on setting thresholds.
The composite metrics Exadata Storage Server FlashDisk I/O Health and HardDisk I/O Health depicted in
Figure 3 are indicators comprised of the other KPI metrics. They summarize the KPIs that are exceeding
their threshold values. Since these composite metrics are meant to summarize the overall health it is
suggested that alerting for incidents be enabled for these metrics only.
Creating Storage Server KPI Metric Extensions
To create the above Metric Extensions, follow the instructions below. Optionally the Metric Extensions
can be downloaded from MOS Note 2094648.1. Note that if the Metric Extensions are downloaded and
installed, it will still be necessary to publish the Metric Extensions and deploy them to targets.
In the instructions below, Blue Highlighted Text indicates a menu item on the Enterprise Manager Top
Menu bar, depicted in Figure 4.

10 | EXADATA DATABASE MACHINE KEY PERFORMANCE INDICATORS
Figure 4
Navigate to the Metric Extension Home Page:
Enterprise Monitoring Metric Extensions
The first Metric Extension to be created is “Total Cell HardDisk IOPS” for the entire cell server.
On the Metric Extension Home Page, create a new Metric Extension by selecting the following, as
shown in Figure 5:
Actions Create Repository-side Metric Extension
Figure 5

11 | EXADATA DATABASE MACHINE KEY PERFORMANCE INDICATORS
On the “Create New: General Properties” page, enter the following:
Target Type: “Oracle Exadata Storage Server”
Name ME$: “Total_Cell_HardDisk_IOPS”
Display Name: “Total Cell HardDisk IOPS”
Description: “Combines Aggregated total HardDisk read and write IOPS on a cell”
Data Collection Radio Button: Enabled
Data Upload: “Yes”
Use of Metric Data Radio Button: Alerting and Historical Trending
Frequency Drop Down: By Minutes
Repeat Every: 15 Minutes
Select the “Next” button:
Figure 6
On the “SQL Query” page, enter the following SQL:
SELECT c.target_guid, SUM(c.value) total_cell_harddisk_iops
FROM sysman.mgmt$metric_current c, sysman.mgmt$availability_current
a
WHERE c.target_type = 'oracle_exadata'
AND c.metric_name = 'Aggregated_HardNFlashDisk_Metric'
AND c.key_value = 'HardDisk'
AND c.metric_column in ('sum_cd_read_iops','sum_cd_write_iops')
AND c.target_guid = a.target_guid
AND a.availability_status_code = 1
AND SYSTIMESTAMP AT TIME ZONE 'UTC'-
FROM_TZ(TO_TIMESTAMP(TO_CHAR(c.collection_timestamp,'dd-mon-yyyy
hh24:mi:ss'),'dd-mon-yyyy hh24:mi:ss'),c.timezone_region) AT TIME ZONE
'UTC' < '0 01:00:00.000'
GROUP BY c.target_guid
12 | EXADATA DATABASE MACHINE KEY PERFORMANCE INDICATORS
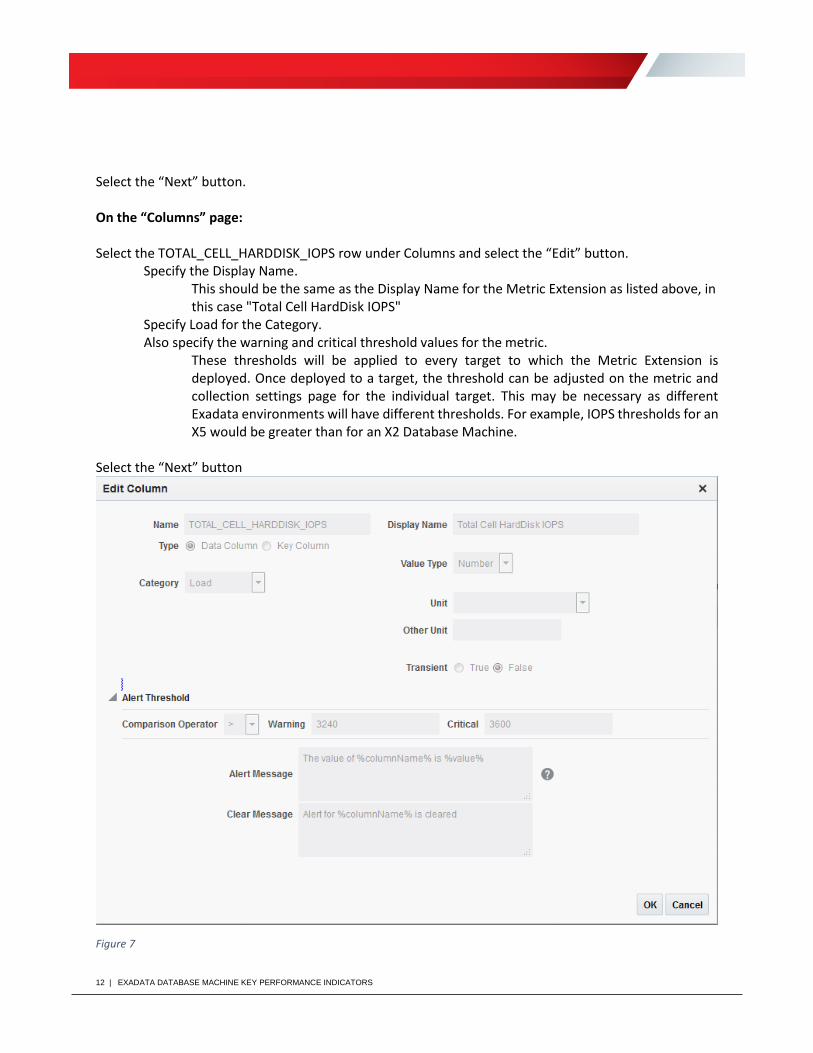
Select the “Next” button. On the “Columns” page: Select the TOTAL_CELL_HARDDISK_IOPS row under Columns and select the “Edit” button.
Specify the Display Name. This should be the same as the Display Name for the Metric Extension as listed above, in this case "Total Cell HardDisk IOPS"
Specify Load for the Category. Also specify the warning and critical threshold values for the metric.
These thresholds will be applied to every target to which the Metric Extension is deployed. Once deployed to a target, the threshold can be adjusted on the metric and collection settings page for the individual target. This may be necessary as different Exadata environments will have different thresholds. For example, IOPS thresholds for an X5 would be greater than for an X2 Database Machine.
Select the “Next” button
Figure 7

13 | EXADATA DATABASE MACHINE KEY PERFORMANCE INDICATORS
On the Test Screen:
Select the “Finish” button.
The remaining Metric Extensions will be created the same way. The only difference will be the Name
ME$, Display Name, and SQL Query. Use the information from Figure 3 and Figure 8 to create the
remaining Metric Extensions.
*****It is critical that all the metric names be entered EXACTLY as listed below. Otherwise the
composite metric will not work properly.
Name ME$ Display Name SQL
Total_Cell_Flash_IOPS
Total Cell Flash IOPS
SELECT c.target_guid, SUM(c.value)
total_cell_flashdisk_iops
FROM sysman.mgmt$metric_current c,
sysman.mgmt$availability_current a
WHERE c.target_type =
'oracle_exadata'
AND c.metric_name =
'Aggregated_HardNFlashDisk_Metric'
AND c.key_value =
'FlashDisk'
AND c.metric_column in
('sum_cd_read_iops','sum_cd_write_iops')
AND c.target_guid =
a.target_guid
AND a.availability_status_code = 1
AND SYSTIMESTAMP AT TIME ZONE 'UTC'-
FROM_TZ(TO_TIMESTAMP(TO_CHAR(c.collection_ti
mestamp,'dd-mon-yyyy hh24:mi:ss'),'dd-mon-
yyyy hh24:mi:ss'),c.timezone_region) AT TIME
ZONE 'UTC' < '0 01:00:00.000'
GROUP BY c.target_guid
Total_Cell_HardDisk_IOPS
Total Cell HardDisk IOPS
SELECT c.target_guid, SUM(c.value)
total_cell_harddisk_iops
FROM sysman.mgmt$metric_current c,
sysman.mgmt$availability_current a
WHERE c.target_type =
'oracle_exadata'
AND c.metric_name =
'Aggregated_HardNFlashDisk_Metric'

14 | EXADATA DATABASE MACHINE KEY PERFORMANCE INDICATORS
AND c.key_value =
'HardDisk'
AND c.metric_column in
('sum_cd_read_iops','sum_cd_write_iops')
AND c.target_guid =
a.target_guid
AND a.availability_status_code = 1
AND SYSTIMESTAMP AT TIME ZONE 'UTC'-
FROM_TZ(TO_TIMESTAMP(TO_CHAR(c.collection_ti
mestamp,'dd-mon-yyyy hh24:mi:ss'),'dd-mon-
yyyy hh24:mi:ss'),c.timezone_region) AT TIME
ZONE 'UTC' < '0 01:00:00.000'
GROUP BY c.target_guid
Total_Cell_Flash_Throughput
Total Cell Flash Throughput
SELECT c.target_guid, SUM(c.value)
total_cell_flashdisk_tput
FROM sysman.mgmt$metric_current c,
sysman.mgmt$availability_current a
WHERE c.target_type =
'oracle_exadata'
AND c.metric_name =
'Aggregated_HardNFlashDisk_Metric'
AND c.key_value =
'FlashDisk'
AND c.metric_column in
('sum_cd_read_throughput','sum_cd_write_thro
ughput')
AND c.target_guid =
a.target_guid
AND a.availability_status_code = 1
AND SYSTIMESTAMP AT TIME ZONE 'UTC'-
FROM_TZ(TO_TIMESTAMP(TO_CHAR(c.collection_ti
mestamp,'dd-mon-yyyy hh24:mi:ss'),'dd-mon-
yyyy hh24:mi:ss'),c.timezone_region) AT TIME
ZONE 'UTC' < '0 01:00:00.000'
GROUP BY c.target_guid
Total_Cell_Hard_Disk_Throughput
Total Cell HardDisk Throughput
SELECT c.target_guid, SUM(c.value)
total_cell_harddisk_tput
FROM sysman.mgmt$metric_current c,
sysman.mgmt$availability_current a
WHERE c.target_type =
'oracle_exadata'
AND c.metric_name =
'Aggregated_HardNFlashDisk_Metric'
AND c.key_value =
'HardDisk'
AND c.metric_column in
('sum_cd_read_throughput','sum_cd_write_thro
ughput')

15 | EXADATA DATABASE MACHINE KEY PERFORMANCE INDICATORS
AND c.target_guid =
a.target_guid
AND a.availability_status_code = 1
AND SYSTIMESTAMP AT TIME ZONE 'UTC'-
FROM_TZ(TO_TIMESTAMP(TO_CHAR(c.collection_ti
mestamp,'dd-mon-yyyy hh24:mi:ss'),'dd-mon-
yyyy hh24:mi:ss'),c.timezone_region) AT TIME
ZONE 'UTC' < '0 01:00:00.000'
GROUP BY c.target_guid
Total_Avg_Flash_Response_Time
Total Avg Flash Response Time
SELECT
mt.target_guid,(wrsp.value*decode(iopsiv.tot
al_iops,0,0,wiops.value/iopsiv.total_iops))
+
(rrsp.value*decode(iopsiv.total_iops,0,0,rio
ps.value/iopsiv.total_iops))
total_cell_flashdisk_rsp_time
FROM sysman.mgmt$target mt,
sysman.mgmt$metric_current wiops,
sysman.mgmt$metric_current
riops,sysman.mgmt$metric_current wrsp,
sysman.mgmt$metric_current rrsp,
sysman.mgmt$availability_current a,
(select smmc.target_guid, sum(value)
total_iops
from sysman.mgmt$metric_current smmc
where smmc.target_type =
'oracle_exadata'
AND smmc.metric_name =
'Aggregated_HardNFlashDisk_Metric'
AND smmc.metric_column in
('sum_cd_read_iops','sum_cd_write_iops')
AND smmc.key_value =
'FlashDisk'
group by smmc.target_guid) iopsiv
WHERE wiops.target_type =
'oracle_exadata'
AND wiops.metric_name =
'Aggregated_HardNFlashDisk_Metric'
AND wiops.key_value =
'FlashDisk'
AND wiops.metric_column =
'sum_cd_write_iops'
AND SYSTIMESTAMP AT TIME ZONE 'UTC'-
FROM_TZ(TO_TIMESTAMP(TO_CHAR(wiops.collectio
n_timestamp,'dd-mon-yyyy hh24:mi:ss'),'dd-
mon-yyyy hh24:mi:ss'),wiops.timezone_region)
AT TIME ZONE 'UTC' < '0 01:00:00.000'

16 | EXADATA DATABASE MACHINE KEY PERFORMANCE INDICATORS
AND riops.target_type =
'oracle_exadata'
AND riops.metric_name =
'Aggregated_HardNFlashDisk_Metric'
AND riops.key_value =
'FlashDisk'
AND riops.metric_column =
'sum_cd_read_iops'
AND SYSTIMESTAMP AT TIME ZONE 'UTC'-
FROM_TZ(TO_TIMESTAMP(TO_CHAR(riops.collectio
n_timestamp,'dd-mon-yyyy hh24:mi:ss'),'dd-
mon-yyyy hh24:mi:ss'),riops.timezone_region)
AT TIME ZONE 'UTC' < '0 01:00:00.000'
AND wrsp.target_type =
'oracle_exadata'
AND wrsp.metric_name =
'Aggregated_HardNFlashDisk_Metric'
AND wrsp.key_value =
'FlashDisk'
AND wrsp.metric_column =
'avg_cd_write_latency'
AND SYSTIMESTAMP AT TIME ZONE 'UTC'-
FROM_TZ(TO_TIMESTAMP(TO_CHAR(wrsp.collection
_timestamp,'dd-mon-yyyy hh24:mi:ss'),'dd-
mon-yyyy hh24:mi:ss'),wrsp.timezone_region)
AT TIME ZONE 'UTC' < '0 01:00:00.000'
AND rrsp.target_type =
'oracle_exadata'
AND rrsp.metric_name =
'Aggregated_HardNFlashDisk_Metric'
AND rrsp.key_value =
'FlashDisk'
AND rrsp.metric_column =
'avg_cd_read_latency'
AND SYSTIMESTAMP AT TIME ZONE 'UTC'-
FROM_TZ(TO_TIMESTAMP(TO_CHAR(rrsp.collection
_timestamp,'dd-mon-yyyy hh24:mi:ss'),'dd-
mon-yyyy hh24:mi:ss'),rrsp.timezone_region)
AT TIME ZONE 'UTC' < '0 01:00:00.000'
AND mt.target_guid =
a.target_guid
AND iopsiv.target_guid =
mt.target_guid
AND a.availability_status_code = 1
AND wiops.target_guid =
mt.target_guid
AND riops.target_guid =
mt.target_guid

17 | EXADATA DATABASE MACHINE KEY PERFORMANCE INDICATORS
AND rrsp.target_guid =
mt.target_guid
AND wrsp.target_guid =
mt.target_guid
ORDER BY mt.target_guid
Total_Avg_HardDisk_Response_Time
Total Avg HardDisk Response Time
SELECT mt.target_guid,
(wrsp.value*decode(iopsiv.total_iops,0,0,wio
ps.value/iopsiv.total_iops)) +
(rrsp.value*decode(iopsiv.total_iops,0,0,rio
ps.value/iopsiv.total_iops))
total_cell_harddisk_rsp_time
FROM sysman.mgmt$target mt,
sysman.mgmt$metric_current wiops,
sysman.mgmt$metric_current
riops,sysman.mgmt$metric_current wrsp,
sysman.mgmt$metric_current rrsp,
sysman.mgmt$availability_current a,
(select smmc.target_guid, sum(value)
total_iops
from sysman.mgmt$metric_current smmc
where smmc.target_type =
'oracle_exadata'
AND smmc.metric_name =
'Aggregated_HardNFlashDisk_Metric'
AND smmc.metric_column in
('sum_cd_read_iops','sum_cd_write_iops')
AND smmc.key_value =
'HardDisk'
group by smmc.target_guid) iopsiv
WHERE wiops.target_type =
'oracle_exadata'
AND wiops.metric_name =
'Aggregated_HardNFlashDisk_Metric'
AND wiops.key_value =
'HardDisk'
AND wiops.metric_column =
'sum_cd_write_iops'
AND SYSTIMESTAMP AT TIME ZONE 'UTC'-
FROM_TZ(TO_TIMESTAMP(TO_CHAR(wiops.collectio
n_timestamp,'dd-mon-yyyy hh24:mi:ss'),'dd-
mon-yyyy hh24:mi:ss'),wiops.timezone_region)
AT TIME ZONE 'UTC' < '0 01:00:00.000'
AND riops.target_type =
'oracle_exadata'
AND riops.metric_name =
'Aggregated_HardNFlashDisk_Metric'
AND riops.key_value =
'HardDisk'

18 | EXADATA DATABASE MACHINE KEY PERFORMANCE INDICATORS
AND riops.metric_column =
'sum_cd_read_iops'
AND SYSTIMESTAMP AT TIME ZONE 'UTC'-
FROM_TZ(TO_TIMESTAMP(TO_CHAR(riops.collectio
n_timestamp,'dd-mon-yyyy hh24:mi:ss'),'dd-
mon-yyyy hh24:mi:ss'),riops.timezone_region)
AT TIME ZONE 'UTC' < '0 01:00:00.000'
AND wrsp.target_type =
'oracle_exadata'
AND wrsp.metric_name =
'Aggregated_HardNFlashDisk_Metric'
AND wrsp.key_value =
'HardDisk'
AND wrsp.metric_column =
'avg_cd_write_latency'
AND SYSTIMESTAMP AT TIME ZONE 'UTC'-
FROM_TZ(TO_TIMESTAMP(TO_CHAR(wrsp.collection
_timestamp,'dd-mon-yyyy hh24:mi:ss'),'dd-
mon-yyyy hh24:mi:ss'),wrsp.timezone_region)
AT TIME ZONE 'UTC' < '0 01:00:00.000'
AND rrsp.target_type =
'oracle_exadata'
AND rrsp.metric_name =
'Aggregated_HardNFlashDisk_Metric'
AND rrsp.key_value =
'HardDisk'
AND rrsp.metric_column =
'avg_cd_read_latency'
AND SYSTIMESTAMP AT TIME ZONE 'UTC'-
FROM_TZ(TO_TIMESTAMP(TO_CHAR(rrsp.collection
_timestamp,'dd-mon-yyyy hh24:mi:ss'),'dd-
mon-yyyy hh24:mi:ss'),rrsp.timezone_region)
AT TIME ZONE 'UTC' < '0 01:00:00.000'
AND mt.target_guid =
a.target_guid
AND iopsiv.target_guid =
mt.target_guid
AND a.availability_status_code = 1
AND wiops.target_guid =
mt.target_guid
AND riops.target_guid =
mt.target_guid
AND rrsp.target_guid =
mt.target_guid
AND wrsp.target_guid =
mt.target_guid
ORDER BY mt.target_guid

19 | EXADATA DATABASE MACHINE KEY PERFORMANCE INDICATORS
Total_Cell_Flash_Load
Total Cell Flash Load
SELECT c.target_guid, c.value
total_cell_flashdisk_io_load
FROM sysman.mgmt$metric_current c,
sysman.mgmt$availability_current a
WHERE c.target_type =
'oracle_exadata'
AND c.metric_name =
'Aggregated_HardNFlashDisk_Metric'
AND c.key_value =
'FlashDisk'
AND c.metric_column =
'avg_cd_io_load'
AND c.target_guid =
a.target_guid
AND a.availability_status_code = 1
AND SYSTIMESTAMP AT TIME ZONE 'UTC'-
FROM_TZ(TO_TIMESTAMP(TO_CHAR(c.collection_ti
mestamp,'dd-mon-yyyy hh24:mi:ss'),'dd-mon-
yyyy hh24:mi:ss'),c.timezone_region) AT TIME
ZONE 'UTC' < '0 01:00:00.000'
Total_Cell_HardDisk_Load
Total Cell HardDisk Load
SELECT c.target_guid, c.value
total_cell_harddisk_io_load
FROM sysman.mgmt$metric_current c,
sysman.mgmt$availability_current a
WHERE c.target_type =
'oracle_exadata'
AND c.metric_name =
'Aggregated_HardNFlashDisk_Metric'
AND c.key_value =
'HardDisk'
AND c.metric_column =
'avg_cd_io_load'
AND c.target_guid =
a.target_guid
AND a.availability_status_code = 1
AND SYSTIMESTAMP AT TIME ZONE 'UTC'-
FROM_TZ(TO_TIMESTAMP(TO_CHAR(c.collection_ti
mestamp,'dd-mon-yyyy hh24:mi:ss'),'dd-mon-
yyyy hh24:mi:ss'),c.timezone_region) AT TIME
ZONE 'UTC' < '0 01:00:00.000'
Exadata_Storage_Server_FlashDisk_IO_Health
Exadata Storage Server FlashDisk IO Health
select
mt.target_guid,NVL(mmciv.exceptions,0)except
ions
from mgmt$target MT left outer join (select
mmc.target_guid, count(*) exceptions

20 | EXADATA DATABASE MACHINE KEY PERFORMANCE INDICATORS
from SYSMAN.mgmt$metric_current mmc,
mgmt$target_metric_settings tms
where 1=1
and mmc.target_guid=tms.target_guid
and mmc.metric_guid=tms.metric_guid
and mmc.key_value=tms.key_value
and tms.metric_name in
('ME$Total_Cell_Flash_Load','ME$Total_Cell_F
lash_IOPS','ME$Total_Cell_Flash_Throughput',
'ME$Total_Avg_Flash_Response_Time')
and to_number(mmc.value) >
to_number(tms.critical_threshold)
group by mmc.target_guid) MMCIV on
(mt.target_guid=mmciv.target_guid)
order by mt.target_name desc
Exadata_Storage_Server_HardDisk_IO_Health
Exadata Storage Server HardDisk IO Health
select
mt.target_guid,NVL(mmciv.exceptions,0)except
ions
from mgmt$target MT left outer join (select
mmc.target_guid, count(*) exceptions
from SYSMAN.mgmt$metric_current mmc,
mgmt$target_metric_settings tms
where 1=1
and mmc.target_guid=tms.target_guid
and mmc.metric_guid=tms.metric_guid
and mmc.key_value=tms.key_value
and tms.metric_name in
('ME$Total_Cell_HardDisk_Load','ME$Total_Cel
l_HardDisk_IOPS','ME$Total_Cell_Hard_Disk_Th
roughput','ME$Total_Avg_HardDisk_Response_Ti
me')
and to_number(mmc.value) >
to_number(tms.critical_threshold)
group by mmc.target_guid) MMCIV on
(mt.target_guid=mmciv.target_guid)
order by mt.target_name desc
Figure 8

21 | EXADATA DATABASE MACHINE KEY PERFORMANCE INDICATORS
Save each Metric Extension as a deployable draft, which can now be deployed to targets as shown in
Figure 9. It is required that all Metric Extensions be deployed to all Storage Server targets in monitored
Database Machine targets. Detailed instruction of the Metric Extension Lifecycle can be found in the
Enterprise Manager Cloud Control Administrator's Guide.
Figure 9
By default, after deployment, the collection threshold for the Metric Extensions will be fifteen minutes.
If more granular data is required, the threshold can be adjusted to a lower value in the target’s metric
collection setting page. Be aware that lowering the threshold below the default values can place

22 | EXADATA DATABASE MACHINE KEY PERFORMANCE INDICATORS
additional load on the agent deployed on the Exadata environment as well as the Enterprise Manager
Repository. Always test these changes in a non-production environment.
Creating Storage Server Grid Service
Many times, looking at one Enterprise Manager Target isn’t enough to gauge the health of an
Environment. An Enterprise Manager Service allows for multiple targets to be viewed holistically to
determine the environment’s health. Monitoring Exadata Storage Server capacity necessitates that all
the Storage Servers are evaluated as a complete Cell Grid in addition to monitoring individual Storage
Servers. Services provide this capability.
In addition to monitoring multiple targets, to complete the holistic approach to monitoring the Storage
Server Grid, many times one metric exceeding its threshold is not significant enough to conclude that
one or more Storage Servers are having issues or are at capacity. By looking at multiple metrics and how
they interact with each other, a more accurate picture starts to develop that allows for an accurate
diagnosis and reduces the number of false alerts raised.
The Service will be created to monitor the overall status of the Exadata Storage Server Grid.
Navigate to the Services page and start the Create Service workflow:
Targets Services
Create Generic Service - System Based
Figure 10
23 | EXADATA DATABASE MACHINE KEY PERFORMANCE INDICATORS
On the “Create Generic Service: General” page enter the following:
Name: Enter a name, such as “Exadata Storage Grid <DBRACK>”
Time Zone
Select the “Next” button.
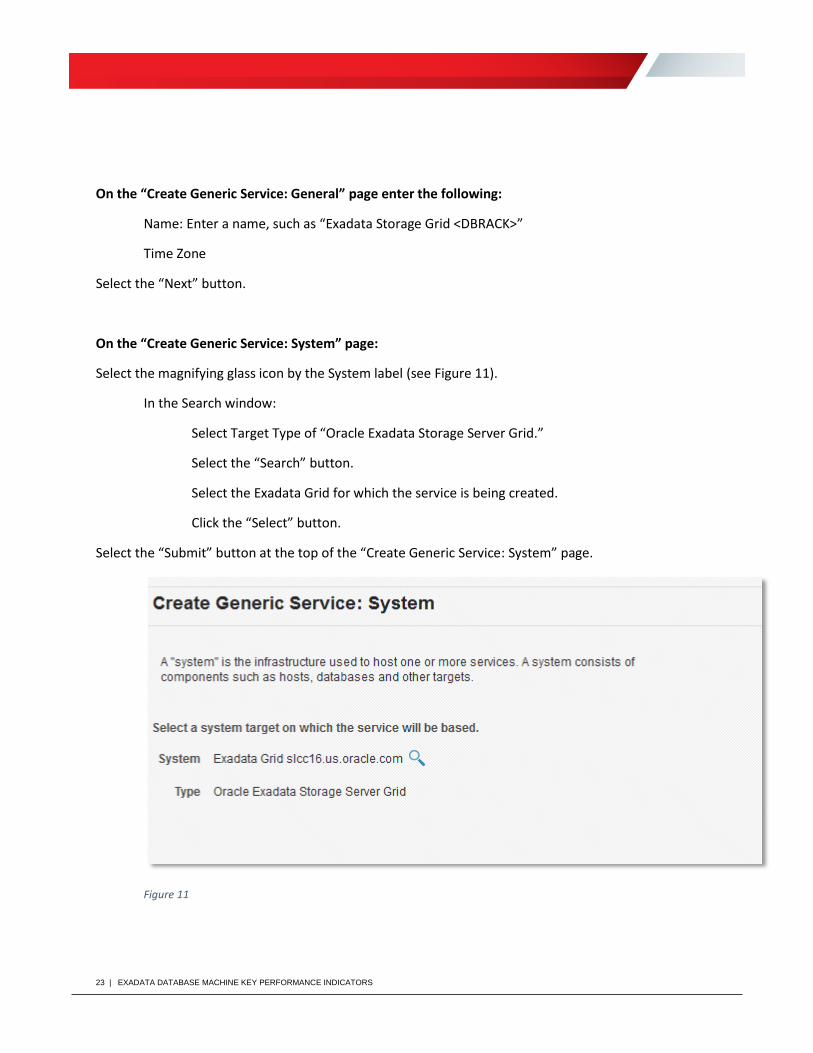
On the “Create Generic Service: System” page:
Select the magnifying glass icon by the System label (see Figure 11).
In the Search window:
Select Target Type of “Oracle Exadata Storage Server Grid.”
Select the “Search” button.
Select the Exadata Grid for which the service is being created.
Click the “Select” button.
Select the “Submit” button at the top of the “Create Generic Service: System” page.
Figure 11
24 | EXADATA DATABASE MACHINE KEY PERFORMANCE INDICATORS
Creating Storage Server Grid Service Performance Metrics The following steps create Performance Metrics for the Storage Server Grid Service.
On the “Services” page:
Click on the Service that was just created.
On the “Grid Service” page:
Select Generic ServiceAdministrationPerformance Metrics
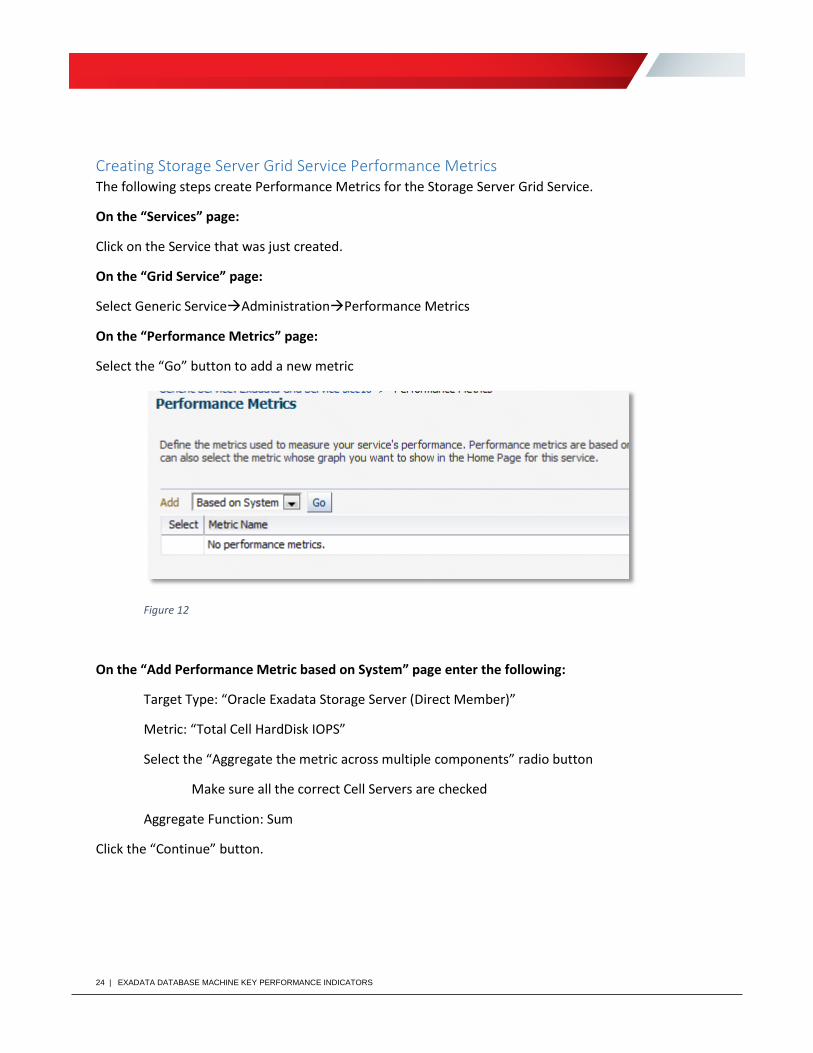
On the “Performance Metrics” page:
Select the “Go” button to add a new metric
Figure 12
On the “Add Performance Metric based on System” page enter the following:
Target Type: “Oracle Exadata Storage Server (Direct Member)”
Metric: “Total Cell HardDisk IOPS”
Select the “Aggregate the metric across multiple components” radio button
Make sure all the correct Cell Servers are checked
Aggregate Function: Sum
Click the “Continue” button.

25 | EXADATA DATABASE MACHINE KEY PERFORMANCE INDICATORS
Create the remaining Service Performance Metrics using the same approach as above. The data needed
for the workflow is provided in the below table.
Metric Aggregate Function
Warning Threshold Critical
Total Cell Flash IOPS Sum None None
Total Cell HardDisk IOPS Sum None None
Total Cell Flash Throughput Sum None None
Total Cell HardDisk Throughput
Sum None None
Total Avg Flash Response Time Average None None
Total Avg HardDisk Response Time
Average None None
Total Cell Flash Load Average None None
Total Cell HardDisk Load Average None None
Exadata Storage Server FlashDisk IO Health
Average 1 2
Exadata Storage Server HardDisk IO Health
Average 1 2
Figure 13
Now that the Service is created, incidents will be created whenever warning or critical thresholds are
crossed. These incidents can be viewed in Incident Manager or the Service’s “Performance/Incidents”
page. If external communication (email, SNMP, ticketing, etc.) is required, ensure that the appropriate
notifications are setup. Information on setting up notifications can be found at:
http://docs.oracle.com/cd/E63000_01/EMADM/notification.htm#EMADM9066.
In addition to displaying incidents, the Service’s “Performance/Incident” page provides usage
information on metrics defined for the Service (see Figure 14) and serves as a quick one-stop view for
evaluating the Service’s performance.

26 | EXADATA DATABASE MACHINE KEY PERFORMANCE INDICATORS
Figure 14

27 | EXADATA DATABASE MACHINE KEY PERFORMANCE INDICATORS
Compute Node KPIs
Compute Nodes are monitored in much the same way as any Oracle Linux server. Below are the
Compute Node KPIs that are recommended by the MAA team:
CPU Utilization
Memory Utilization
Load Average
Swap Utilization
These KPIs will provide a base set of monitoring that will indicate when server utilization is at or near
capacity. Existing metrics provide sufficient data so no Metric Extensions need to be created for
Compute Node KPIs. Steps in this section specify how to configure thresholds for these KPIs.
CPU Utilization
The Intel CPUs used in all Exadata models run with two threads per CPU core. This helps to boost overall
performance, but the second thread is not as powerful as the first. The operating system assumes that
all threads are equal and thus overstates the CPU capacity available to the operating system. It is
important to account for this when setting CPU utilization thresholds. Here is an approximate rule of
thumb that can be used to estimate actual CPU utilization, but note that this can vary with different
workloads:
• For CPU utilization less than 50%, multiply by 1.7.
• For CPU utilization over 50%, assume 85% plus (util-50%)* 0.3.
Figure 15 summarizes the effect.
Actual utilization gives an approximate measure of how much CPU is really used so that available
capacity can be determined.
Plan to keep actual utilization below 85% for response time sensitive workloads. If utilization is over
85%, use IORM or instance caging to prioritize workloads appropriately and prevent CPU starvation of
essential processes. For more information on IORM refer to
https://docs.oracle.com/cd/E50790_01/doc/doc.121/e50471/iorm.htm#SAGUG20421

28 | EXADATA DATABASE MACHINE KEY PERFORMANCE INDICATORS
Measured Utilization Actual Utilization
10% 17%
20% 34%
30% 51%
40% 68%
50% 85%
60% 88%
70% 91%
80% 94%
90% 97%
100% 100%
Figure 15
Note that it is common and appropriate to have CPU or I/O utilization reach 100% for large parallel
workloads that seek maximum batch or reporting performance. Data Warehouses are an important
example of this. In mixed-use systems, batch and reporting performance needs to be traded off against
interactive response times. If interactive response time is important, then the degree of parallelism
used for batch and reporting will need to be restricted so that batch and reporting don’t consume
excessive resources on the system. In a mixed workload environment, the best practice should be to
enable IROM with Objective=balance. This favors small I/Os over large ones, but not to the degree that
Data Warehouse workloads never complete.

29 | EXADATA DATABASE MACHINE KEY PERFORMANCE INDICATORS
CPU utilization is available in Enterprise Manager for Compute Node targets. From the DB Machine
target home page select the desired target. This will bring up the target home page that gives high level
CPU information
Figure 16
To set the metric threshold for CPU Utilization select HostMonitoringAll Metrics
Figure 17

30 | EXADATA DATABASE MACHINE KEY PERFORMANCE INDICATORS
Next select LoadCPU Utilization (%)
Figure 18
Use the Modify Thresholds button to select the warning and critical thresholds. Select how many of the
occurrences of the threshold being violated need to occur before an incident is created.
Figure 19

31 | EXADATA DATABASE MACHINE KEY PERFORMANCE INDICATORS
Memory
Linux will free memory from cache when necessary, so cache can be regarded as part of free memory.
The Exadata databases do not use the Linux page cache for database I/Os, so a relatively small Linux
page cache is needed.
Memory utilization is accessed in Enterprise Manager on the same screen as CPU utilization shown in
Figure 16. On Compute Nodes, additional memory utilization information can be accessed from the
Compute Node home page via Host Monitoring Memory Details:
Figure 20

32 | EXADATA DATABASE MACHINE KEY PERFORMANCE INDICATORS
To set the metric threshold for Memory Utilization select HostMonitoringAll Metrics
Figure 21
Next select LoadMemory Utilization (%)
Figure 22

33 | EXADATA DATABASE MACHINE KEY PERFORMANCE INDICATORS
Now use the Modify Thresholds button to select the warning and critical thresholds. Select how many of
the occurrences of the threshold being violated need to occur before an incident is created.
Figure 23

34 | EXADATA DATABASE MACHINE KEY PERFORMANCE INDICATORS
Swap Utilization
Swap is the process in which inactive pages of memory are moved to disk in the event the amount of
physical memory is full. In Exadata environments, zero swapping is needed to achieve good, stable
system performance.
To set the metric threshold for Swap Utilization select HostMonitoringAll Metrics
Figure 24

35 | EXADATA DATABASE MACHINE KEY PERFORMANCE INDICATORS
Next select LoadSwap Utilization (%)
Figure 25
Now use the Modify Thresholds button to select the warning and critical thresholds. Select how many of
the occurrences of the threshold being violated need to occur before an incident is created.
Figure 26

36 | EXADATA DATABASE MACHINE KEY PERFORMANCE INDICATORS
Load Average
Load Average is a measure of processes that are waiting (either in a running, runnable or uninterruptible
state) for CPU time. The point at which Load Average becomes concerning is dependent on the available
CPUs on the systems. For example, a Load Average of 80 on a 64 core server would result in a process
count of 1.25 per core which would be acceptable. However, a Load Average of 80 on a 12 core server
would result in a process count of 6.67 per core which would be indicative of a problem. Load Average
isn’t necessarily caused by a lack of CPU resources but could also be an indicator of other issues such as
a saturated or stalled I/O subsystem.
Enterprise Manager makes understanding Load Average easier by taking the overall Load Average and
dividing by the number of CPUs. This gives the average number of runnable processes per CPU.
To set the metric threshold for Load Average select HostMonitoringAll Metrics
Figure 27

37 | EXADATA DATABASE MACHINE KEY PERFORMANCE INDICATORS
Next select LoadRun Queue Length (15 Minute average,per cpu)
Figure 28
Use the Modify Thresholds button to select the warning and critical thresholds. Select how many of the
occurrences of the threshold being violated need to occur before an incident is created.
Figure 29

38 | EXADATA DATABASE MACHINE KEY PERFORMANCE INDICATORS
Infiniband Switch KPIs
Enterprise Manager provides detailed information about throughput metrics on the InfiniBand switches
in an Exadata rack. However, there are several additional pieces of information that need to be
monitored to get the best possible insight into potential problems that could occur on the switch.
Getting this information requires the creation of a Metric Extension.
The following are the KPIs created in the steps below:
CPU Usage: Monitors the average CPU utilization of the ATOM processor. Ideally, CPU usage
should be below 80%.
Memory Percent Used: Measures memory used on the switch. Switches contain 512MB of RAM.
Root filesystem usage: Provides the percent of free filesystem space on the switch. Filesystem
storage on the switch is a 512MB solid state drive.
SSH Session Count: Number of SSH sessions logged into the switch. These sessions are usually
administrative connections for monitoring, configuration, etc. Too many sessions can create
issues due to either PID limits or CPU/memory constraints.
Creating Infiniband Switch KPI Metric Extension
The following steps will describe the necessary process to create the Infiniband Switch KPI Metric
Extension. It is also possible to download the Metric Extension from MOS Note 2094648.1. Once
downloaded, it will be necessary to import and publish the Metric Extension as described in the
Enterprise Manager Cloud Control Administrator’s Guide.

39 | EXADATA DATABASE MACHINE KEY PERFORMANCE INDICATORS
Navigate to the Metric Extension Home Page:
Enterprise Monitoring Metric Extensions
Figure 30
Next select ActionCreateMetric Extension
Figure 31

40 | EXADATA DATABASE MACHINE KEY PERFORMANCE INDICATORS
Complete the General Properties Page as shown below:
Target Type: “Systems Infrastructure Switch”
Access Point Type: “Systems Infrastructure Oracle InfiniBand Switch - ILOM”
Name ME$: “MAA_Exadata_InfiniBand_Switch_KPIs”
Display Name: “MAA Exadata InfiniBand Switch KPIs”
Adapter: “OS Command - Multiple Columns”
Description: “MAA Defined KPI Metrics for InfiniBand Switches”
Repeat Every: “10” Minutes
Figure 32

41 | EXADATA DATABASE MACHINE KEY PERFORMANCE INDICATORS
Select the Next button. Populate the fields in the Basic Properties box as shown below:
Command: “/bin/bash”
Script: “%scriptsDir%/MAA_InfiniBand_Switch_KPIs”
Arguments: ”%NAME% > /tmp/ib_metrics.out”
Delimeter: “|”
Figure 33

42 | EXADATA DATABASE MACHINE KEY PERFORMANCE INDICATORS
Now click on the “Add” button to insert the actual script used to collect the information. In the Add File
window enter “MAA_IB_KPIS” as the Filename and enter the following into the File Contents box.
SWITCHNAME=`echo $1 | awk -F"_ILOM" '{print $1}'`
CPUUSED=$(ssh -o StrictHostKeyChecking=no nm2user@$SWITCHNAME top -b -n 11 -d 1 | grep Cpu | tail -10 | awk -F% '{print $1 " " $2}' | awk
'{print $2 + $4}' | awk '{ total += $1; count++ } END { print total/count }')
TOTALMEM=$(ssh -o StrictHostKeyChecking=no nm2user@$SWITCHNAME 'export TOTALMEM=$(free -m| sed -n '2,2p');echo $TOTALMEM' |
awk '{print $2}')
FREEMEM=$(ssh -o StrictHostKeyChecking=no nm2user@$SWITCHNAME 'export TOTALMEM=$(free -m| sed -n '3,3p');echo $TOTALMEM' |
awk '{print $4}')
MEMPERCENTFREE=$(expr 200 \* $FREEMEM / $TOTALMEM % 2 + 100 \* $FREEMEM / $TOTALMEM)
ROOTFSPERCENTFREE=$(ssh -o StrictHostKeyChecking=no nm2user@$SWITCHNAME 'export ROOTFS=$(df -k / | sed -n '2,2p');echo $ROOTFS' |
awk '{print $5}'| awk -F% '{print $1}')
SESSIONS=$(ssh -o StrictHostKeyChecking=no nm2user@$SWITCHNAME ps ax | grep sshd: | grep -v priv | grep -v grep | wc -l)
echo $CPUUSED"|"$MEMPERCENTFREE"|"$ROOTFSPERCENTFREE"|"$SESSIONS
Select the “OK” button to close the Window and then select the “Next” button.
Now that the script has been added, columns need to be created, which map to the output returned by
the script. All columns should be created as type “Data Column” using the following information, in the
order listed here:
Name Display Name
Value Type
Unit Category Comparison Operator
Warning Critical
CPU_Utilization CPU Utilization
Number % > 80 90
Memory_Percent_Free Memory Percent Free
Number % < 15 5
Root_File_System_Percent_Free Root File System Percent Free
Number % < 15 5
SSH_Session_Count SSH Session Count
Number Other > 10 12
Figure 34

43 | EXADATA DATABASE MACHINE KEY PERFORMANCE INDICATORS
To create the column select AddNew metric column
Figure 35
Select the Next button when all the columns are created. Note that the order the columns are created is
required to follow the sequence listed in Figure 34.
Select the Next button once more. At the test screen it is possible but not required to test the Metric
Extension against one or more targets. If this is desired, add the targets and select the “Run Test”
button. Otherwise, select the “Finish” button.
Once complete, the Metric Extension must be published and deployed as described in the Enterprise
Manager Cloud Control Administrator’s Guide.
Conclusion
With the use of these metrics and metric extensions, administrators have an overall picture in Enterprise
Manager that enables evaluation of the state of the Exadata Database Machine. By setting up
appropriate alerts and thresholds, administrators will also be proactively notified of potential issues
before they impact business service level agreements.

44 | EXADATA DATABASE MACHINE KEY PERFORMANCE INDICATORS
Exadata Health and Resource Utilization
September 2016 Author: Mike Chafin Contributors: Curtis Dinkel, Werner De Gruyter, Jim Viscusi Oracle Corporation World Headquarters 500 Oracle Parkway Redwood Shores, CA 94065 U.S.A. Worldwide Inquiries:
Copyright © 2016, Oracle and/or its affiliates. All rights reserved. This document is provided for information purposes only and the contents hereof are subject to change without notice. This document is not warranted to be error-free, nor subject to any other warranties or conditions, whether expressed orally or implied in law, including implied warranties and conditions of merchantability or fitness for a particular purpose. We specifically disclaim any liability with respect to this document and no contractual obligations are formed either directly or indirectly by this document. This document may not be reproduced or transmitted in any form or by any means, electronic or mechanical, for any purpose, without our prior written permission. Oracle is a registered trademark of Oracle Corporation and/or its affiliates. Other names may be trademarks of their respective owners. 0109