Ex-post impact assessment of EU Cohesion Policy 2007-2013
57
Ex-post impact assessment of EU Cohesion Policy 2007-2013 Francesco Di Comite Regional Economic Modelling team European Commission, Joint Research Centre, IPTS WORKSHOP ON PUBLIC FINANCES, Bank of Latvia, Riga, 21/06/2016
-
Upload
latvijas-banka -
Category
Economy & Finance
-
view
573 -
download
1
Transcript of Ex-post impact assessment of EU Cohesion Policy 2007-2013
Ex-post impact assessment of EU Cohesion Policy 2007-2013
Francesco Di Comite
Regional Economic Modelling team
European Commission,
Joint Research Centre, IPTS
WORKSHOP ON PUBLIC FINANCES,
Bank of Latvia, Riga, 21/06/2016

What is the Joint Research Centre?
2
• The DG JRC is the Commission's in-house science service;
• Mission: provide EU policies with independent, evidence-based scientific
and technical support throughout the whole policy cycle.
• The IPTS research institute is located in
Seville and focuses on "policy challenges that
have both a socio-economic as well as a
scientific/ technological dimension";
• Our unit (KfG) deals with ex-ante regional
impact assessment; innovation policies; smart
specialisation strategies.

3
Recent examples of KfG support to policy making
Example of a 1% positive shock on "TotalFactor Productivity", "Labour Productivity"and "Transport Costs" in all EU NUTS2 regionsin the spatial CGE RHOMOLO.
Eye@RIS3 JRC platforms to allow policy makers totrack and learn from the investment strategies ofother regions.
Quick facts about the RHOMOLO model
• RHOMOLO is the model developed by the JRC for ex-ante impact assessments of EU Regional Policy;
• It shows how "policy shocks" are expected to affect economic and social outcomes at the regional level, as deviations from baseline;
• It allows policy makers to have an idea of the trade-offs and general equilibrium implications of their policy choices.
4

Presentation Outline
• Why a regional CGE model for impact assessment?
• Short description of the RHOMOLO model;
• Simulating European Cohesion Policy;
• Simulation results for the overall EU;
• Latvia-specific simulations;
• Conclusions.
5
Presentation Outline
• Why a regional CGE model for impact assessment?
• Short description of the RHOMOLO model;
• Simulating European Cohesion Policy;
• Simulation results for the overall EU;
• Latvia-specific simulations;
• Conclusions.
6
7
Growing need for efficient/effective use of public resources:
Declining government tax revenue due to economic/financial crisis;
Decreasing returns on some public investment items (e.g., infrastructures).
Impact assessment of Regional Policy particularly important:
With 50 billion/year Cohesion Policy is the largest expenditure category in
the 2014-2020 EU budget, and covers a wide variety of different
programmes (R&D, human capital, infrastructure, etc.);
It is directed at regions, which are the ultimate decision makers on its use;
Maybe surprisingly, regional disparities (even within countries) can be
larger than national disparities.
Why do we need regional policy impact assessment?
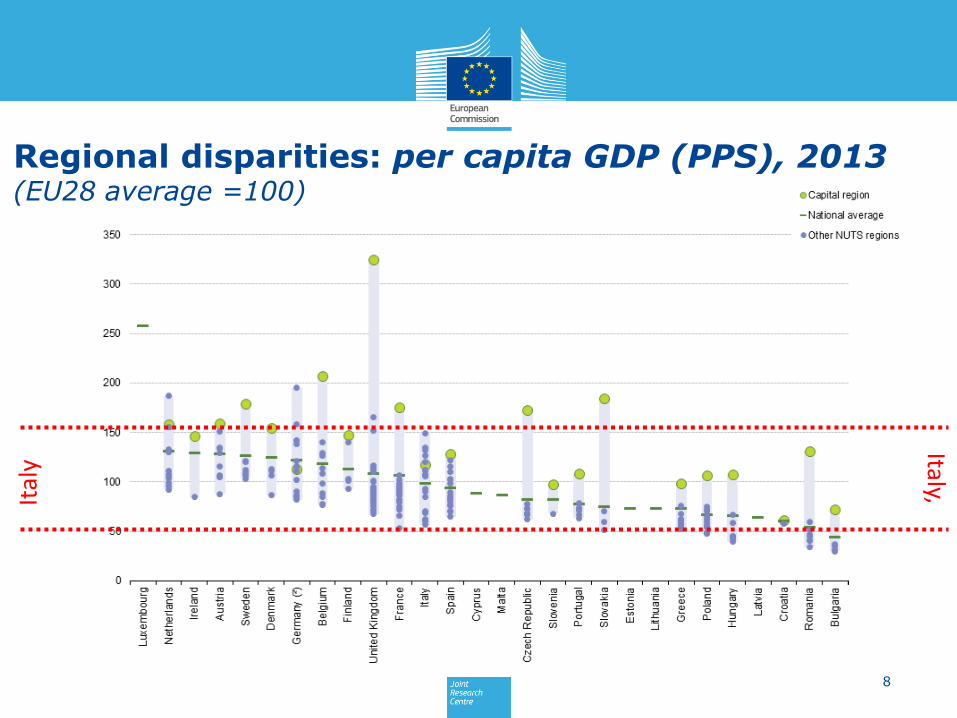
Regional disparities: per capita GDP (PPS), 2013 (EU28 average =100)
8
Ital
yItaly,

9
Illustration: international (EU) variation vis-à-vis regional (IT) variation (EU28=100, year 2011)
National GDP per capita (PPS): 0.44 (BG) to 1.35 (NL) of EU28
Regional (IT) GDP per capita (PPS): 0.64 to 1.51 of EU28
Standard deviation in EU28 regional GDP per capita: 54.8 (IT:26.4)
Standard deviation in EU28 national GDP per capita: 42.6

Sector composition: increasing demand for goods in specific sectors
benefit disproportionately regions specialising in their production;
Spatial configuration: central regions face lower transport costs to
source their inputs and serve their costumers (and may benefit from
stronger spatial spill-overs because of their location);
Knowledge/skill pools: activities such as research and development
may cluster in advanced regions to leverage local skills and assets,
thus accentuating spatial income differentials.
Economic integration itself may foster regional disparities
10

Policies simulations with RHOMOLO
• RHOMOLO is suited to simulate the impact of the following policy areas:
• Infrastructure (focus of this presentation);
• R&D and innovation;
• Human capital;
• Subsidies to companies;
• Structural reforms.
11
Presentation Outline
• Why a regional CGE model for impact assessment?
• Short description of the RHOMOLO model;
• Simulating European Cohesion Policy;
• Simulation results for the overall EU;
• Latvia-specific simulations;
• Conclusions.
12
13
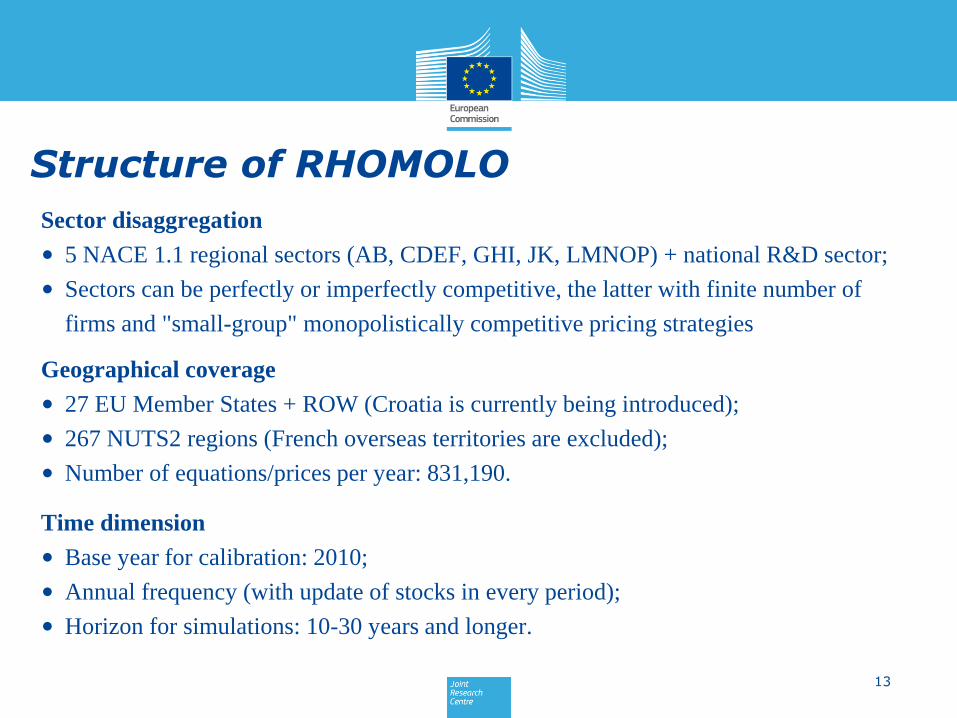
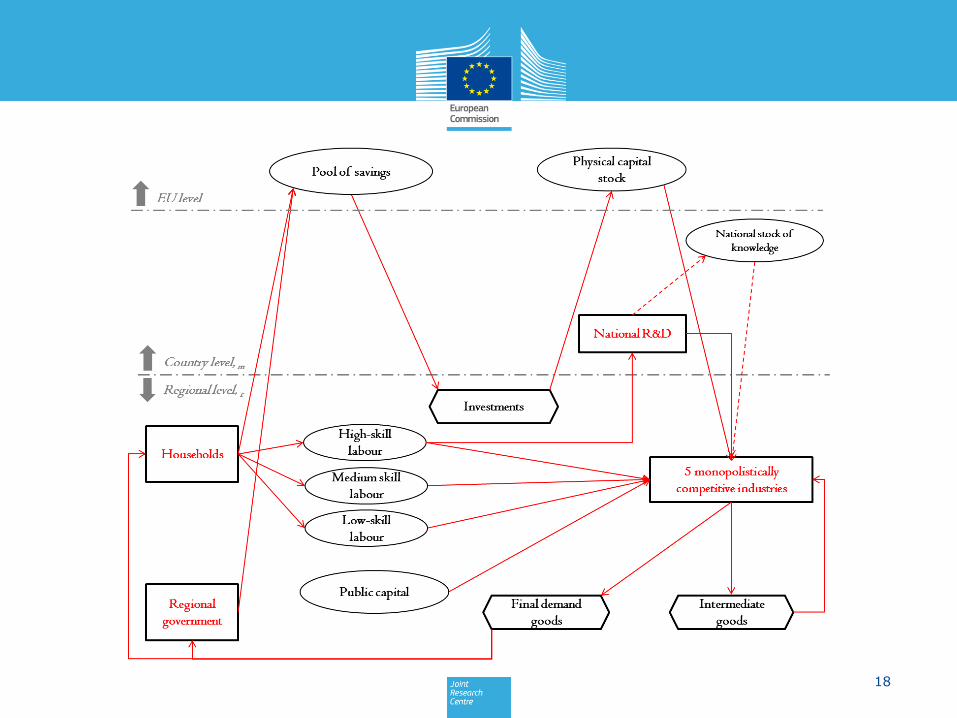
Sector disaggregation
• 5 NACE 1.1 regional sectors (AB, CDEF, GHI, JK, LMNOP) + national R&D sector;
• Sectors can be perfectly or imperfectly competitive, the latter with finite number of
firms and "small-group" monopolistically competitive pricing strategies
Geographical coverage
• 27 EU Member States + ROW (Croatia is currently being introduced);
• 267 NUTS2 regions (French overseas territories are excluded);
• Number of equations/prices per year: 831,190.
Time dimension
• Base year for calibration: 2010;
• Annual frequency (with update of stocks in every period);
• Horizon for simulations: 10-30 years and longer.
Structure of RHOMOLO

Including R&D
14
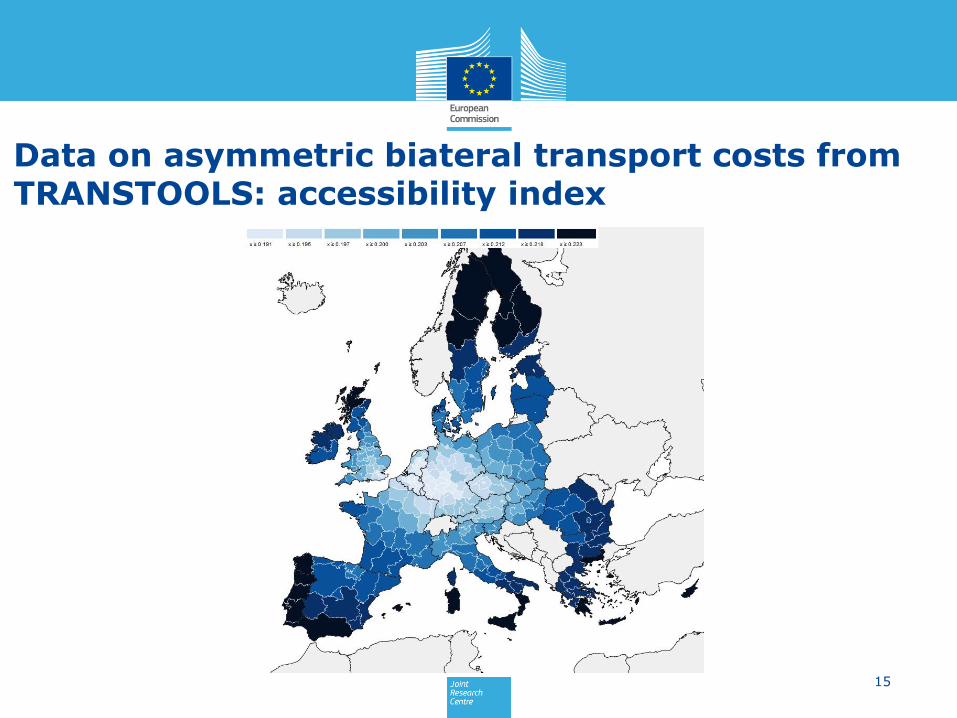
Data on asymmetric biateral transport costs from TRANSTOOLS: accessibility index
15
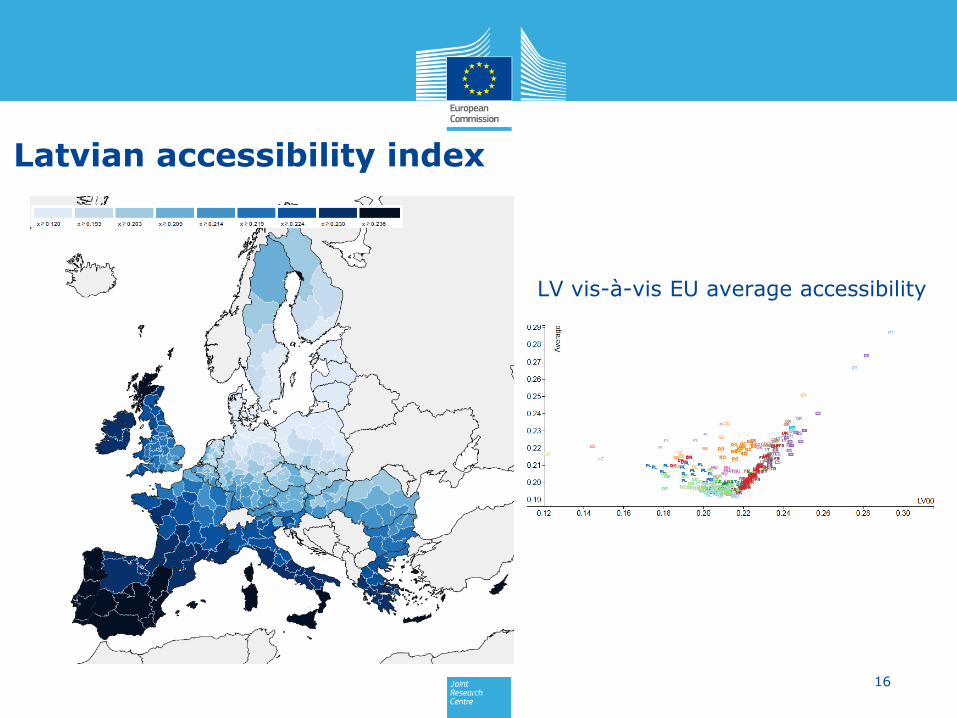
Latvian accessibility index
16
LV vis-à-vis EU average accessibility
17
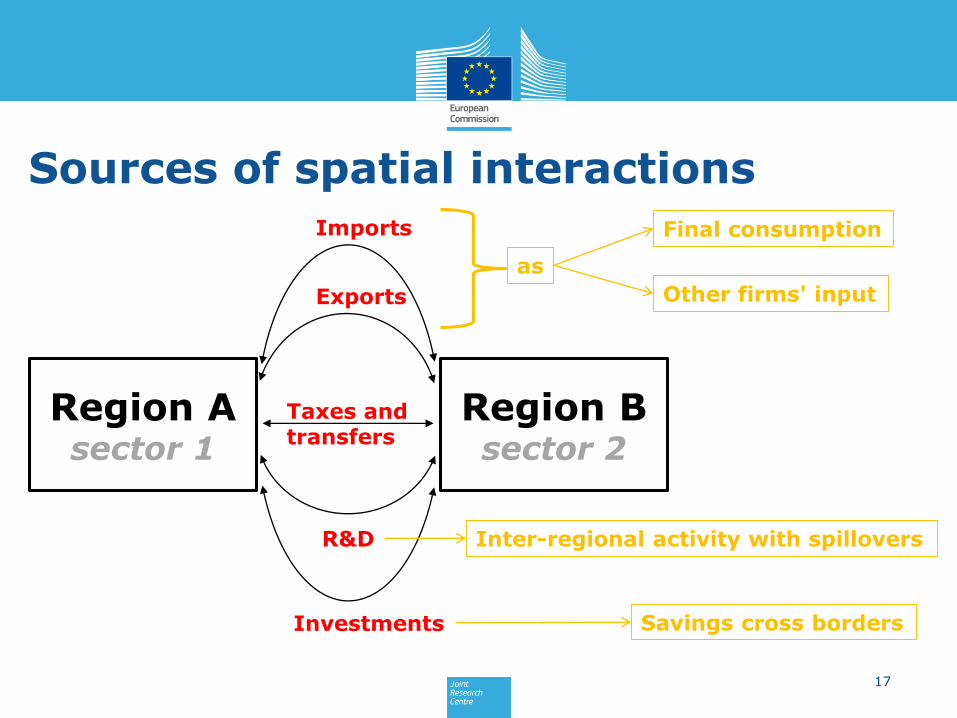
Sources of spatial interactions
Region Asector 1
Region B sector 2
Imports
Exports
Taxes and transfers
R&D
Investments
as
Final consumption
Other firms' input
Savings cross borders
Inter-regional activity with spillovers
18
Presentation Outline
• Why a regional CGE model for impact assessment?
• Short description of the RHOMOLO model;
• Simulating European Cohesion Policy;
• Simulation results for the overall EU;
• Latvia-specific simulations;
• Conclusions.
19

• The Cohesion Fund (CF), for Member States with gross national income per
head below 90% of EU the average. Mainly for infrastructures/environment;
• The European Social Fund (ESF), to provide assistance to Member States for
labour market restructuring, (lifelong learning, social integration and inclusion);
• The European Regional Development Fund (ERDF), co-financing
investments benefiting the regions directly: investment in infrastructures (R&D,
ICT, energy and transport); innovation; cooperation, information and support.
Notice that Cohesion Policy funds
+ EAFRD: European Agricultural Fund for Rural Development;
+ EMFF: European Maritime and Fisheries Fund;
= ESIF: European Structural and Investment funds.
EU Cohesion Policy: a tale of three Funds
20
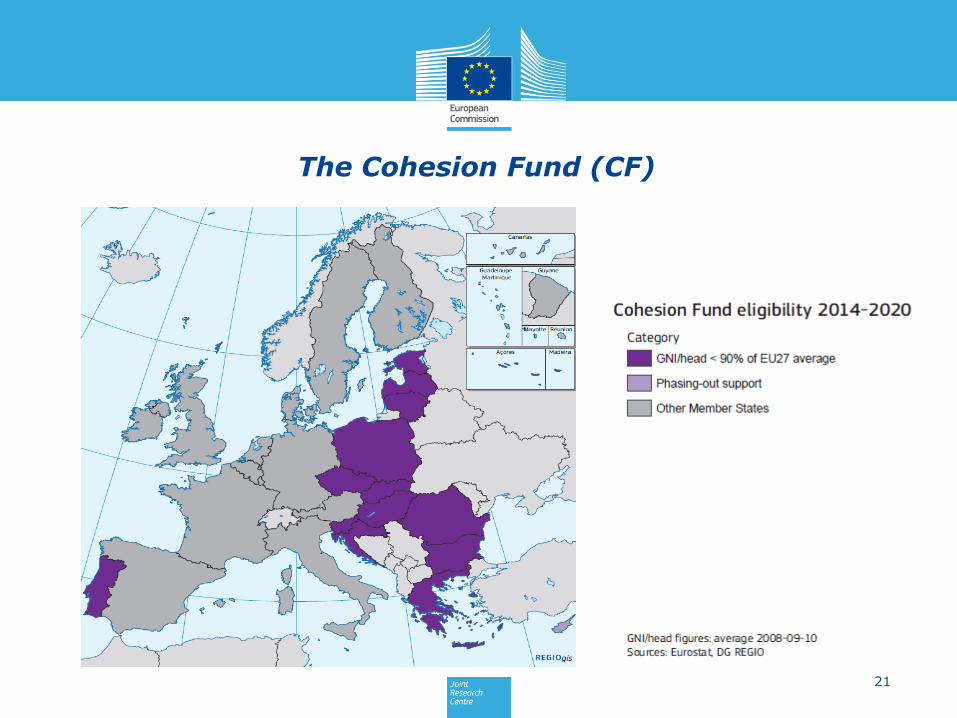
The Cohesion Fund (CF)
21

Regional eligibility for structural funds (ERDF, ESF), by NUTS level 2 region(% of EU-28 average)
22
2006-2013 2014-2020
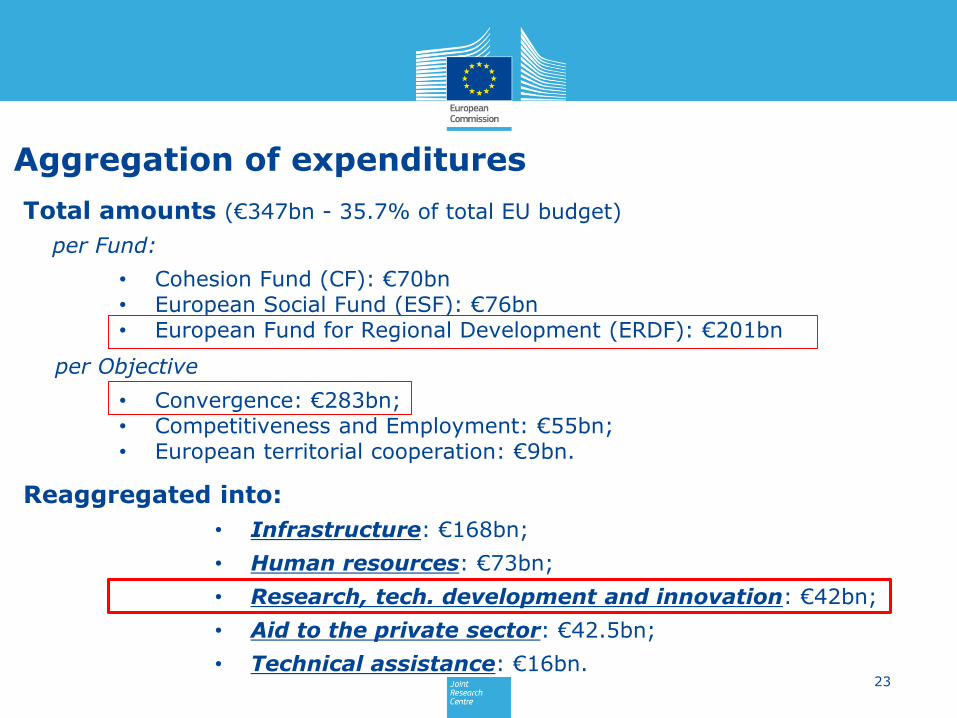
Aggregation of expenditures
Total amounts (€347bn - 35.7% of total EU budget)
per Fund:
• Cohesion Fund (CF): €70bn • European Social Fund (ESF): €76bn • European Fund for Regional Development (ERDF): €201bn
per Objective
• Convergence: €283bn;• Competitiveness and Employment: €55bn;• European territorial cooperation: €9bn.
Reaggregated into:
• Infrastructure: €168bn;
• Human resources: €73bn;
• Research, tech. development and innovation: €42bn;
• Aid to the private sector: €42.5bn;
• Technical assistance: €16bn.23
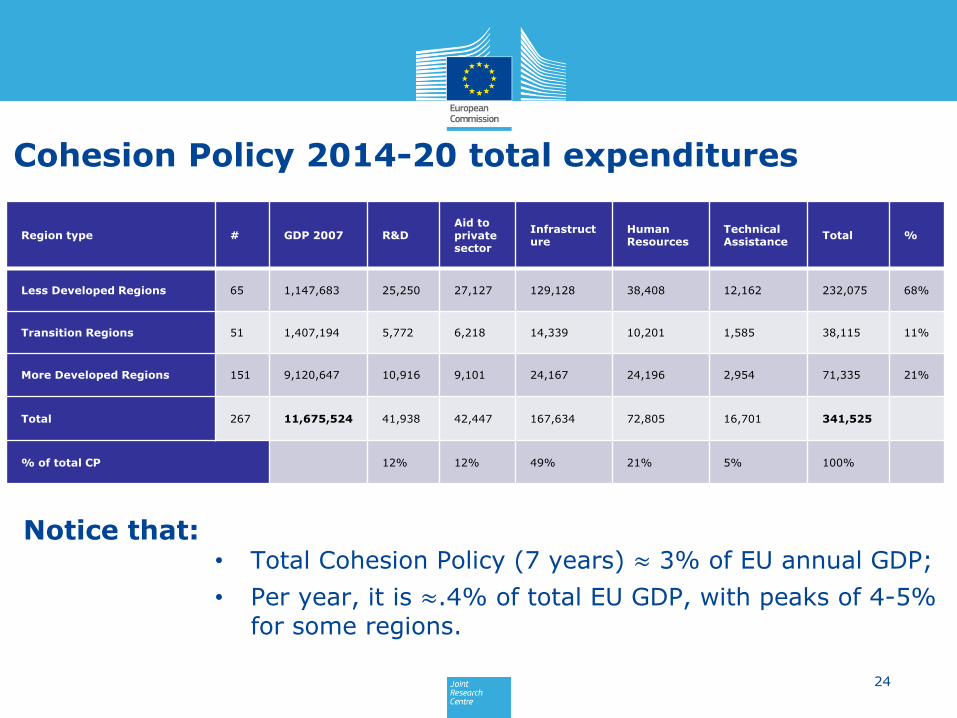
Cohesion Policy 2014-20 total expenditures
Region type # GDP 2007 R&DAid to private sector
Infrastructure
Human Resources
TechnicalAssistance
Total %
Less Developed Regions 65 1,147,683 25,250 27,127 129,128 38,408 12,162 232,075 68%
Transition Regions 51 1,407,194 5,772 6,218 14,339 10,201 1,585 38,115 11%
More Developed Regions 151 9,120,647 10,916 9,101 24,167 24,196 2,954 71,335 21%
Total 267 11,675,524 41,938 42,447 167,634 72,805 16,701 341,525
% of total CP 12% 12% 49% 21% 5% 100%
Notice that: • Total Cohesion Policy (7 years) ≈ 3% of EU annual GDP;
• Per year, it is ≈.4% of total EU GDP, with peaks of 4-5% for some regions.
24
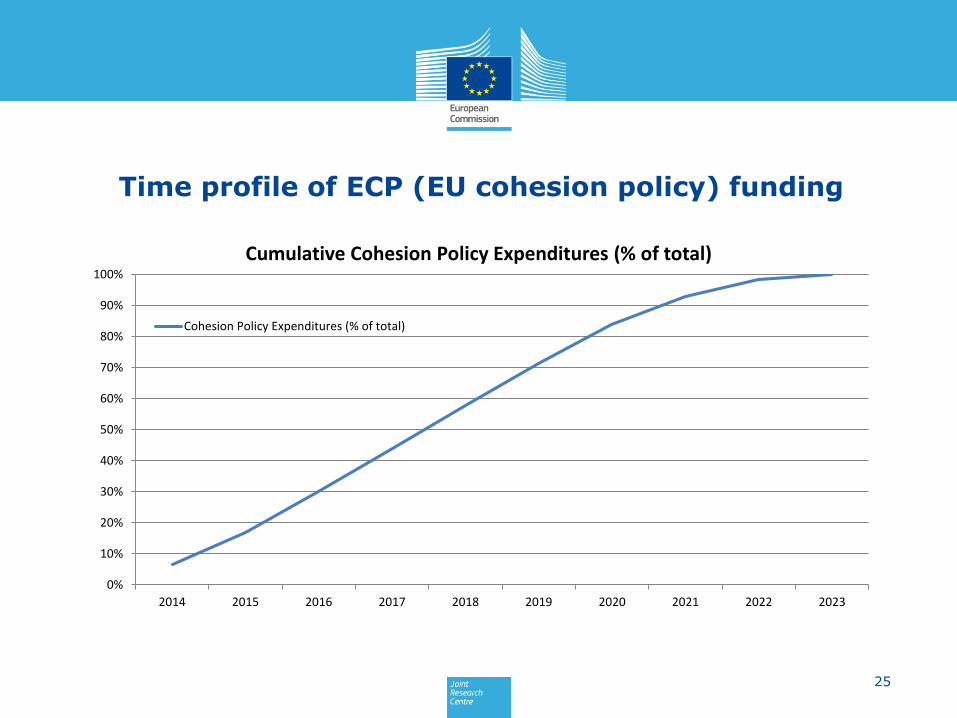
Time profile of ECP (EU cohesion policy) funding
0%
10%
20%
30%
40%
50%
60%
70%
80%
90%
100%
2014 2015 2016 2017 2018 2019 2020 2021 2022 2023
Cumulative Cohesion Policy Expenditures (% of total)
Cohesion Policy Expenditures (% of total)
25
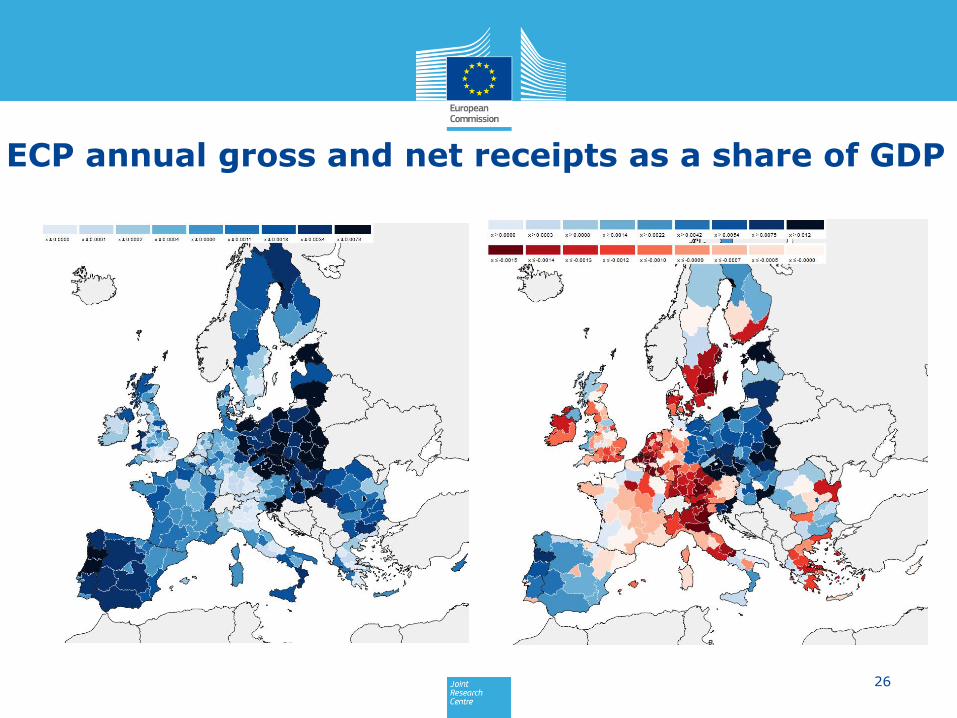
ECP annual gross and net receipts as a share of GDP
26
Example:
Infrastructure investments
27

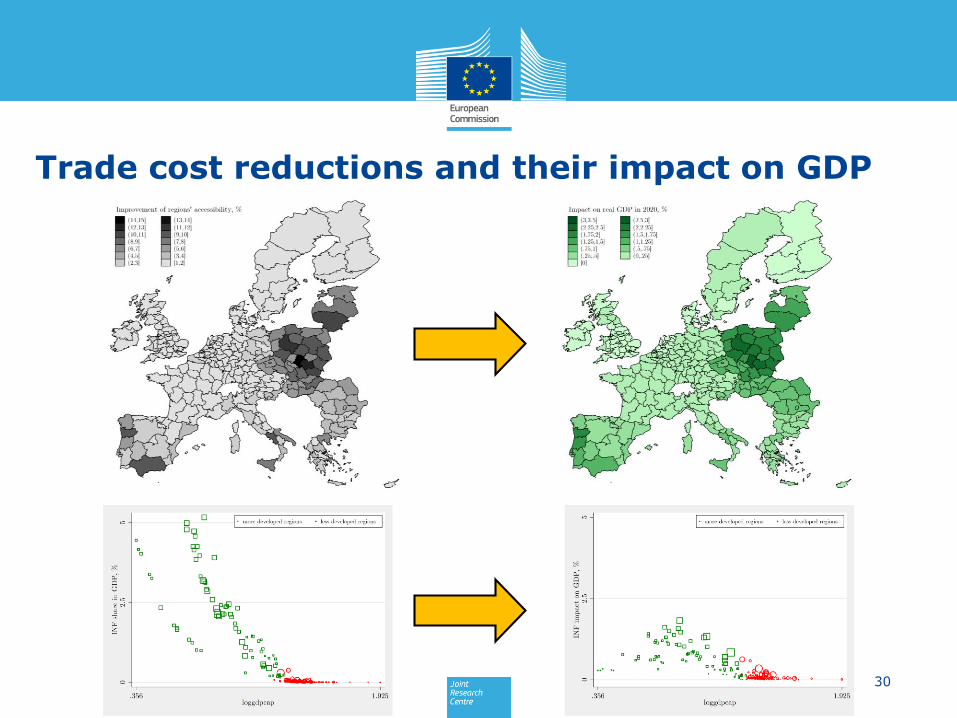
Turning investments in infrastructure into shocks
Three steps:
Aggregation of ECP expenditures on infrastructures;
Definition of a pairwise spatial dimension to regional
ECP expenditures;
Translating ECP expenditure EUROS into trade cost
reductions.
28

29
Transport infrastructure investments mainly concentrated in convergence regions
30
Trade cost reductions and their impact on GDP
Presentation Outline
• Why a regional CGE model for impact assessment?
• Short description of the RHOMOLO model;
• Simulating European Cohesion Policy;
• Simulation results for the overall EU;
• Latvia-specific simulations;
• Conclusions.
31
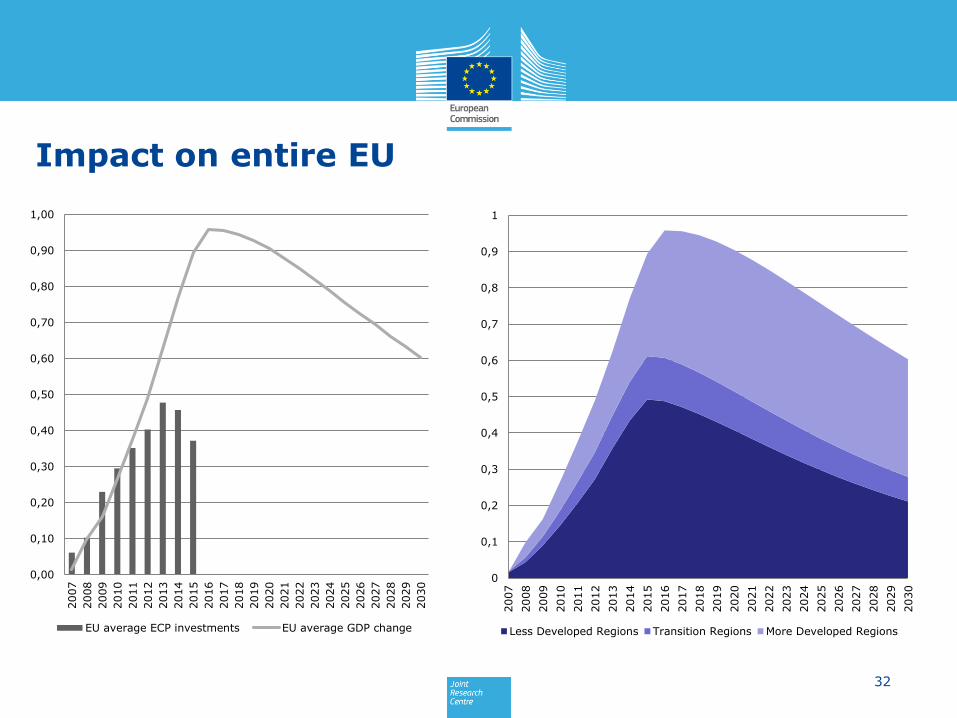
Impact on entire EU
32
0,00
0,10
0,20
0,30
0,40
0,50
0,60
0,70
0,80
0,90
1,00
2007
2008
2009
2010
2011
2012
2013
2014
2015
2016
2017
2018
2019
2020
2021
2022
2023
2024
2025
2026
2027
2028
2029
2030
EU average ECP investments EU average GDP change
0
0,1
0,2
0,3
0,4
0,5
0,6
0,7
0,8
0,9
1
2007
2008
2009
2010
2011
2012
2013
2014
2015
2016
2017
2018
2019
2020
2021
2022
2023
2024
2025
2026
2027
2028
2029
2030
Less Developed Regions Transition Regions More Developed Regions
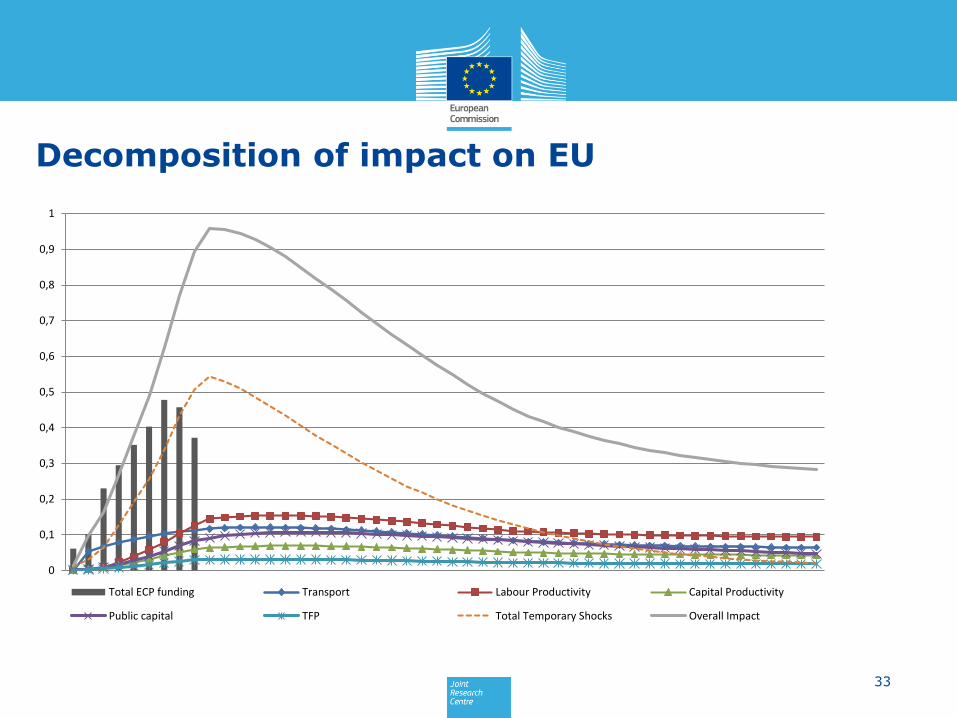
Decomposition of impact on EU
33
0
0,1
0,2
0,3
0,4
0,5
0,6
0,7
0,8
0,9
1
Total ECP funding Transport Labour Productivity Capital Productivity
Public capital TFP Total Temporary Shocks Overall Impact
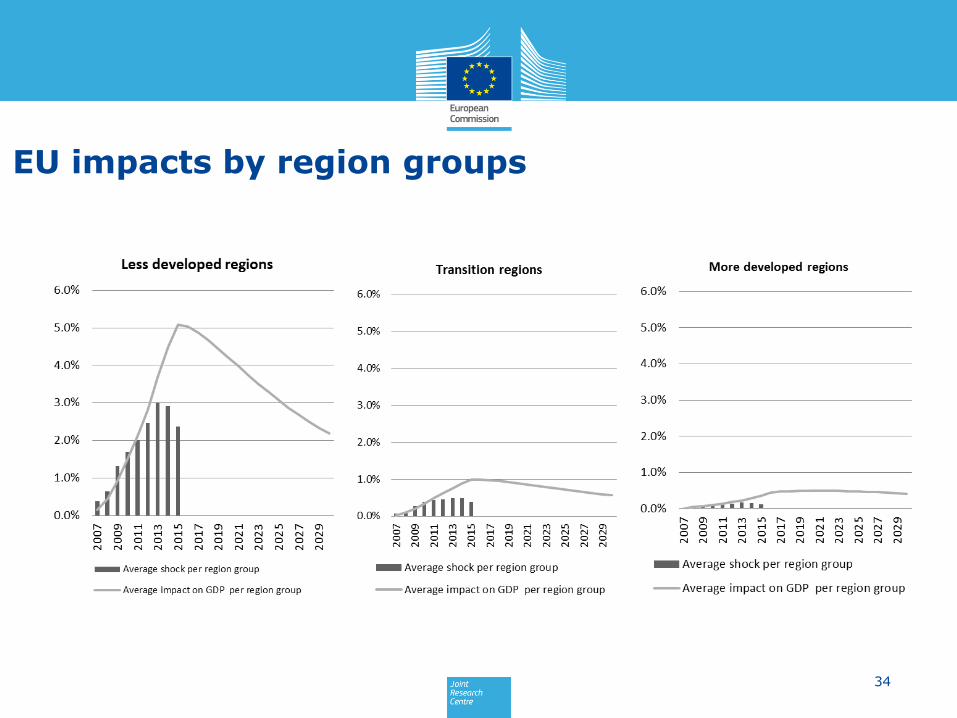
EU impacts by region groups
34
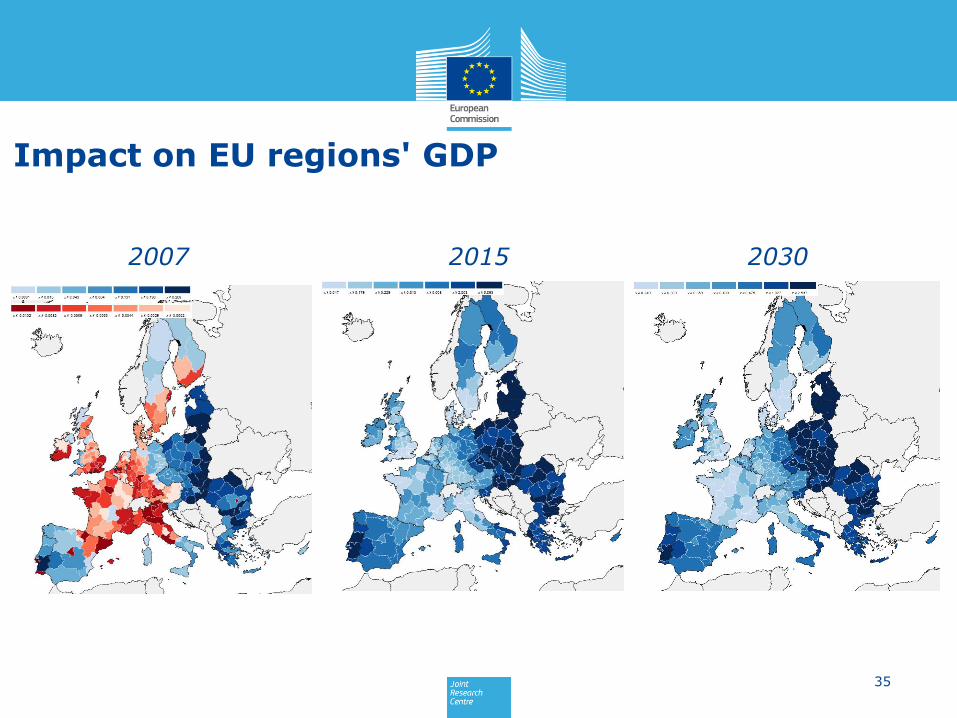
Impact on EU regions' GDP
35
2007 2015 2030
Presentation Outline
• Why a regional CGE model for impact assessment?
• Short description of the RHOMOLO model;
• Simulating European Cohesion Policy;
• Simulation results for the overall EU;
• Latvia-specific simulations;
• Conclusions.
36

Latvia-specific simulations exploring alternative scenarios
6 scenarios analysed for Latvia:
I. Actual ECP disbursements;
II. Actual ECP disbursements, excluding Latvia;
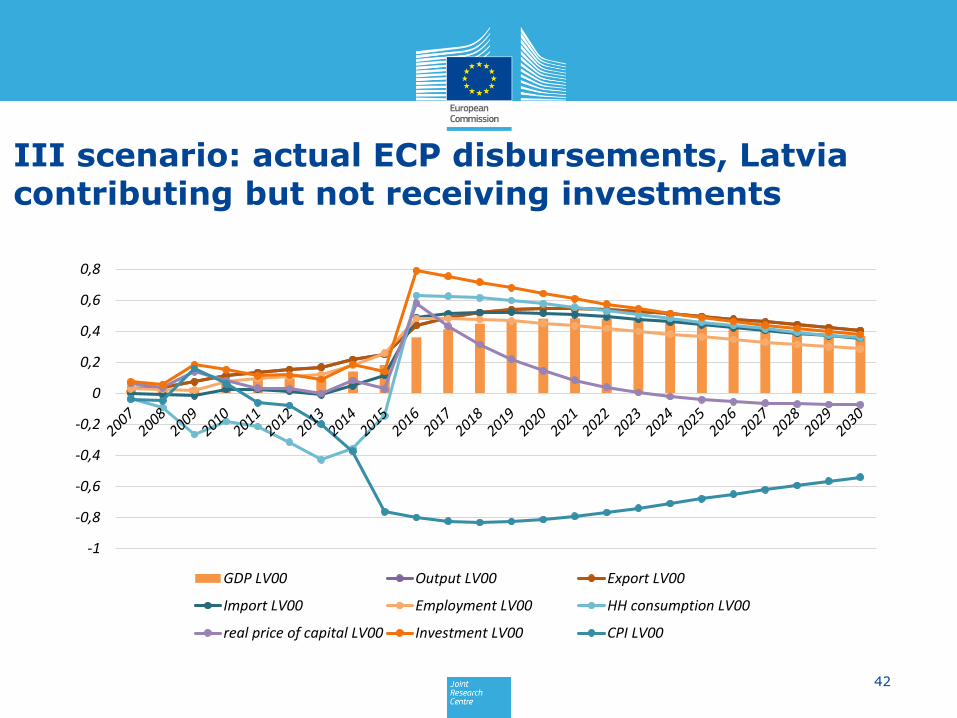
III. Actual ECP disbursements, Latvia contributing but not
receiving investments;
IV. Actual ECP disbursements only to Latvia, financed by
whole EU;
V. Actual ECP disbursements only to Latvia, without
permanent effects financed by whole EU;
VI. Latvia paying for itself for ECP actual investments.37
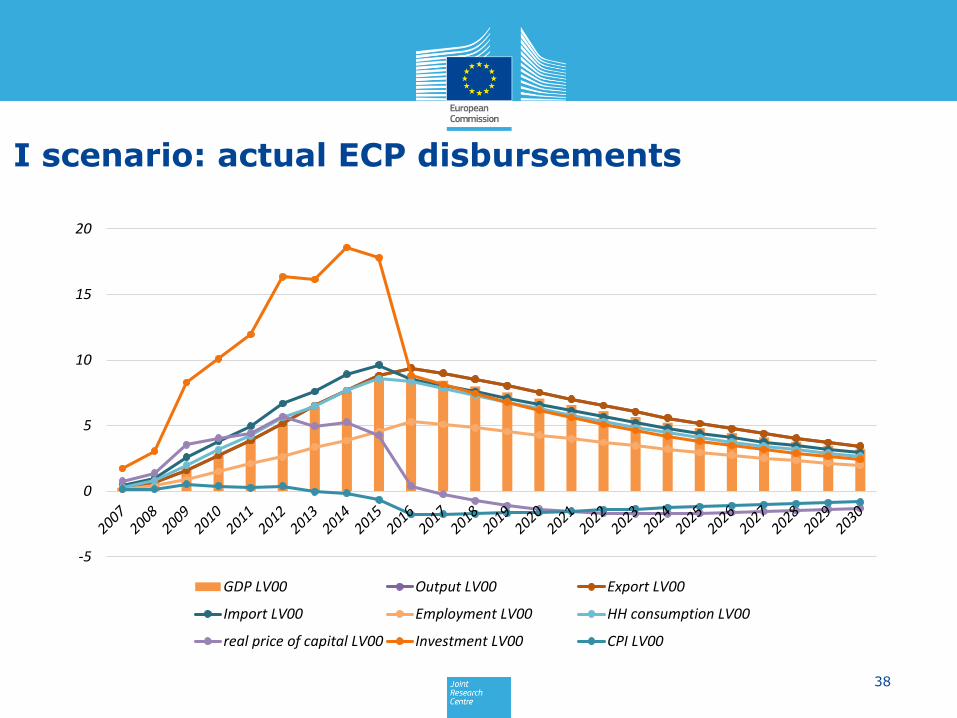
I scenario: actual ECP disbursements
38
-5
0
5
10
15
20
GDP LV00 Output LV00 Export LV00
Import LV00 Employment LV00 HH consumption LV00
real price of capital LV00 Investment LV00 CPI LV00

II scenario: actual ECP disbursements, excluding Latvia
39
2007 2015
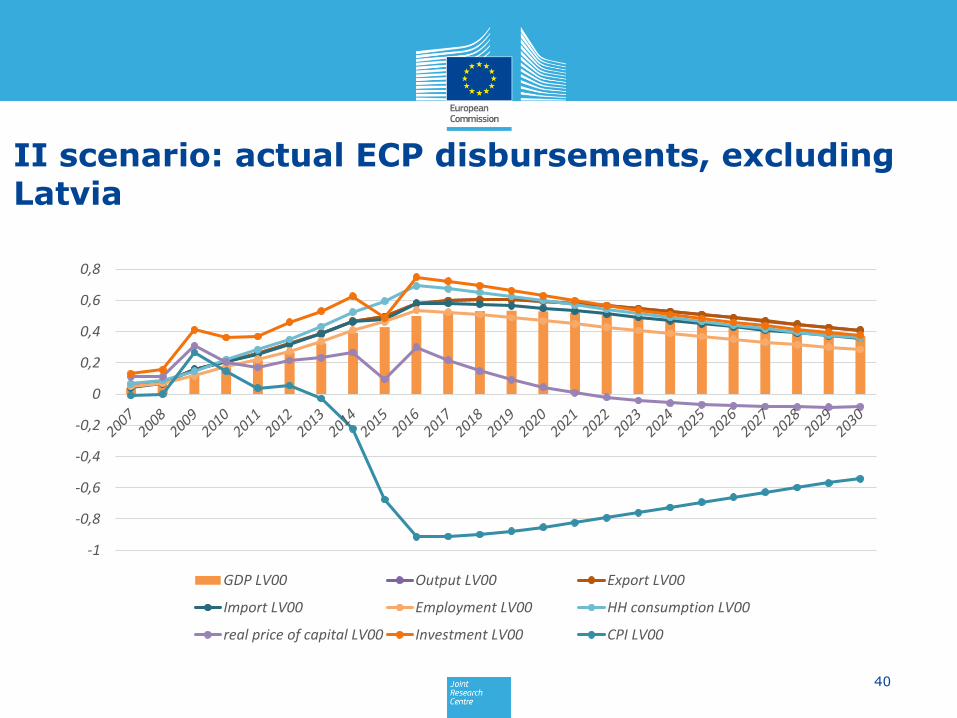
II scenario: actual ECP disbursements, excluding Latvia
40
-1
-0,8
-0,6
-0,4
-0,2
0
0,2
0,4
0,6
0,8
GDP LV00 Output LV00 Export LV00
Import LV00 Employment LV00 HH consumption LV00
real price of capital LV00 Investment LV00 CPI LV00

III scenario: actual ECP disbursements, Latviacontributing but not receiving investments
41
2007 2015
III scenario: actual ECP disbursements, Latviacontributing but not receiving investments
42
-1
-0,8
-0,6
-0,4
-0,2
0
0,2
0,4
0,6
0,8
GDP LV00 Output LV00 Export LV00
Import LV00 Employment LV00 HH consumption LV00
real price of capital LV00 Investment LV00 CPI LV00

IV scenario: actual ECP disbursements only to Latvia, financed by whole EU
43
2007 2015 2025
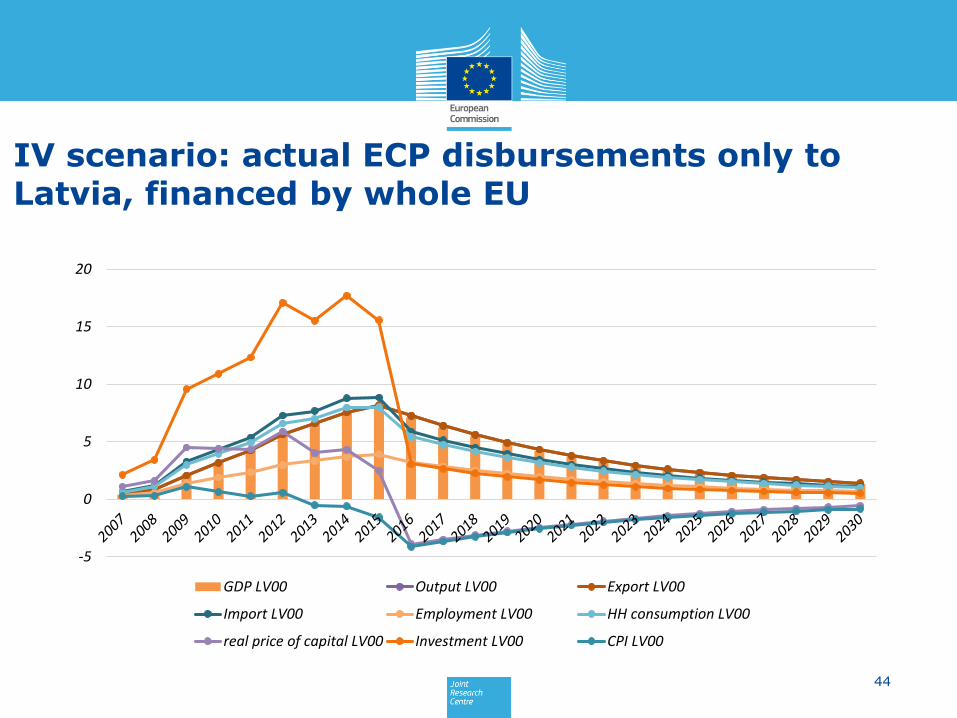
IV scenario: actual ECP disbursements only to Latvia, financed by whole EU
44
-5
0
5
10
15
20
GDP LV00 Output LV00 Export LV00
Import LV00 Employment LV00 HH consumption LV00
real price of capital LV00 Investment LV00 CPI LV00
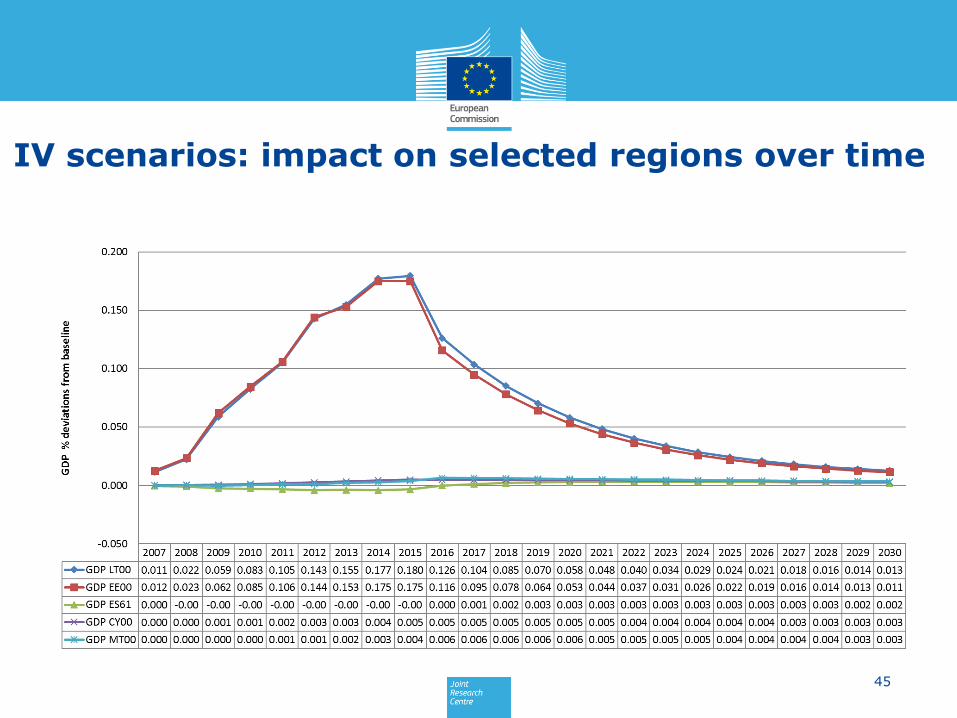
IV scenarios: impact on selected regions over time
45

V scenario: actual ECP disbursements only to Latvia, without permanent effects financed by whole EU
46
2007 2015 2025
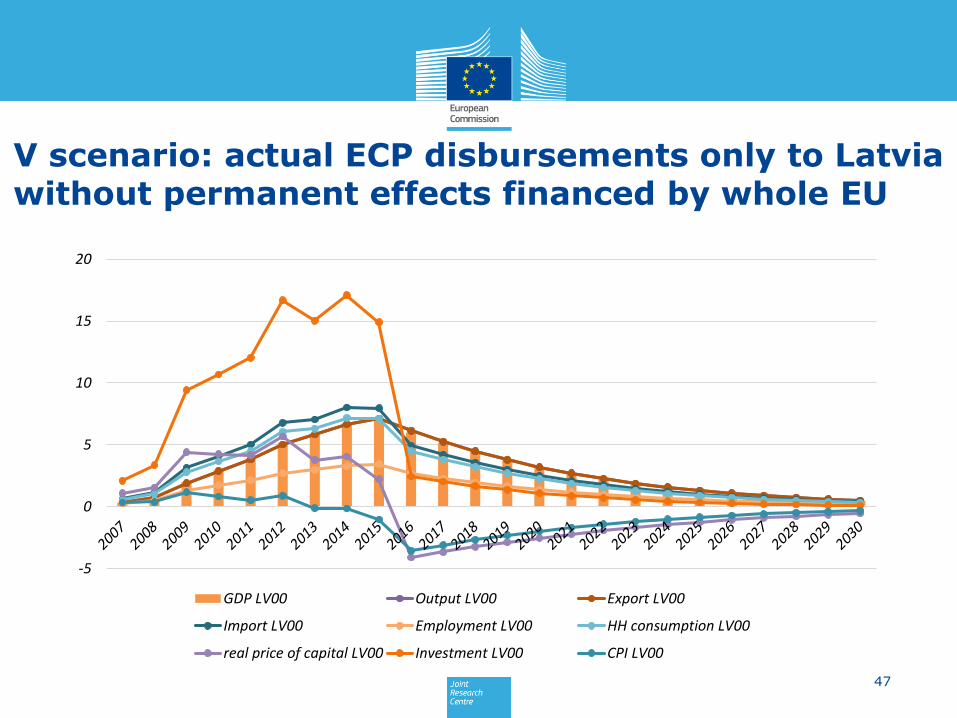
V scenario: actual ECP disbursements only to Latviawithout permanent effects financed by whole EU
47
-5
0
5
10
15
20
GDP LV00 Output LV00 Export LV00
Import LV00 Employment LV00 HH consumption LV00
real price of capital LV00 Investment LV00 CPI LV00
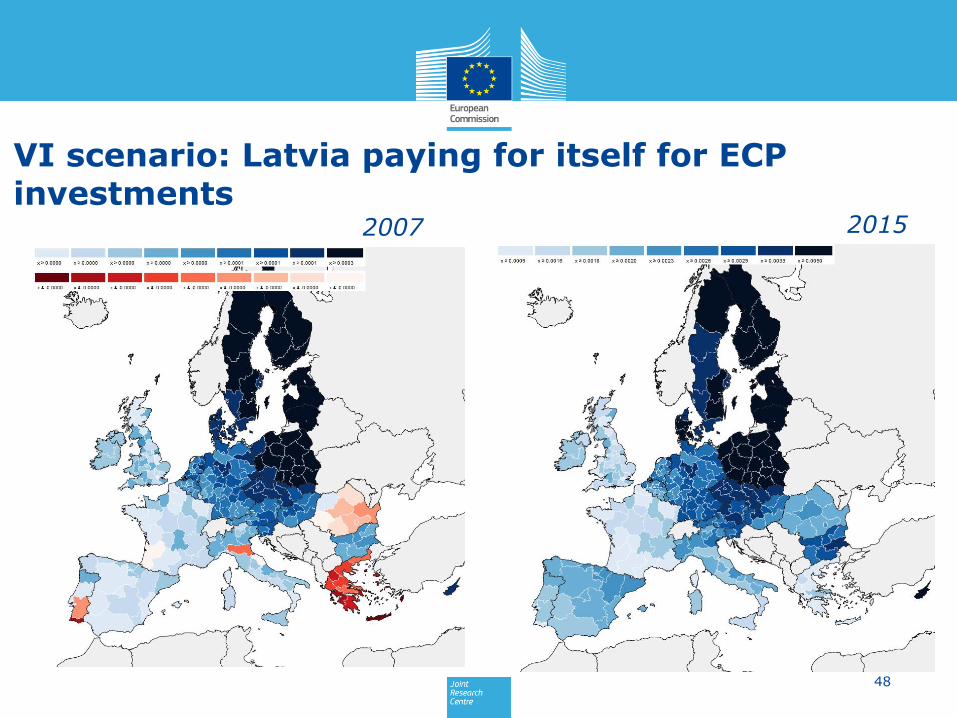
VI scenario: Latvia paying for itself for ECP investments
48
2007 2015
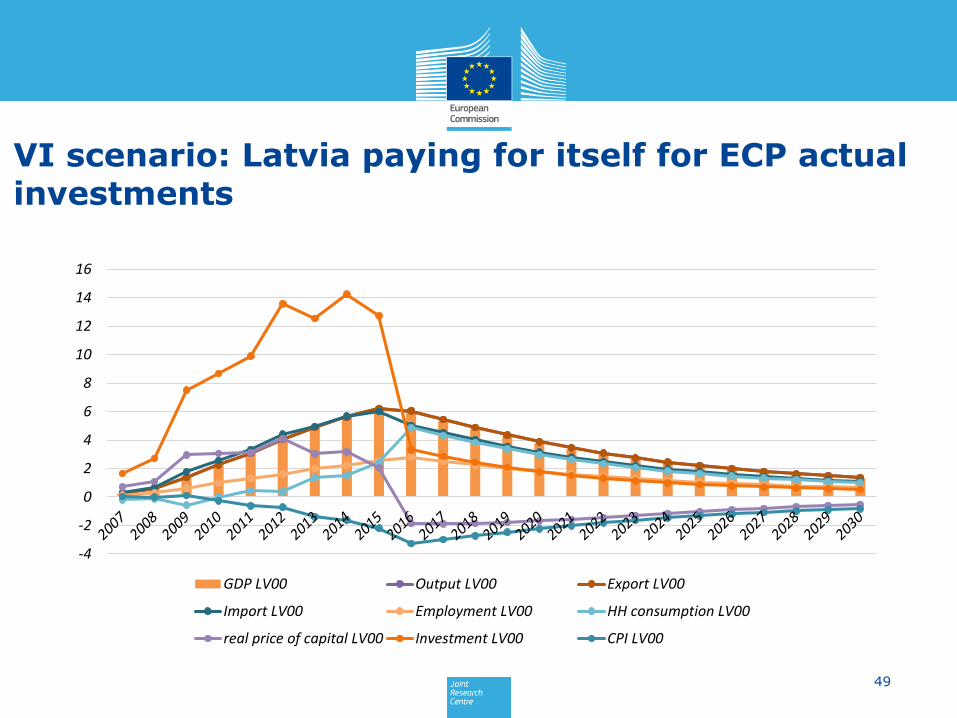
VI scenario: Latvia paying for itself for ECP actualinvestments
49
-4
-2
0
2
4
6
8
10
12
14
16
GDP LV00 Output LV00 Export LV00
Import LV00 Employment LV00 HH consumption LV00
real price of capital LV00 Investment LV00 CPI LV00
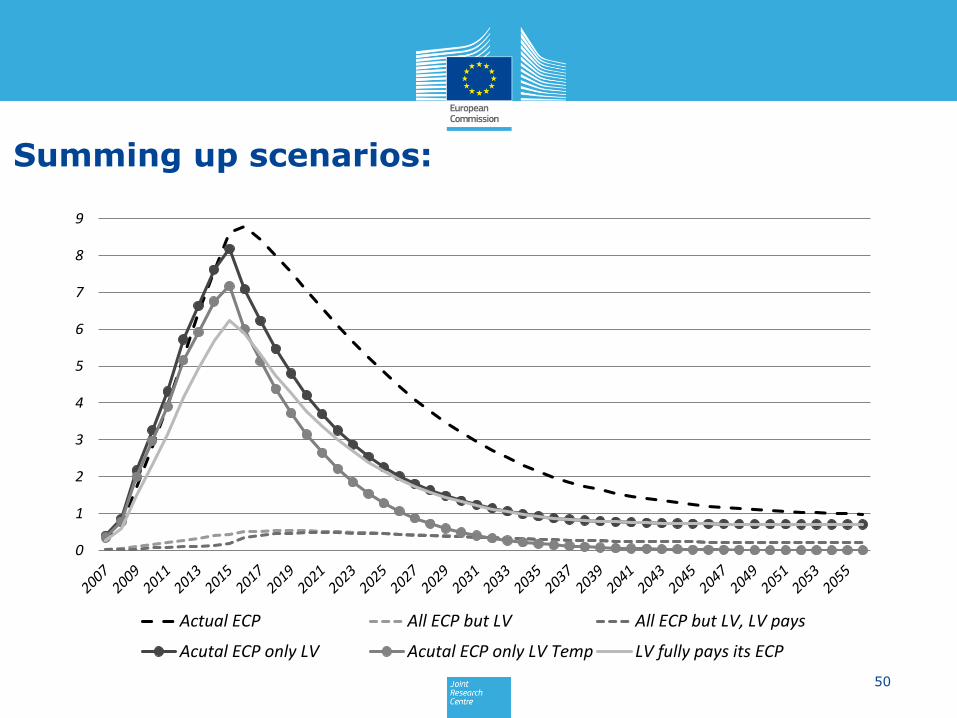
Summing up scenarios:
50
0
1
2
3
4
5
6
7
8
9
Actual ECP All ECP but LV All ECP but LV, LV pays
Acutal ECP only LV Acutal ECP only LV Temp LV fully pays its ECP
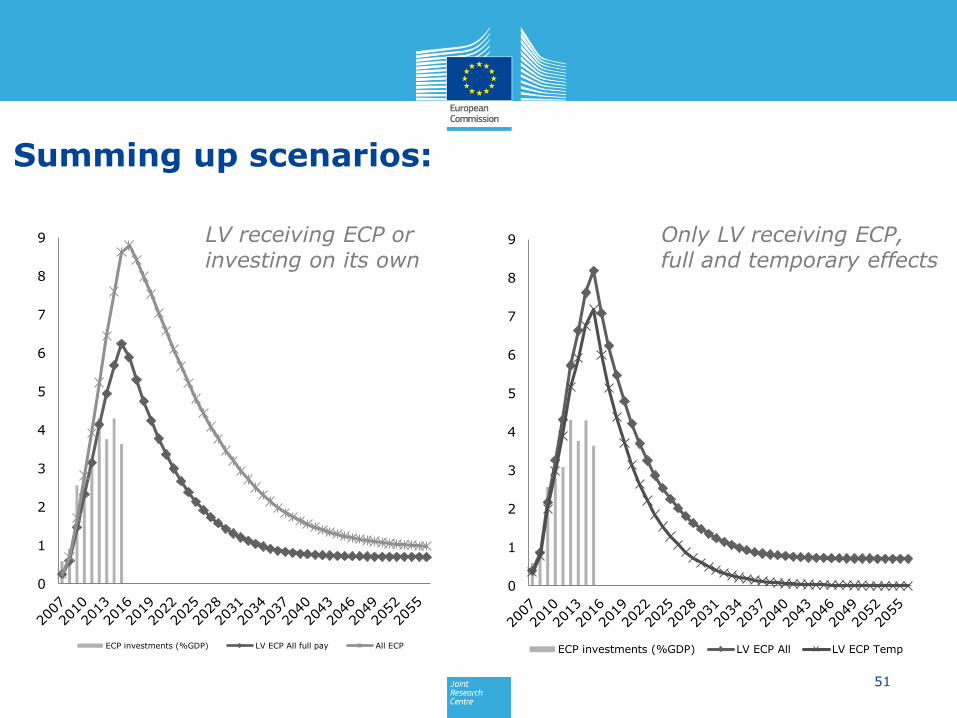
Summing up scenarios:
51
0
1
2
3
4
5
6
7
8
9
ECP investments (%GDP) LV ECP All LV ECP Temp
0
1
2
3
4
5
6
7
8
9
ECP investments (%GDP) LV ECP All full pay All ECP
LV receiving ECP or investing on its own
Only LV receiving ECP, full and temporary effects
Presentation Outline
• Why a regional CGE model for impact assessment?
• Short description of the RHOMOLO model;
• Simulating European Cohesion Policy;
• Simulation results for the overall EU;
• Latvia-specific simulations;
• Conclusions.
52
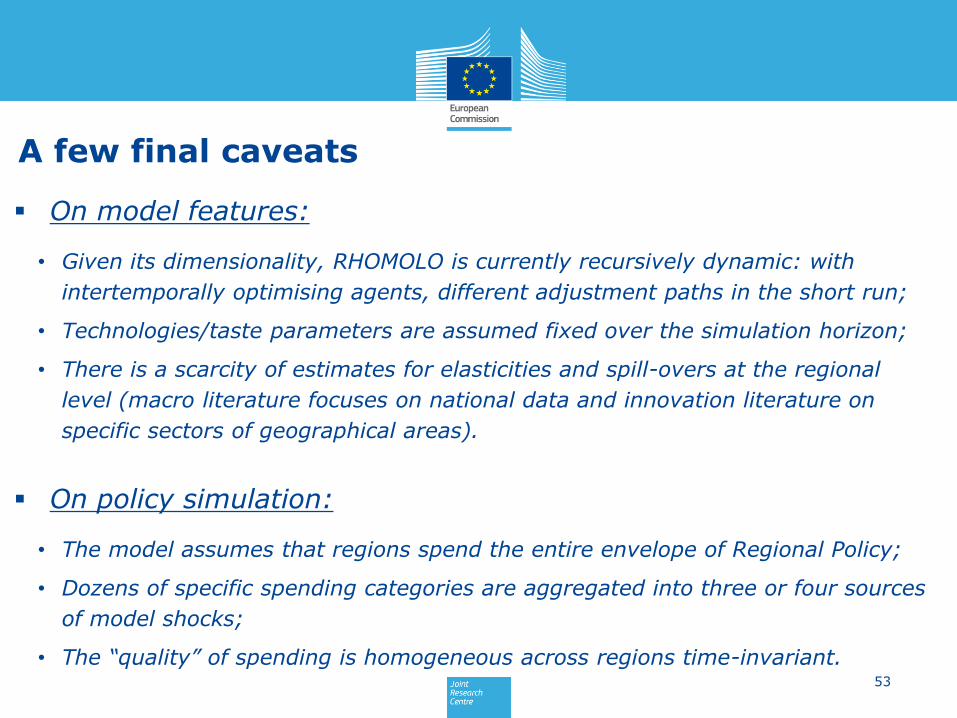
A few final caveats
On model features:
• Given its dimensionality, RHOMOLO is currently recursively dynamic: with
intertemporally optimising agents, different adjustment paths in the short run;
• Technologies/taste parameters are assumed fixed over the simulation horizon;
• There is a scarcity of estimates for elasticities and spill-overs at the regional
level (macro literature focuses on national data and innovation literature on
specific sectors of geographical areas).
On policy simulation:
• The model assumes that regions spend the entire envelope of Regional Policy;
• Dozens of specific spending categories are aggregated into three or four sources
of model shocks;
• The “quality” of spending is homogeneous across regions time-invariant.53
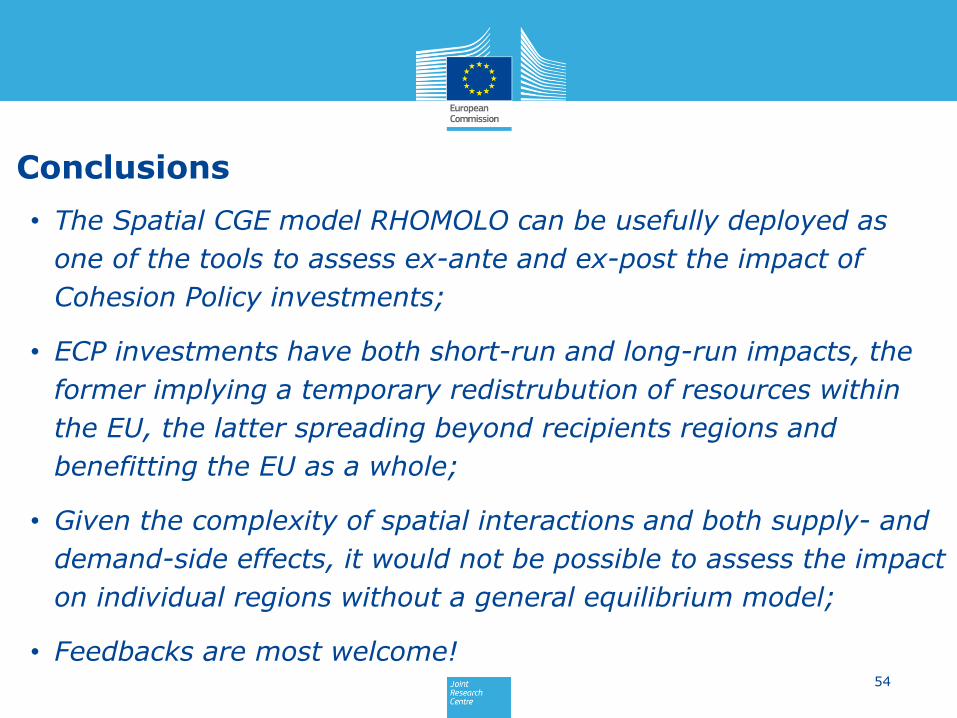
Conclusions
• The Spatial CGE model RHOMOLO can be usefully deployed as
one of the tools to assess ex-ante and ex-post the impact of
Cohesion Policy investments;
• ECP investments have both short-run and long-run impacts, the
former implying a temporary redistrubution of resources within
the EU, the latter spreading beyond recipients regions and
benefitting the EU as a whole;
• Given the complexity of spatial interactions and both supply- and
demand-side effects, it would not be possible to assess the impact
on individual regions without a general equilibrium model;
• Feedbacks are most welcome!54
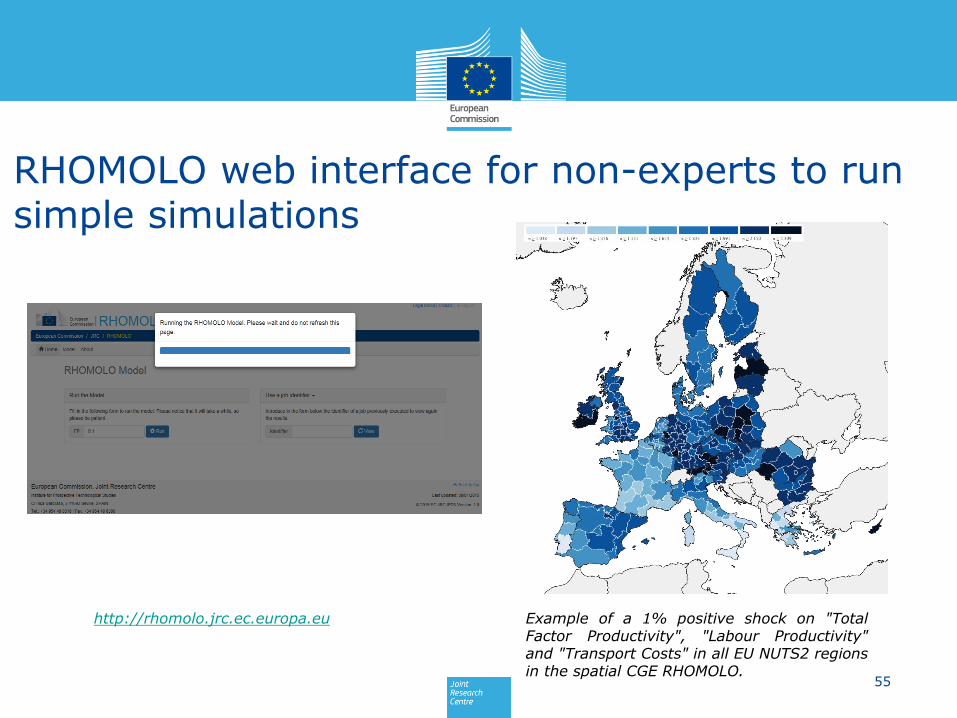
RHOMOLO web interface for non-experts to runsimple simulations
Example of a 1% positive shock on "TotalFactor Productivity", "Labour Productivity"and "Transport Costs" in all EU NUTS2 regionsin the spatial CGE RHOMOLO.
55
http://rhomolo.jrc.ec.europa.eu
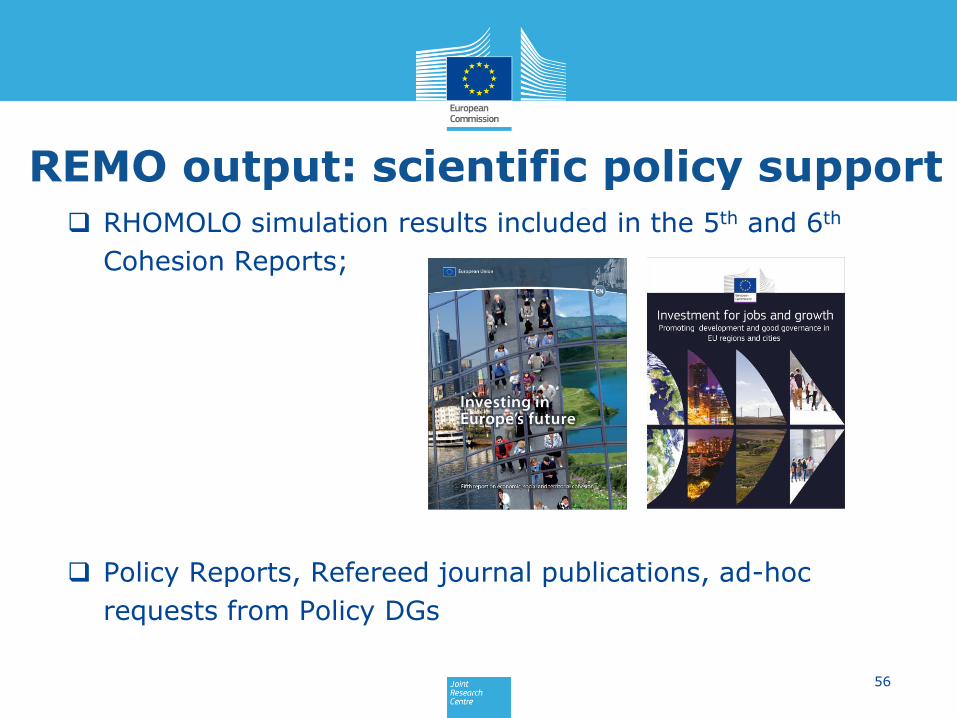
RHOMOLO simulation results included in the 5th and 6th
Cohesion Reports;
Policy Reports, Refereed journal publications, ad-hoc
requests from Policy DGs
REMO output: scientific policy support
56
For more information on RHOMOLO:
Website:
https://ec.europa.eu/jrc/rhomolo
Web simulation tool:
http://rhomolo.jrc.ec.europa.eu
5757