Ex Ante Analysis of Small-Scale Irrigation Interventions ......in the Amhara region of Ethiopia....
33
www.feedthefuture.gov Ex Ante Analysis of Small-Scale Irrigation Interventions in Robit Texas A&M University Integrated Decision Support System Team USAID Feed the Future Innovation Laboratory for Small-Scale Irrigation Jean-Claude Bizimana, Neville P. Clarke, Yihun T. Dile, Thomas J. Gerik, Jaehak Jeong, Javier M. Osorio Leyton, James W. Richardson, Raghavan Srinivasan, and Abeyou W. Worqlul The authors wish to acknowledge the following agencies and individuals who were instrumental in providing data and expert advice for this report: the Ethiopian Ministry of Water, Energy and Irrigation; the Ethiopian National Meteorological Services Agency; Immaculate Omondi and Adie Aberra of the International Livestock Research Institute (ILRI); Mekonnen Dawitt and Simone Passarelli of the International Food Policy Research Institute; and Azage Tegegne and Berhanu Gebremedhin of ILRI- LIVES (Livestock and Irrigation Value Chains for Ethiopian Smallholders). . Ex Ante Analysis of Small-Scale Irrigation Interventions in Robit
Transcript of Ex Ante Analysis of Small-Scale Irrigation Interventions ......in the Amhara region of Ethiopia....
www.feedthefuture.gov
Ex Ante Analysis of Small-Scale Irrigation Interventions in Robit
Texas A&M University Integrated Decision Support System Team USAID Feed the Future Innovation Laboratory for Small-Scale Irrigation
Jean-Claude Bizimana, Neville P. Clarke, Yihun T. Dile, Thomas J. Gerik, Jaehak Jeong, Javier M. Osorio Leyton, James W. Richardson, Raghavan Srinivasan, and Abeyou W. Worqlul
The authors wish to acknowledge the following agencies and individuals who were instrumental in providing data and expert advice for this report: the Ethiopian Ministry of Water, Energy and Irrigation;
the Ethiopian National Meteorological Services Agency; Immaculate Omondi and Adie Aberra of the International Livestock Research Institute (ILRI); Mekonnen Dawitt and Simone Passarelli of the
International Food Policy Research Institute; and Azage Tegegne and Berhanu Gebremedhin of ILRI-LIVES (Livestock and Irrigation Value Chains for Ethiopian Smallholders).
.
Ex Ante Analysis of Small-Scale Irrigation Interventions in Robit
www.feedthefuture.gov
2
Interpretive Summary Introduction Methods Results and Discussion Conclusions
Interpretive Summary
This report is part of the product of the USAID Feed the Future Innovation Laboratory for Small Scale Irrigation (ILSSI), and summarizes ILSSI’s analysis of proposed small-scale irrigation (SSI) interventions in Bahir Dar Zuria (BDZ) woreda, in the Amhara region of Ethiopia. Farm family livelihoods in the area are derived from cereals produced in the rainy season and irrigated crops grown in the dry season. Groundwater potential and experience in SSI is relatively high; however, decision makers have historically lacked means to assess the effects of increased SSI on crop production, farm family economics, and environmental services.
In BDZ, ILSSI proposed maximizing SSI of high-value, dry-season crops, using shallow groundwater and one of five alternative water-lifting technologies. ILSSI evaluated the proposed SSI interventions by simulating and comparing four alternative farming systems:
1. current farm management practices and fertilizer rates with rotations of maize, finger millet, and teff grown in the wet season;
2. in addition to the current wet season crops (scenario 1), using shallow groundwater to grow an irrigated, dry season double crop (onion) on all irrigable land (i.e., areas with slopes less than 8%);
3. increasing fertilizer application in farming system 1 (i.e., without irrigated, dry-season onion) to government recommended rates; and
4. increasing fertilizer application in farming system 2 (i.e., with irrigated, dry-season onion) to government recommended rates.
The study also examined the effects of deep tillage on the region’s hardpan soils in conjunction with the proposed SSI intervention, and the effects of different irrigation amounts on the dry-season crop. Onion was chosen as representative dry-season crop for purposes of the simulations, based on input from local experts. Additional crops will be modeled in ex post studies that reflect field studies and broader applications.
Simulations indicated that there is a large potential for increased SSI in BDZ. A complete hydrologic analysis of the area’s 1506-ha watershed calculated that the average annual volumetric groundwater recharge was over 4 million m3. Simulations indicated that the proposed SSI interventions would use approximately 40% of the annual shallow groundwater recharge. Additionally, simulations indicated that the proposed SSI interventions would reduce average monthly stream flow by 6%, and should not compromise downstream flows. This suggests that the proposed SSI interventions can be sustained by the shallow groundwater recharge without affecting long-term groundwater storage, and would not compromise the environmental health of the watershed.
The proposed SSI interventions (especially when combined with increased fertilization rates) increased wet-season grain yields significantly, presumably because crop rotation operations implemented in conjunction with the proposed SSI scenarios resulted in improvements in soil organic matter. As expected, the proposed SSI interventions also resulted in significant onion yields, which were shown to
www.feedthefuture.gov
3
increase with applied irrigation water of up to 140 mm (the irrigation depth required to reduce plant stress levels to 0%).
Economic analyses were conducted to estimate the effects of the proposed SSI interventions (in conjunction with the simulated, improved cropping system) on farm family economics in Robit, a kebele in BDZ. These simulations compared the costs and benefits of five alternative water-lifting technologies: pulley-and-bucket irrigation, and rope-and-washer pumps operated by hand, animal, gasoline motor, and solar power. Additionally, these simulations analyzed the effects of deep tillage (as opposed to current, shallow tillage practices) to break up hardpan soils. In all, eleven scenarios (including the baseline, non-irrigated scenario) were simulated.
Of the technologies examined, only the gasoline motor pump met the irrigation water requirements for the proposed SSI interventions (i.e., for all 787 ha of irrigable land in the kebele). Implementation of the proposed SSI interventions using an animal-powered or gasoline motor pump produced the highest net present value, net cash farm income, and ending cash reserves of the eleven scenarios simulated. The benefits were greatest when these technologies were combined with deep tillage to increase rooting depth and reduce drought stress in the grain crops. In each of the alternative scenarios, the increase in farm revenue was due almost entirely to the sale of surplus irrigated onion. Where an animal-powered or gasoline motor pump was used in combination with deep tillage practices, the forecasted sales of irrigated onions contributed, on average, 87% of the total crops receipts and 100% of the net cash (profit) for the five-year planning horizon.
A motor pump can irrigate an area three times larger than that covered by an animal-powered pump. The main barrier to SSI with motor or solar pumps is the up-front investment in the technology; the initial investment costs of an animal-powered pump are much lower. Individual farmers might benefit by spreading entry costs over more irrigated area, perhaps by having two or three farmers share a motor or solar pump.
Despite improvements in farm family economics resulting from the proposed SSI interventions, nutritional deficiencies persisted under the simulated, improved cropping system. We would also, therefore, propose expanding the types of crops irrigated in the dry season to increase family nutrition and net cash income, but only if such crops can be irrigated without causing excessive soil erosion or reduction in environmental benefits.
Notably, the simulated soil erosion rates were very high in Robit, suggesting that the current and alternative cropping systems simulated in this study cannot be sustained without substantial efforts to reduce soil erosion. Every effort should be made to identify and implement cropping systems that reduce the rates of soil erosion. The evaluation and comparison of alternative farming systems, including the types of crops grown, recommended management practices, and associated impacts on soil erosion and environmental benefits, are subjects for proposed future study.
www.feedthefuture.gov
4
Introduction
There are three major components of ILSSI: (1) field studies evaluating selected SSI methods; (2) household surveys to assess the evaluate gender, nutrition, and economic consequences of SSI interventions; and (3) the application of a suite of integrated models to quantitatively estimate the impact of SSI on production, environmental, and economic outcomes. An iterative process of engagement is involved in linking the three components of ILSSI to form a final product.
The analyses summarized in this report contribute to the third ILSSI component: estimating the impacts of proposed SSI interventions using the ILSSI’s Integrated Decision Support System (IDSS). The IDSS is comprised of a suite of previously validated, interacting, and spatially explicit agroecosystem models: the Soil and Water Assessment Tool (SWAT), Agricultural Policy Environmental Extender (APEX), and Farm Scale Nutrition and Economic Risk Assessment Model (FARMSIM). The IDSS predicts short-term and long-term changes in crop and livestock production, farm economies, and environmental services produced by changing land uses, agricultural technologies and policies, climate, and water resources management, including SSI. The four models (and their sister and antecedent decision tools) have been used successfully for more than 25 years to address complex biophysical and economic issues in the United States and around the world. Designed to use readily available input data from global, national, and local sources, they can provide decision makers with reliable predictions of the production, environmental, and economic impacts of their actions.
The objective of this study was to use the IDSS to evaluate the benefits, environmental effects and economic viability of proposed SSI interventions on farms in BDZ, an AGP and Feed-the-Future woreda in the Amhara region of Ethiopia. Robit, one of the rural kebeles in BDZ woreda, is located near Lake Tana and just 20 km from Bahir-Dar, BDZ’s capital and main market. The region’s climate is subtropical, and temperatures are ideal for cropping year-round, with a main rainy season from June to September and a dry season from October to January. The dramatic shift in rainfall that occurs between wet and dry seasons restricts rain-fed cropping to the rainy season. For double cropping, irrigation is needed in the dry season.
There are an estimated 2390 ha of cropland in the kebele. The average household owns and operates 1.5 ha, cultivating a main crop of cereals in the rainy season, with some producing irrigated vegetable crops in the dry season. Increased dairy production and Robit’s proximity to Bahir-Dar have created increased demand for irrigated vegetable crops and forages. Currently, about 53 households are producing irrigated fodder for livestock feed (Langan 2014).
Both groundwater potential and experience in small-scale irrigation are relatively high in Robit. The main sources of irrigation water in the kebele are shallow groundwater wells, river diversions and lake pumping. There are about 3861 individual wells in Robit. Motor pumps together with manual water lifting devices are widely used. In 2014, about 76% of cropland in the kebele (1820 ha) was irrigated, of which 86% (1569 ha) was irrigated using motor pumps. However, an IRLI-LIVES survey from January 2014 reported that only about 41% of survey respondents irrigated crops. Only 33% of survey respondents indicated that they have a motor pump, while only 25% indicated that they have a plot under irrigation.
www.feedthefuture.gov
5
Rapidly increasing population, economic growth, and the movement of the rural population to cities provides a strong incentive for the Ethiopian government to help farmers increase production and farm family nutritional and economic well-being. However, as in other parts of the world, farming systems in Ethiopia are complex and can have adverse environmental effects such as soil erosion, loss of plant nutrients, and changes in watershed hydrology. Increased reliance on small-scale irrigated agriculture, which is promoted by the government of Ethiopia, could have both positive effects on food production and negative effects on stream flows and shallow aquifers used for human and livestock water supplies. In addition, depending on equipment costs, labor availability, other crop input costs, and market prices of agricultural commodities, the increased use of SSI, or of specific irrigation technologies, may or may not prove economically beneficial.
Information about BDZ’s natural resources, existing cropping systems, farm family characteristics, and market conditions for agricultural products were obtained from a number of international, national, and local sources. These data were then used as inputs to the IDSS modeling system.
The baseline farming-system scenario simulated with FARMSIM, SWAT and APEX was the typical farming system currently used by farmers in the region. It consisted of traditional grains (maize, teff, and finger millet) grown as monocrops during the main rainy season, using shallow tillage with animal traction, and current fertilizer application rates. The proposed SSI interventions simulated with SWAT and APEX were the increased cultivation of an irrigated, dry-season, double crop (onion) in all irrigable cropland areas (irrigation-appropriate soils with slopes less than 8%). (As noted above, onion was chosen as a representative dry-season crop for purposes of the simulations, based on input from local experts. Additional crops will be modeled in ex post studies that reflect field studies and broader applications.) In addition, APEX was used to simulate seven irrigation amounts, and SWAT was used to simulate application of government-recommended fertilizer rates on maize, teff and finger millet, with and without the proposed SSI intervention. FARMSIM was used to simulate the effects on farm-scale economics of various water-lifting technologies that could be used to implement the SSI interventions. The models also simulated the effects of deep tillage on the regions hardpan soils in conjunction with the proposed SSI intervention.
Parameterization, calibration, and execution of SWAT, APEX, and FARMSIM were closely coordinated, with input and output data exchanged in an integrated fashion to assure comparability of production, environmental, and economic results. This report describes the methodology, results, and implications of this study.
www.feedthefuture.gov
6
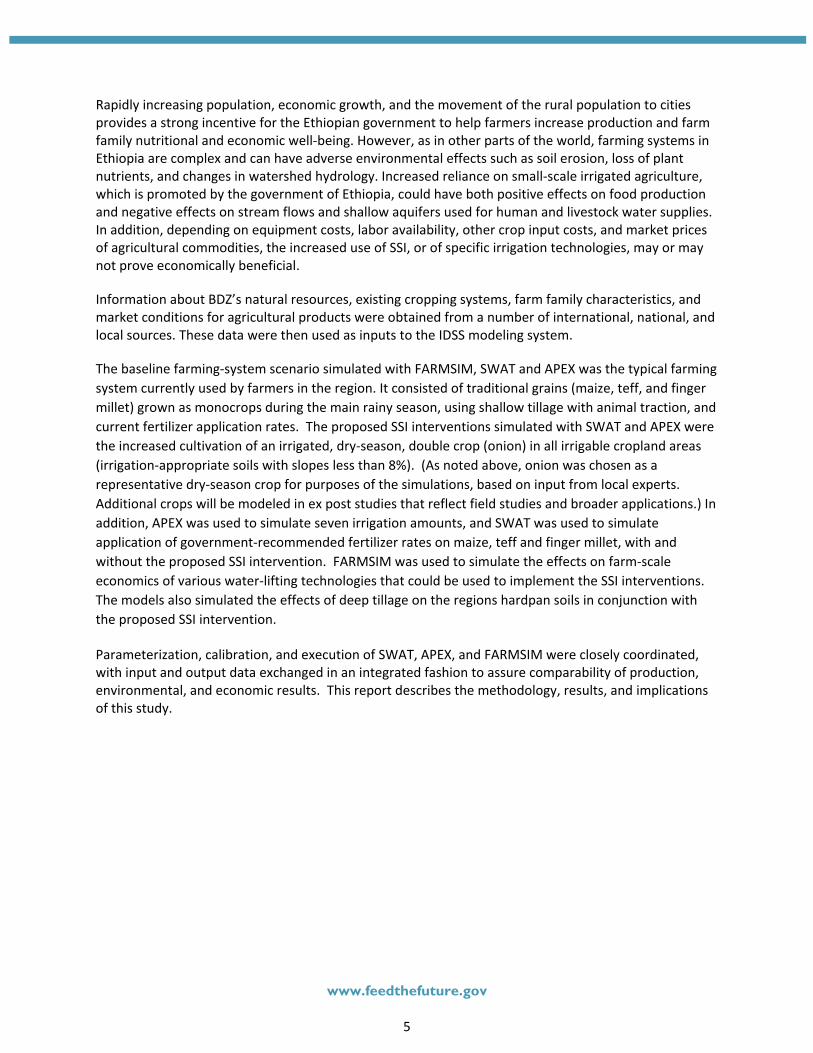
Figure 1. Robit watershed boundary, main streams and Subarea 57, simulated with APEX, in relation to IWMI field sites.
Methods
Model Inputs. Input data used in this study for SWAT and APEX simulations included:
a) The 30-m resolution Digital Elevation Model (DEM) from SRTM Enhanced Shuttle Land Elevation Data (USGS EarthExplorer). These data were improved to 10-m resolution by re-projection with cubic convolution and stream network burning to define streams, delineate the watershed, define slopes, and discretize subarea parameters. Five slope classes were defined within the watershed based on their varying suitability for irrigation (Chen et al. 2010; FAO 1997; Kassam et al. 2012; Mati et al. 2007). The slope classes were <2%, 2-8%, 8-12%, 12-20%, and >20%.
b) For SWAT analyses, an existing land use map (MoWE 2012). For APEX simulations, a LANDSAT-8 image from the USGS Global Visualization Viewer, processed with ERDAS IMAGINE 2014, MULTISPEC, and ArcGIS 10.1. This image was classified using cluster analysis, and four major classes were identified: forestland, cropland, bare soil and water. The final land use map has a 30-m resolution (WGS84 UTM 37N).
c) The soils map shape file (MoWE 2012), which classified the entire watershed area as Chromium Luvisols (LVx). Soil parameters used by SWAT and APEX were estimated with the SWAT soil parameter generating tool.
d) Twenty-four years of daily weather data, from 1990 to 2013, obtained from the Bahir Dar Syn weather station (ENMSA 2012). These data included rainfall, temperature (min/max), relative humidity, sunshine hours (solar radiation), and wind speed. Quality control of the data was
www.feedthefuture.gov
7
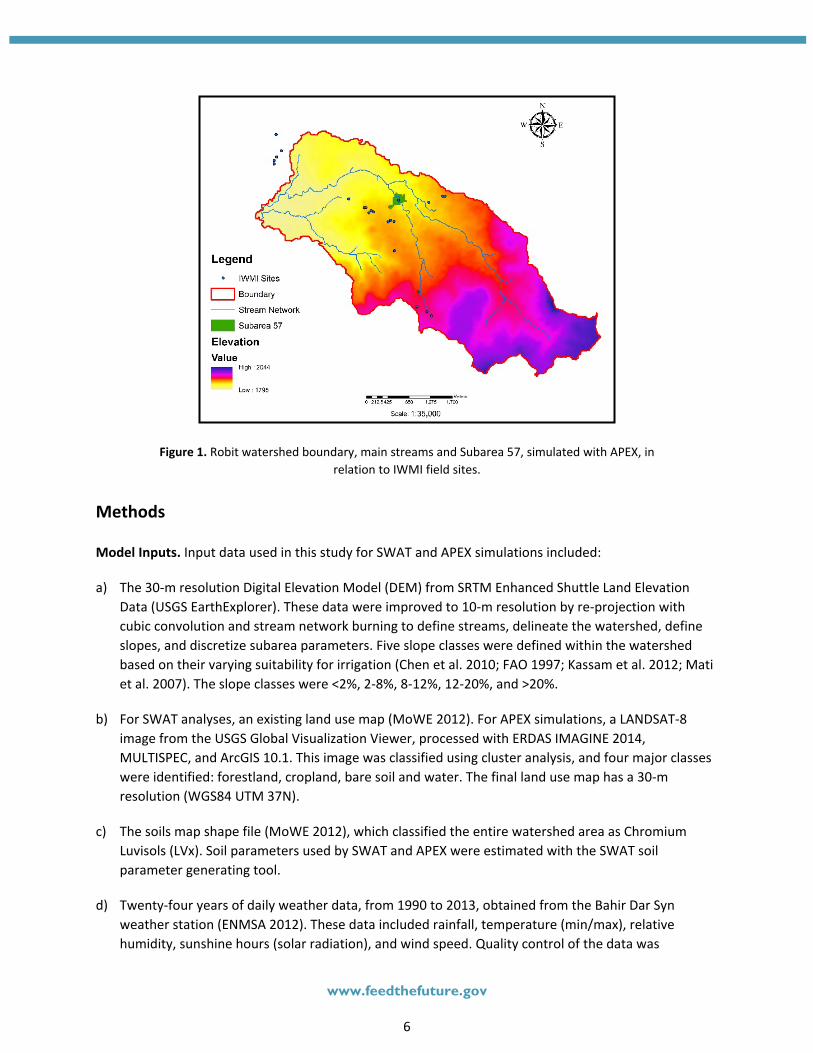
performed to eliminate erroneous values that were beyond historical extreme records. Missing values were estimated using WXGN weather predictor. SWAT and APEX used the same weather dataset. Figure 2 illustrates monthly means and standard errors for the Robit watershed.
Figure 2. Monthly weather data from Bahir Dar Syn station (1990 - 2013) (ENMSA 2012).
Subbasin Delineation. SWAT divided the 1506-ha Robit watershed into 265 subbasins (referred to as subareas in APEX). The watershed discretization generated for SWAT was used to calibrate APEX to gauge streamflow and sediment yield values. The subbasins/subareas were defined with assistance from International Water Management Institute staff. Subbasin/subarea shape and size were identical for the two models, to guarantee that SWAT and APEX streamflow volumes and sediment yields would be comparable.
As a case study, Subarea 57 (equivalent to SWAT’s Subbasin 57) was selected for the simulation with APEX. Subarea 57 is 5.2 ha, characterized as cropland, and entirely composed of LVx clay soil, with a depth of 1.6 m, and a slope of 0.046 m/m. The latitude/longitude of its centroid was: 11.673 by 37.462 degrees, respectively. This area overlaps as well with the sample of households that were used for the farm level and nutritional analysis (FARMSIM).
www.feedthefuture.gov
8
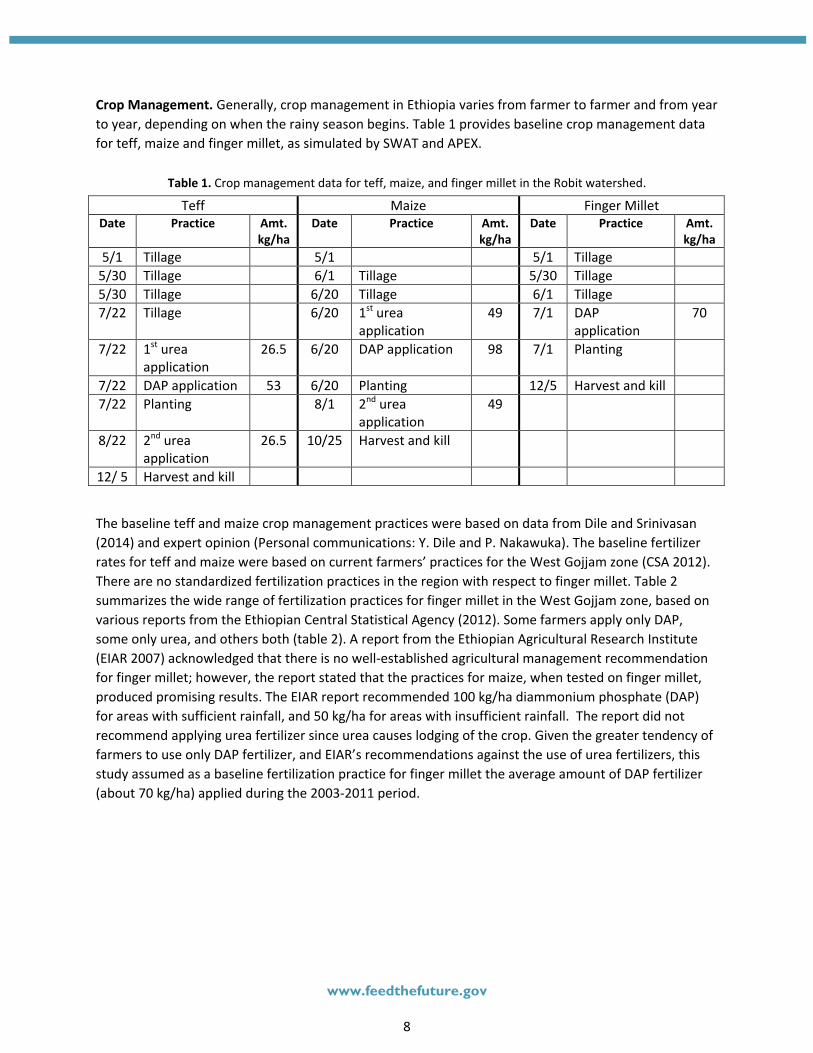
Crop Management. Generally, crop management in Ethiopia varies from farmer to farmer and from year to year, depending on when the rainy season begins. Table 1 provides baseline crop management data for teff, maize and finger millet, as simulated by SWAT and APEX.
Table 1. Crop management data for teff, maize, and finger millet in the Robit watershed.
Teff Maize Finger Millet Date Practice Amt.
kg/ha Date Practice Amt.
kg/ha Date Practice Amt.
kg/ha 5/1 Tillage 5/1 5/1 Tillage
5/30 Tillage 6/1 Tillage 5/30 Tillage 5/30 Tillage 6/20 Tillage 6/1 Tillage 7/22 Tillage 6/20 1st urea
application 49 7/1 DAP
application 70
7/22 1st urea application
26.5 6/20 DAP application 98 7/1 Planting
7/22 DAP application 53 6/20 Planting 12/5 Harvest and kill 7/22 Planting 8/1 2nd urea
application 49
8/22 2nd urea application
26.5 10/25 Harvest and kill
12/ 5 Harvest and kill
The baseline teff and maize crop management practices were based on data from Dile and Srinivasan (2014) and expert opinion (Personal communications: Y. Dile and P. Nakawuka). The baseline fertilizer rates for teff and maize were based on current farmers’ practices for the West Gojjam zone (CSA 2012). There are no standardized fertilization practices in the region with respect to finger millet. Table 2 summarizes the wide range of fertilization practices for finger millet in the West Gojjam zone, based on various reports from the Ethiopian Central Statistical Agency (2012). Some farmers apply only DAP, some only urea, and others both (table 2). A report from the Ethiopian Agricultural Research Institute (EIAR 2007) acknowledged that there is no well-established agricultural management recommendation for finger millet; however, the report stated that the practices for maize, when tested on finger millet, produced promising results. The EIAR report recommended 100 kg/ha diammonium phosphate (DAP) for areas with sufficient rainfall, and 50 kg/ha for areas with insufficient rainfall. The report did not recommend applying urea fertilizer since urea causes lodging of the crop. Given the greater tendency of farmers to use only DAP fertilizer, and EIAR’s recommendations against the use of urea fertilizers, this study assumed as a baseline fertilization practice for finger millet the average amount of DAP fertilizer (about 70 kg/ha) applied during the 2003-2011 period.
www.feedthefuture.gov
9
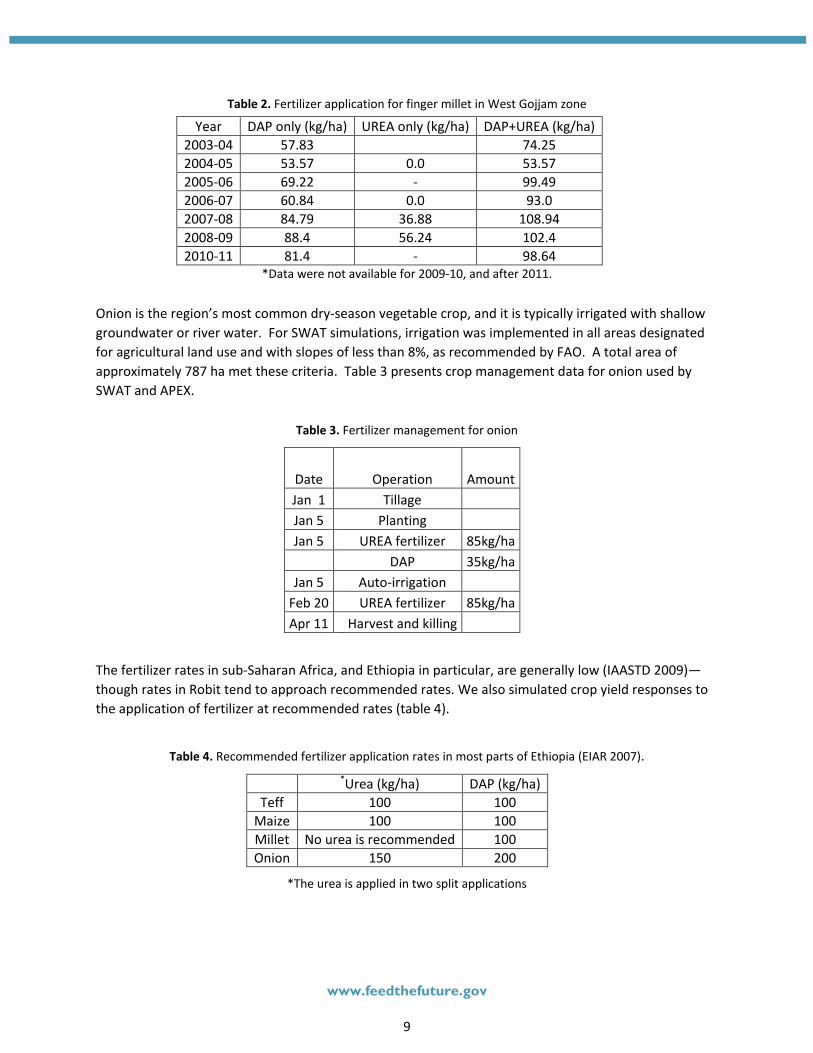
Table 2. Fertilizer application for finger millet in West Gojjam zone
Year DAP only (kg/ha) UREA only (kg/ha) DAP+UREA (kg/ha) 2003-04 57.83 74.25 2004-05 53.57 0.0 53.57 2005-06 69.22 - 99.49 2006-07 60.84 0.0 93.0 2007-08 84.79 36.88 108.94 2008-09 88.4 56.24 102.4 2010-11 81.4 - 98.64
*Data were not available for 2009-10, and after 2011.
Onion is the region’s most common dry-season vegetable crop, and it is typically irrigated with shallow groundwater or river water. For SWAT simulations, irrigation was implemented in all areas designated for agricultural land use and with slopes of less than 8%, as recommended by FAO. A total area of approximately 787 ha met these criteria. Table 3 presents crop management data for onion used by SWAT and APEX.
Table 3. Fertilizer management for onion
Date
Operation Amount Jan 1 Tillage
Jan 5 Planting Jan 5 UREA fertilizer 85kg/ha
DAP 35kg/ha
Jan 5 Auto-irrigation Feb 20 UREA fertilizer 85kg/ha
Apr 11 Harvest and killing
The fertilizer rates in sub-Saharan Africa, and Ethiopia in particular, are generally low (IAASTD 2009)—though rates in Robit tend to approach recommended rates. We also simulated crop yield responses to the application of fertilizer at recommended rates (table 4).
Table 4. Recommended fertilizer application rates in most parts of Ethiopia (EIAR 2007).
*Urea (kg/ha) DAP (kg/ha) Teff 100 100
Maize 100 100 Millet No urea is recommended 100 Onion 150 200
*The urea is applied in two split applications
www.feedthefuture.gov
10
Stream Flow and Crop Yield Calibration. SWAT was calibrated to actual stream flow data gathered from the Gilgel Abay river gauging station and Gumera gauging station (MoWE 2012). APEX field-scale runoff values were calibrated to match SWAT predictions using the automatic calibration tool APEX CUTE. Estimates of historical mean yields of maize, finger millet, and teff were obtained from the 2005 Spatial Production Allocation Model (SPAM) dataset (HarvestChoice 2014) for an area including Robit (table 5). In SPAM, teff is included in the “other cereals” category, but it is by far the most important representative of that group in Robit. Finger millet is included in the “small millet” category along with foxtail millet, kodo millet, little millet, proso millet, and banyard millet, but it is by far the most widely grown small millet in the region (HarvestChoice 2014). Therefore, SPAM yield estimates for “small millet” and “other cereals” were used to calibrate yields of finger millet and teff, respectively. Table 5 gives SPAM grain yields (t/ha, dry weight) for maize, teff and finger millet for the 2005 cycle (HarvestChoice 2014). Statistical analyses could not be performed for calibration of yields since only two SPAM grid cells covered the Robit watershed. Onion yield estimates used in model calibration were acquired from the Ethiopian Central Statistical Agency (2012).
Table 5. SPAM estimates of maize, finger millet, and teff yields for two grid cells associated with the Robit watershed.
Region Cell ID Maize Millet Teff Robit 4059089 3.14 t/ha 2.56 t/ha .88 t/ha Robit 4063409 3.17 t/ha 2.50 t/ha .89 t/ha
Economic Analyses. FARMSIM was used to provide ex-ante economic analyses of several promising small-scale irrigation technologies identified by SWAT and APEX simulations. These included: (1) the increased cultivation of an irrigated, dry-season, double crop of onions; (2) the evaluation of five alternate water-lifting technologies; and (3) implementation of deep tillage practices to eliminate hardpan soils. In all scenarios other than the baseline scenario, fertilizer was applied at rates recommended by the Ethiopian government.
The combination of two alternate tillage scenarios (current versus deep tillage) and five alternate water-lifting technologies produced ten alternatives in addition to the baseline scenario, each defined as follows:
Baseline: no irrigation + current fertilizer + current tillage
Alt.1: pulley-and-bucket irrigation + recommended fertilizers + current tillage
Alt.2: pulley–and-bucket irrigation + recommended fertilizers + deep tillage
Alt.3: hand-operated rope-and-washer pump irrigation + recommended fertilizers + current tillage
Alt.4: hand-operated rope-and-washer pump irrigation + recommended fertilizers + deep tillage
Alt.5: animal-powered rope-and-washer pump irrigation + recommended fertilizers + current tillage
Alt.6: animal-powered rope-and-washer pump irrigation + recommended fertilizers + deep tillage
Alt.7: gasoline motor rope-and-washer pump irrigation + recommended fertilizers + current tillage
Alt.8: gasoline motor rope-and-washer pump irrigation + recommended fertilizers + deep tillage
Alt.9: solar-powered rope-and-washer pump irrigation + recommended fertilizers + current tillage
Alt.10: solar-powered rope-and-washer pump irrigation + recommended fertilizers + deep tillage
www.feedthefuture.gov
11
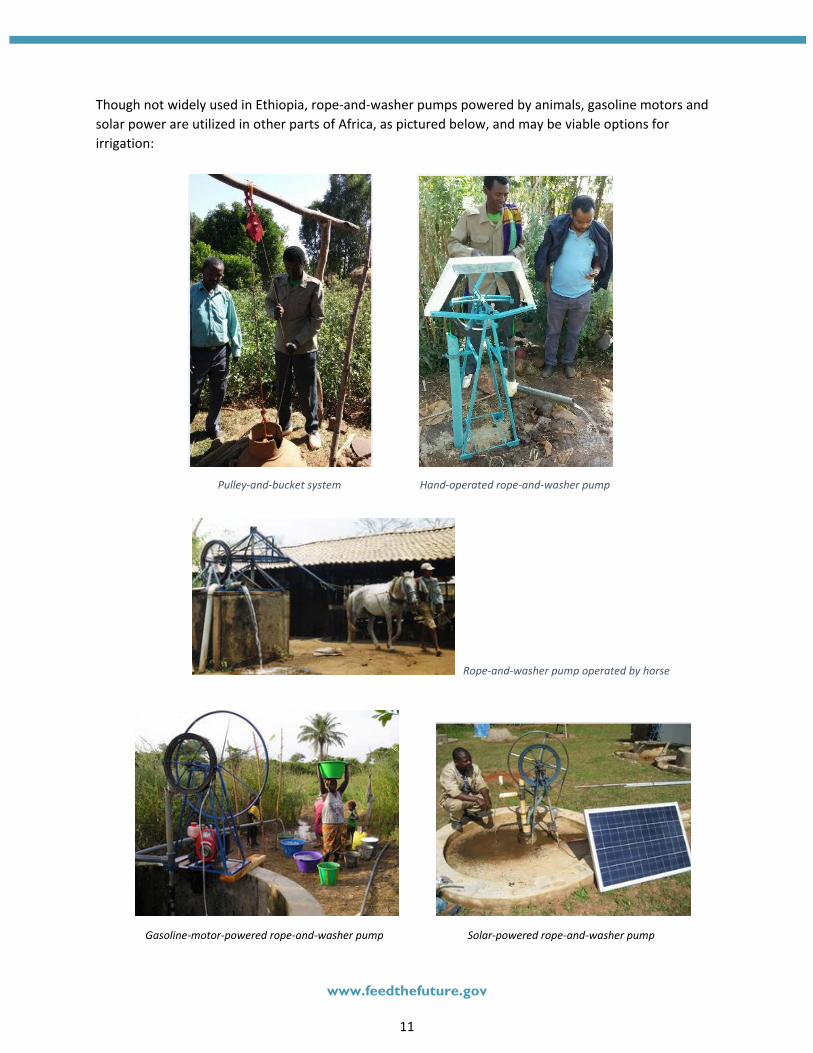
Though not widely used in Ethiopia, rope-and-washer pumps powered by animals, gasoline motors and solar power are utilized in other parts of Africa, as pictured below, and may be viable options for irrigation:
Pulley-and-bucket system Hand-operated rope-and-washer pump
Rope-and-washer pump operated by horse
Gasoline-motor-powered rope-and-washer pump Solar-powered rope-and-washer pump
www.feedthefuture.gov
12
For the sake of brevity, we will hereinafter refer to hand-operated rope-and-washer pumps, animal-powered rope-and-washer pumps, gasoline motor-powered rope-and-washer pumps, and solar-powered rope-and-washer pumps as “hand-operated pumps”, “animal-powered pumps”, “motor pumps” and “solar pumps”, respectively.
In comparing the five irrigation technologies, we estimated the costs of employing each technology, as well as the amount of land that could be irrigated by each without water stress to the crops. Estimates were based on the costs (operating and capital) of each technology and the capacity of each (as determined by its pumping rate) to irrigate available land. Our analysis assumed the following:
1) Number of active family members (adults) required to carry out the irrigation: 2 2) Number of irrigation hours per family member per irrigation day: 4 3) Number of irrigation days per season, assuming 2 days per week of irrigation during a period
of 3.5 months (January through mid-April): 28 4) Total number of hours of irrigation per season: 2*4*28 = 224 hours 5) Pumping rates for the different water-lifting technologies:
• Pulley and bucket: 8 L/min • Hand-operated pump1: 20 L/min • Animal-powered pump2: 60 L/min • Motor pump3: 170 L/min • Solar pump4: 24 L/min
Crop yields were simulated by APEX for different levels of water stress. The irrigator’s equation was used to estimate the total amount of water that can be delivered by a water lifting technology:
Irrigator’s equation: Q*t = d*A Q: flow or pumping rate (L/min) T: time for irrigation (min) d: depth of irrigation water applied (mm) A: area covered (m2 or ha)
Based on the total amount of water required to irrigate a crop for the entire dry season, and the total amount of water per hectare delivered by each water-lifting technology (based on pumping rate and irrigation hours), we computed the fraction of water supply provided by each technology. Given the total irrigable land available for an irrigated onion crop and its water requirements, we used the amount of water that could be supplied by each technology to compute the fraction of cropland that could be irrigated with minimal water stress for each water-lifting technology. In contrast to the gasoline motor pump, which can meet irrigation water requirements for the onion crop (with no water stress) for the maximum irrigable land, the pulley irrigation system covers only 8% of maximum irrigable land while the hand-operated rope pump covers just 20%. The rope pump operated by animal and solar power cover 60% and 24 %, respectively, of the maximum irrigable land.
1 Nederstigt and Van del Wal 2011/ PRACTICA Foundation 2 http://www.ropepumps.org/horse.html/ PRACTICA Foundation 3 IWMI field studies conducted in 2015 on behalf of ILSSI project 4 Mzuzu University in Malawi: http://old.solar-aid.org/project_water_pump/
www.feedthefuture.gov
13
Other simulation assumptions
To show the full potential of adopting new technologies, we assumed that the alternative farming technologies (alternative scenarios) simulated in this study were adopted at 100% by farmers. Also, the markets were assumed to be accessible and function at a competitive level with no distortion where the supply and demand determine the market prices. However, in the five-year economic forecast, market selling price in each of the five years was assumed to equal the average selling price of year 1 for each crop sold.
The FARMSIM model was run 500 times for each of the eleven scenarios—the baseline scenario and ten alternative scenarios—to sample variation in crop yields due to weather and other stochastic variables. To determine which of the eleven scenarios would be most beneficial to farm families, three types of economic indicators were calculated: Net Present Value (NPV), Net Cash Farm Income (NCFI), and Ending Cash (EC) Reserves. The performance of the eleven scenarios as estimated by each of the three indicators was displayed graphically as a cumulative distribution function (CDF) and as a “stoplight graph.”
Results and Discussion.
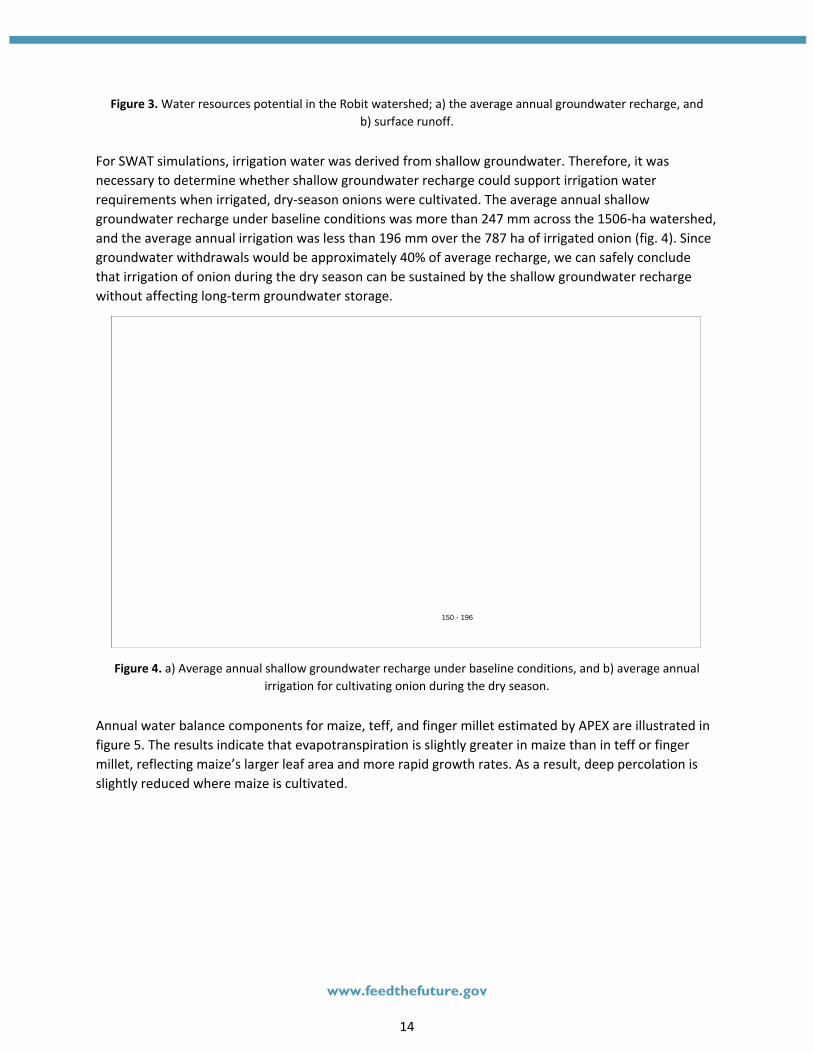
Hydrology. Our results indicated that there is large potential for additional small-scale irrigation in the Robit watershed. The average annual groundwater recharge simulated by SWAT was 260-334 mm (fig. 3), and the annual generated surface runoff was estimated to be 441-533 mm. For the Robit watershed, with a catchment area of 1506 ha, the average annual volumetric groundwater recharge and surface runoff potentials are over 4 million m3 and 7 million m3, respectively. These results are consistent with the observation that shallow groundwater wells are often used in the Robit watershed to irrigate vegetable crops.
Groundwater recharge (mm)260 - 275
275 - 290
290 - 334
Surface runoff (mm)441 - 500
500 - 525
525 - 533
Ü Ü
0 1.5 30.75 KM 0 1.5 30.75 KM
a) b)
www.feedthefuture.gov
14
Figure 3. Water resources potential in the Robit watershed; a) the average annual groundwater recharge, and b) surface runoff.
For SWAT simulations, irrigation water was derived from shallow groundwater. Therefore, it was necessary to determine whether shallow groundwater recharge could support irrigation water requirements when irrigated, dry-season onions were cultivated. The average annual shallow groundwater recharge under baseline conditions was more than 247 mm across the 1506-ha watershed, and the average annual irrigation was less than 196 mm over the 787 ha of irrigated onion (fig. 4). Since groundwater withdrawals would be approximately 40% of average recharge, we can safely conclude that irrigation of onion during the dry season can be sustained by the shallow groundwater recharge without affecting long-term groundwater storage.
Figure 4. a) Average annual shallow groundwater recharge under baseline conditions, and b) average annual
irrigation for cultivating onion during the dry season.
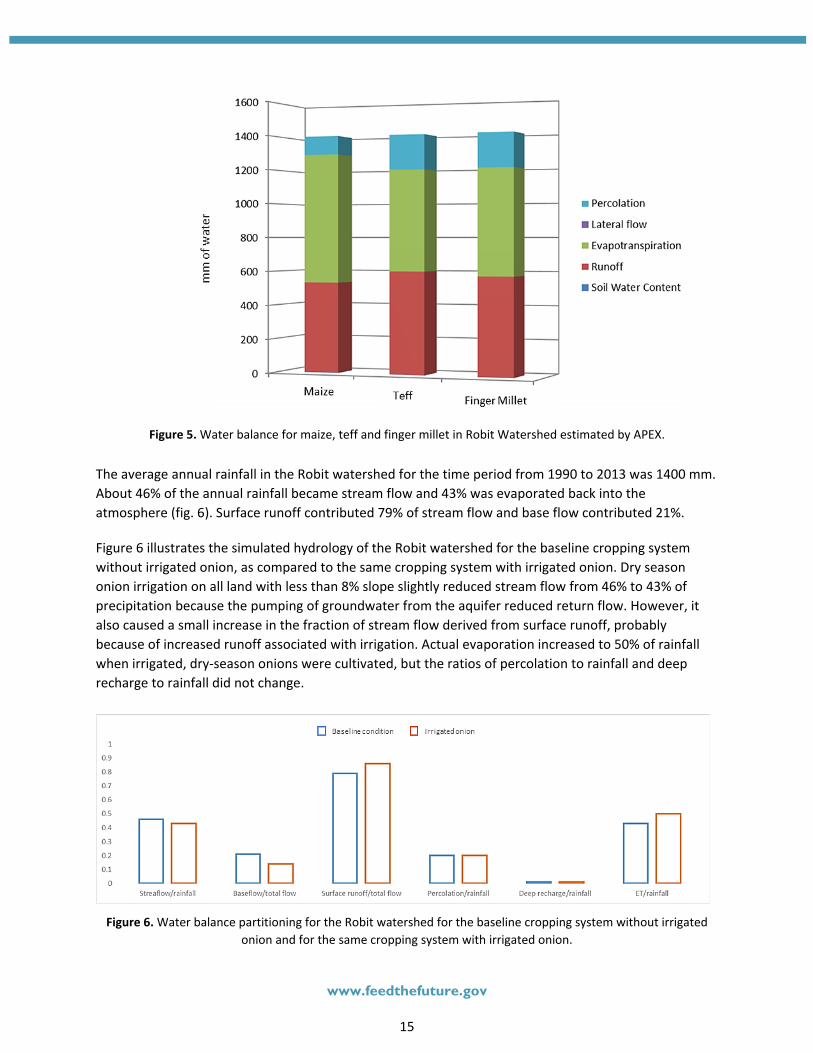
Annual water balance components for maize, teff, and finger millet estimated by APEX are illustrated in figure 5. The results indicate that evapotranspiration is slightly greater in maize than in teff or finger millet, reflecting maize’s larger leaf area and more rapid growth rates. As a result, deep percolation is slightly reduced where maize is cultivated.
0 1.5 30.75 KM
Ü
Shallow groundwater recharge247 - 270270 - 295295 - 317 0 1.5 30.75 KM
Ü a) b)
Irrigation (mm)0 - 7575 - 150150 - 196
www.feedthefuture.gov
15
Figure 5. Water balance for maize, teff and finger millet in Robit Watershed estimated by APEX.
The average annual rainfall in the Robit watershed for the time period from 1990 to 2013 was 1400 mm. About 46% of the annual rainfall became stream flow and 43% was evaporated back into the atmosphere (fig. 6). Surface runoff contributed 79% of stream flow and base flow contributed 21%.
Figure 6 illustrates the simulated hydrology of the Robit watershed for the baseline cropping system without irrigated onion, as compared to the same cropping system with irrigated onion. Dry season onion irrigation on all land with less than 8% slope slightly reduced stream flow from 46% to 43% of precipitation because the pumping of groundwater from the aquifer reduced return flow. However, it also caused a small increase in the fraction of stream flow derived from surface runoff, probably because of increased runoff associated with irrigation. Actual evaporation increased to 50% of rainfall when irrigated, dry-season onions were cultivated, but the ratios of percolation to rainfall and deep recharge to rainfall did not change.
Figure 6. Water balance partitioning for the Robit watershed for the baseline cropping system without irrigated
onion and for the same cropping system with irrigated onion.
www.feedthefuture.gov
16
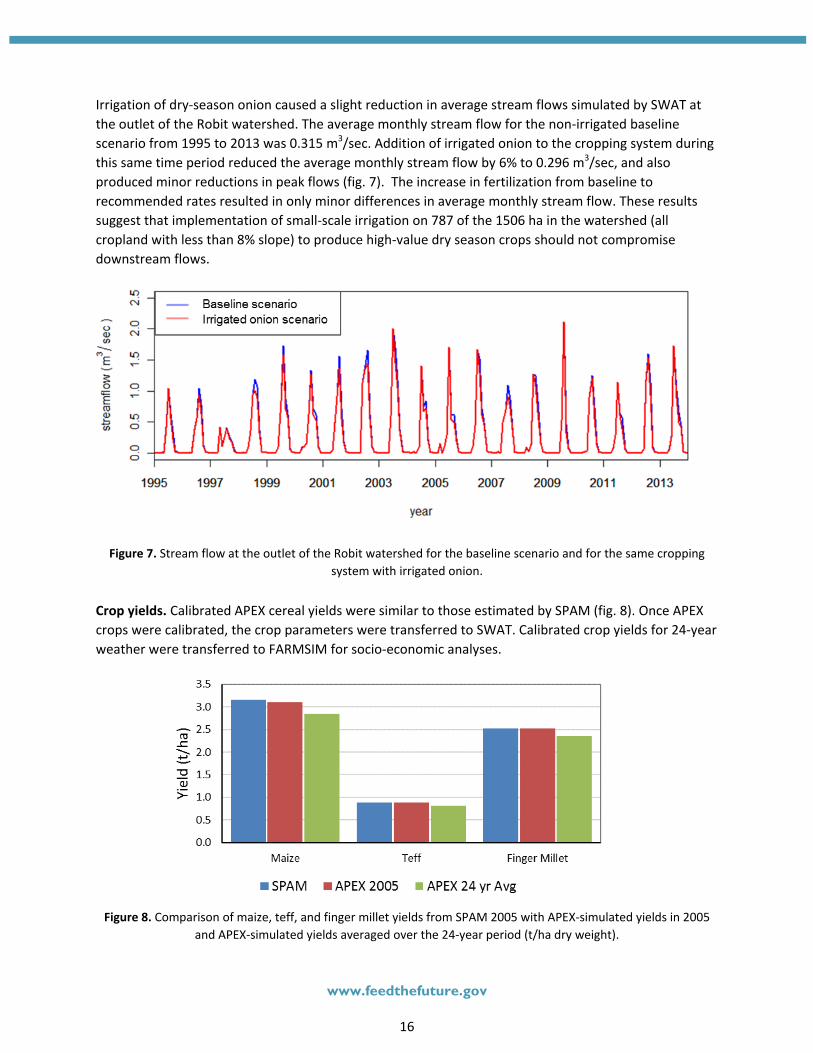
Irrigation of dry-season onion caused a slight reduction in average stream flows simulated by SWAT at the outlet of the Robit watershed. The average monthly stream flow for the non-irrigated baseline scenario from 1995 to 2013 was 0.315 m3/sec. Addition of irrigated onion to the cropping system during this same time period reduced the average monthly stream flow by 6% to 0.296 m3/sec, and also produced minor reductions in peak flows (fig. 7). The increase in fertilization from baseline to recommended rates resulted in only minor differences in average monthly stream flow. These results suggest that implementation of small-scale irrigation on 787 of the 1506 ha in the watershed (all cropland with less than 8% slope) to produce high-value dry season crops should not compromise downstream flows.
Figure 7. Stream flow at the outlet of the Robit watershed for the baseline scenario and for the same cropping system with irrigated onion.
Crop yields. Calibrated APEX cereal yields were similar to those estimated by SPAM (fig. 8). Once APEX crops were calibrated, the crop parameters were transferred to SWAT. Calibrated crop yields for 24-year weather were transferred to FARMSIM for socio-economic analyses.
Figure 8. Comparison of maize, teff, and finger millet yields from SPAM 2005 with APEX-simulated yields in 2005
and APEX-simulated yields averaged over the 24-year period (t/ha dry weight).
www.feedthefuture.gov
17
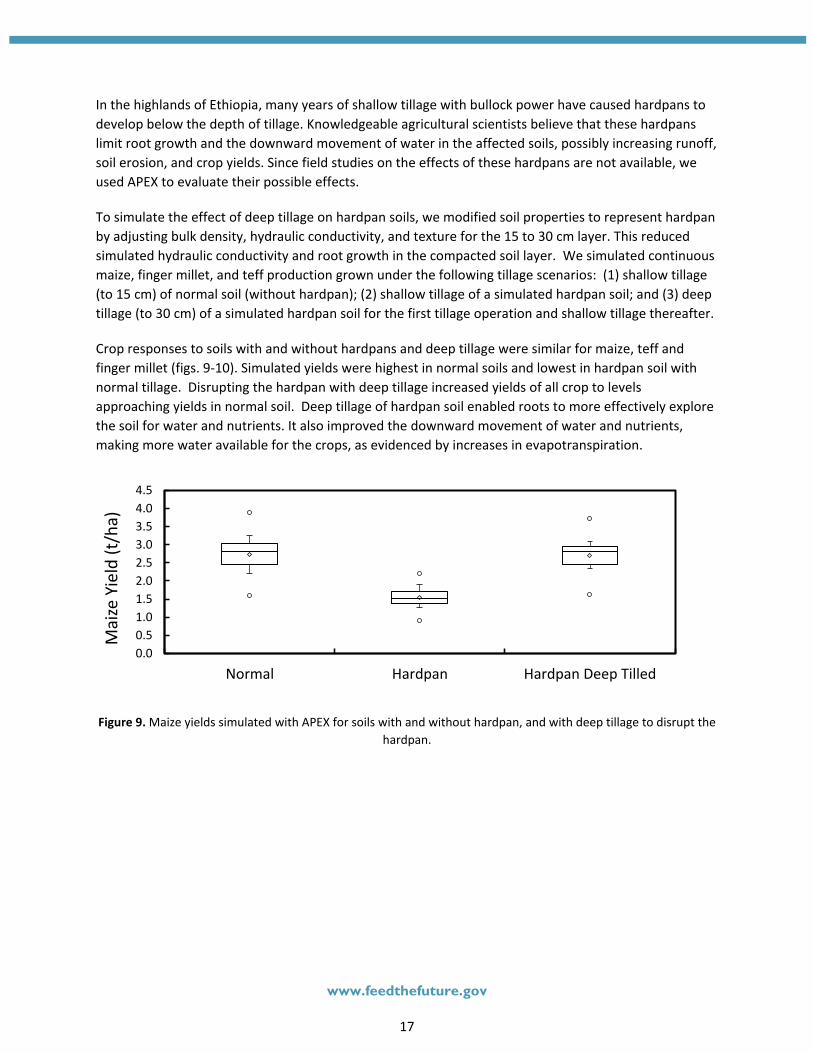
In the highlands of Ethiopia, many years of shallow tillage with bullock power have caused hardpans to develop below the depth of tillage. Knowledgeable agricultural scientists believe that these hardpans limit root growth and the downward movement of water in the affected soils, possibly increasing runoff, soil erosion, and crop yields. Since field studies on the effects of these hardpans are not available, we used APEX to evaluate their possible effects.
To simulate the effect of deep tillage on hardpan soils, we modified soil properties to represent hardpan by adjusting bulk density, hydraulic conductivity, and texture for the 15 to 30 cm layer. This reduced simulated hydraulic conductivity and root growth in the compacted soil layer. We simulated continuous maize, finger millet, and teff production grown under the following tillage scenarios: (1) shallow tillage (to 15 cm) of normal soil (without hardpan); (2) shallow tillage of a simulated hardpan soil; and (3) deep tillage (to 30 cm) of a simulated hardpan soil for the first tillage operation and shallow tillage thereafter.
Crop responses to soils with and without hardpans and deep tillage were similar for maize, teff and finger millet (figs. 9-10). Simulated yields were highest in normal soils and lowest in hardpan soil with normal tillage. Disrupting the hardpan with deep tillage increased yields of all crop to levels approaching yields in normal soil. Deep tillage of hardpan soil enabled roots to more effectively explore the soil for water and nutrients. It also improved the downward movement of water and nutrients, making more water available for the crops, as evidenced by increases in evapotranspiration.
Figure 9. Maize yields simulated with APEX for soils with and without hardpan, and with deep tillage to disrupt the hardpan.
0.00.51.01.52.02.53.03.54.04.5
Normal Hardpan Hardpan Deep Tilled
Mai
ze Y
ield
(t/h
a)
www.feedthefuture.gov
18
Figure 10. Teff yields simulated with APEX for soils with and without hardpan, and with deep tillage to disrupt the hardpan.
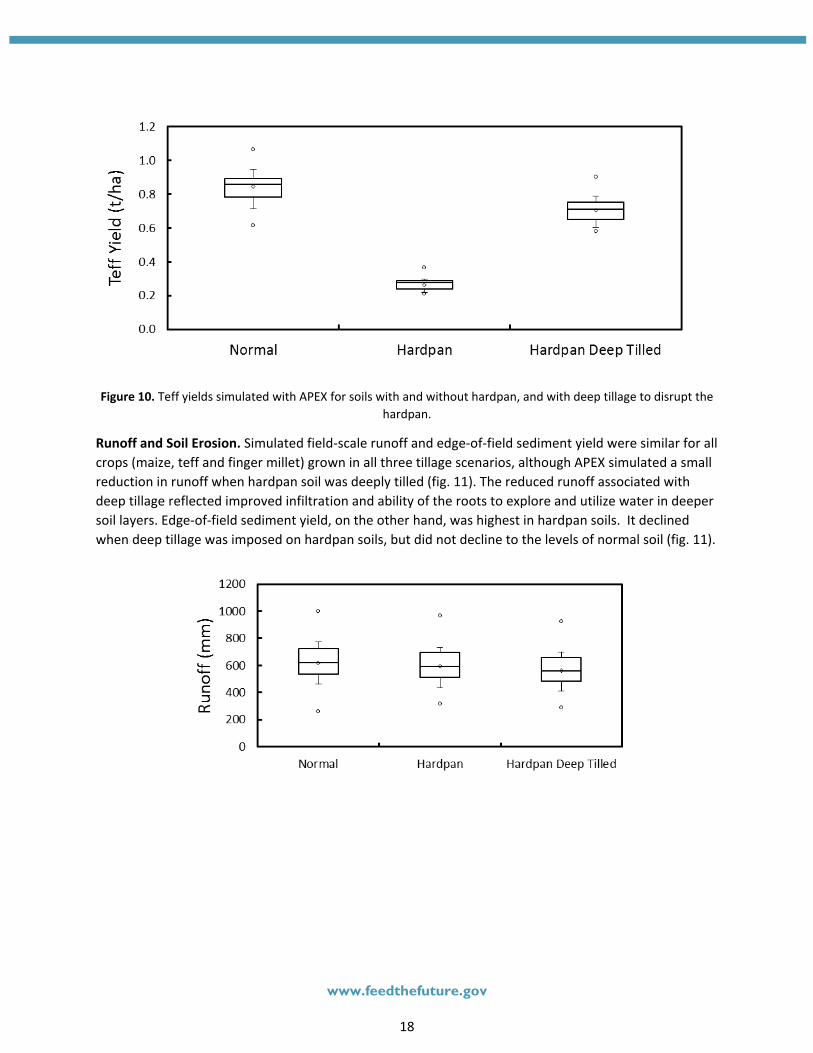
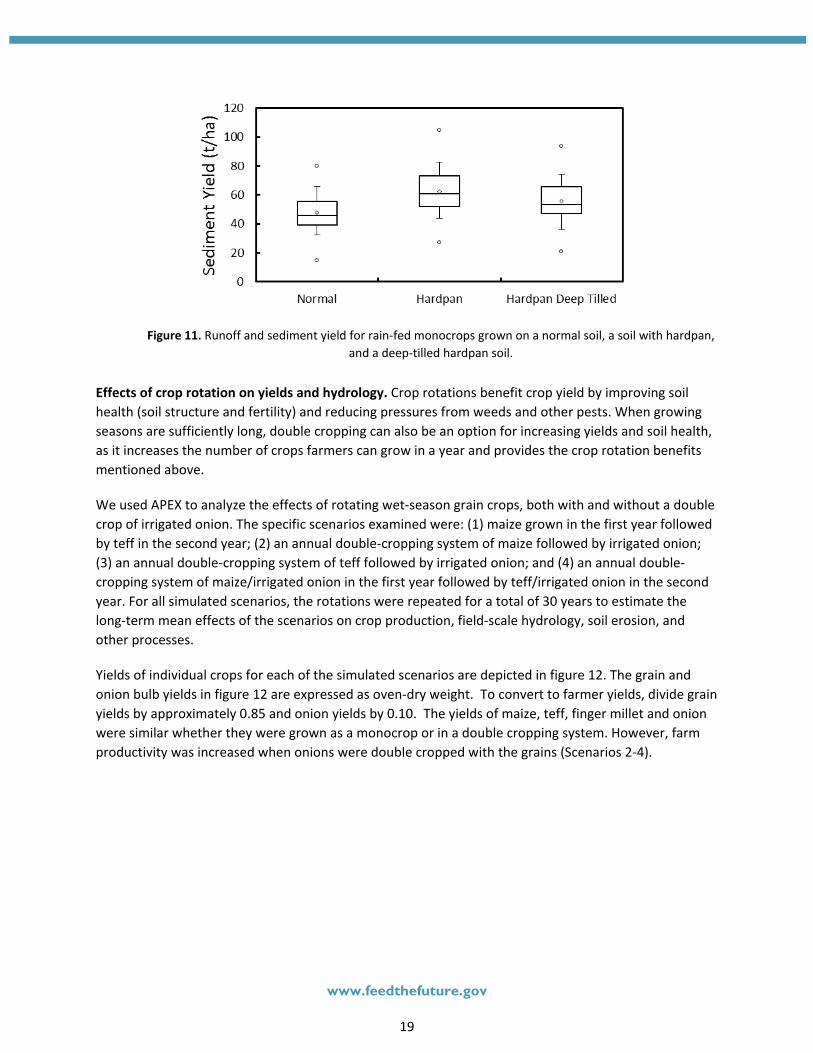
Runoff and Soil Erosion. Simulated field-scale runoff and edge-of-field sediment yield were similar for all crops (maize, teff and finger millet) grown in all three tillage scenarios, although APEX simulated a small reduction in runoff when hardpan soil was deeply tilled (fig. 11). The reduced runoff associated with deep tillage reflected improved infiltration and ability of the roots to explore and utilize water in deeper soil layers. Edge-of-field sediment yield, on the other hand, was highest in hardpan soils. It declined when deep tillage was imposed on hardpan soils, but did not decline to the levels of normal soil (fig. 11).
www.feedthefuture.gov
19
Figure 11. Runoff and sediment yield for rain-fed monocrops grown on a normal soil, a soil with hardpan, and a deep-tilled hardpan soil.
Effects of crop rotation on yields and hydrology. Crop rotations benefit crop yield by improving soil health (soil structure and fertility) and reducing pressures from weeds and other pests. When growing seasons are sufficiently long, double cropping can also be an option for increasing yields and soil health, as it increases the number of crops farmers can grow in a year and provides the crop rotation benefits mentioned above.
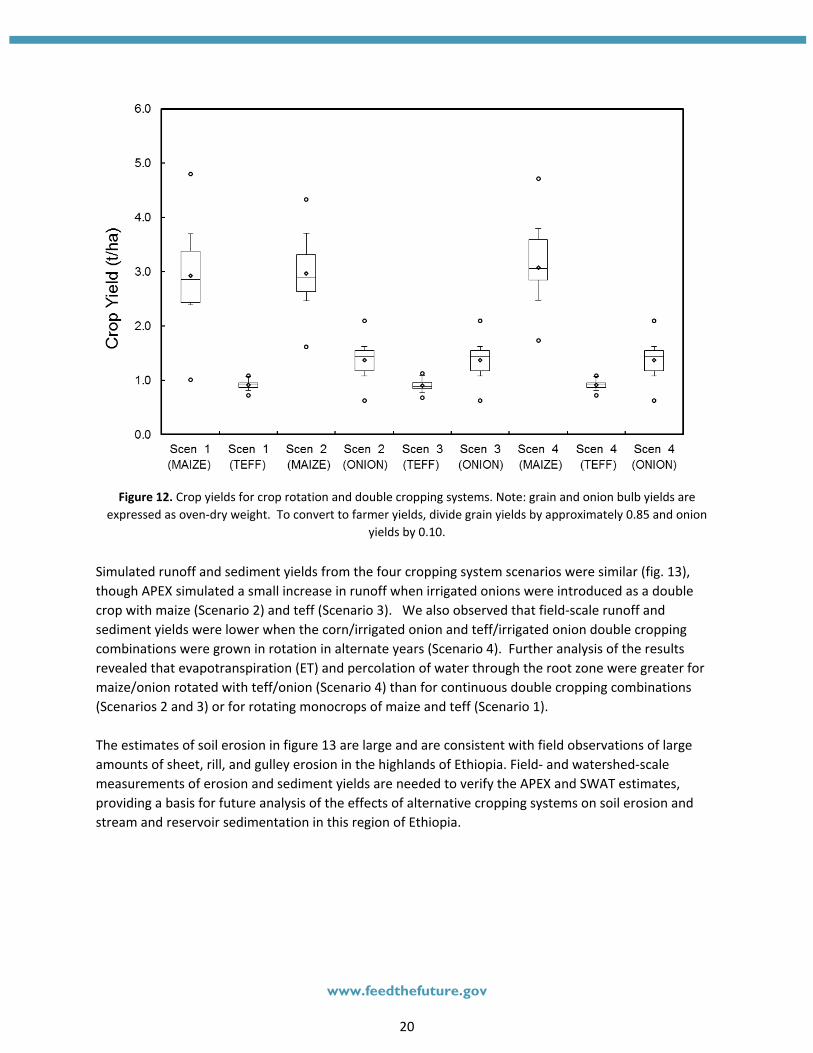
We used APEX to analyze the effects of rotating wet-season grain crops, both with and without a double crop of irrigated onion. The specific scenarios examined were: (1) maize grown in the first year followed by teff in the second year; (2) an annual double-cropping system of maize followed by irrigated onion; (3) an annual double-cropping system of teff followed by irrigated onion; and (4) an annual double-cropping system of maize/irrigated onion in the first year followed by teff/irrigated onion in the second year. For all simulated scenarios, the rotations were repeated for a total of 30 years to estimate the long-term mean effects of the scenarios on crop production, field-scale hydrology, soil erosion, and other processes.
Yields of individual crops for each of the simulated scenarios are depicted in figure 12. The grain and onion bulb yields in figure 12 are expressed as oven-dry weight. To convert to farmer yields, divide grain yields by approximately 0.85 and onion yields by 0.10. The yields of maize, teff, finger millet and onion were similar whether they were grown as a monocrop or in a double cropping system. However, farm productivity was increased when onions were double cropped with the grains (Scenarios 2-4).
www.feedthefuture.gov
20
Figure 12. Crop yields for crop rotation and double cropping systems. Note: grain and onion bulb yields are
expressed as oven-dry weight. To convert to farmer yields, divide grain yields by approximately 0.85 and onion yields by 0.10.
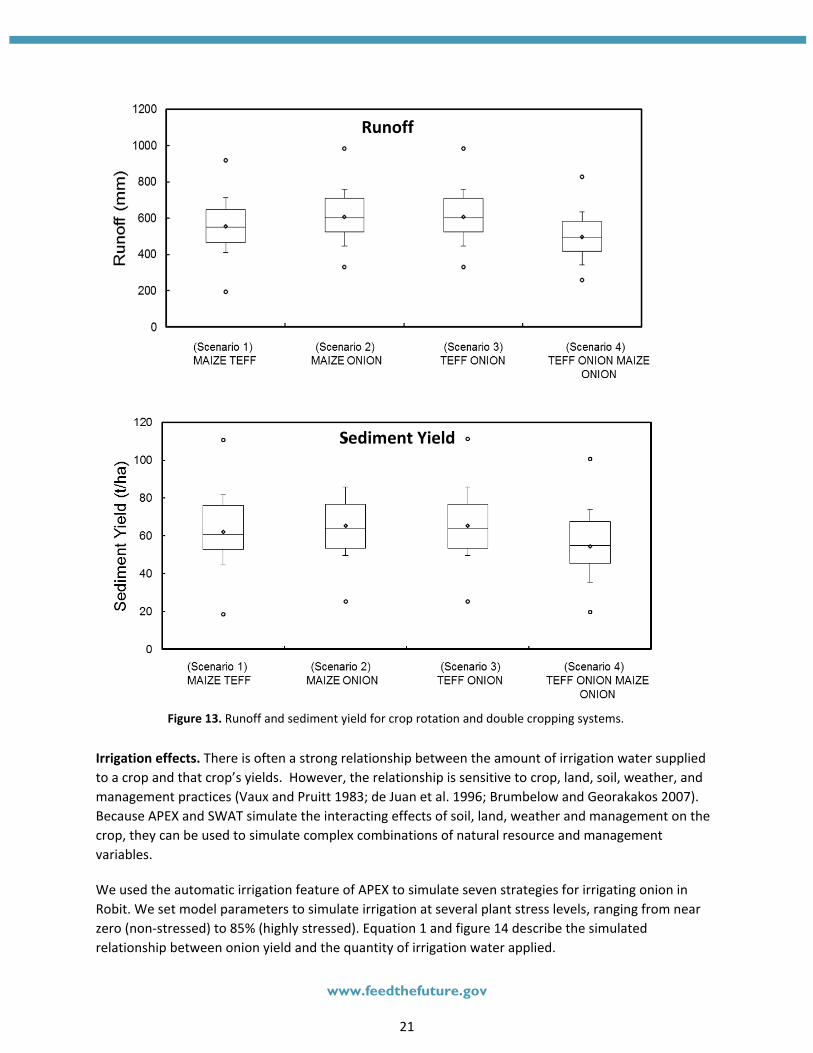
Simulated runoff and sediment yields from the four cropping system scenarios were similar (fig. 13), though APEX simulated a small increase in runoff when irrigated onions were introduced as a double crop with maize (Scenario 2) and teff (Scenario 3). We also observed that field-scale runoff and sediment yields were lower when the corn/irrigated onion and teff/irrigated onion double cropping combinations were grown in rotation in alternate years (Scenario 4). Further analysis of the results revealed that evapotranspiration (ET) and percolation of water through the root zone were greater for maize/onion rotated with teff/onion (Scenario 4) than for continuous double cropping combinations (Scenarios 2 and 3) or for rotating monocrops of maize and teff (Scenario 1). The estimates of soil erosion in figure 13 are large and are consistent with field observations of large amounts of sheet, rill, and gulley erosion in the highlands of Ethiopia. Field- and watershed-scale measurements of erosion and sediment yields are needed to verify the APEX and SWAT estimates, providing a basis for future analysis of the effects of alternative cropping systems on soil erosion and stream and reservoir sedimentation in this region of Ethiopia.
www.feedthefuture.gov
21
Figure 13. Runoff and sediment yield for crop rotation and double cropping systems.
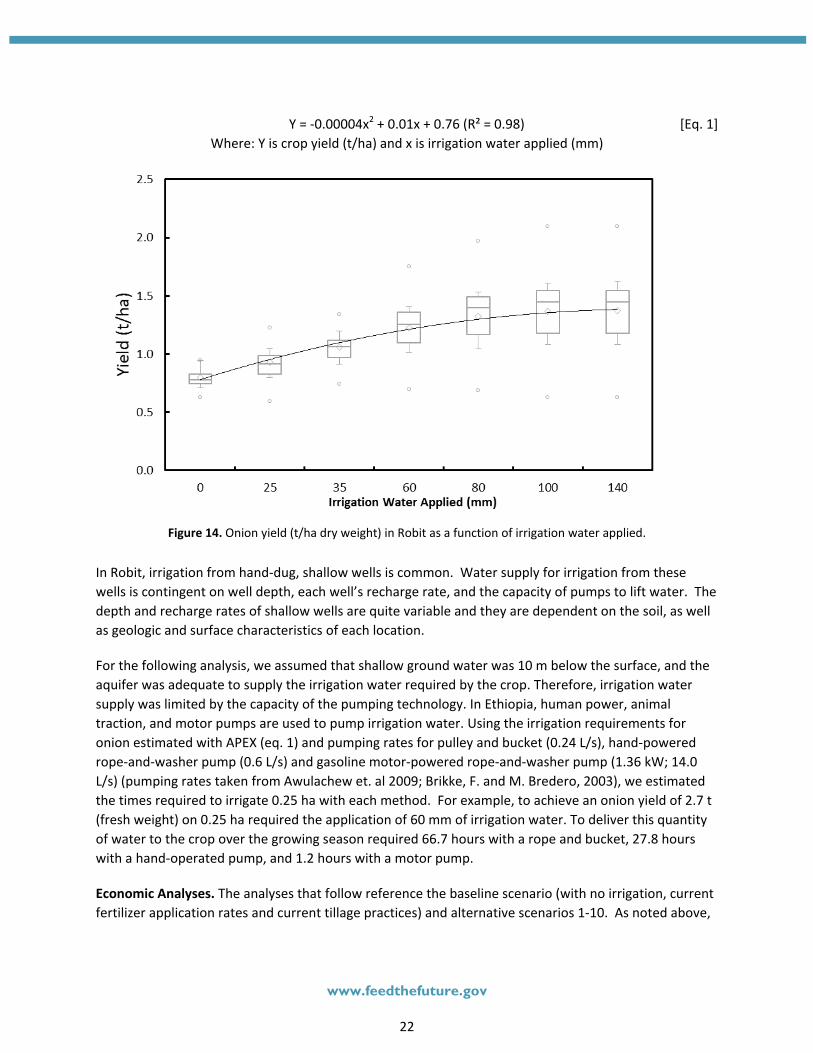
Irrigation effects. There is often a strong relationship between the amount of irrigation water supplied to a crop and that crop’s yields. However, the relationship is sensitive to crop, land, soil, weather, and management practices (Vaux and Pruitt 1983; de Juan et al. 1996; Brumbelow and Georakakos 2007). Because APEX and SWAT simulate the interacting effects of soil, land, weather and management on the crop, they can be used to simulate complex combinations of natural resource and management variables.
We used the automatic irrigation feature of APEX to simulate seven strategies for irrigating onion in Robit. We set model parameters to simulate irrigation at several plant stress levels, ranging from near zero (non-stressed) to 85% (highly stressed). Equation 1 and figure 14 describe the simulated relationship between onion yield and the quantity of irrigation water applied.
Runoff
Sediment Yield
www.feedthefuture.gov
22
Y = -0.00004x2 + 0.01x + 0.76 (R² = 0.98) [Eq. 1]
Where: Y is crop yield (t/ha) and x is irrigation water applied (mm)
Figure 14. Onion yield (t/ha dry weight) in Robit as a function of irrigation water applied.
In Robit, irrigation from hand-dug, shallow wells is common. Water supply for irrigation from these wells is contingent on well depth, each well’s recharge rate, and the capacity of pumps to lift water. The depth and recharge rates of shallow wells are quite variable and they are dependent on the soil, as well as geologic and surface characteristics of each location.
For the following analysis, we assumed that shallow ground water was 10 m below the surface, and the aquifer was adequate to supply the irrigation water required by the crop. Therefore, irrigation water supply was limited by the capacity of the pumping technology. In Ethiopia, human power, animal traction, and motor pumps are used to pump irrigation water. Using the irrigation requirements for onion estimated with APEX (eq. 1) and pumping rates for pulley and bucket (0.24 L/s), hand-powered rope-and-washer pump (0.6 L/s) and gasoline motor-powered rope-and-washer pump (1.36 kW; 14.0 L/s) (pumping rates taken from Awulachew et. al 2009; Brikke, F. and M. Bredero, 2003), we estimated the times required to irrigate 0.25 ha with each method. For example, to achieve an onion yield of 2.7 t (fresh weight) on 0.25 ha required the application of 60 mm of irrigation water. To deliver this quantity of water to the crop over the growing season required 66.7 hours with a rope and bucket, 27.8 hours with a hand-operated pump, and 1.2 hours with a motor pump.
Economic Analyses. The analyses that follow reference the baseline scenario (with no irrigation, current fertilizer application rates and current tillage practices) and alternative scenarios 1-10. As noted above,
www.feedthefuture.gov
23
recommended fertilizers were applied in each of the alternative scenarios, as well as the following irrigation technologies and tillage practices:
Alt.1: pulley-and-bucket + current tillage
Alt.2: pulley–and-bucket + deep tillage
Alt.3: hand-operated pump + current tillage
Alt.4: hand-operated pump + deep tillage
Alt.5: animal-powered pump + current tillage
Alt.6: animal-powered pump + deep tillage
Alt.7: motor pump + current tillage
Alt.8: motor pump + deep tillage
Alt.9: solar pump + current tillage
Alt.10: solar pump + deep tillage
www.feedthefuture.gov
24
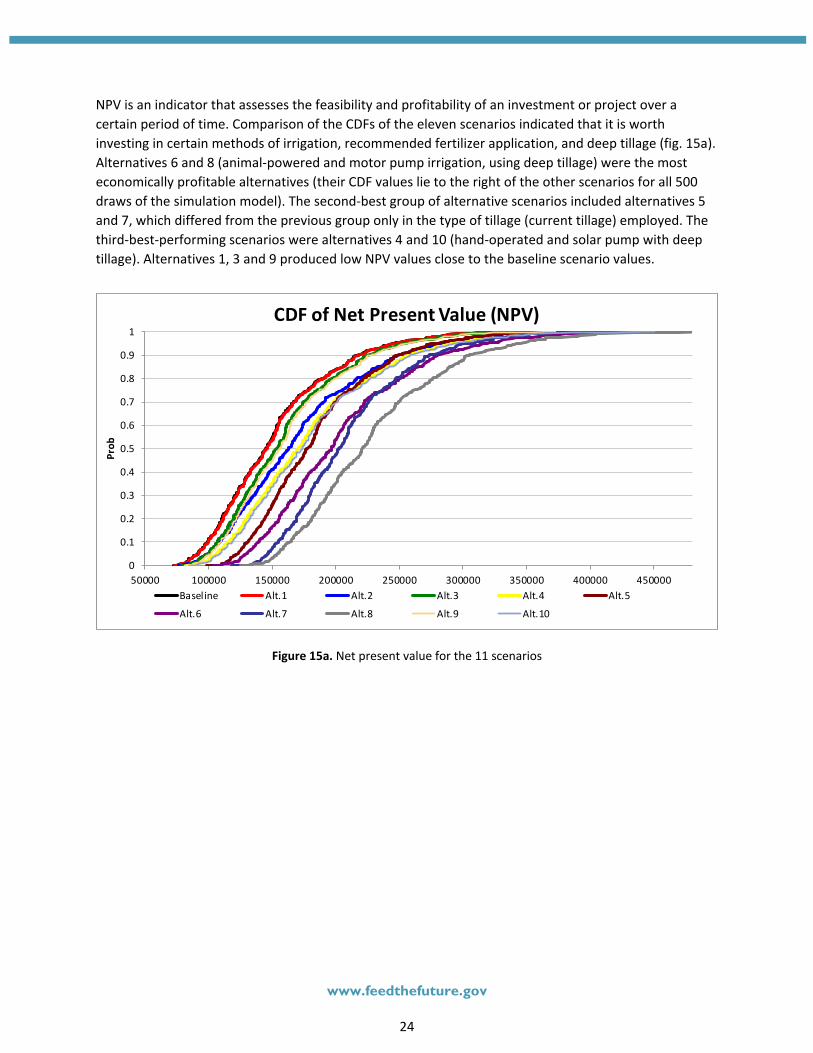
NPV is an indicator that assesses the feasibility and profitability of an investment or project over a certain period of time. Comparison of the CDFs of the eleven scenarios indicated that it is worth investing in certain methods of irrigation, recommended fertilizer application, and deep tillage (fig. 15a). Alternatives 6 and 8 (animal-powered and motor pump irrigation, using deep tillage) were the most economically profitable alternatives (their CDF values lie to the right of the other scenarios for all 500 draws of the simulation model). The second-best group of alternative scenarios included alternatives 5 and 7, which differed from the previous group only in the type of tillage (current tillage) employed. The third-best-performing scenarios were alternatives 4 and 10 (hand-operated and solar pump with deep tillage). Alternatives 1, 3 and 9 produced low NPV values close to the baseline scenario values.
Figure 15a. Net present value for the 11 scenarios
0
0.1
0.2
0.3
0.4
0.5
0.6
0.7
0.8
0.9
1
50000 100000 150000 200000 250000 300000 350000 400000 450000
Prob
CDF of Net Present Value (NPV)
Baseline Alt.1 Alt.2 Alt.3 Alt.4 Alt.5
Alt.6 Alt.7 Alt.8 Alt.9 Alt.10
www.feedthefuture.gov
25
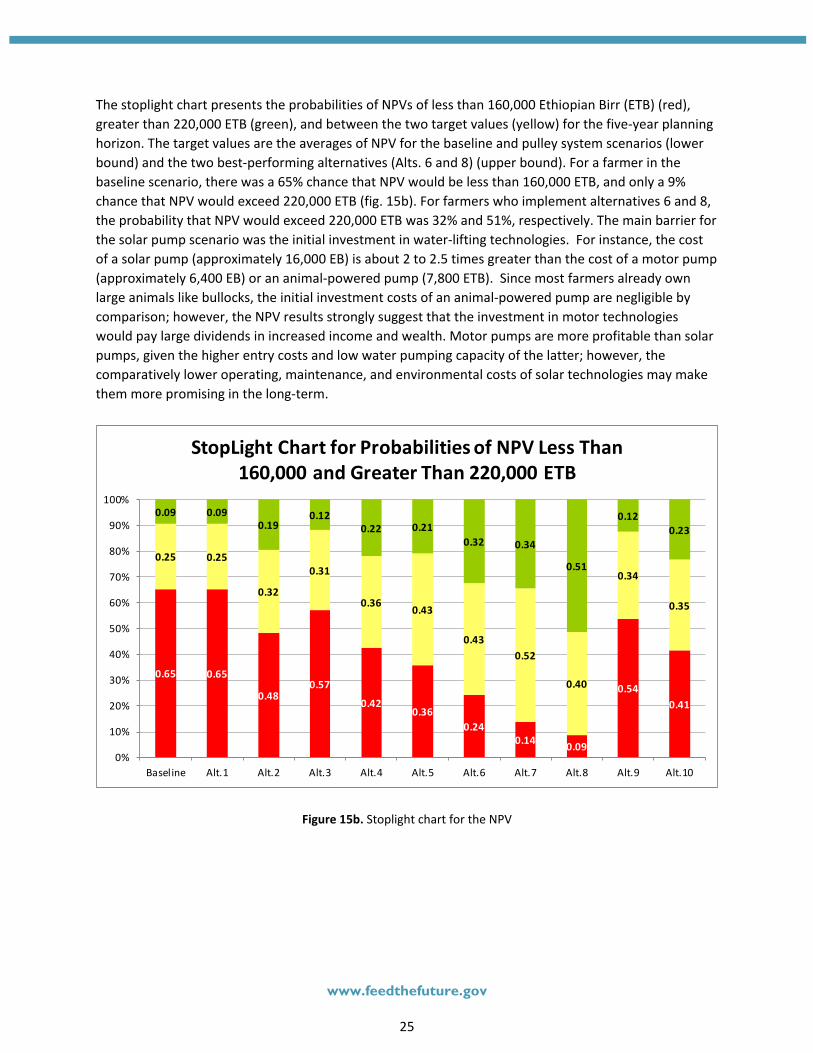
The stoplight chart presents the probabilities of NPVs of less than 160,000 Ethiopian Birr (ETB) (red), greater than 220,000 ETB (green), and between the two target values (yellow) for the five-year planning horizon. The target values are the averages of NPV for the baseline and pulley system scenarios (lower bound) and the two best-performing alternatives (Alts. 6 and 8) (upper bound). For a farmer in the baseline scenario, there was a 65% chance that NPV would be less than 160,000 ETB, and only a 9% chance that NPV would exceed 220,000 ETB (fig. 15b). For farmers who implement alternatives 6 and 8, the probability that NPV would exceed 220,000 ETB was 32% and 51%, respectively. The main barrier for the solar pump scenario was the initial investment in water-lifting technologies. For instance, the cost of a solar pump (approximately 16,000 EB) is about 2 to 2.5 times greater than the cost of a motor pump (approximately 6,400 EB) or an animal-powered pump (7,800 ETB). Since most farmers already own large animals like bullocks, the initial investment costs of an animal-powered pump are negligible by comparison; however, the NPV results strongly suggest that the investment in motor technologies would pay large dividends in increased income and wealth. Motor pumps are more profitable than solar pumps, given the higher entry costs and low water pumping capacity of the latter; however, the comparatively lower operating, maintenance, and environmental costs of solar technologies may make them more promising in the long-term.
Figure 15b. Stoplight chart for the NPV
0.65 0.65
0.480.57
0.420.36
0.240.14 0.09
0.540.41
0.25 0.25
0.32
0.31
0.360.43
0.430.52
0.40
0.34
0.35
0.09 0.090.19
0.120.22 0.21
0.32 0.34
0.51
0.120.23
0%
10%
20%
30%
40%
50%
60%
70%
80%
90%
100%
Baseline Alt.1 Alt.2 Alt.3 Alt.4 Alt.5 Alt.6 Alt.7 Alt.8 Alt.9 Alt.10
StopLight Chart for Probabilities of NPV Less Than 160,000 and Greater Than 220,000 ETB
www.feedthefuture.gov
26
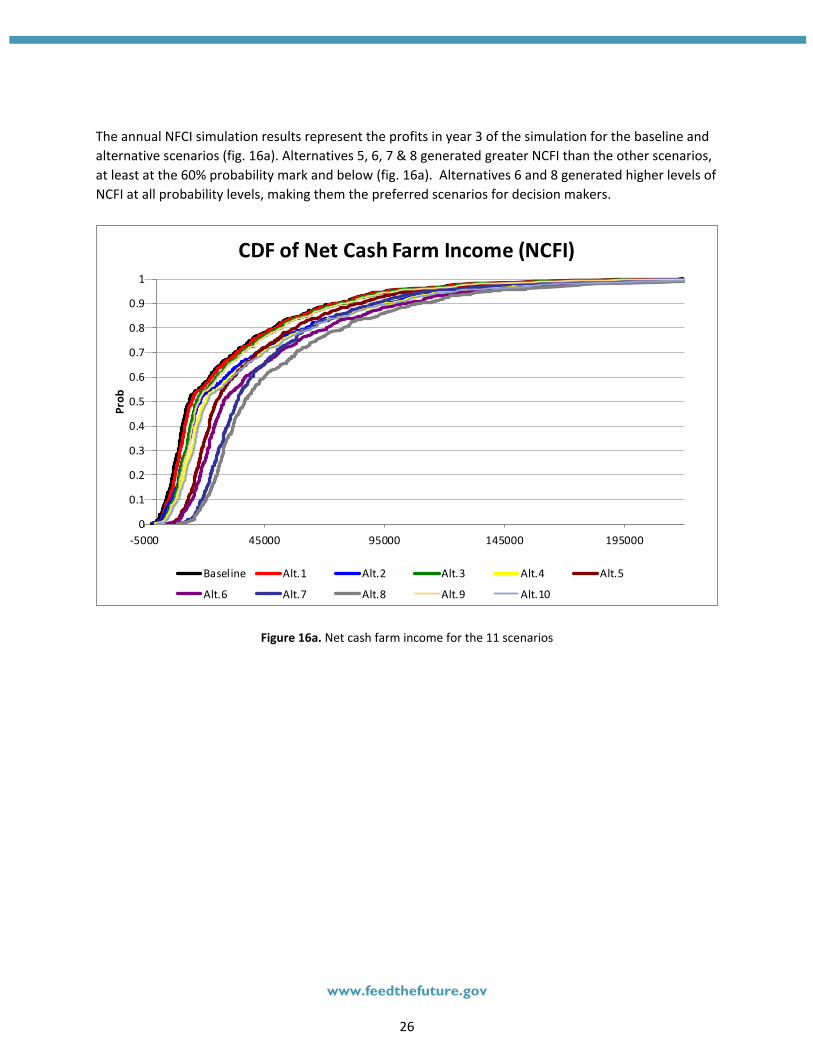
The annual NFCI simulation results represent the profits in year 3 of the simulation for the baseline and alternative scenarios (fig. 16a). Alternatives 5, 6, 7 & 8 generated greater NCFI than the other scenarios, at least at the 60% probability mark and below (fig. 16a). Alternatives 6 and 8 generated higher levels of NCFI at all probability levels, making them the preferred scenarios for decision makers.
Figure 16a. Net cash farm income for the 11 scenarios
0
0.1
0.2
0.3
0.4
0.5
0.6
0.7
0.8
0.9
1
-5000 45000 95000 145000 195000
Prob
CDF of Net Cash Farm Income (NCFI)
Baseline Alt.1 Alt.2 Alt.3 Alt.4 Alt.5
Alt.6 Alt.7 Alt.8 Alt.9 Alt.10
www.feedthefuture.gov
27
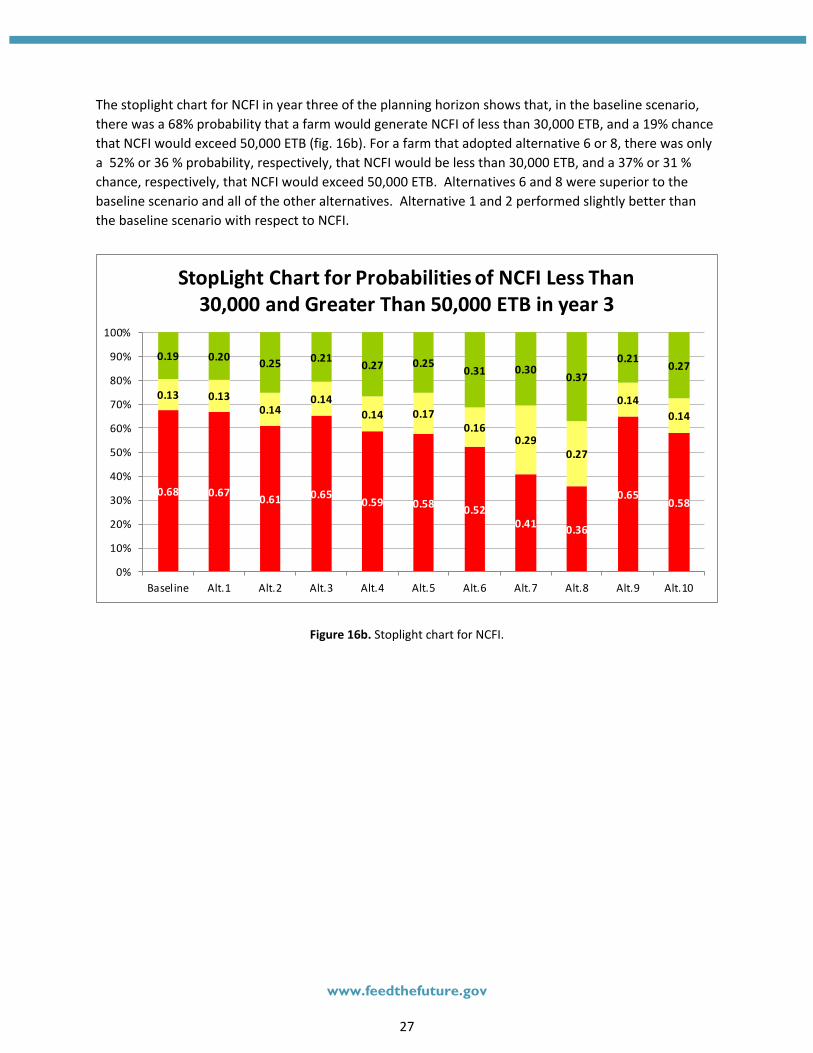
The stoplight chart for NCFI in year three of the planning horizon shows that, in the baseline scenario, there was a 68% probability that a farm would generate NCFI of less than 30,000 ETB, and a 19% chance that NCFI would exceed 50,000 ETB (fig. 16b). For a farm that adopted alternative 6 or 8, there was only a 52% or 36 % probability, respectively, that NCFI would be less than 30,000 ETB, and a 37% or 31 % chance, respectively, that NCFI would exceed 50,000 ETB. Alternatives 6 and 8 were superior to the baseline scenario and all of the other alternatives. Alternative 1 and 2 performed slightly better than the baseline scenario with respect to NCFI.
Figure 16b. Stoplight chart for NCFI.
0.68 0.67 0.61 0.650.59 0.58 0.52
0.41 0.36
0.650.58
0.13 0.130.14
0.140.14 0.17
0.160.29
0.27
0.140.14
0.19 0.20 0.25 0.21 0.27 0.250.31 0.30
0.37
0.210.27
0%
10%
20%
30%
40%
50%
60%
70%
80%
90%
100%
Baseline Alt.1 Alt.2 Alt.3 Alt.4 Alt.5 Alt.6 Alt.7 Alt.8 Alt.9 Alt.10
StopLight Chart for Probabilities of NCFI Less Than 30,000 and Greater Than 50,000 ETB in year 3
www.feedthefuture.gov
28
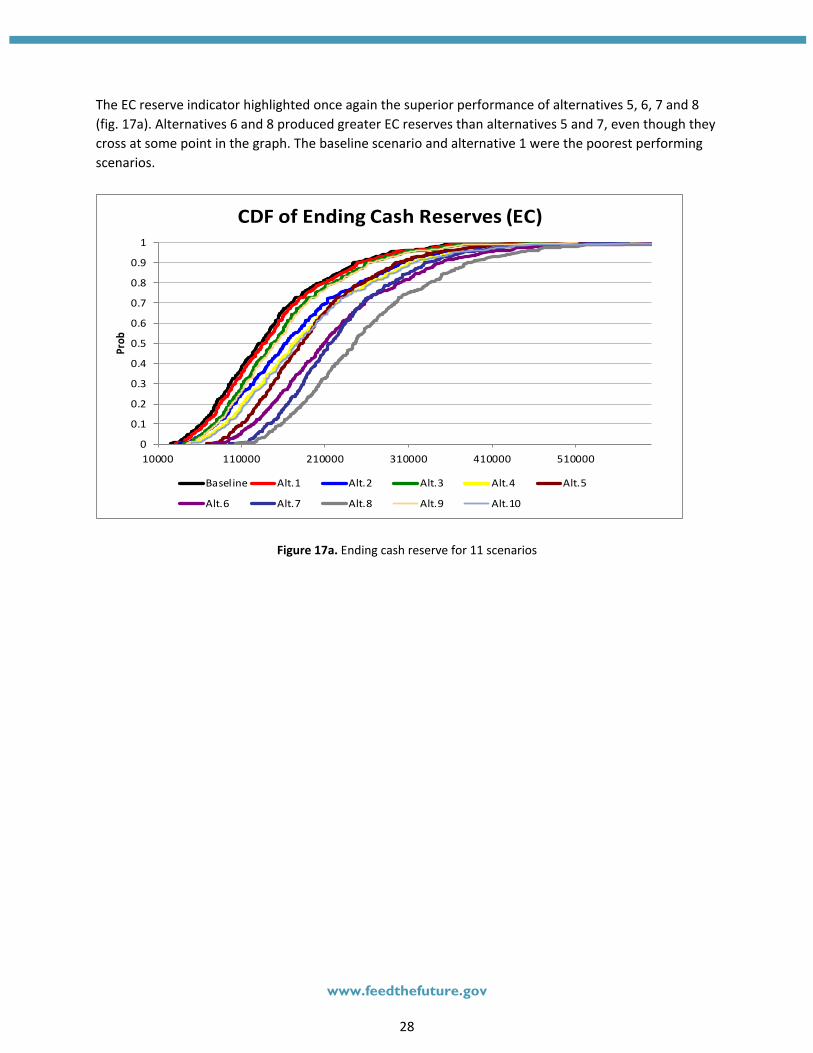
The EC reserve indicator highlighted once again the superior performance of alternatives 5, 6, 7 and 8 (fig. 17a). Alternatives 6 and 8 produced greater EC reserves than alternatives 5 and 7, even though they cross at some point in the graph. The baseline scenario and alternative 1 were the poorest performing scenarios.
Figure 17a. Ending cash reserve for 11 scenarios
0
0.1
0.2
0.3
0.4
0.5
0.6
0.7
0.8
0.9
1
10000 110000 210000 310000 410000 510000
Prob
CDF of Ending Cash Reserves (EC)
Baseline Alt.1 Alt.2 Alt.3 Alt.4 Alt.5
Alt.6 Alt.7 Alt.8 Alt.9 Alt.10
www.feedthefuture.gov
29
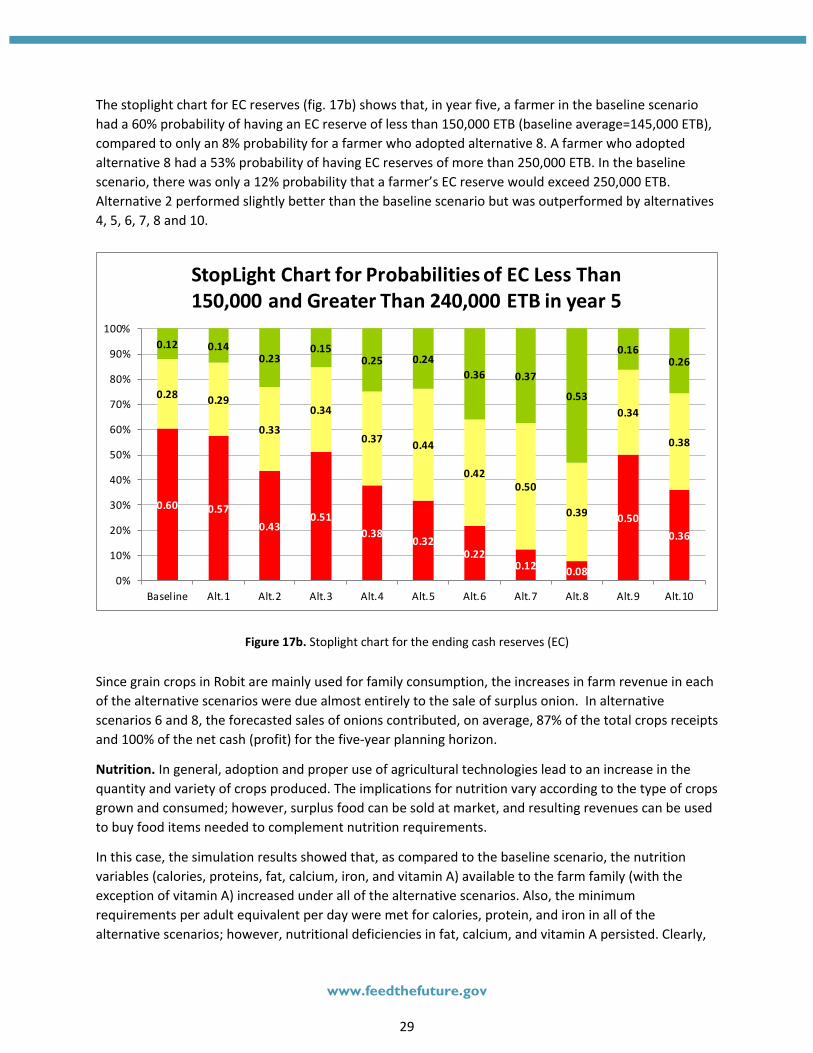
The stoplight chart for EC reserves (fig. 17b) shows that, in year five, a farmer in the baseline scenario had a 60% probability of having an EC reserve of less than 150,000 ETB (baseline average=145,000 ETB), compared to only an 8% probability for a farmer who adopted alternative 8. A farmer who adopted alternative 8 had a 53% probability of having EC reserves of more than 250,000 ETB. In the baseline scenario, there was only a 12% probability that a farmer’s EC reserve would exceed 250,000 ETB. Alternative 2 performed slightly better than the baseline scenario but was outperformed by alternatives 4, 5, 6, 7, 8 and 10.
Figure 17b. Stoplight chart for the ending cash reserves (EC)
Since grain crops in Robit are mainly used for family consumption, the increases in farm revenue in each of the alternative scenarios were due almost entirely to the sale of surplus onion. In alternative scenarios 6 and 8, the forecasted sales of onions contributed, on average, 87% of the total crops receipts and 100% of the net cash (profit) for the five-year planning horizon.
Nutrition. In general, adoption and proper use of agricultural technologies lead to an increase in the quantity and variety of crops produced. The implications for nutrition vary according to the type of crops grown and consumed; however, surplus food can be sold at market, and resulting revenues can be used to buy food items needed to complement nutrition requirements.
In this case, the simulation results showed that, as compared to the baseline scenario, the nutrition variables (calories, proteins, fat, calcium, iron, and vitamin A) available to the farm family (with the exception of vitamin A) increased under all of the alternative scenarios. Also, the minimum requirements per adult equivalent per day were met for calories, protein, and iron in all of the alternative scenarios; however, nutritional deficiencies in fat, calcium, and vitamin A persisted. Clearly,
0.60 0.570.43
0.510.38
0.320.22
0.12 0.08
0.500.36
0.28 0.29
0.33
0.34
0.37 0.44
0.420.50
0.39
0.34
0.38
0.12 0.140.23
0.150.25 0.24
0.36 0.37
0.53
0.160.26
0%
10%
20%
30%
40%
50%
60%
70%
80%
90%
100%
Baseline Alt.1 Alt.2 Alt.3 Alt.4 Alt.5 Alt.6 Alt.7 Alt.8 Alt.9 Alt.10
StopLight Chart for Probabilities of EC Less Than 150,000 and Greater Than 240,000 ETB in year 5
www.feedthefuture.gov
30
families in Robit would require food supplements (whether obtained through purchase or farming) to meet the minimum nutritional requirements for fat, calcium, and vitamin A. The analysis and comparison of alternative irrigated crops and their effects on farm-family nutrition are subjects for proposed future study.
Conclusions In BDZ, ILSSI proposed maximizing SSI of high-value, dry-season crops, using shallow groundwater and one of five alternative water-lifting technologies. Analysis and simulation with integrated and interactive IDSS models enabled us to assess:
− the amount of land appropriate for the proposed SSI interventions − the amount of irrigation water required for the proposed SSI interventions − the complete hydrology of the watershed with and without the proposed SSI interventions − the rate of soil erosion with and without the proposed SSI interventions − the impact of various farming practices (such as current versus recommended fertilization
application rates, and current versus deep tillage practices) on crop yields, watershed hydrology, and farm economies, when implemented in conjunction with the proposed SSI interventions
− the economic viability and nutritional benefits to typical farm families of implementing the proposed SSI interventions
IDSS simulations indicated that the proposed SSI interventions can be sustained by the shallow groundwater recharge without affecting long-term groundwater storage, and would not compromise the environmental health of the watershed. The proposed SSI interventions would use only approximately 40% of the annual shallow groundwater recharge. Moreover, the proposed SSI interventions would reduce average monthly stream flow by only 6%, and should not compromise downstream flows.
The proposed SSI interventions (especially when combined with increased fertilization rates) increased wet-season grain yields significantly, presumably because crop rotation operations implemented in conjunction with the proposed SSI scenarios resulted in improvements in soil organic matter. As expected, the proposed SSI interventions also resulted in significant onion yields, which were shown to increase with applied irrigation water of up to 140 mm (the irrigation depth required to reduce plant stress levels to 0%).
Economic analyses were conducted to estimate the effects of the proposed SSI interventions (in conjunction with the simulated, improved cropping system) on farm family economics in Robit kebele. These simulations compared the costs and benefits of five alternative water-lifting technologies: pulley-and-bucket irrigation, and rope-and-washer pumps operated by hand, animal, gasoline motor, and solar power. Additionally, these simulations analyzed the effects of deep tillage (as opposed to current, shallow tillage practices) to break up hardpan soils. In all, eleven scenarios (including the baseline, non-irrigated scenario) were simulated.
Of the technologies examined, only the gasoline pump met the irrigation water requirements for the proposed SSI interventions (i.e., for all 787 ha of irrigable land in the kebele). Implementation of the proposed SSI interventions using animal-powered or motor pump produced the highest NPV, NCI, and EC reserves of the eleven scenarios simulated. The benefits were greatest when these technologies were combined with deep tillage to increase rooting depth and reduce drought stress in the grain crops. In each of the alternative scenarios, the increase in farm revenue was due almost entirely to the sale of
www.feedthefuture.gov
31
surplus irrigated onion. Where an animal-powered or motor pump was used in combination with deep tillage practices, the forecasted sales of irrigated onions contributed, on average, 87% of the total crops receipts and 100% of the net cash (profit) for the five-year planning horizon.
A motor pump can irrigate an area three times larger than that covered by an animal-powered pump. The main barrier to SSI with motor or solar pumps is the up-front investment in the technology; the initial investment costs of an animal-powered pump are much lower. Individual farmers might benefit by spreading entry costs over more irrigated area, perhaps by having two or three farmers share a pump.
Despite improvements in farm family economics resulting from the proposed SSI interventions, nutritional deficiencies persisted under the simulated, improved cropping system. We would also, therefore, propose expanding the types of crops irrigated in the dry season to increase family nutrition and net cash income, but only if such crops can be irrigated without causing excessive soil erosion or reduction in environmental benefits.
Notably, the simulated soil erosion rates were very high in Robit, suggesting that the current and alternative cropping systems simulated in this study cannot be sustained without substantial efforts to reduce soil erosion. Every effort should be made to identify and implement cropping systems that reduce the rates of soil erosion. The evaluation and comparison of alternative farming systems, including the types of crops grown, recommended management practices, and associated impacts on soil erosion and environmental benefits, are subjects for proposed future study.
www.feedthefuture.gov
32
REFERENCES
Awulachew, S. B., P. Lemperiere, and T. Tulu. 2009. Pumps for small-scale irrigation: Improving productivity and market access (IPMS) of Ethiopian farmers. Addis Ababa: International Livestock Research Institute.
Brikke, F., and M. Bredero. 2003. Water-Lifting devices. In Linking technology choice with operation and maintenance in the context of community water supply and sanitation, ed. F. Brikke and M. Bredero, 42-63. Geneva: World Health Organization.
Brumbelow, K., and A. Georgakakos. 2007. Determining crop-water production functions using irrigation gradient algorithms. Agric. Water Management 87(2): 151-161.
Chen, Y., J. Yu, and S. Khan. 2010. Spatial sensitivity analysis of multi-criteria weights in GIS-based land suitability evaluation. Environ. Model. Softw. 25, doi:10.1016/j.envsoft.2010.06.001.
Central Statistical Authority of Ethiopia. 2012. http://www.csa.gov.et/ (area, production and agricultural practice documents; accessed March 2015).
CSA. See Central Statistical Authority of Ethiopia.
de Juan, J. A., J. M. Tarjuelo, M. Valiente, and P. Garcia. 1996. Model for optimal cropping patterns within the farm based on crop water production functions and irrigation uniformity: Development of a decision model. Agric. Water Management 31(1-2): 115-143.
Dile, Y. T., and R. Srinivasan. 2014. Evaluation of CFSR climate data for hydrologic prediction in data-scarce watersheds: An application in the Blue Nile River Basin. J. Am. Water Resour. Assoc., doi: 10.1111/jawr.12182.
EIAR. See Ethiopian Agricultural Research Institute.
ENMSA. See Ethiopian National Meteorological Services Agency.
Ethiopian Agricultural Research Institute. 2007. Crop technologies usage [in Amharic]. Addis Ababa: EIAR.
Ethiopian Ministry of Water and Energy. 2012. Hydrological data. Addis Ababa: MoWE.
Ethiopian National Meteorological Services Agency. 2012. Meteorological data. Addis Ababa: ENMSA.
FAO. See Food and Agriculture Organization of the United Nations.
www.feedthefuture.gov
33
Food and Agriculture Organization of the United Nations. Natural Resources Management and Environment Department, Land and Water Development Division. 1997. Soil and terrain suitability for surface irrigation. Chap. 3 in Irrigation potential in Africa: A basin approach. Rome: FAO. http://www.fao.org/docrep/w4347e/w4347e08.htm.
HarvestChoice. 2014. Crop Production: SPAM. Washington, DC and St. Paul, MN: International Food Policy Research Institute. Available online at http://harvestchoice.org/tools/crop-production-spam-0).
IAASTD. See International Assessment of Agricultural Knowledge, Science and Technology for Development.
International Assessment of Agricultural Knowledge, Science and Technology for Development. 2009. Summary for Decision Makers of the Sub-Saharan Africa Report, Assessment. Johannesburg: IAASTD.
Kassam, A., N. Lutaladio, T. Friedrich, E. Kueneman, M. Salvatore, M. Bloise, and J. Tschirley. 2012. Natural resource assessment for crop and land suitability: An application for selected bioenergy crops in Southern Africa region. Rome: FAO, Plant Production And Protection Division.
Langan, S. 2014. Proposed demonstration intervention sites in Ethiopia for the Innovation Laboratory on Small-Scale Irrigation. Addis Ababa: International Water Management Institute.
Mati, B., T. Bock, M. Malesu, E. Khaka, A. Oduor, M. Nyabenge, and V. Oduor. 2007. Mapping the potential of rainwater harvesting technologies in Africa: A GIS overview of development domains for the continent and ten selected countries. Technical Manual No. 6. Nairobi: World Agroforestry Centre (ICRAF), Netherlands Ministry of Foreign Affairs.
NASA Landsat Program. 2003. Landsat ETM + scene [LC81700522013157LGN00, SLC-Off]. Lake Tana, Ethiopia: USGS.
Nederstigt, J. and A. van der Wal. 2011. Rope Pump Manual: Technical Training Handbook on Rope Pump Production, Installation and Maintenance. Papendrecht, Netherlands: PRACTICA Foundation. http://practica.org/wp-content/uploads/2014/08/ropepump-manual-EN-full.pdf
MoWE. See Ethiopian Ministry of Water and Energy.
USGS EarthExplorer. http://earthexplorer.usgs.gov/ (accessed 12.10.15).
Vaux, Jr., H.J., and W. O. Pruitt . 1983. Crop-water production functions. In Advances in Irrigation Vol. 2, ed. Daniel Hillel, 61-93. New York: Academic Press.