Ewart Unit No. 12 - LP Application DRAFT - Manitoba · PROPOSED EWART UNIT NO. 12 Application for...
41
PROPOSED EWART UNIT NO. 12 Application for Enhanced Oil Recovery Waterflood Project Lodgepole Formation Lodgepole A (01 59A) Daly Sinclair Field, Manitoba December 5 th , 2016 Tundra Oil and Gas Partnership
Transcript of Ewart Unit No. 12 - LP Application DRAFT - Manitoba · PROPOSED EWART UNIT NO. 12 Application for...

PROPOSED EWART UNIT NO. 12
Application for Enhanced Oil Recovery Waterflood Project
Lodgepole Formation
Lodgepole A (01 59A)
Daly Sinclair Field, Manitoba
December 5th, 2016
Tundra Oil and Gas Partnership

2 | P a g e
INTRODUCTION
The Daly Sinclair oilfield is located in Townships 8, 9, 10 and 11, of Ranges 27, 28 & 29 WPM
(Figure 1). Within the Daly Sinclair oilfield, most Lodgepole reservoirs have been developed with
vertical producing wells on Primary Production and 40 acre spacing. Horizontal producing Lodgepole
wells have recently been drilled by Tundra Oil and Gas (Tundra) in the southern part of the Daly
Sinclair field.
Within the area, potential exists for incremental production and reserves from a Waterflood
Enhanced Oil Recovery (EOR) project in the Lodgepole oil reservoir. The following represents an
application by Tundra Oil and Gas Partnership (Tundra) to establish Ewart Unit No. 12 (S/2 20-008-
28W1) and implement a Secondary Waterflood EOR scheme within the Lodgepole formation as
outlined on Figure 2.
The proposed project area falls within the existing designated Lodgepole A Pool of the Daly Sinclair
Oilfield (Figure 3).

3 | P a g e
SUMMARY
1. The proposed Ewart Unit No. 12 consists of 2 horizontal producing Lodgepole wells and 3 new horizontal wells waiting to be produced. The area of the proposed Ewart Unit No. 12 comprises 8 Legal Sub Divisions (LSD), and is located south of Ewart Unit No. 9 (Figure 2).
2. Total Original Oil in Place (OOIP) in the project area is estimated to be 858.1 e3m3 (5,397 Mbbl) for an average of 107.3 e3m3 (675.4 Mbbl) OOIP per 40 acre LSD. OOIP values were estimated by contouring phi*h values and applying volumetric methods.
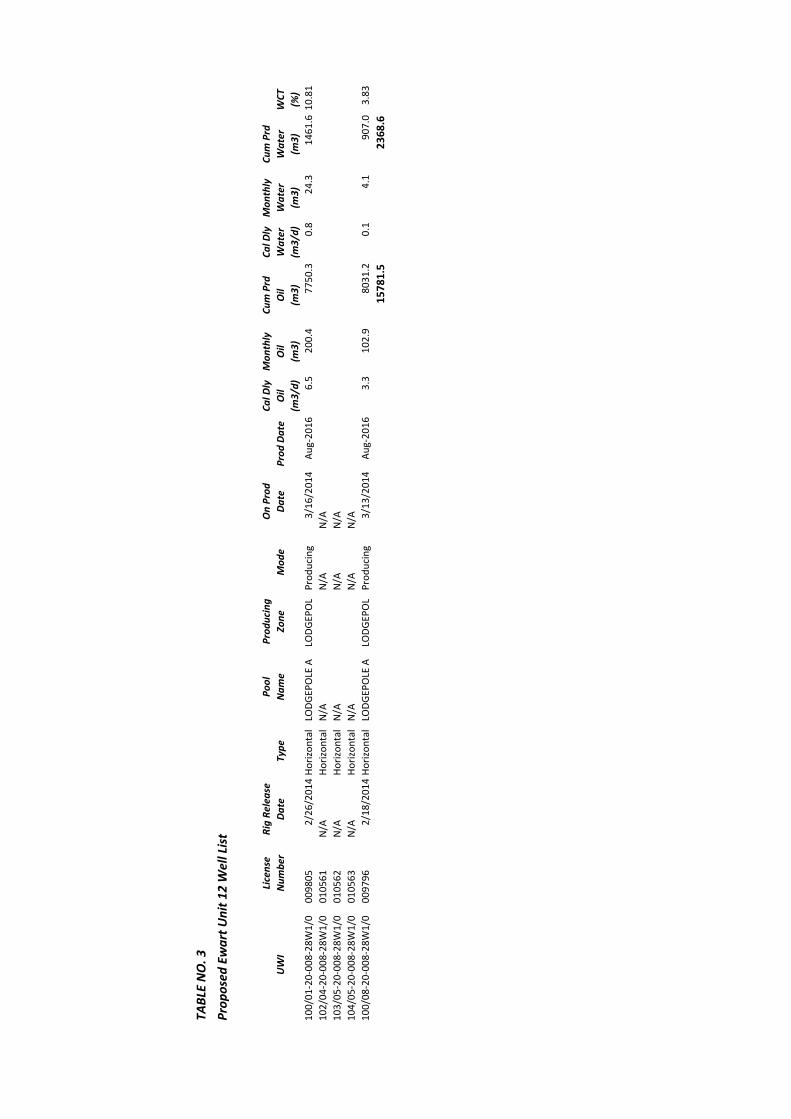
3. Cumulative production to the end of August 2016 from the 2 producing Lodgepole wells within the proposed Ewart Unit No. 12 project area is 15.78 e3m3 (99.3 Mbbl) of oil and 2.37 e3m3 (14.9 Mbbl) of water, representing a 1.8% Recovery Factor (RF) of the OOIP.
4. Figure 4 shows that the oil production rate in the Ewart Unit No. 12 area peaked during April 2014 at 39.8 m3 (259 bbl) of oil per day (OPD) when developed with horizontal wells at 400m inter-well spacing. As of August 2016, production was 9.78 m3 (61.6 bbl) OPD, 0.92 m3 (5.8 bbl) water per day (WPD) and an 8.6% water cut (WCUT). Drilling 3 additional infill horizontal wells in 2016 at 100m inter-well spacing will result in a new peak rate from this area in December 2016 estimated to be approximately 72 m3 (452 bbl) of oil per day (OPD).
5. In April 2014, production averaged 19.9 m3 (125 bbl) OPD per well in the proposed Ewart Unit No. 12. As of August 2016, average per well production has declined to 4.89 m3 (30.8 bbl) OPD. The wells drilled at 400m spacing will continue declining at an annual rate of approximately 17% in the project area.
6. Estimated Ultimate Recovery (EUR) of Primary producing oil reserves in the proposed Ewart Unit No. 12 project area is estimated to be 42.98 e3m3 (270 Mbbl), with 27.2 e3m3 (171 Mbbl) remaining as of the end of August 2016 when developed at 400m spacing. Infill drilling the 3 additional horizontal wells at 100m spacing is estimated to increase primary EUR to 89.72 e3m3 (565 Mbbl), with 73.94 e3m3 (465 Mbbl) remaining at the end of August 2016.
7. Ultimate oil recovery of the proposed Ewart Unit No. 12 OOIP, under the current Primary production method, is forecasted to be 10.5%.
8. Estimated Ultimate Recovery (EUR) of oil under Secondary Waterflood EOR for the proposed Ewart Unit No. 12 is estimated to be 126.8 e3m3 (797 Mbbl). An incremental 37.1 e3m3 (233 Mbbl) of oil is forecasted to be recovered under the proposed Unitization and Secondary EOR production, versus the Primary production method.
9. Total RF under Secondary WF in the proposed Ewart Unit No. 12 is estimated to be 14.8%.
10. There are no nearby Lodgepole Dolomite waterflood analogues with enough waterflood history at this time. However, based on simulation, results of Primary production and successful waterfloods in the Permian basin of carbonate reservoirs with similar reservoir characteristics, the proposed project area is thought to be suitable reservoir for successful EOR trial.
11. Horizontal producers with multi-stage hydraulic fractures, will be converted to injectors (Figure 5) within the proposed Ewart Unit No. 12, to complete waterflood patterns with 100m Horizontal to Horizontal spacing. There is a possibility 2 additional producers may be drilled within the proposed unit, however, the production associated with these wells was not considered for this unit application.

4 | P a g e
DISCUSSION
The proposed Ewart Unit No. 12 project area is located within Township 8, Range 28 W1 of the Daly
Sinclair oilfield (Figure 1). The proposed Ewart Unit No. 12 currently consists of 2 producing
horizontal Lodgepole wells, 3 standing horizontal wells waiting to be produced, and 2 vertical wells
which will be used for pressure observation purposed within an area covering the south half of
Section 20-008-28W1M (Figure 2). A project area well list complete with recent production statistics
is attached as Table 3.
Within the proposed Unit, potential exists for incremental production and reserves from a
Waterflood EOR project in the Lodgepole oil reservoir.
Geology
Stratigraphy:
The proposed Ewart Unit No. 12 (Appendix 1) is located on the carbonate slope of the Mississippian
Lodgepole Formation on the Eastern edge of the Williston Basin. The stratigraphy of the reservoir
section in Ewart Unit #12 is shown in the structural cross section (Appendix 2). The cross section A –
A’ runs from West to East through the proposed unit.
The Lodgepole section is subdivided into 7 units. In ascending order these are: the Basal Lodgepole
Limestone, the Cromer Shale, the Cruickshank Crinoidal, the Cruickshank Shale, the Middle Daly, the
Upper Daly and the Unnamed. A Dolomitic facies is prevalent over the Daly Sinclair area and is
predominantly in the Unnamed, however can extend as deep as the Middle Daly formation. Of the
seven members, only the Dolomite facies is productive, the lower limestone units are considered
non-reservoir. All of the Mississippian horizontal wells in the proposed unit area are drilled and
completed in the Lodgepole Dolomite facies.
The Triassic-Jurassic aged Watrous Red Beds Formation overlays the Lodgepole Formation and
consists of red argillaceous siltstones and anhydrites which form an effective seal for the Lodgepole
dolomite reservoir. The structural cross-section (Appendix 2) shows the correlations of the various
units in the Lodgepole section as well as the overlying Watrous Red Beds and Watrous Evaporite.
Sedimentology:
The whole of the Lodgepole Formation in the Daly Sinclair area consists of an overall shallowing
upward cycle which begins with the Upper Bakken transgressive cycle and continues to the
Lodgepole Dolomite facies, which represents the shallowest part of the cycle preserved. The
Unnamed unit (which is most often dolomitized) consists of a series of “brining upward” cycles,
comprised of 1-2 m sequences that begin at an erosional base with coarser grained carbonate
grainstones which rapidly grade upward into fine-grained dolomitic mudstones that characterize the
bulk of the cycle. The dolomite facies contains anhydrite bands of variable thickness and
disseminated anhydrite. The coarser grained grainstones at the base of each cycle generally consist
of fossil fragments which are often replaced by chert or are tightly cemented. The fine grained
dolomitic mudstones bear rare fossils, generally fragmental, consisting of bryozoans, corals,
brachiopods and crinoids. The intimate association of the anhydrites with the dolomitized part of the
Upper Lodgepole suggests dolomitization by seepage reflux with the magnesium rich brines provided

5 | P a g e
by the deposition of the anhydrites which cap each cycle. Other diagenetic processes include
mobilization and re-precipitation of silica in the form of chert which is present in the form of nodules
of massive, dense grey chert or as white “chalky” chert. The “chalky” chert can have considerable
micro-porosity but is considered non-reservoir as these features are isolated and not connected to
the main reservoir. The presence of the anhydrite beds within the Lodgepole Dolomite suggests
deposition on the proximal part of a shallow carbonate ramp.
Reservoir development within the above mentioned cycles is largely due to secondary processes as
most of the primary reservoir was likely cemented during deposition and early diagenesis. These
secondary processes include: dolomitization, conversion of anhydrite to gypsum and leaching of
fossils, grains and cements. These processes occurred while the Lodgepole was exhumed and eroded,
but prior to deposition of the Watrous Red Beds.
The Lodgepole Limestone facies lies between the Cromer Shale and the Lodgepole Dolomite. Similar
to the Dolomite facies, the Limestone facies displays evidence of cyclic deposition. The depositional
cycles within the Limestone facies generally contain more grainstones at the base of each cycle and
grade up into finer grained wackestones or mudstones. Grainstone beds, particularly the crinoidal
grainstones, are frequently tightly cemented by chert. The lack of anhydrite beds and the presence of
significantly more grainstones suggest deposition on a more distal and open marine part of the
carbonate ramp than the overlying Lodgepole Dolomite facies. Within the Ewart Unit No. 12 area,
the Lodgepole Limestone is considered non-reservoir.
The Cromer Shale is an argillaceous carbonate that appears as a higher gamma ray unit on logs and
lies between the Lodgepole Limestone and the Basal Limestone. The Cromer Shale is considered non-
reservoir.
The Basal Lodgepole Limestone lies between the Cromer Shale and the Upper Bakken Shale. Where
cored, the Basal Limestone consists of a nodular lime mudstone to wackestone with numerous fossil
fragments including crinoids, corals and brachiopods. The Basal Limestone is thought to represent
deeper water conditions following the Upper Bakken transgression. The Basal Lodgepole Limestone
is also considered non-reservoir.
An Isopach map is provided for the Lodgepole Dolomite facies as Appendix 3.
Structure:
A structure contour map is provided for the top of the Lodgepole Dolomite reservoir (Appendix 4).
Structure on the top of the Lodgepole Formation reflects the erosional relief at the Mississippian
Unconformity. A South West trending dip exists over the proposed unit. Structure descends to the
East of the proposed unit, as you approach the edge of the Daly High, a paleo high associated with
the Daly-Sinclair field.
Reservoir Quality:
Reservoir quality within the Lodgepole Dolomite facies is highly variable both laterally and vertically.
Due to the heterolithic nature of the Lodgepole Dolomite reservoir and the inherent challenges in
determining reservoir properties from petrophysical logs in carbonates, high resolution pressure-
decay profile permeameter (PDPK) core data was used to determine an average net to gross ratio. A

6 | P a g e
permeability cutoff of 0.5 md was applied to differentiate reservoir from non-reservoir. The gross
thickness of the Lodgepole Dolomite is represented by the Dolomite Isopach (Appendix 3). The top
and base of the Lodgepole Dolomite facies was determined using openhole wireline logs. An average
net to gross ratio, calculated to be 38.1%, was applied to the gross thickness of the Lodgepole
Dolomite facies to determine a net pay thickness.
An average porosity value was derived from routine core analysis using a 0.5mD cutoff. The average
porosity of net pay was calculated to be 12.5%.
Fluid Contacts:
No oil-water contact is found within the Lodgepole formation in the area local to the proposed unit.
OOIP Estimates
Total volumetric OOIP for the Dolomite facies within the proposed unit has been calculated to be
858.1 e3m3 (5,397 Mbbl). Tundra generated maps integrate both open hole wireline logs and core
data when available. (Appendices 1-6).
OOIP values were calculated using the following volumetric equation:
or
or
where
OOIP =Original Oil in Place by LSD = 5,397 Mbbl (total)
A =Area = 40 acres/LSD
h * =Net Pay * Porosity, or Phi * h = 12.5% * 38.1% * Dolo Gross h(m)
Bo =Formation Volume Factor of Oil = 1.1 stb/rb
Sw =Water Saturation = 25%
The initial oil formation volume factor (Boi) was adopted from historical PVT information taken from
the Sinclair Daly area and is representative of the fluid characteristics in the reservoir.

7 | P a g e
Historical Production
A historical group production plot for the proposed Ewart Unit No. 12 is shown as Figure 4. The oil
production rate in the Ewart Unit No. 12 area peaked during April 2014 at 39.8 m3 (259 bbl) of oil per
day (OPD) when developed with horizontal wells at 400m inter-well spacing. As of August 2016,
production was 9.78 m3 (61.6 bbl) OPD, 0.92 m3 (5.8 bbl) water per day (WPD) and an 8.6% water cut
(WCUT).
From peak production in April 2014 to date, oil production is declining at an annual rate of
approximately 17% under the current Primary Production method.
The remainder of the field’s production and decline rates indicate the need for pressure restoration
and maintenance. Waterflooding is deemed to be the most efficient means of secondary recovery to
introduce energy back into the system and provide areal sweep between wells.

8 | P a g e
UNITIZATION
Unitization and implementation of a Waterflood EOR project is forecasted to increase overall
recovery of OOIP from the proposed project area by 35% (from a recovery factor of 10.5% to 14.8%).
The basis for unitization is to develop the lands in an effective manner that will be conducive to
waterflooding. Unitizing will enable the reservoir to have a higher recovery of oil by allowing the
development of additional drilling and injector conversions over time. In addition, Unitizing will
facilitate a pressure maintenance scheme, and overall will increase oil production over time.
Unit Name
Tundra proposes that the official name of the new Unit shall be Ewart Unit No. 12.
Unit Operator
Tundra Oil and Gas Partnership (Tundra) will be the Operator of record for Ewart Unit No. 12.
Unitized Zone
The unitized zone(s) to be waterflooded in Ewart Unit No. 12 will be the Lodgepole formation.
Unit Wells
The 5 wells to be included in the proposed Ewart Unit No. 12 are outlined in Table 3.
Unit Lands
Ewart Unit No. 12 will consist of 8 LSDs as follows:
S/2 Section 20, of Township 8, Range 28, W1M
The lands included in the 40 acre tracts are outlined in Table 1.
Tract Factors
The Tract Factor contribution for each of the LSD’s within the proposed Ewart Unit No. 12 was
calculated as follows:
• OOIP by LSD, minus cumulative production to date for the LSD as distributed by the LSD specific
Production Allocation (PA) % in the applicable producing horizontal well (to yield Remaining
OOIP)
• Tract Factor by LSD = The product of Remaining OOIP by LSD as a % of total proposed Unit
Remaining OOIP
Tract Factor calculations for all individual LSD’s based on the above methodology are outlined within
Table 2.

9 | P a g e
Working Interest Owners
Table 1 outlines the working interest % (WI) for each recommended Tract within the proposed Ewart
Unit No. 12.
Tundra Oil and Gas Partnership will have a 100% working interest in the proposed Ewart Unit No. 12.

10 | P a g e
WATERFLOOD EOR DEVELOPMENT
The waterflood performance predictions for the proposed Ewart Unit No. 12 Lodgepole project are
based on internal engineering assessments. Project area specific reservoir and geological parameters
were used to guide the overall Secondary Waterflood recovery factor.
Based on the geological descriptions, primary production decline rate, and positive waterflood
response in the analog Clearfork formation in the Permian Basin of West Texas, the Lodgepole
formation in the project area is deemed to be a suitable trial for waterflood EOR operations.
Pre-Production of New Horizontal Injection Wells
Two (2) of the existing producing horizontal wells and one (1) of the recently drilled horizontal wells
will be converted to horizontal injection wells as shown in Figure 5. This will result in 100m
Horizontal to Horizontal waterflood patterns within Ewart Unit No. 12.
Placing new horizontal wells immediately on water injection in areas without significant reservoir
pressure depletion has been problematic in similar low permeability formations, and has a negative
impact on the ultimate total recovery factor of OOIP. Considering the expected reservoir pressures
and reservoir lithology described, Tundra believes an initial period of producing horizontal wells prior
to placing them on permanent water injection is essential and all Unit mineral owners will benefit.
Tundra monitors reservoir pressure, fluid production and decline rates in each pattern to determine
when the well will be converted to water injection.
Reserves Recovery Profiles and Production Forecasts
The primary waterflood performance predictions for the proposed Ewart Unit No. 12 are based on oil
production decline curve analysis, and the secondary predictions are based on internal engineering
analysis performed by the Tundra reservoir engineering group using numerical simulation in
combination with analogue studies of successful waterfloods in the Clearfork formation.
Primary Production Forecast
Cumulative production to the end of August 2016 from the 2 producing Lodgepole wells within the
proposed Ewart Unit No. 12 project area is 15.78 e3m3 of oil and 2.37 e3m3 of water for a recovery
factor of 1.8% of the total OOIP.
Based on decline curve analysis of the wells currently on production, the estimated ultimate recovery
(EUR) for the proposed Unit with no further development is estimated to be 42.98 e3m3, representing
a recovery factor of 5.0% of the total OOIP (Figures 6 & 7).
Recently drilled 3 infill horizontal wells at 100m inter-well spacing is estimated to increase the
estimated ultimate recovery (EUR) for the proposed unit to 89.7 e3m3, representing a primary
recovery factor of 10.5% of the total OOIP.
11 | P a g e
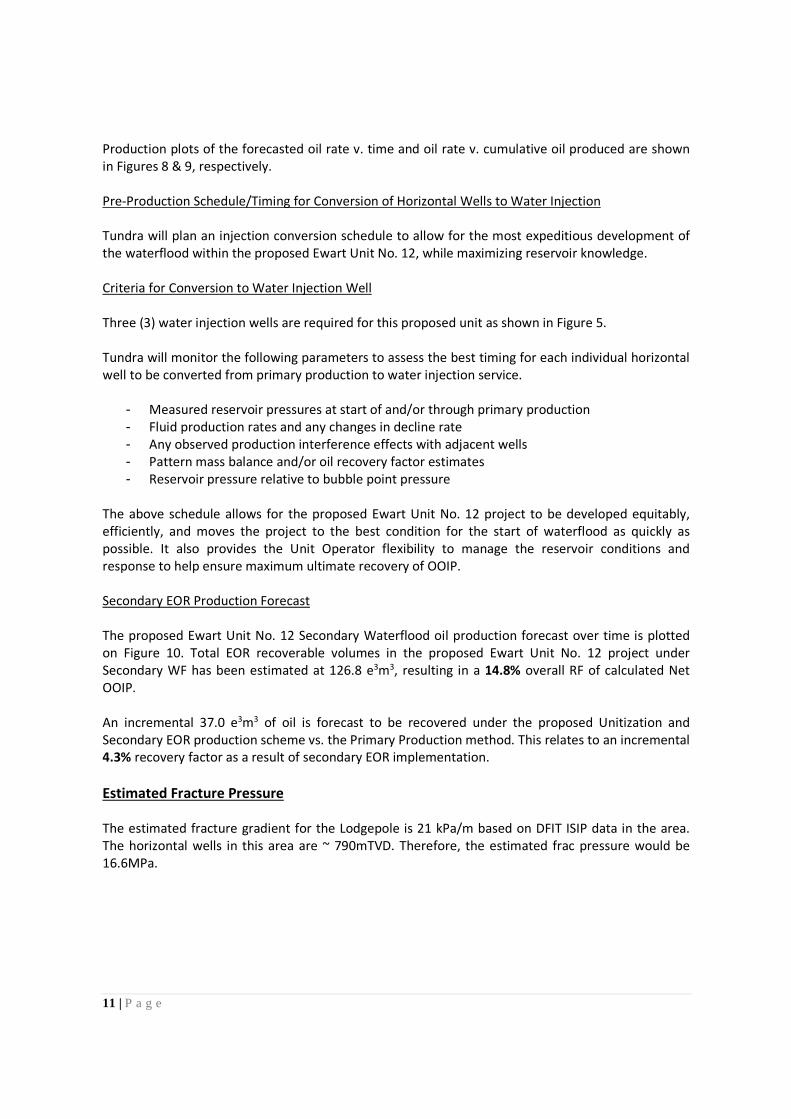
Production plots of the forecasted oil rate v. time and oil rate v. cumulative oil produced are shown
in Figures 8 & 9, respectively.
Pre-Production Schedule/Timing for Conversion of Horizontal Wells to Water Injection
Tundra will plan an injection conversion schedule to allow for the most expeditious development of
the waterflood within the proposed Ewart Unit No. 12, while maximizing reservoir knowledge.
Criteria for Conversion to Water Injection Well
Three (3) water injection wells are required for this proposed unit as shown in Figure 5.
Tundra will monitor the following parameters to assess the best timing for each individual horizontal
well to be converted from primary production to water injection service.
- Measured reservoir pressures at start of and/or through primary production
- Fluid production rates and any changes in decline rate
- Any observed production interference effects with adjacent wells
- Pattern mass balance and/or oil recovery factor estimates
- Reservoir pressure relative to bubble point pressure
The above schedule allows for the proposed Ewart Unit No. 12 project to be developed equitably,
efficiently, and moves the project to the best condition for the start of waterflood as quickly as
possible. It also provides the Unit Operator flexibility to manage the reservoir conditions and
response to help ensure maximum ultimate recovery of OOIP.
Secondary EOR Production Forecast
The proposed Ewart Unit No. 12 Secondary Waterflood oil production forecast over time is plotted
on Figure 10. Total EOR recoverable volumes in the proposed Ewart Unit No. 12 project under
Secondary WF has been estimated at 126.8 e3m3, resulting in a 14.8% overall RF of calculated Net
OOIP.
An incremental 37.0 e3m3 of oil is forecast to be recovered under the proposed Unitization and
Secondary EOR production scheme vs. the Primary Production method. This relates to an incremental
4.3% recovery factor as a result of secondary EOR implementation.
Estimated Fracture Pressure
The estimated fracture gradient for the Lodgepole is 21 kPa/m based on DFIT ISIP data in the area.
The horizontal wells in this area are ~ 790mTVD. Therefore, the estimated frac pressure would be
16.6MPa.

12 | P a g e
WATERFLOOD OPERATING STRATEGY
Water Source
The injection water for the proposed Ewart Unit No. 12 will be supplied from the existing source and
injection water system at the Sinclair 04-01-008-29 Water Filtration Plant. All existing injection water
is obtained from the Mannville formation in the 102/14-30-007-28W1 licensed water source well.
Mannville water from the 102/14-30 source well is pumped to the main Water Plant at 4-1-8-29W1,
filtered, and pumped up to injection system pressure. A diagram of the Daly Sinclair water injection
system and new pipeline connection to the proposed Ewart Unit No. 12 project area is shown as
Figure 12.
Produced water is not currently used for any water injection in the Tundra-operated Daly Sinclair
Units and there are no plans to use produced water as a source supply for Ewart Unit No. 12.
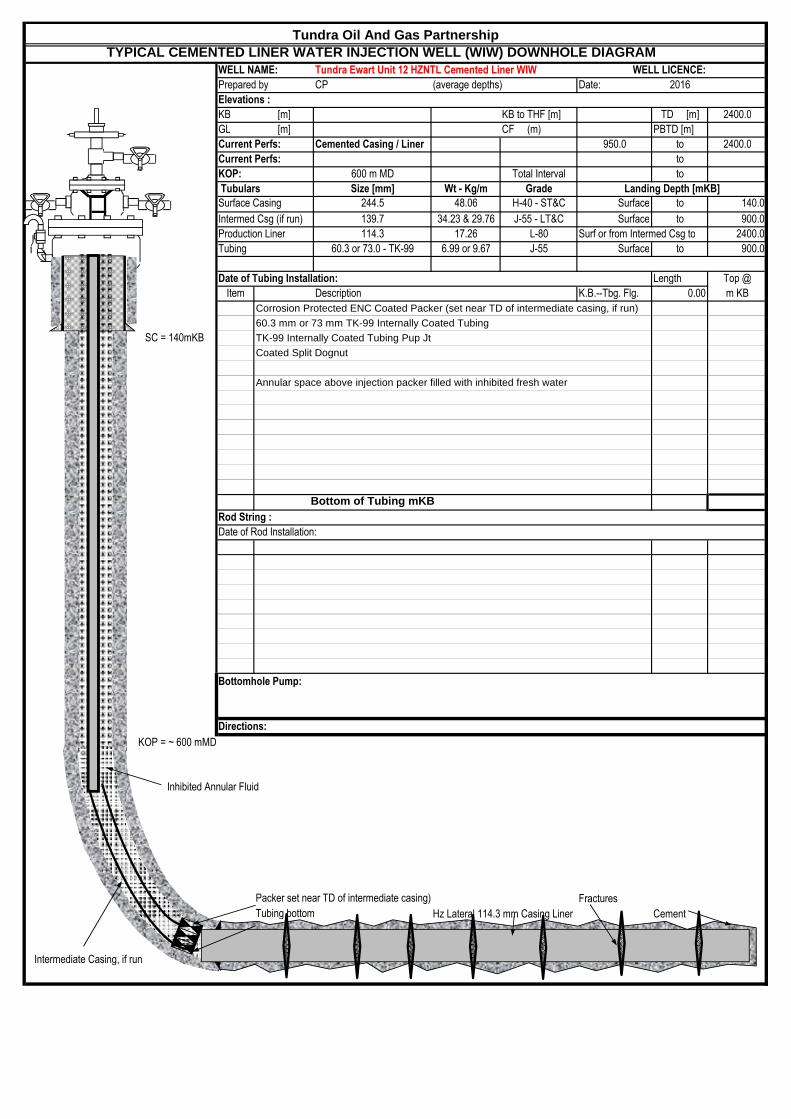
Injection Wells
The water injection wells for the proposed Ewart Unit No. 12 have been drilled, are currently
producing and plans are in progress to re-configure the wells for downhole injection after approval
for waterflood has been received (Figure 13). The horizontal injection wells have been stimulated by
multiple hydraulic fracture treatments to obtain suitable injection. Tundra has extensive experience
with horizontal fracturing in the area, and all jobs are rigorously programmed and monitored during
execution. This helps ensure optimum placement of each fracture stage to prevent, or minimize, the
potential for out-of-zone fracture growth and thereby limit the potential for future out-of-zone
injection.
The new water injection well will be placed on injection after the pre-production period and approval
to inject. Wellhead injection pressures will be maintained below the least value of either:
1. the area specific known and calculated fracture gradient, or
2. the licensed surface injection Maximum Allowable Pressure (MOP).
Tundra has a thorough understanding of area fracture gradients. A management program will be
implemented to set and routinely review injection target rates and pressures vs. surface MOP and
the known area formation fracture pressures.
All new water injection wells will be surface equipped with injection volume metering and
rate/pressure control. An operating procedure for monitoring water injection volumes and meter
balancing will also be utilized to monitor the entire system measurement and integrity on a daily
basis.
The proposed Ewart Unit No. 12 horizontal water injection well rate is estimated to average 10 – 25
m3 WPD, based on expected reservoir permeability and pressure.

13 | P a g e
Reservoir Pressure
No recent or representative initial pressure surveys are available for the proposed Ewart Unit No. 12
project area in the Lodgepole producing zone.
Initial reservoir pressure measurements for the infill wells are planned and underway. These
pressures along with any subsequent pressures will be submitted in the annual progress reports.
Reservoir Pressure Management during Waterflood
Tundra expects to inject water for a minimum 2 – 4 year period to re-pressurize the reservoir due to
cumulative primary production voidage and pressure depletion. Initial Voidage Replacement Ratio
(VRR) is expected to be approximately 1.25 to 1.75 within the pattern during the fill up period. As the
cumulative VRR approaches 1, target reservoir operating pressure for waterflood operations will be
75 – 90 % of original reservoir pressure.
Waterflood Surveillance and Optimization
Ewart Unit No. 12 EOR response and waterflood surveillance will consist of the following:
• Regular production well rate and WCT testing
• Daily water injection rate and pressure monitoring vs target
• Water injection rate / pressure / time vs cumulative injection plot
• Reservoir pressure surveys as required to establish pressure trends
• Pattern VRR
• Potential use of chemical tracers to track water injector / producer responses
• Use of some or all of: Water Oil Ratio (WOR) trends, Log WOR vs Cum Oil, Hydrocarbon Pore
Volumes Injected, Conformance Plots
The above surveillance methods will provide an ever increasing understanding of reservoir
performance, and provide data to continually control and optimize the Ewart Unit No. 12 waterflood
operation. Controlling the waterflood operation will significantly reduce or eliminate the potential
for out-of-zone injection, undesired channeling or water breakthrough, or out-of-Unit migration. The
monitoring and surveillance will also provide early indicators of any such issues so that waterflood
operations may be altered to maximize ultimate secondary reserves recovery from the proposed
Ewart Unit No. 12.
Economic Limits
Under the current Primary recovery method, existing wells within the proposed Ewart Unit No. 12
will be deemed uneconomic when the net oil rate and net oil price revenue stream becomes less
than the current producing operating costs. With any positive oil production response under the
proposed Secondary recovery method, the economic limit will be significantly pushed out into the
future. The actual economic cut off point will then again be a function of net oil price, the magnitude
and duration of production rate response to the waterflood, and then current operating costs.
Waterflood projects generally become uneconomic to operate when Water Oil Ratios (WOR’s)
exceed 100.

14 | P a g e
WATER INJECTION FACILITIES
The Ewart Unit No. 12 waterflood operation will utilize the existing Tundra operated source well
supply and water plant (WP) facilities located at 4-1-8-29 W1M Battery. Injection wells will be
connected to the existing high pressure water pipeline system supplying other Tundra-operated
Waterflood Units.
A complete description of all planned system design and operational practices to prevent corrosion
related failures is shown on Figure 14.
NOTIFICATION OF MINERAL AND SURFACE RIGHTS OWNERS
Tundra will notify all mineral rights and surface rights owners of the proposed EOR project and
formation of Ewart Unit No. 12. Copies of the Notices, and proof of service, to all surface rights
owners will be forwarded to the Petroleum Branch when available to complete the Ewart Unit No. 12
Application.
Ewart Unit No. 12 Unitization, and execution of the formal Ewart Unit No. 12 Agreement by affected
Mineral Owners, is expected during Q4 2016. Copies of same will be forwarded to the Petroleum
Branch, when available, to complete the Ewart Unit No. 12 Application.
Should the Petroleum Branch have further questions or require more information, please contact
Abhy Pandey at 403.767.1247 or by email at [email protected].
TUNDRA OIL & GAS PARTNERSHIP
Original Signed by Abhy Pandey, December 5th, 2016, in Calgary, AB

15 | P a g e
Proposed Ewart Unit No. 12
Application for Enhanced Oil Recovery Waterflood Project
List of Figures
Figure 1 Daly Sinclair Field Map
Figure 2 Ewart Unit No. 12 Proposed Boundary
Figure 3 Lodgepole Pool Boundaries
Figure 4 Ewart Unit No. 12 Historical Production
Figure 5 Ewart Unit No. 12 Proposed Injectors
Figure 6 Ewart Unit No. 12 Primary Recovery – Rate vs. Time
Figure 7 Ewart Unit No. 12 Primary Recovery – Rate vs. Cumulative Oil
Figure 8 Ewart Unit No. 12 Primary Recovery with 3 Infill Wells – Rate vs. Time
Figure 9 Ewart Unit No. 12 Primary Recovery with 3 Infill wells – Rate vs. Cumulative Oil
Figure 10 Ewart Unit No. 12 Waterflood with 3 Infill Wells – Rate vs. Time
Figure 11 Ewart Unit No. 12 Waterflood with 3 Infill Wells – Rate vs. Cumulative Oil
Figure 12 Ewart Unit No. 12 Injection Facilities Process Flow Diagram
Figure 13 Typical Injector Downhole Schematic
Figure 14 Corrosion Control

sharon.baker
Typewritten Text
Figure No. 1

8 9 10
151617
20 21 22
272829
PROPOSED
EWART UNIT NO. 11
EWART UNIT 9
PROPOSED
EWART UNIT NO. 12
JJ
J
J
J
G
G
H
G
G
H
H
S
HS
H
S
H
A
H
A
H
A
H
A
H
E
E
H
E H
H
EE
EH
EE
EE
E
H
H E
E
H
E
E
EE
HE
H
E
EEE
HE
HE
EE
H
EEE
HEH
E HE EE
EE
E
HE
EE
EE
E
EH
E
E
H
E
EE HE
H
EH
H EE
H
E
H
H EH
E
EEE EE
H
EE
HEE
EE
H
E
H
EE
HE
E
E
HEH
EE
EE
H
E
H
E
EE
HE
E
HE
H
EE
H
EH
E
E
EE
E
HE
E
E
EEDE DE
H
E
EE
H
H
E
E
EE
H
E
H
E
E
H
H
E
H
HE
E
H
EE
H
EH
HE
HE
HE
HE
E
HE
HE
H
E
HE
H
H
E
H
E
E
H
EE
H EH
E
E
H
E
H
EE
H
EH
E
H
E
HH
E
H
E
H
E
HE
HE
H
E
EE
H
E
H
E
H E
H
HE
E H E
HE
E
H
E
E
HE
HE
HE
H
E
H
E
HE
H
E
E
H
E
H
E
H
E
H
H
E
H
E
HE
HE
H
E
H
E
HE
HE
H
E
HE
H
E
H
E
H
E
E
H
E
H
E
D
H C
H
C
H
A
H
A
H
H
A
H
A
H
A
H
A
A
H
A
H
A
H
A
H
AH
PROPOSED
EWART UNIT NO. 11
EWART UNIT 9
PROPOSED
EWART UNIT NO. 12
T8T8
R28W1
R28W1
sharon.baker
Typewritten Text
Figure No. 2

sharon.baker
Typewritten Text
Figure No. 3

ewart unit 12 well list.lwell 2014-03 to 2016-07 15478.2 m3
5 LODGEPOL 0.0 E3m3
Oil DALY (1) 2340.2 m3
Producing 59A 0.0 m3
0.0 E3m3
0.0 m3
© IHS, 1991 - 2016 Created in AccuMap Datum: NAD27TM
Printed on 11/1/2016 1:32:39 PMPage 1/1
sharon.baker
Typewritten Text
Figure No. 4

sharon.baker
Typewritten Text
Figure No. 5
sharon.baker
Typewritten Text

sharon.baker
Typewritten Text
Figure No. 6
sharon.baker
Typewritten Text
Primary Recovery

sharon.baker
Typewritten Text
Figure No. 7
sharon.baker
Typewritten Text
Primary Recovery

sharon.baker
Typewritten Text
Figure No. 8
sharon.baker
Typewritten Text
Primary Recovery + 3 Infill Wells
sharon.baker
Typewritten Text
3 infill wells on production

sharon.baker
Typewritten Text
Figure No. 9
sharon.baker
Typewritten Text
Primary Recovery + 3 Infill Wells

sharon.baker
Typewritten Text
Figure No. 10
sharon.baker
Typewritten Text
sharon.baker
Typewritten Text
Waterflood + 3 Infill Wells
sharon.baker
Typewritten Text
sharon.baker
Typewritten Text
sharon.baker
Typewritten Text
2 wells converted to injection
sharon.baker
Typewritten Text
1 well converted to injection
sharon.baker
Typewritten Text

sharon.baker
Typewritten Text
Figure No. 11
sharon.baker
Typewritten Text
sharon.baker
Typewritten Text
Waterflood + 3 Infill Wells
sharon.baker
Typewritten Text

FIGURE NO. 12 Sinclair Water Injection System
100/14-30-7-28
M
MSource
Well
2500 Bbl 2500 Bbl
Charge
4-1-8-29 Filter Plant Existing Water Injection Facilities (WP)
InjectionPump
Filters
M
M
M
M
M
M
M
M
M
M
InjectionPump
SinclairUnit#5
Ewart Unit#2
Ewart Unit#6
Sinclair Unit#3
Ewart Unit#10
Ewart Unit#8
M
M
Charge
Ewart Unit#1
Sinclair Unit#12
Sinclair Unit#2
Ewart Unit#7
Ewart Unit#11
Ewart Unit#12
TYPICAL CEMENTED LINER WATER INJECTION WELL (WIW) DOWNHOLE DIAGRAMWELL NAME: Tundra Ewart Unit 12 HZNTL Cemented Liner WIW WELL LICENCE:
Prepared by CP (average depths) Date: 2016
Elevations :
KB [m] KB to THF [m] TD [m] 2400.0
GL [m] CF (m) PBTD [m]
Current Perfs: Cemented Casing / Liner 950.0 to 2400.0
Current Perfs: to
KOP: 600 m MD Total Interval to
Tubulars Size [mm] Wt - Kg/m Grade Landing Depth [mKB]
Surface Casing 244.5 48.06 H-40 - ST&C Surface to 140.0
Intermed Csg (if run) 139.7 34.23 & 29.76 J-55 - LT&C Surface to 900.0
Production Liner 114.3 17.26 L-80 Surf or from Intermed Csg to 2400.0
Tubing 60.3 or 73.0 - TK-99 6.99 or 9.67 J-55 Surface to 900.0
Date of Tubing Installation: Length Top @
Item Description K.B.--Tbg. Flg. 0.00 m KB
Corrosion Protected ENC Coated Packer (set near TD of intermediate casing, if run)
60.3 mm or 73 mm TK-99 Internally Coated Tubing
SC = 140mKB TK-99 Internally Coated Tubing Pup Jt
Coated Split Dognut
Annular space above injection packer filled with inhibited fresh water
Bottom of Tubing mKBRod String :
Date of Rod Installation:
Bottomhole Pump:
Directions:
KOP = ~ 600 mMD
Inhibited Annular Fluid
Packer set near TD of intermediate casing) Fractures
Tubing bottom Hz Lateral 114.3 mm Casing Liner Cement
Intermediate Casing, if run
Tundra Oil And Gas Partnership
0
sharon.baker
Typewritten Text
Figure No. 13

** subject to final design and engineering
Ewart Unit No. 12
EOR Waterflood Project Planned Corrosion Control Program ** Source Well
• Continuous downhole corrosion inhibition • Continuous surface corrosion inhibitor injection • Downhole scale inhibitor injection • Corrosion resistant valves and internally coated surface piping
Pipelines
• Source well to 4-1-8-29 Water Plant - Fiberglass • New High Pressure Pipeline to injection well – 2000 psi high pressure Fiberglass
Facilities
• 4-1-8-29 Water Plant and New Injection Pump Station o Plant piping – 600 ANSI schedule 80 pipe, Fiberglass or Internally coated o Filtration – Stainless steel, HDPE Poly, fiberglass materials o Pumping – Ceramic plungers, stainless steel disc valves o Tanks – Fiberglass shell, corrosion resistant valves
Injection Wellhead / Surface Piping
• Corrosion resistant valves and internally coated surface piping Injection Well
• Casing cathodic protection where required • Wetted surfaces coated downhole packer • Corrosion inhibited water in the annulus between tubing / casing • Internally coated tubing surface to packer • Surface freeze protection of annular fluid • Corrosion resistant master valve • Corrosion resistant pipeline valve
Producing Wells
• Casing cathodic protection where required • Downhole batch corrosion inhibition as required • Downhole scale inhibitor injection as required
FIGURE 14

Proposed Ewart Unit No. 12
Application for Enhanced Oil Recovery Waterflood Project
List of Tables
Table 1 Land Information and Tract Participation
Table 2 Original Oil in Place and Recovery Factors
Table 3 Current Well List and Status
Table 4 Original Oil in Place

Tra
ct N
o.
Lan
d D
esc
rip
tio
nO
wn
er
Sh
are
(%
)O
wn
er
Sh
are
(%
)
10
1-2
0-0
08
-28
W1
MT
un
dra
Oil
& G
as
Pa
rtn
ers
hip
10
0%
Min
iste
r o
f F
ina
nce
- M
an
ito
ba
10
0.0
00
%1
1.8
77
46
37
74
20
2-2
0-0
08
-28
W1
MT
un
dra
Oil
& G
as
Pa
rtn
ers
hip
10
0%
Min
iste
r o
f F
ina
nce
- M
an
ito
ba
10
0.0
00
%1
1.5
18
05
90
94
30
3-2
0-0
08
-28
W1
MT
un
dra
Oil
& G
as
Pa
rtn
ers
hip
10
0%
Min
iste
r o
f F
ina
nce
- M
an
ito
ba
10
0.0
00
%1
2.6
25
57
03
20
40
4-2
0-0
08
-28
W1
MT
un
dra
Oil
& G
as
Pa
rtn
ers
hip
10
0%
Min
iste
r o
f F
ina
nce
- M
an
ito
ba
10
0.0
00
%1
3.8
19
24
10
56
50
5-2
0-0
08
-28
W1
MT
un
dra
Oil
& G
as
Pa
rtn
ers
hip
10
0%
Min
iste
r o
f F
ina
nce
- M
an
ito
ba
10
0.0
00
%1
4.9
05
17
80
46
60
6-2
0-0
08
-28
W1
MT
un
dra
Oil
& G
as
Pa
rtn
ers
hip
10
0%
Min
iste
r o
f F
ina
nce
- M
an
ito
ba
10
0.0
00
%1
2.8
74
69
27
01
70
7-2
0-0
08
-28
W1
MT
un
dra
Oil
& G
as
Pa
rtn
ers
hip
10
0%
Min
iste
r o
f F
ina
nce
- M
an
ito
ba
10
0.0
00
%1
1.0
36
24
09
53
80
8-2
0-0
08
-28
W1
MT
un
dra
Oil
& G
as
Pa
rtn
ers
hip
10
0%
Min
iste
r o
f F
ina
nce
- M
an
ito
ba
10
0.0
00
%1
1.3
43
55
40
58
10
0.0
00
00
00
00
TA
BLE
NO
. 1
: T
RA
CT
PA
RT
ICIP
AT
ION
FO
R P
RO
PO
SE
D E
WA
RT
UN
IT N
O.
12
Wo
rkin
g I
nte
rest
Ro
ya
lty
In
tere
st
Tra
ct P
art
icip
ati
on
(%
)

LS
D-S
EC
TW
P-R
GE
UW
IO
OIP
(m3)
Hz
Allo
cate
d C
um
P
rod
n A
ug
ust
201
6(m
3)
OO
IP -
Cu
m
Oil
Pro
dn
(m
3)T
ract
Fac
tor
(%)
UW
I01
-20
008-
28W
1M10
0/01
-20-
008-
28W
1M10
1,99
619
51.2
100,
044
11.8
7746
3774
100/
01-2
0-00
8-28
W1M
02-2
000
8-28
W1M
100/
02-2
0-00
8-28
W1M
99,0
5320
35.9
97,0
1711
.518
0590
9410
0/02
-20-
008-
28W
1M03
-20
008-
28W
1M10
0/03
-20-
008-
28W
1M10
8,38
020
34.7
106,
346
12.6
2557
0320
100/
03-2
0-00
8-28
W1M
04-2
000
8-28
W1M
100/
04-2
0-00
8-28
W1M
118,
129
1728
.511
6,40
013
.819
2410
5610
0/04
-20-
008-
28W
1M05
-20
008-
28W
1M10
0/05
-20-
008-
28W
1M12
7,40
318
55.8
125,
547
14.9
0517
8046
100/
05-2
0-00
8-28
W1M
06-2
000
8-28
W1M
100/
06-2
0-00
8-28
W1M
110,
537
2092
.610
8,44
412
.874
6927
0110
0/06
-20-
008-
28W
1M07
-20
008-
28W
1M10
0/07
-20-
008-
28W
1M95
,052
2093
.092
,959
11.0
3624
0953
100/
07-2
0-00
8-28
W1M
08-2
000
8-28
W1M
100/
08-2
0-00
8-28
W1M
97,5
3719
89.9
95,5
4711
.343
5540
5810
0/08
-20-
008-
28W
1M85
8,08
615
781.
584
2,30
510
0.00
0000
000
TR
AC
T F
AC
TO
RS
BA
SE
D O
N O
IL-I
N-P
LA
CE
(O
OIP
) L
ES
S C
UM
UL
AT
IVE
OIL
PR
OD
UC
ED
ME
TH
OD
TA
BL
E N
O. 2
: T
RA
CT
FA
CT
OR
CA
LC
UL
AT
ION
S
PR
OP
OS
ED
EW
AR
T U
NIT
NO
. 12
TA
BLE
NO
. 3
Pro
po
sed
Ew
art
Un
it 1
2 W
ell
Lis
t
UW
I
Lice
nse
Nu
mb
er
Rig
Re
lea
se
Da
teT
yp
e
Po
ol
Na
me
Pro
du
cin
g
Zo
ne
Mo
de
On
Pro
d
Da
teP
rod
Da
te
Ca
l D
ly
Oil
(m3
/d)
Mo
nth
ly
Oil
(m3
)
Cu
m P
rd
Oil
(m3
)
Ca
l D
ly
Wa
ter
(m3
/d)
Mo
nth
ly
Wa
ter
(m3
)
Cu
m P
rd
Wa
ter
(m3
)
WC
T
(%)
10
0/0
1-2
0-0
08
-28
W1
/00
09
80
52
/26
/20
14
Ho
rizo
nta
lLO
DG
EP
OLE
ALO
DG
EP
OL
Pro
du
cin
g3
/16
/20
14
Au
g-2
01
66
.52
00
.47
75
0.3
0.8
24
.31
46
1.6
10
.81
10
2/0
4-2
0-0
08
-28
W1
/00
10
56
1N
/AH
ori
zon
tal
N/A
N/A
N/A
10
3/0
5-2
0-0
08
-28
W1
/00
10
56
2N
/AH
ori
zon
tal
N/A
N/A
N/A
10
4/0
5-2
0-0
08
-28
W1
/00
10
56
3N
/AH
ori
zon
tal
N/A
N/A
N/A
10
0/0
8-2
0-0
08
-28
W1
/00
09
79
62
/18
/20
14
Ho
rizo
nta
lLO
DG
EP
OLE
ALO
DG
EP
OL
Pro
du
cin
g3
/13
/20
14
Au
g-2
01
63
.31
02
.98
03
1.2
0.1
4.1
90
7.0
3.8
3
15781.5
2368.6

TABLE NO. 4: OOIP Calculation
UWIAverage
Thickness (m)OOIP (m3) OOIP (bbls)
Average Net:Gross: 0.381
01-20-008-28W1M 7.3834 101,996 641,533 Average Porosity: 12.5%
02-20-008-28W1M 7.1722 99,053 623,025 Sw: 25.0%
03-20-008-28W1M 7.8400 108,380 681,692 Boi: 1.1
04-20-008-28W1M 8.5472 118,129 743,007
05-20-008-28W1M 9.2071 127,403 801,339
06-20-008-28W1M 7.9863 110,537 695,255
07-20-008-28W1M 6.8866 95,052 597,858
08-20-008-28W1M 7.0649 97,537 613,490
Total: 858,086 5,397,199

Proposed Ewart Unit No. 12
Application for Enhanced Oil Recovery Waterflood Project
LIST OF APPENDICES
Appendix 1 Ewart Unit No. 12 -- Offsetting Units
Appendix 2 Ewart Unit No. 12 – Structural Cross Section
Appendix 3 Ewart Unit No. 12 – Lodgepole Dolomite Isopach
Appendix 4 Ewart Unit No. 12 – Mississippian Structure
Appendix 5 Ewart Unit No. 12 – Dolomite Core PDPK data Appendix 6 Ewart Unit No. 12 – Dolomite Reservoir Phi*h