Ew Afgewerkte Final
59
1 Sint-Romboutscollege Mechelen Fascinating Magnetism! The phenomena caused by the magnetic field of the sun Promotor: de Heer L. VERVOORT C. VERBEKE Grieks-Wiskunde 6D, nr. 5 Schooljaar 2008-2009
-
Upload
christineverbeke -
Category
Documents
-
view
222 -
download
0
Transcript of Ew Afgewerkte Final

832019 Ew Afgewerkte Final
httpslidepdfcomreaderfullew-afgewerkte-final 159
1
Sint-Romboutscollege
Mechelen
Fascinating MagnetismThe phenomena caused by the magnetic field of the sun
Promotor de Heer L VERVOORT C VERBEKE
Grieks-Wiskunde
6D nr 5
Schooljaar 2008-2009
832019 Ew Afgewerkte Final
httpslidepdfcomreaderfullew-afgewerkte-final 259
2
Preface
Satisfaction this is what I first felt when I realised I finished my final work Itrsquos great to be
capable of saying I reached my purpose and overlook the result To realise it I spent a lot of
time on it learning tremendously and having fun at the same time
Thatrsquos why I would like to thank some people who supported and helped me to complete this
paper First I would like to thank my Dad because he has been supporting me from the very
beginning starting at creating ideas for my final work until finishing the very last bit I would
like to thank my Mum for driving me to the library every time and the people of Urania who
made it possible for me to lend out the books I needed for this paper and especially Mrs
Jozefa De Laet
I thank my school the Sint-Romboutscollege for making it possible to make this paper and
for letting me experience this I thank Mrs Messiaen because she checked my final work on
English grammar and spelling I want to thank Mr Onsia too for willing to answer questions
and for his concern Last but not least I would like to thank my promoter Mr Vervoort for thegreat confidence in me for helping me for reading my final work and giving good advice
Thanks to all Enjoy the reading
Christine Verbeke
832019 Ew Afgewerkte Final
httpslidepdfcomreaderfullew-afgewerkte-final 359
3
A summary of my paper generated by Wordle
832019 Ew Afgewerkte Final
httpslidepdfcomreaderfullew-afgewerkte-final 459
4
Table of contents
Introduction 6
Chapter 1 Anatomy of the sun 7
11 The three outer layers of the sun 712 The photosphere 7
13 The chromosphere 7
14 The corona 8
Chapter 2 Observation of the sun 10
21 History 10
22 Light 10
221 Visible light 10
222 Composition of light 11
223 Non-visible light 11
23 Spectroscopy 11231 Introduction to spectroscopy 11
232 Continuous spectrum 11
233 Line spectrum 11
2331 Absorption spectrum 11
2332 Emission spectrum 12
234 The Zeemaneffect 12
Chapter 3 The solar cycle 13
31 Introduction 13
32 Differential rotation 13
33 When the years passhellip 13
34 Other cycles 15
341 The 22-year-cycle 15
342 The 27-day-cycle 15
343 Other cycles 16
35 Solar maximum and minimum 16
36 Mysteries of the solar cycle 16
Chapter 4 Phenomena caused by the magnetic field of the sun 17
41 Sunspots 17
411 What are sunspots 17412 What do sunspots look like 17
42 Prominences 18
421 What is a prominence 18
422 What is a prominence made of 19
423 How do prominences originate 19
424 What do prominences look like 20
4241 Different groups of prominences 20
4242 Quiescent prominences 20
4243 Active prominences 20
4244 Eruptive prominences 20
43 Coronal holes 2144 Corona loops 21
832019 Ew Afgewerkte Final
httpslidepdfcomreaderfullew-afgewerkte-final 559
5
441 What is a corona loop 21
442 Where and when do corona loops originate 21
45 Solar flare 22
451 What is a solar flare 22
452 Where and how do sun flares originate 23
46 Coronal mass ejections 24461 What is a coronal mass ejection 24
462 Reconnection 24
47 Solar wind 25
471 What is the solar wind 25
472 What do we know about the solar wind 25
473 Heliosphere 26
Conclusion 27
Glossary 28
Appendix I The sun in figures 31
Appendix II Anatomy of the sun 33
Appendix III Granulation 34
Appendix IV Spicules 35
Appendix V The most important satellites observing the sun 36
Appendix VI Wavelengths 41
Appendix VII Absorption lines in the sunrsquos spectrum 42
Appendix VIII The solar cycle 43
Appendix IX Butterfly-diagram 44
Appendix X The Wolf-numbers 45
Appendix XI Filaments and prominences 49
Appendix XII The reconnection of magnetic loops 50
Appendix XIII Different prominences 51
Appendix XIV Polar crown 53
Appendix XV Coronal holes 54
Appendix XVI Coronal mass ejection 55
Bibliography 56
Webography 58
832019 Ew Afgewerkte Final
httpslidepdfcomreaderfullew-afgewerkte-final 659
6
Introduction
The sunrsquos magnetic field and its effect on the sunrsquos plasma 1 are complex phenomena to
understand and to explain However even if yoursquore not an expert on this subject you still
should be capable to understand this paper on the magnetic field of the sun
In the first chapter you will find an introduction to the anatomy of the sun which can be
helpful to understand the phenomena described in the following chapters Chapter two
contains some history and facts about the observation of the sun always interesting to know
Next you will find a brief explanation of the sunrsquos magnetic field in chapter three and four
Chapter three deals with the magnetic field from a long term perspective It describes the so-
called solar cycle Chapter four is about the magnetic field on a smaller scale Sunspots and
solar flares are well-known but what is the underlying explanation for these phenomena
I must admit that science is not yet capable to fully explain all the phenomena that originate
from the sunrsquos magnetic field Most of the time astronomers can explain what happens butthey cannot tell exactly why Thatrsquos why astronomy is an important science and even today a
lot of questions remain unresolved
1 Words which are explained in the glossary are marked with a
832019 Ew Afgewerkte Final
httpslidepdfcomreaderfullew-afgewerkte-final 759
7
Chapter 1 Anatomy of the sun
11 The three outer layers of the sun
The three outer layers of the sun are the photosphere the chromosphere and the corona
In these three layers the phenomena caused by the magnetic field take place You can find thesun in figures in appendix I and a cross-cut of the sun in appendix II
12 The photosphere2
If we look at the sun3 it is the photosphere (sphere of light) we can see The photosphere is
the innermost of the three outer layers and it is about 500km thick which is negligible in
comparison with the sunrsquos total diameter Because the other two layers are transparent to most
wavelengths of visible light we see through them and hence we see the photosphere The
photosphere has a temperature of around 5800K and consists of plasma It emits 99 of the
total radiation4 Only by observing the suns surface we can already spot different phenomena for example granulation (see appendix III) caused by convection A super
granule can even reach a diameter larger than the earthrsquos and can contain more than 900
smaller granules We can also observe sun spots that are caused by the suns magnetic field
This phenomenon will be discussed in section 41
13 The chromosphere5
The chromosphere (lsquocolour spherersquo) is the layer above the photosphere It is about 10 000
kilometres thick Hence it is also a thin layer of the sunrsquos structure because it is just one
percent of the sunrsquos total diameter For centuries this layer has been only visible during total
solar eclipses (see figure 1) Nowadays astronomers are able to continuously observe the
chromosphere by using special filters that let only pass light with wavelengths that are
strongly emitted by the chromosphere and (almost) not by the photosphere In observation
many different emission lines can be detected but the Hα is the brightest for the
photosphere Hα means that the emitted light of the chromosphere is coming from hydrogen
atoms Thatrsquos why the chromosphere spreads out a red glue The chromosphere is colder than
the photosphere The temperature falls to 4000K but if we move further away from the sun
the temperature will increase again which is very surprising since we move outwards It will
even reach a temperature of 10 000K In the colder chromosphere we can find lots of jets of
gas which are called spicules Spicules can last for several minutes and every second morethan 300 000 spicules cover the sunrsquos chromosphere6 A picture of such spicules can be found
in appendix IV
2 COMINS NF and KAUFMANN III WJ Discovering the universe eighth edition WH Freeman and
Company New York 2008 p 288-2893 Never try to look at the sun without special eye protection or if you are using a telescope without a safe
solar filter 4 LILENSTEN J and BORNAREL J Sous les feux du soleil EDP Sciences Les Ulis Cedex A 2001 p 245 COMINS NF and KAUFMANN III WJ Discovering the universe eight edition WH Freeman and
Company New York 2008 p 2906COMINS NF and KAUFMANN III WJ Discovering the universe eighth edition WH Freeman and
Company New York 2008 p291
832019 Ew Afgewerkte Final
httpslidepdfcomreaderfullew-afgewerkte-final 859
8
Figure 1 The chromosphere spreading out red
httpwwwwindowsucaredusunimageseclipsechromosphere_sun_eclipse_1999jpg
14 The corona7
A lot of people have already seen a (partial) solar eclipse On some places when the moon is
completely in front of the sun we can see a wonderful glow appearing around the dark
shadow of the moon This wide-stretched expanding glue of light is called the corona
However we cannot see the suns corona when there isnt a solar eclipse because the light
emitted by the suns surface outshines the coronas light by far Yet we can use a coronagraph
to observe the sun This instrument is like a telescope but it covers the surface of the sun with
a black circle If we take a closer look at the suns corona we can distinguish some visible
structures such as corona loops which are explained in chapter 4 The lines which can be
observed in the corona suggest that the sun has a strong magnetic field
Figure 2 The sunrsquos corona
httpapodnasagovapodap060407html
The corona extends millions of kilometres into space and is a very tenuous layer of the sun
Yet it reaches a temperature of over one million Kelvin This enormous increase of the
temperature was discovered around 1940 by Bengt Edleacuten (a Swedish professor of physics and
astronomer who was specialized in spectroscopy 1906-1993) who did some experiments
with ionized gas8 The spectrum of the sunrsquos corona contained much emission lines from
7
SMITS F lsquoDe coronarsquo Heelal February 1999 p 40-428GREEN SF and JONES M H An introduction to the Sun and Stars The Open University Cambridge
2004 p 31
832019 Ew Afgewerkte Final
httpslidepdfcomreaderfullew-afgewerkte-final 959
9
some highly ionised elements for example Fe13+ which tells us that the corona has a
temperature from one million Kelvin up to two million Kelvin 9 Despite this very high
temperature the corona has a very low density If it had the density of the sunrsquos surface it
would certainly outshine the photosphere10
Yet not all the secrets of the corona have been solved yet Some scientists already had someideas of where the high temperature of the corona comes from but none of them are fully
satisfactory One of the explanations is the theory of the spicules These spicules would heat
the temperature of the corona since they are very common on the sunrsquos surface On the other
hand it is possible that little solar flares heat up the corona Their amount seems so large that
these small solar flares can be an important element in the explanation for the high
temperature of the sunrsquos corona But the most acceptable explanation so far is the one of the
Alfveacuten waves11 Alfveacuten waves are formed by the local movement of the magnetic fields The
gas in the corona moves upwards and downwards along the magnetic field lines But the gas
struggles against this vibration The Alfveacuten wave will lose its energy and it will convert this
energy into heat But there are also many other possible explanations for the extremely high
temperature of the sunrsquos corona Recently the idea of reconnection has been developed Theconcept of the reconnection is briefly explained in the section of solar flares 12
The sunrsquos corona may look ordinary but yet it gives birth to an event that is called the solar
wind (see chapter 4) This solar wind is caused by an outflow of gases coming from the
sun13 Itrsquos important to understand how the solar wind works because the solar wind can
cause some aggravating side effects on earth for example it can cut off the electricity on earth
for millions of people or disturb the working of satellites if it gets too strong But the solar
wind also causes the beautiful phenomenon of the aurora on earth Yet this is not the focus
of this paper
9 GREEN SF and JONES M H An introduction to the Sun and Stars The Open University Cambridge2004 p 3110
NASA The corona Internet (httpsolarsciencemsfcnasagovcoronashtml) 180107COMINS NF and KAUFMANN III WJ Discovering the universe eighth edition WH Freeman andCompany New York 2008 p 29111 DAY C Alfveacuten waves may heat the Sunrsquos corona Internet (httpblogsphysicstodayorgupdate200903alfven-waves-may-heat-the-sunshtml) 310309
12 JANSSENS J Zon en aarde een unieke relatie Garant Antwerpen 2003 p 4913BEATTY JK PETERSEN CC and CHAIKIN A The new solar system eighth edition Cambridge
University Press Cambridge 1999 p 28
832019 Ew Afgewerkte Final
httpslidepdfcomreaderfullew-afgewerkte-final 1059
10
Chapter 2 Observation of the sun
21 History
Men have been observing the sun from the very beginning We know that the sun was very
important for the prehistoric people many historical monuments testify this One of the mostfamous monuments is Stonehenge14 Men were constructing Stonehenge for centuries during
the Stone Age We cannot assume that ancient observers of the sun could predict solar
eclipses but they were able to build a construction that was adjusted to the rising of the sun
on special days such as Solstice Stonehenge is not the only example of the importance of
the sun over the years There is also Newgrange a well-known passage-tomb situated in
Ireland north of Dublin and many other monuments
In the beginning our sun was regarded as a God Nowadays we no longer see the sun as a
God or a natural force But still the sun is strongly influencing our lives It still provides us
with light and warmth and makes it possible to live on earth Many scientists have been
interested in the sun All of them wanted to know how the sun really functions
Letrsquos take a quick tour through the history of the observation of the sun Scientists of ancient
China made the first record of a solar eclipse in 2134 BC In the Middle Ages Galileo (1564-
1642) used the first telescope to map the sunspots he saw on the sunrsquos surface
Unfortunately he watched through his telescope without a special filter blinding himself On
April 2 1845 Louis Feacutezeau and Leacuteon Foucault had a world scoop they took the first
photograph of the sun clearly registrating the sunspots15
Years later the first satellites observing the sun called OSOrsquos (Orbiting Solar
Observatories)
16
have been launched into space to observe the 11-year-solar cycle between1962 and 197517 Many of them followed the most important satellites observing the sun are
described in appendix V Nowadays satellites keep an eye on the sun every second Still the
mystery of the sun and her magnetic field hasnrsquot been solved completely yet
22 Light18
221 Visible light
Light is a form of electromagnetic waves The light we see is actually only a small fraction of
all the light emitted in the universe A huge part of all the emitted light is not visible to our eyes Thatrsquos why men made telescopes especially designed to observe the light we canrsquot see
with our eyes
14 OFFICIAL SITE OF STONEHENGE About Stonehenge Internet (httpwwwstonehengecouk)(03022009)15
HILL S and CARLOWITZ M The sun Abrams New York 2006 p 82 83 9316
JANSSENS J Zon en aarde een unieke relatie Garant Antwerpen 2003 p 8917
WIKIPEDIA Orbiting Solar Observatory Internet (httpenwikipediaorgwikiOrbiting_Solar_Observatory)2401200918 COMINS NF and KAUFMANN III WJ Discovering the universe eighth edition WH Freeman and
Company New York 2008 chapter 4GREEN SF and JONES M H An introduction to the Sun and Stars The Open University Cambridge 2004 p 18-26
832019 Ew Afgewerkte Final
httpslidepdfcomreaderfullew-afgewerkte-final 1159
11
222 Composition of light
Light is composed of waves Different wavelengths represent different colours The colour of
the light depends on the wavelength λ Wavelength is measured in nanometre Visible light
has a range from 400 nanometre to 700 nanometre It consists of red orange yellow green
blue and violet Of all the visible light violet light has the shortest wavelength and red lightthe longest
223 Non-visible light
As previously mentioned visible light is not the only light in the universe There are many
more wavelengths Maxwell (1831-1879) discovered the infrared radiation This light has a
longer wavelength than red light This however is not visible to the human eye Apart from
infrared light much other not-visible light has been discovered Radio waves have the longest
wavelength of all We use them for example for our mobile phones Gamma rays have the
shortest wavelength of all We use gamma rays for cancer radiotherapy The other wavelengths of light are visible in appendix VI
23 Spectroscopy19
231 Introduction to spectroscopy
An interesting way of observing the sun is using spectroscopy We can distinguish 3
different types of spectra continuous spectrum absorption spectrum and emission spectrum
The last two are called line spectra This means we will not observe the spectrum of the
emitting body itself but we will use another medium in this case thin gas
232 Continuous spectrum
Continuous spectrum means we use the unbroken range of wavelengths to observe objects
emitting light We observe the light emitted by an object directly without using a medium
This method however isnrsquot used very often because itrsquos difficult to observe an object
directly
233 Line spectrum20
2331 Absorption spectrum
For the absorption spectrum we use absorption lines These lines are created by the thin gas
(which gas doesnrsquot matter but the absorption lines will be different then) The wavelengths of
the body we want to observe go through the tin gas but the atoms of the gas will absorb some
of the wavelengths Because those wavelengths are absorbed by the atoms of the gas the
19 GREEN SF and JONES M H An introduction to the Sun and Stars The Open University Cambridge
2004 p 20-2620COMINS NF and KAUFMANN III WJ Discovering the universe eighth edition WH Freeman and
Company New York 2008 p 109-113
832019 Ew Afgewerkte Final
httpslidepdfcomreaderfullew-afgewerkte-final 1259
12
wavelengths cannot appear in the absorption spectrum of the body we observe We can notice
in appendix VII the absence of some wavelengths by the black lines Such lines are called
absorption lines They correspond to the wavelengths that are absorbed by the gas
2332 Emission spectrum
We can also examine the light emitted by the gas The atoms of the gas absorb some
wavelengths emitted by the object we actually want to observe but afterwards they will emit
those wavelengths again as photons This gives us a number of bright lines called emission
lines For many gases the wavelengths of the absorption lines will be the same as those
from the emission lines
234 The Zeemaneffect 21
In 1896 Pieter Zeeman (1865-1943) discovered that some spectrum lines split up A spectrumline emitted in a magnetic field will split up into different spectrum lines close to each other
This is called the Zeemaneffect
If the magnetic field is strong enough and is parallel with the direction of observation the
absorption line splits up into two lines one on the left side of the normal absorption line
(which means a smaller wavelength) and one on the right side of the absorption line (which
means a higher wavelength) If there is a magnetic field straight on our direction of
observation the absorption line will even split up into three lines one line will represent the
normal absorption line the other two will be just like with a parallel magnetic field
Figure 3 The Zeemaneffect
httpchemteaminfoGalleryGallery16html
How does a magnetic field influence an electron We can find an explanation in the Quantum
theory The magnetic field will interact with the atoms so that the electrons will reach
slightly different energy levels Atoms with different energy levels will emit different
wavelengths This explains the multiple lines of the Zeemaneffect
The divergence of the splitting depends on the force of the magnetic field which means we
can determine the size of the magnetic field by observing the Zeemaneffect
21VAN DEN BERGHE S lsquoHet Zeemaneffectrsquo Heelal september 1998 p 228-231
KOPANSKI J Atom Internet (httpknolgooglecomkjan-kopanskiatom1amrwrct7rvi27) 060209
832019 Ew Afgewerkte Final
httpslidepdfcomreaderfullew-afgewerkte-final 1359
13
Chapter 3 The solar cycle
31 Introduction
In this chapter we will concentrate on the long term evolution of the global magnetic field of
the sun It is important to understand the long-term evolution of the global magnetic field of the sun because the global magnetic field has a great influence on the magnetic field on a
local scale The sunrsquos magnetic field changes every 11 years This is why we call it the 11-
year-solar cycle However strictly speaking it is a 22-year-cycle This will be explained later
on in this chapter The record of the first solar cycle started in 175522 Since then itrsquos
currently already the 24th solar cycle
32 Differential rotation
As well as the earth the sun rotates But the sun isnrsquot made of the same matter as our earth on
the surface The sunrsquos surface is made of plasma Because of the plasma the sun will rotateat different speeds depending on latitude At the equator the sun makes a full rotation every
25 days But the rotation will slow down when the latitude increases This means that at the
poles the sun will rotate much slower At the poles the rotation time is 36 days This creates a
gap of more than 10 days23
Astronomers believe that it is only the surface of the sun that undergoes differential rotation
The inner core moves more like a solid body such as the earth but it is still unclear if this is
the case24
33 When the years passhellip25
Differential rotation is the main cause of all the complex phenomena that will be discussed
later on because this differential rotation causes the solar cycle and magnetic disturbance
As mentioned previously before the sunrsquos surface rotates much faster at the equator than at
the poles the plasma around the equator will move faster This is shown in figure 4 on the
next page Since the sun keeps on rotating in the same direction the plasma at the equator will
move much faster26
The magnetic field that the sun normally would have is the same type as the magnetic field of the earth This means the sun normally has the magnetic field resembling to the magnetic field
of a bar magnet Magnetic field lines move from north to south and at the poles the density of
the magnetic field is compact because there the magnetic field lines come together
22 JANSSENS J The case of the missing solar cycle (published in lsquoheelalrsquo January 2008) Internet (httpusers
telenet be jjanssensMSCwebEngpdf)23
DETHIER T Het zonnestelsel Standaard Uitgeverij 1992 p 77-7824
RUSSELL R Rotation of the sun Internet (httpwwwwindowsucaredutourlink=sunSolar_interiorSun_layersdifferential_rotationhtml) 1608200525 CUYPERS J and others lsquoLa rechercheacute en heacuteliophysique en Belgiquersquo Space connection October 2007 p
6-726GREEN SF and JONES M H An introduction to the Sun and Stars The Open University Cambridge
2004 p 72-73
832019 Ew Afgewerkte Final
httpslidepdfcomreaderfullew-afgewerkte-final 1459
14
Figure 4 The magnetic field lines of the sun change because of the differential rotation
httpircameraasarizonaeduNatSci102lecturessunhtm
If we apply the differential rotation on this magnetic field the magnetic field lines under the
photosphere of the sun will move faster at the equator This will cause the following
structure seen on figure 4 on the sun in the middle The magnetic field lines will continue to
get mixed up and the magnetic field lines will pile up This process takes several years
Finally the magnetic field lines will be stacked almost parallel to the sunrsquos equator This is
the sun on the right side in figure 427 You can find a more specific drawing of this process in
appendix VIII
Eventually after approximately eleven years the magnetic field lines will be piled up in such
a way that finally the magnetic field lines will start to pop out of the sunrsquos surface This willcause sunspots Sunspots appear in pairs one with a south ldquopolerdquo and one with a north
ldquopolerdquo The north ldquopolerdquo contains magnetic field lines that are directed outwards and the south
ldquopolerdquo contains magnetic field lines that point inwards28 Sunspots are discussed in more
detail in the next chapter When the sunspots almost come to an end the loops will reconnect
with another sunspot over the equator This connection will cause a switch of the poles (see
figure 5) The South Pole will become the North Pole and vice versa This model is called the
magnetic dynamo proposed by Horace Babcock (1912-2003)29
27GREEN SF and JONES M H An introduction to the Sun and Stars The Open University Cambridge
2004 p 72-7328 LANG KR Sun earth and sky Springer Germany 1995 p 8229
COMINS NF and KAUFMANN III WJ Discovering the universe eighth edition WH Freeman andCompany New York 2008 p 297-298JANSSENS J lsquohet maximum van de 23ste zonnenvlekkencyclus (II)rsquo Heelal November 1998 p 284
832019 Ew Afgewerkte Final
httpslidepdfcomreaderfullew-afgewerkte-final 1559
15
Figure 5 The switching of the magnetic poles of the sun
GREEN SF and JONES M H An introduction to the Sun and Stars The Open University Cambridge 2004 p73
When finally the poles have switched and the magnetic field lines are disentangled the cycle
will just start over again for another eleven years Because the magnetic poles of the sun
switch every eleven years the cycle is called the 11-year-solar cycle
34 Other cycles
341 The 22-year-cycle
If we take the magnetic poles into account however the 11-year-cycle becomes a 22-year-
cycle because the magnetic poles switch If we want to consider the strict cycle which means
that we take the magnetic poles into account we have to call the solar cycle a 22-year-cycleIt takes eleven years to switch the magnetic North Pole into a South Pole and another eleven
years to switch them back This cycle is called the Hale-cycle named after George Ellery
Hale (1868-1938) who was an American solar astonomer and active in different
observatories30
342 The 27-day-cycle31
The 27-day-cycle taking the average of the sunrsquos rotation time is a cycle that is directly
connected to the rotation time of the sun The sunspots the coronal holes and other
phenomena that are related to the activity of the sun rotate too This means that the activity of the sun is connected to the rotation cycle For example the part of the sun that we can see will
be less active when the sunspots are not visible because the sunspots influence the solar
activity When the sunspots appear again the activity of the sun will rise This cycle is also
known because of the coronal holes that influence the solar wind
30JANSSENS J lsquohet maximum van de 23
stezonnenvlekkencyclus (II)rsquo Heelal November 1998 p 284-290
31 JANSSENS J Zon en aarde een unieke relatie Garant Antwerpen 2003 p 113
832019 Ew Afgewerkte Final
httpslidepdfcomreaderfullew-afgewerkte-final 1659
16
343 Other cycles
Astronomers believe that there must be some other cycles of an even longer basis Different
researchers have been looking for other solar cycles Some thought they found a 55-year
cycle However this cycle was very irregular Max Waldmeier (1912-2000 a very eminent
solar astronomer of the 20th
century) found a 90-year-cycle However lots of other cycleshave been ldquofoundrdquo There have been postulated a 2300-year-cycle too But the records of
solar cycles are too recent to prove this cycle 32
35 Solar maximum and minimum
The Royal Greenwich Observatory has been observing the sunspots since 1874 The
information of their observations includes the size the position and the number of sunspots
during all the recorded solar cycles If we put all this information into a graph we can see the
so-called butterfly-graph (appendix IX) With this information we can conclude that sunspots
do not appear at random33
At the beginning of a new solar cycle the first sunspots appear at latitude of 45 degrees Later
on sunspots will appear at the equator too When the sunspots begin to appear at 45 degrees a
new cycle has started again34 The solar minimum is the starting point of the solar cycle At
the beginning sunspots are very rare sometimes there are none If there are any sunspots they
will occur at higher latitudes The solar activity is the least on solar minimum Then it is a
good time for astronauts to go into space because there are less sunspots and less solar flares
and other phenomena that can influence the solar wind and so the space weather When the
solar activity is the highest the solar cycle reaches its maximum There will be a lot of
sunspots which now occur on lower latitudes too35 The time to go from a solar minimum to a
solar maximum is around four years During this time the solar activity will rise and when it
reaches its maximum it will slowly decline The decrease takes much more time than the
increase of the solar activity around 7 years The time between a solar minimum and
maximum and between a solar maximum and minimum can vary and is different for every
solar cycle36
36 Mysteries of the solar cycle
Astronomers have been able to find out a lot of details about the solar cycle However we are
still not able to predict the maximums and minimums of the solar cycles preciselyAstronomers havenrsquot been capable to draw up a model that allows us to predict the exact
number of sunspotshellip You can compare it to predictions for the weather to comehellip
32JANSSENS J Zon en aarde een unieke relatie Garant Antwerpen 2003 p 113-114
33HATHAWAY D H The sunspot cycle Internet (httpspacesciencespacerefcomsslpadsolarsunspots
htm) 0401200034 JANSSENS J Zon en aarde een unieke relatie Garant Antwerpen 2003 p 10335
WINDOWS TEAM Maunderrsquos Butterfly Diagram Internet (httpwwwwindowsucaredutourlink=sunactivitybutterflyhtml) 200036 JANSSENS J Zon en aarde een unieke relatie Garant Antwerpen 2003 p 99-100
832019 Ew Afgewerkte Final
httpslidepdfcomreaderfullew-afgewerkte-final 1759
17
Chapter 4 Phenomena caused by the magnetic field of the sun
41 Sunspots
411 What are sunspots
Sunspots appear on the sunrsquos surface when the magnetic field lines under the photosphere
are piled up too much and they finally pop out into the chromosphere Sunspots are normally
found in groups The number of sunspots is dependent on the solar activity when the solar
activity reaches its maximum there will be many more sunspots than at solar minimum
Measuring the magnetic field in sunspots with the Zeemaneffect makes clear that the
strength of the magnetic field is much stronger in sunspots than in the surrounding
photosphere Itrsquos more than thousand times stronger the magnetic field strength in magnetic
fields varies from 1000 to 4000 Gauss while the surrounding area circles around 1 Gauss
(comparison the earthrsquos magnetic field strength is about 05 Gauss)37
412 What do sunspots look like
When magnetic field lines pop out of the photosphere they will form magnetic loops (figure
6 on the right side) Between this magnetic loops there will be formed a flux tube The
magnetic field lines in the sunspot will distort the convection under the surface (see figure 6
on the left side) They will pull the plasma downwards and will prevent the warm plasma
from going upwards and reach the sunrsquos surface Eventually the temperature in the sunspot
will cool down38
Figure 6 Left side convection in sunspotsRight side magnetic field lines in sunspots
JANSSENS J Zon en aarde een unieke relatie Garant Antwerpen 2003 p41
37
RUSSELL R Sunspots and magnetic fields Internet (httpwwwwindowsucaredutourlink=sunatmospheresunspot_magnetismhtmlampedu=high) 06090838 JANSSENS J Zon en aarde een unieke relatie Garant Antwerpen 2003 p 40-41
832019 Ew Afgewerkte Final
httpslidepdfcomreaderfullew-afgewerkte-final 1859
18
We can distinguish 2 areas the black sunspot and the surrounding bright surface of the sun
The sunspot itself consists of the very dark centre called the umbra and the surrounding
orange-brown environment called the penumbra The penumbra consists of an amount of
small little striated f igures that come out of the umbra A sunspot can reach a diameter of
300 000 kilometres39 The temperature in the sunspots centre is much cooler than in the
photosphere because of the convection explained above It measures around 4 200 K whilethe photosphere has a temperature of 6000 K40
Figure 7 The composition of a sunspot
httpwwwjaxajparticlespecialastroshimizu02_ehtml
A sunspot appears black to our eyes However appearances are deceptive the dark sunspot
only seems dark because we see it against a much warmer environment If we h ad seen itagainst a black surface it would have been much brighter than the moonrsquos glowing41
The amount of sunspots varies from very few till over more than a hundred The amount of
sunspots can be predicted by the Wolf-numbers named after Johann R udolf Wolf (1816-
1893) a Swiss astronomer best known for his research on sunspots42 However I wonrsquot
explain this method in this paper You can find a briefly explanation in appendix X Yet this
method is only capable to predict the amount of sunspots approximately
42 Prominences
421 What is a prominence
The luminosity of the sun outshines lots of phenomena that take place on the surface of the
sun and even far away from the sun The sunrsquos corona is one example But luckily
prominences are quite visibly when we observe the sun A prominence is a huge cloud of gas
that is cooler than his environment It is trapped between two horizontal magnetic field lines
For human eyes it seems to spread out dark but this is only because a prominence has a much
39 LILENSTEN J and BORNAREL J Sous les feux du soleil EDP Sciences Les Ulis Cedex A 2001 p 3540 OTTERSDORF M Astronomy On the sunspot cycle Internet (httpuserszoominternetnet~matto
MCASsunspot_cyclehtmZeeman effect) 03110341JANSSENS J Zon en aarde een unieke relatie Garant Antwerpen 2003 p 41
42 JANSSENS J lsquoHet maximum van de 23ste zonnevlekkencyclus (I)rsquo Heelal October 1998 p 256-263
832019 Ew Afgewerkte Final
httpslidepdfcomreaderfullew-afgewerkte-final 1959
19
lower temperature then the sunrsquos chromosphere (similar to sunspots which spread out dark
too) The dark lines in appendix XI are also known as filaments A filament is a line between
to magnetic fields with opposite polarities (appendix XI)43
Figure 8 A solar prominence
httpcosmic-webcoukp=274more-274
422 What is a prominence made of
The gas from the prominence is coming from the chromosphere So the prominences have
approximately the same composition as the chromosphere A good way to observe
prominences is to use red Hα or blue Hβ spectrum lines Hα absorption lines indicate a
temperature lower than 10 000 Kelvin These spectrum lines justif y that the temperature of a prominence is remarkably lower than the temperature of the corona 44
423 How do prominences originate
A prominence is a result of the magnetic field Particles of the sun can transport warmth very
fast if they move alongside magnetic field lines If they want to move straight to a magnetic
field line the transport of warmth is negligible So prominences that are trapped between 2
magnetic fields only have one way to be heated This brings on a temperature that is notably
lower then the temperature in the corona45
The origin of prominences is similar to the origin of solar flares When two magnetic loops
of opposite polarity start to approach each other they will reconnect and form some new
loops This is shown in appendix XII Some mass from the sun will be trapped between the
new magnetic field lines and will form a solar prominence 46
43COMINS NF and KAUFMANN III WJ Discovering the universe eighth edition WH Freeman and
Company New York 2008 p 29944 SMITS F lsquoProtuberanzenrsquo Heelal Juli 1991 p 18345 LANG KR Sun earth and sky Springer Germany 1995 p 134-14046
MARTENS PC and ZWAAN C Origin and evolution of filament-prominence systems Internet ( httpwwwioporgEJarticle0004-637X558287253575webpdfrequest-id=73e38daa-69ae-4e01-b9a6- b4bd0ba071dd) 092001
832019 Ew Afgewerkte Final
httpslidepdfcomreaderfullew-afgewerkte-final 2059
20
424 What do prominences look like47
4241 Different groups of prominences
As you can see on the pictures in appendix XIII prominences can have different shapes and
forms Thatrsquos why astronomers classify them into different groups the quiescent prominences the active prominences and eruptive prominences
4242 Quiescent prominences
Quiescent prominences can appear everywhere on the sun and are not depending on latitude
They can reach into the corona over 2 500 till 40 000 kilometres Quiescent prominences last
the longest of all prominences Some of them even last several solar rotations long These
prominences are very long and not so wide During its lifetime a quiescent prominence moves
slowly to the poles When they are found at the poles of the sun they are called a lsquopolar
crownrsquo (appendix XIV)48
4243 Active prominences
Their name already suggests where they can be found active prominences are found in the
active regions of the sun moreover in the presence of sunspots These prominences
however only have a short lifespan only several hours But within this short lifespan they do
change form adjusting to the magnetic field lines within a short period of time Because
these prominences are located in active regions there are many more reconnections and so
the form will change more rapidly
4244 Eruptive prominences
These prominences only last a couple of minutes and are connected to active sunspots as well
It is possible that after one died out another immediately gives birth in the same region Other
eruptive prominences are known to be bubbles of gas that are issued from active sunspots
There have been some records of eruptive prominences that bump into other prominences and
push the other prominences back in the sunspot49
47 KNISELY D Solar prominences Internet (httpwwwicstarscomHTMLSolarSectionHAlpha OBSERVINGTHESUNHAlpha3html) (03042009)
SMITS F lsquoProtuberanzenrsquo Heelal Juli 1991 p 182-185
ELLERMAN F Solar prominences Internet (httparticlesadsabsharvardedufull 1928ASPL173E0000074000html) (03042009)48
KNISLEY D Solar prominences Internet (httpwwwicstarscomHTMLSolarSectionHAlphaOBSERVINGTHESUNHAlpha3html) (03042009)49 PRIEST E R Dynamics and Structure of Quiescent Solar Prominences Internet (httpbooksgooglebe
booksid=h599q3jz1w4Campdq=quiescent+prominencesampprintsec=frontcoverampsource=blampots=58b79Qeyabampsig=1eklQ-WszOIebZZaq7fq7gm6bxAamphl=nlampei=urPtSe7ZCo61-Qa166jHDwampsa=Xampoi=book_resultampct=resultampresnum=3PPA6M2) 1989
832019 Ew Afgewerkte Final
httpslidepdfcomreaderfullew-afgewerkte-final 2159
21
43 Coronal holes50
When looking at the sun with an x-ray telescope we can see dark regions across the sun
These dark regions are called coronal holes Coronal holes have an open magnetic field
structure This means that the magnetic fields lines do not angle downwards but they extend
into space indefinitely Due to this the particles of the sun are capable to reach out far intospace without any struggles against the magnetic field With this outflow of gases from the
sun coronal holes are one of the most important sources of the (high-speed) solar wind
(appendix XV)
44 Corona loops
441 What is a corona loop
If we look closer at a pair of sunspots we can see an emission of plasma alongside
magnetic field lines that originate in the sun spots A corona loop can extend into the coronaas the name suggests Those loops contain plasma that can reach a temperature higher than
106 Kelvin Corona loops can best be observed by ultra-violet and x-ray images because of
the high temperature The high temper ature brings on a high vibration of the atoms This
trembling causes the emission of x-rays51
Figure 9 A close up of corona loops
httpwwwdaviddarlinginfoencyclopediaCcoronal_loophtml
442 Where and when do corona loops originate
The magnetic field lines of sunspots move outwards from the sun into the corona and form
broad loops This makes it possible to trap hot gas with a temperature up to 40 million K
Those magnetic field loops trap hot plasma into the sunrsquos atmosphere The magnetic force
pushes particles around along the magnetic lines but at the same time the atoms circulate
around the magnetic field lines (see figure 10) The speed of their movements depends on the
50
ENCYCLODPEDIA OF SCIENCE Corona hole Internet (httpwwwdaviddarlinginfoencyclopediaC coronal_holehtml) (04042009)51 JANSSENS J Zon en aarde een unieke relatie Garant Antwerpen 2003 p 52-54
832019 Ew Afgewerkte Final
httpslidepdfcomreaderfullew-afgewerkte-final 2259
22
density of the magnetic field So if a particle moves from the top of a loop to the bottom it
will slow down just like in traffic jams Eventually it will reach the bottom but the bottom is
highly compressed (because the magnetic field lines converge at the bottom of the loops) so
that the particle will be shot back along the magnetic field line (see figure 10)
Figure 10 the movement of particles in corona loops
GD HOLMAN lsquoThe mysterious origins of solar flaresrsquo Scientific America April 2006 p24-29 volume 294number 4
Hence the particles will move up and down along the magnetic field lines Atoms that are
charged the same will cause electric currents (just like in a battery) These currents will
generate a new magnetic field and the old magnetic field in combination with the new one
will cause a high distortion in the magnetic field of the sun This is the moment when the
corona loop will transform into a solar flare
45 Solar flare52
451 What is a solar flare
A solar flare is a sudden powerful explosion in the solar atmosphere caused by a disruption
in the magnetic field of the sun Because of the disruption mass from the sun will be movedup and form a solar flare A solar flare can equal the energy of billions of atomic bombs
within a few minutes The strongest solar flares are measured during the solar maximums
because then the sunrsquos magnetic activity is the strongest53 Since the sunspots in the presence
of solar flare have a very high magnetic field it is likely that a solar flare would even have a
higher magnetic field But in reality the magnetic field of a solar flare is only half of the
magnetic field of a sunspot The intensity of the magnetic field is lsquoonlyrsquo 500 Gauss54
52 HOLMAN GD lsquoThe mysterious origins of solar flaresrsquo Scientific America April 2006 p 24-31 volume
294 number 453JANSSENS J Zon en aarde een unieke relatie Garant Antwerpen 2003 p 55-57
54 JANSSENS J lsquoZonnefakkelsrsquo Heelal Oktober 1994 p 256
832019 Ew Afgewerkte Final
httpslidepdfcomreaderfullew-afgewerkte-final 2359
23
Figure 11 You can see the magnetic fieldlines in the solar flare on the right side
Large solar flare recorded by SOHO EIT304 instrument 512x512 version Animation (980kMPEG) CourtesySOHO(ESAampNASA)
httpwwwteachersparadisecomencyenwikipediassusunhtml
452 Where and how do sun flares originate
Astronomers have long been speculating how solar flares exactly originate In 1992 Satoshi
Masuda (graduated at the University of Tokyo) discovered on pictures of the Japanese
Yohkoh Satellite that the far end of a solar flare emitted unusually short wavelengths very
short x-rays The source must be a concentration of gas with a temperature of about 100million K concluded Masuda But this discovery provoked some new questions why was the
high temperature at the top of the flare and not at the bottom where the gas is more compact
Why does the plasma stay confined instead of spreading out into the universe In order to
obtain more information to try to solve this problem astronomers started observing the sunrsquos
radiation of ultraviolet and x-rays frequently In 2002 NASA even launched the RHESSI
(Ramaty High Energy Solar Spectroscopic Imager) which was intended to bring solar flares
into pictures55
These observations provided evidence that sun flares surge up in regions where the magnetic
field is very strong ndashmost common in the presence of sun spots At this point we have to call
over the corona loops As mentioned before corona loops are electric currents of atoms
which move alongside magnetic field lines When the atoms are shot back alongside the
magnetic field line there seems to occur a distortion of the magnetic field This distortion will
end up in a solar flare All the mass of the corona loop will be shot into space and form a solar
flare
But how can such enormous mass of the solar flares be shot into s pace This has been a very
interesting question However Peter Alan Sweet (1921-2005)56 succeeded in finding an
55 GD HOLMAN lsquoThe mysterious origins of solar flaresrsquo Scientific America April 2006 p 27 volume 294
number 456UNIVERSITY OF GLASGOW Bibliography of Peter Sweet Internet (httpwwwuniversitystoryglaacuk
biographyid=WH2144amptype=P) (10042009)
832019 Ew Afgewerkte Final
httpslidepdfcomreaderfullew-afgewerkte-final 2459
24
answer already in 1956 If magnetic field lines break apart and then reconnect they bring
together two opposing fields that will cancel each other and cause a huge burst of energy The
reconnection will create new magnetic field lines This reconnection is called the Sweet-
Parker reconnection Yet this is a slow reconnection which cannot take place at the base of a
solar flare with a dazzling speed Fortunately Harry P Petschek published an article about
reconnection in 1964 and solved that problem under certain circumstances it is possible toreconnect much faster which explains solar flares This faster reconnection is also called the
Petschek reconnection But unfortunately with the current technology it is not yet possible to
take pictures of those reconnections57
If the energy comes from the reconnection then where does this reconnection take place
From pictures of solar flares astronomers discovered that at the top of the corona loop a
mysterious x-ray source was found The x-ray source began to give a higher energy level and
at the same time the particles move down towards the sunrsquos surface Yet the x-ray source
stays at the same placehellipThen when the x-rays reach their maximum the loop suddenly
changes direction But this time the x-ray source will move upwards too unexpectedly it
moves at the speed of light approximately three hundred thousands kilometres an hour awayfrom the sun This is the same speed as the coronal mass ejections
46 Coronal mass ejections
461 What is a coronal mass ejection58
Coronal mass ejections (CMErsquos) (appendix XVI) are huge amounts of gas some billions of
plasma from the sun that are ejected into space Their temperature can reach 25 million K59
A coronal mass ejection can last for several hours and it can at last enter the solar wind A
CME can reach a speed of 50kms- 2000kms which means more than 7 million kilometres
an hour60 The mass of a large CME varies from 5 x 10⁶ to 5 x 10¹³ kg61 During a solar
maximum there are more coronal mass ejections than during a minimum but they can occur
at any time of the solar cycle Coronal mass ejections are related both to solar flares and
prominences Very heavy coronal mass ejections can cause some geomagnetic storms on
earth
462 Reconnection
The reconnection of a solar flare can end up in a coronal mass ejection When magneticfield lines that are opposite are starting to reconnect and form new magnetic field lines half of
the magnetic field lines will point downwards and join some existing magnetic loops
However the other part of the magnetic field lines will move upwards at a very high speed
and will form some loops more upwards Between those loops that moved downwards and
those that moved upwards there is some mass that isnrsquot connected to the sun anymore It is
57GD HOLMAN lsquoThe mysterious origins of solar flaresrsquo Scientific America April 2006 p 29 volume 294
number 458
BRAEUNIG R A Glossary Internet (httpwwwbraeunigusspaceglossaryhtm) 200659 LILENSTEN J and BORNAREL J Sous les feux du soleil EDP Sciences Les Ulis Cedex A 2001 p 4460 Cuypers J and others lsquoLa rechercheacute en heacuteliophysique en Belgiquersquo Space connection October 2007 p 10-
1161GREEN SF and JONES M H An introduction to the Sun and Stars The Open University Cambridge
2004 p 68
832019 Ew Afgewerkte Final
httpslidepdfcomreaderfullew-afgewerkte-final 2559
25
known that for an amount of solar flares that this mass between the loops will end up in a
coronal mass ejection Yet this doesnrsquot count for all the solar flares The coronal mass
ejection only takes place if the magnetic field lines twist around each other while forming the
letter lsquoSrsquo (see figure 12)62
Figure 12 Here you can see the reconnection that takes place before the coronal mass ejection starts
httpwwwnasagovmission_pagessolar-bsolar_005html
Certainly we will be capable to answer all the questions about solar flares and coronal mass
ejections in the nearby future But there are also some very interesting questions left what is
at the basis of the acceleration of the atoms in solar flares How does magnetic reconnection
originate Hopefully we will find the answers in the near future
47 Solar wind
471 What is the solar wind
Every second of every day of the year the sunrsquos corona emits a continuous stream of mass
from the sun The temperature of the corona is so high that the sunrsquos magnetic field just
cannot control the outflow of particles We know that the particles are accelerated but
astronomers cannot explain all the details about the solar wind yet
472 What do we know about the solar wind
The speed of the solar wind can change it differs from 300kmh up to 800kmh This speed
depends on the outflow of gases If there is a corona hole pointing towards the earth the solar
wind will reach a speed of around 800kmh The different speeds can interact with each other
and form a new speed according to the rules of light emission When two emissions connect
with each other they can form a faster or slower solar wind just like waves can interact and
form new waves
62BOEN B Birth of a coronal mass ejection Internet (httpwwwnasagovmission_pagessolar-b
solar_005html) 290408
832019 Ew Afgewerkte Final
httpslidepdfcomreaderfullew-afgewerkte-final 2659
26
The ionized atoms with very high temperature coming from the sunrsquos corona are one of the
most important parts of the solar wind but the magnetic fields are important too The
magnetic field outside the sun gets wrapped into a spiral called the Parker-spiral named after
the scientist who described it as the first one (because the sun rotates) This influences the
magnetic field of the sun from the outside The solar wind is emitted in spiral too (see figure
13)
Figure 13 The course of the solar wind caused by the rotation of the sun
httpheliosgsfcnasagovsolarmaghtml
473 Heliosphere
We can describe the heliosphere as a gigantic magnetic bubble around the sun This is
everywhere in space till where the sunrsquos magnetic field reaches and still has an influence The
heliosphere is filled with solar wind although the solar wind has a very low density Yet it
is a very hot wind but because of the very low density it does not have such a great influence
on earth However it can cause some energetic storms on earth63
63 NASA The heliosphere Internet (httpheliosgsfcnasagovheliosphhtml) 20012009
832019 Ew Afgewerkte Final
httpslidepdfcomreaderfullew-afgewerkte-final 2759
27
Conclusion
The sunrsquos magnetic field is a complex system to understand Yet I hope you have learned a
lot from this paper and that you do understand the exiting phenomena described in the
previous chapters
We can discuss the sunrsquos magnetic field from two perspectives The first one is looking at the
magnetic field for global long-term changing dimensions The second way is based on
phenomena on lower scale
The global changes involve the solar cycle and the switch of the magnetic poles The solar
cycle is divided into a decrease of the solar activity until it reaches solar minimum and an
increase of the solar activity until it reaches solar maximum The frequency of the phenomena
that can be found in the outer layers of the sun are directly connected to the solar activity and
thus to the solar cycle Sunspots are the easiest to see they appear as black spots against the
much brighter surface of the sun Corona loops are connected to sunspots and can extend into
solar flares and solar prominences These flares and prominences can burst out into a coronalmass ejection All these phenomena influence the sun and its solar wind how small their part
may be The solar wind has a directly influence on the earth
There is still much to be discovered Astronomers hope to discover much more about the
magnetic field of the sun Today many astronomers and scientists are observing the sun and
every day they discover more and more aspects of the sun Recently a group of researchers
led by David Jess of Queens University Belfast has revealed why the sunrsquos atmosphere is
hotter than its surface64 As you can see astronomy is a very developing science
64
CORDIS Researchers reveal why Suns atmosphere is hotter than its surface Internet (httpcordiseuropaeusearchindexcfmfuseaction=newsdocumentampN_LANG=ENampN_RCN=30598amppid=0ampq=87F36474805A6BEC0B89404F72D0351Famptype=sim) 20032009
832019 Ew Afgewerkte Final
httpslidepdfcomreaderfullew-afgewerkte-final 2859
28
Glossary
Absorption lines A dark line superimposed on a continuous spectrum when a gas absorbs
light from a continuous source that is hotter than the absorbing gas
Aurora Light radiated by atoms and ions formed by the solar wind in the earthrsquos upper atmosphere seen most commonly in the polar regions
Chromosphere The layer in the solar atmosphere between the photosphere and the corona It
is the lowest layer of the atmosphere characterized by reddish hue and by an increase of the
temperature with altitude through all but its lower regions
Convection The transfer of heat from a region of high temperature to a region of lower
temperature by the displacement of the cooler molecules by the warmer molecules The hot
gas will be moved upwards the cool gas will be pushed downwards into the sun
Corona The sunrsquos outer atmosphere It is very extensive and has a very low density It isextremely hot
Coronal hole A dark region of the sunrsquos inner corona as seen at X-ray wavelengths
Coronal loop Closed loops of magnetic field lines extending from the sunrsquos photosphere into
the corona which contain plasma at high temperature They are typically observed through
ultraviolet or x-ray emission from the hot plasma
Coronal mass ejection Large volumes of high energy gas released from the sunrsquos corona
Differential rotation The rotation of a non rigid object in which parts at different latitudes or
different radial distances move at different speeds
Dynamo theory The generation of a magnetic field by circulating electric charges
Eclipse The blocking of a part or all of the light from the moon by the earth (lunar eclipse) or
from the sun by the moon (solar eclipse)
Emission lines Emission lines are used in physics chemistry and astronomy to determine
what kind of gas is doing the emission Every element has a different electronic structure and
will thus have a different emission line fingerprint Emission lines are produced whenelectrons in atoms jump from one energy level to lower energy level
Filament A dark curve seen above the sunrsquos photosphere that is the top view of a solar
prominence
Flux tube Is a generally tube-like (cylindrical) region of space containing a magnetic field
such that the field at the side surfaces is parallel to them Both the cross-sectional area of the
tube and the field contained may vary along the length of the tube but the magnetic flux is
always constant
832019 Ew Afgewerkte Final
httpslidepdfcomreaderfullew-afgewerkte-final 2959
29
Geomagnetic storm When unusually strong surges of solar wind (charged particles from the
Sun) hit the Earth This effect causes variations in the magnetic field which surrounds the
Earth The visible results are eg the aurora (Northern and Southern lights)
Granulation Granules are related to the convective zone The granulation that shows up in the
photosphere is a result of the rising and falling of hot gas that takes place in the convectivezone
Hα absorption line An absorption line due to an electronic transition in hydrogen atoms in
which the atom absorbs a photon so that the electron makes a transition from a state
corresponding to the electronic energy level with n=2 to the one above with n=3 The photon
wavelength in a vacuum is 6563 nm
Heliosphere The volume of space within which the sun through the solar wind influences its
environment in the interstellar medium
Magnetic dynamo A theory that explains phenomena of the solar cycle as a result of periodicwinding and unwinding of the sunrsquos magnetic field in the solar atmosphere
Magnetic reconnection A process taking place in a plasma in which neighbouring
oppositely directed magnetic field lines suddenly part and reconnect in a new configuration
The abrupt change in a magnetic field represented by this process can release large amounts
of energy and it is thought to be important in explaining solar flares and other phenomena
Penumbra The portion of a shadow in which only part of the light source is covered by the
shadow-making body
Photosphere The region in the solar atmosphere from which most of the visible light escapes
into space
Plasma A fourth state of matter (not found naturally on Earth) of very hot gases Plasma is a
fluid with the ability to carry electric currents with no local accumulations of electric charge
Prominence Flamelike protrusion seen near the limb of the sun and extending into the solar
corona The side view of a filament
Quantum theory A theory in physics based on the principle that matter and energy have the
properties of both particles and waves created to explain the radiation of energy from a blackbody the photoelectric effect and the Bohr theory and now used to account for a wide
range of physical phenomena including the existence of discrete packets of energy and
matter the uncertainty principle and the exclusion principle Itrsquos a theory of the interaction of
matter and radiation developed early in the twentieth century which is based on the
quantization of energy and applied to a wide variety of processes that involve an exchange of
energy at the atomic level
Reconnection See magnetic reconnection
Solar cycle A 22-year-cycle during which the sunrsquos magnetic field reverses its polarity twice
Solar flare A violent eruption on the sunrsquos surface
832019 Ew Afgewerkte Final
httpslidepdfcomreaderfullew-afgewerkte-final 3059
30
Solar wind An outward flow of particles (mostly electrons and protons) from the sun
Solstice Either of two points along the ecliptic at which the Sun reaches its maximum
distance north or south of the celestial equator
Spectroscopy Concerns the production and study of spectra
Spectrum The result of electromagnetic radiation passing through a prism or grating so that
different wavelengths are separated
Spicule Short-lived (lifetime from rising to falling is about 15 minutes) jets vertical to the
solar surface that are several thousand kilometres long and about 1 kilometre thick (see also
appendix IV) in the solar chromosphere
Sunspot A temporary cool region in the solar photosphere created by protruding magnetic
fields
Umbra The central completely dark portion of a shadow
Zeemaneffect A splitting of spectra lines in the presence of a magnetic field
Bibliography and webography of the glossary
COMINS NF and KAUFMANN III WJ Discovering the universe eighth edition WH
Freeman and Company New York 2008 535 p
GREEN SF and JONES M H An introduction to the Sun and Stars The Open University
Cambridge 2004 373 p
httpenmimihuastronomygranulationhtml
httpenmimihuastronomyplasmahtml
httpwwwspacecomspacewatchspace_weather_glossaryhtml
httpenmimihuastronomyemission_linehtml
httpenmimihuastronomyabsorption_linehtml
httpwwwpbsorgfaithandreasonphysglossqm-bodyhtml
httpwwwanswerscomtopicquantum-theory
httpenwikipediaorgwikiFlux_tube
832019 Ew Afgewerkte Final
httpslidepdfcomreaderfullew-afgewerkte-final 3159
31
Appendix I The sun in figures
Physical quantity Comment
Radius 695 510 km 109 x earths radius
Mass 1989 x1030 kg 332 946 earths mass
Mass sun in the solar
system
9986 Total mass sun total mass of
our solar system
Volume 1412 x10sup3sup3 cmsup3 13 million x earths volume
Age 455 milliard years
Luminosity 3854 x 10sup3sup3 ergss
Magnitude -2773
Density center 1513 gcmsup3
Density mean 1409 gcmsup3
Pressure center 2334 x1011 bars
Pressure photosphere 00001 bar
Temperature center 15 557 000deg K
Temperature photosphere 5 780deg K Various sources mention
different grades
Temperature corona 2 000 000 to 3 000 000deg K
Rotation time at North or
South pole
up to 35 days on earth
Rotation time at Equator 25 days on earth The difference in rotation
times is called differential
rotation
Rotation time general 2538 days on earth
Mean distance sun-earth
(AU)
14959787 x108 km 1 AU = 1 Astronomical Unit
= 149 598 000 km
Chemical composition of
the sun ( of total number
of atoms)
Hydrogen 921
Helium 78
All others 01
Various sources mention
slightly different percentages
832019 Ew Afgewerkte Final
httpslidepdfcomreaderfullew-afgewerkte-final 3259
32
Chemical composition of
the sun ( of total mass)
Hydrogen 7346
Helium 2485
All others 169
Various sources mention
slightly different percentages
Total transforming of
hydrogen into helium persecond
700 billions of kilograms of
hydrogen are transformedinto 6957 billions of
kilograms of helium each
second
Based on the following references
- BEATTY JK PETERSEN CC and CHAIKIN A The new solar system fourth edition
Cambridge University Press Cambridge 1999 p 421
- LILENSTEN J and BORNAREL J Sous les feux du soleil EDP Sciences Les Ulis
Cedex A 2001 p 247
- LANG KR Sun earth and sky Springer Germany 1995 p 282- DENTHIER T Het zonnestelsel Standaard Uitgeverij 1992 p 415
- JANSSENS J Zon en aarde een unieke relatie Garant Antwerpen 2003 p 254- VOLKSSTERRENWACHT URANIA VZW De zon Internet(httpwwwuraniabesterrenkundezonnestelselzonphp) (01012009)
832019 Ew Afgewerkte Final
httpslidepdfcomreaderfullew-afgewerkte-final 3359
33
Appendix II Anatomy of the sun
httpwwwcosmographicacomgalleryinfographicssolar_anatomyhtml
The middle the sun consists of a heavy core this consists of plasma just as the outer layers
of the sun but the pressure in the core is so high that it behaves much more like a solid bodyThe most outer layer is the corona it reaches far into space More to the inside there is the
chromosphere and then the photosphere The corona the chromosphere and the
photosphere are explained in chapter 1
832019 Ew Afgewerkte Final
httpslidepdfcomreaderfullew-afgewerkte-final 3459
34
Appendix III Granulation
httpwwwwindowsucaredutourlink=sunSolar_interiorsolar_furnacehtml
At the surface of the sun we can find granules These are created by convection the warmest
parts of the sunrsquos interior move upwards and the colder parts at the surface move downwardsThis causes currents of plasma The dark lines are the colder particles We see them darker
because they emit less light than their surrounding neighbourhood
832019 Ew Afgewerkte Final
httpslidepdfcomreaderfullew-afgewerkte-final 3559
35
Appendix IV Spicules
Picture httplpc1clpccdcccauslpcharpellastro20a20deinfo_s09htmInformation httpwwwdaviddarlinginfoencyclopediaSspiculehtml
On this picture you can see spicules Spicules only last for several minutes and can be foundin the chromosphere They are little jets of gas There also exist macrospicules that can be
approximately ten times larger than a normal spicule
832019 Ew Afgewerkte Final
httpslidepdfcomreaderfullew-afgewerkte-final 3659
36
Appendix V The most important satellites observing the sun
Here you can find the most important satellites observing the sun and their missions
Solar and Heliospheric Obseratory (SOHO)
httpsohowwwnascomnasagovaboutabouthtml
SOHO the Solar amp Heliospheric Observatory is a project of international collaboration
between ESA and NASA to study the Sun from its deep core to the outer corona and the solar
wind
SOHO was launched on December 2 1995 The SOHO spacecraft was built in Europe by an
industry team led by prime contractor Matra Marconi Space (now EADS Astrium) under
overall management by ESA The twelve instruments on board SOHO were provided by
European and American scientists Nine of the international instrument consortia are led by
European Principal Investigators (PIs) three by PIs from the US Large engineering teamsand more than 200 co-investigators from many institutions supported the PIs in the
development of the instruments and in the preparation of their operations and data analysis
NASA was responsible for the launch and is now responsible for mission operations Large
radio dishes around the world which form NASAs Deep Space Network are used for data
downlink and commanding Mission control is based at Goddard Space Flight Center in
Maryland
More information about SOHO can be found on
httpsohowwwnascomnasagovaboutdocsSOHO_Fact_Sheetpdf
832019 Ew Afgewerkte Final
httpslidepdfcomreaderfullew-afgewerkte-final 3759
37
Transition Region and Coronal Explorer (TRACE)
httptracelmsalcomProjectMissionmissionhtm
TRACE enables solar physicists to study the connections between fine-scale magnetic fields
and the associated plasma structures on the Sun in a quantitative way by observing the photosphere the transition region and the corona With TRACE these temperature domains
are observed nearly simultaneously (with as little delay as only a second between different
wavelengths) with a spatial resolution of one second of arc
This is accomplished by obtaining precisely coaligned image sequences of photosphere
transition region and corona with high spatial resolution and uninterrupted viewing of the
Sun for up to eight months
TRACE Mission
TRACE explores the magnetic field in the solar atmosphere by studyingbull The 3-dimensional field structure
bull Its temporal evolution in response to photospheric flows
bull The time-dependent coronal fine structure
bull The coronal and transition region thermal topology
TRACE was launched on a Pegasus launch vehicle from Vandenberg Air Force Base in April
1998 The launch was scheduled to allow joint observations with SOHO during the rising
phase of the solar cycle to sunspot maximum No transition region or coronal imager has
witnessed the onset and rise of a solar cycle
Pegasus in flight
The two satellites provide complementary observations TRACE produces the high spatial
and temporal resolution images while SoHO yields images and spectral data out to 30 solar
radii at much lower spatial and temporal resolution Jointly they provide the opportunity to
obtain simultaneous digital measurements of all the temperature regimes of the solar
atmosphere in both high-resolution imaging and spectroscopy
With these data we expect to shatter the current ignorance of coronal heating and impulsive
MHD phenomena with benefits not only to solar physics but also to studies ranging from
stellar activity to the MHD of accretion disks The magnetograms produced by MDI on SoHO
provide a complete record of the eruption and distribution of photosphere magnetic fields
which will be invaluable for understanding TRACE observations of coronal hole formation
and coronal mass ejections Both of these phenomena have profound effects on our space
environment and the Earth`s magnetic field
TRACE is the first US solar research satellite since the Solar Maximum Mission
Coordination with SOHO provides an unprecedented opportunity to follow the emergence of
magnetic flux from the base of the convection zone deep inside the Sun through the
photosphere chromosphere and transitional region to the low-beta outer corona while
observing the effects of this emergence such as coronal mass ejections with high spatial andtemporal resolution
832019 Ew Afgewerkte Final
httpslidepdfcomreaderfullew-afgewerkte-final 3859
38
The transition from the photosphere where magnetic fields and plasma are in rough
equipartition to the corona where magnetic fields dominate is extremely difficult to model
and until recently to observe at high temporal and spatial resolution Many of the physical
problems that arise here such as plasma confinement reconnection wave propagation and plasma heating arise throughout space physics and astrophysics The detailed study of these
processed in the solar outer atmosphere is invaluable to astrophysics in general and stellar
studies in particular
More information about TRACE observations can be found on
httptracelmsalcomOperationsGeneraloperatiohtm
832019 Ew Afgewerkte Final
httpslidepdfcomreaderfullew-afgewerkte-final 3959
39
Reuven Ramaty High Energy Solar Spectroscopic Imager (RHESSI)
httphesperiagsfcnasagovhessibrochurehtm
What Questions will HESSI Address
bull How is such a large amount of energy released so rapidly during a flare
bull How are so many electrons and protons accelerated so quickly to such high energies
bull Where are the electrons and protons accelerated in the solar atmosphere and where do
they deposit their energy
How will HESSI Address these Questions
HESSI shown below will concentrate on electrons and protons accelerated in solar flares
through observations of the X-rays and gamma rays that they produce
bull HESSI will obtain the first ever X-ray and gamma-ray images of flares from 100 keV
to 20 MeVbull HESSI will do the first ever nuclear gamma-ray line spectroscopy of solar flares
bull HESSI will obtain pictures of flares in X-rays with an angular resolution of 2
arcseconds a factor of three better than previously possible
bull HESSI will measure X-ray and gamma-ray spectra with less than 1 keV energy
resolution a factor of 20-40 better than previously possible with scintillation counters
More information about the RHESSIrsquos Mission can be found on
httphesperiagsfcnasagovhessiconcepthtm
832019 Ew Afgewerkte Final
httpslidepdfcomreaderfullew-afgewerkte-final 4059
40
Solar Radiation and Climate Experiment (SORCE)
httplaspcoloradoedusorcesciencebackgroundhtm
The Solar Radiation and Climate Experiment (SORCE) is a NASA-sponsored satellite
mission that is providing state-of-the-art measurements of incoming x-ray ultraviolet visiblenear-infrared and total solar radiation The measurements provided by SORCE specifically
address long-term climate change natural variability and enhanced climate prediction and
atmospheric ozone and UV-B radiation These measurements are critical to studies of the Sun
its effect on our Earth system and its influence on humankind
The SORCE spacecraft was launched on January 25 2003 on a Pegasus XL launch vehicle to
provide NASAs Earth Science Enterprise (ESE) with precise measurements of solar
radiation It launched into a 645 km 40 degree orbit and is operated by the Laboratory for
Atmospheric and Space Physics (LASP) at the University of Colorado (CU) in Boulder
Colorado USA It will continue the precise measurements of total solar irradiance (TSI) that
began with the ERB instrument in 1979 and has continued to the present with the ACRIM series of measurements SORCE will also provide the measurements of the solar spectral
irradiance from 1nm to 2000nm accounting for 95 of the spectral contribution to TSI
SORCE carries four instruments including the Spectral Irradiance Monitor (SIM) Solar
Stellar Irradiance Comparison Experiment (SOLSTICE) Total Irradiance Monitor (TIM) and
the XUV Photometer System (XPS)
The primary goal of the NASA Earth Observing Systems (EOS) SOlar Radiation and Climate
Experiment (SORCE) is to enable solar-terrestrial studies by providing precise daily
measurements of the total solar irradiance (TSI) and the solar spectral irradiance atwavelengths extending from the ultraviolet to the near infrared The following lists the
SORCE science objectives
1 Make accurate measurements with high precision of total solar irradiance connect
them to previous TSI measurements and continue this long-term climate record
Provide TSI with an accuracy of 001 (100 parts per million) based on SI units and
with a long-term repeatability of 0001yr
2 Make daily measurements of the solar ultraviolet irradiance from 120 to 300 nm with
a spectral resolution of 1 nm Achieve this spectral irradiance measurement with an
accuracy of better than 5 and with a long-term repeatability of 05yr Use the
solarstellar comparison technique to relate the solar irradiance to the ensembleaverage flux from a number of bright early-type stars (same stars used by the UARS
SOLSTICE program)
3 Make the first measurements of the visible and near IR solar irradiance with sufficient
precision for future climate studies Obtain daily measurements of solar spectral
irradiance between 03 and 2 microm with a spectral resolution of at least 130 an
accuracy of 003 and a long-term repeatability of better than 001yr
4 Improve the understanding of how and why solar irradiance varies estimate past and
future solar behavior and investigate climate responses
More information about SORCE can be found on
httplaspcoloradoedusorcesciencescience_opshtm
832019 Ew Afgewerkte Final
httpslidepdfcomreaderfullew-afgewerkte-final 4159
41
Appendix VI Wavelengths
httpeosweblarcnasagovEDDOCSWavelengths_for_Colorshtml
As you can see on the figure visible light situates in the centre of the wavelengths having not
the shortest nor the longest wavelengths Gamma rays have the shortest wavelength radioways the longest All sort of wavelengths are used for daily purpose like radio waves for
radio and TV and gamma rays for treatments
832019 Ew Afgewerkte Final
httpslidepdfcomreaderfullew-afgewerkte-final 4259
42
Appendix VII Absorption lines in the sunrsquos spectrum
Picture httpwwwsolarnavigatornetthe_sunhtmExplanation COMINS NF and KAUFMANN III WJ Discovering the universe eighth edition WHFreeman and Company New York 2008 p 109
This photo is called a spectrogram It contains the spectrum of the sun All the black lines are
absorption lines The amount of black lines is related to the amount of elements that the sun
is emitting From a spectrogram we can deduct a lot of things including their mass the
temperature of the surface the chemical composition of the sun rotation rates and much
more
832019 Ew Afgewerkte Final
httpslidepdfcomreaderfullew-afgewerkte-final 4359
832019 Ew Afgewerkte Final
httpslidepdfcomreaderfullew-afgewerkte-final 4459
44
Appendix IX Butterfly-diagram
httpspacesciencespacerefcomsslpadsolarimagesbflygif
A butterfly-diagram
In a butterfly-diagram we can find the sunspots with their latitude (y-axis) through the years(x-axis) As you can see the sunspots appear like lsquobutterfliesrsquo this was discovered in 1904 by
Edward Maunder (1851-1928 an English astronomer best remembered for his study of
sunspots and the solar magnetic cycle) Thatrsquos why this graph is also called Maunders
butterfly diagram
832019 Ew Afgewerkte Final
httpslidepdfcomreaderfullew-afgewerkte-final 4559
45
Appendix X The Wolf-numbers
httpsidcomabenews106sunspotnumberclarifiedpdf
The sunspot number clarified By Petra Vanlommel
Which kinds of daily International Sunspot Numbers (ISN) are currentlypublished by the SIDC
Three daily indices are currently published by the SIDCthe Estimated ISN (EISN)the Provisional ISN (PISN)the Definitive ISN (DISN)Although they are all based on the same type of observations ie visual sunspot counts as ameasure of solar activity they are obtained from different data sets by different processingmethods with different accuracies and they serve different purposes
In the ideal case the three numbers are equal but in practice it is inevitable that there aresmall differences Therefore It is useful to explain what each index actually means
What is the source of the Wolf number
Once per day observers worldwide communicate their measured Wolf number (= 10G + S)based on visual sunspot (S) and group (G) counts to the World Data Center for the SunspotIndex Presently this is done through a dedicated password-protected WEB form the Wolfinterface However some observers still use the old way of reporting their observations onpaper through regular mail This method slows down the final processing but for the sake ofcontinuity in the index it is important to keep these observers included as some of them
represent the longest individual datasetsThe observers give the exact observing time the observing conditions the total numbers(group count sunspot count and Wolf number) and optionally the NorthSouth and centralzone numbers The observers using the web interface can provide their results to the SIDCimmediately after each observation However some users prefer to insert their data as ablock creating some delay but this must be done at least once a month
The personal reduction coefficient K
A personal reduction coefficient K is calculated for each station It has values typically in therange 04 and 17 and leads to a normalized sunspot number K(10G+S) In other words theK factor rescales the raw sunspot counts of each observer to the ones of Rudolph Wolf the
astronomer who introduced the above Wolf formula thus simulating the same eyes sametelescope and same conditionsDuring the procedure for calculating the Provisional ISN the K factor of every station iscomputed for every observation that passes the elimination procedure Once a year apersonal K factor for every station and for every month of the previous year is calculated Ayearly mean K value per station is also computed
The estimated sunspot index
The Estimated ISN (EISN) is calculated and issued on a daily basis for the day of calculationand the day before Only the total EISN is calculated with no hemispheric index It is anautomated procedure and no manual intervention is done The EISN is meant as a quicktemporary and approximate index for real-time applications
832019 Ew Afgewerkte Final
httpslidepdfcomreaderfullew-afgewerkte-final 4659
46
We use the raw Wolf number from all observatories that have provided counts early in theday ie before 1230 UT Typically there is between 10 and 20 stations available Thecalculation of the EISN is based on a simple and straightforward statistical method The Wolfnumbers are multiplied with the yearly mean K factor (see paragraph about the personalreduction coefficient K) The EISN is a simple average of the K-scaled values after excludingany individual value that deviates abnormally from the other valuesOnce the Provisional ISN (PISN) is calculated after the end of a month the temporary EISNis dropped and replaced by the PISN
The provisional sunspot Index
The Provisional ISN (PISN) is calculated and issued on the first of every month Theoutcome is a daily total and hemispheric sunspot number for the entire elapsed month Anexample on the first of September we calculate the daily PISN for each day of August ThePISN is computed semi-automatically with as little manual intervention as possibleTo calculate the PISN values for the concerned month we use all Wolf numbers Typicallythere is data from around 65 stations available
The calculation of the PISN is based on an extensive statistical treatment This treatmentfilters out any abnormal daily observation or the complete data set from an erratic station(quality control) This prevents long-term drifts in the resulting index One of the key elementsderived from this processing is to update the K reduction coefficients for each station theevolution of each station is monitored for each day relative to the entire networkA subset of the contributing stations also provides hemispheric counts A similar process isapplied to the North and South counts to derive the hemispheric PISN There is an additionalconstraint the sum of the North and South ISN must match the total ISNThe PISN replaces the EISN And once the Definitive ISN (DISN) is calculated the DISNreplaces the PISN
The definitive sunspot index
The Definitive ISN is calculated and issued on a quarterly basis when we have collecteddata from all the contributing observatories This is the final index and it is appended to thehistorical sunspot index time series The same semi-automated treatment as for the PISN isnow applied to the full data set If the result agrees within 5 of the PISN value the PISN iskept and becomes definitive Otherwise the new calculated value replaces the PISN andbecomes the definitive ISNIt is only at this stage and only in peculiar situations that a manual verification by ourscientific staff is required For example this happens when the observed raw Wolf valuesfrom the whole network are clustered around two distinct values This special case can becaused by small short-lived isolated sunspots (lifetimes lt 24 hours) or by the appearance ordisappearance of a large group at the solar limb in the course of one UT dayThe DISN replaces the provisional and estimated International Sunspot Number
Handling very low activity levels
One of the situations requiring a human arbitration is associated with single small isolatedand short-lived sunspots This is most noticeable around the minimum of the solar activitycycle like the one occurring now in 2008 Due to the 24hour binning (observations aregrouped between 0hUT and 24hUT) and the variable ability of each observer to detect thesmallest sunspots we end up with some stations reporting one sunspot and others who didno see any sunspot Let us explain further No sunspot may mean that the sunspot waspresent but the observer was unable to see it because of poor observational conditions such
as weather a small telescope On the other hand it may also indicate that the sunspot hadactually vanished by that time while it was present earlier on the same day
832019 Ew Afgewerkte Final
httpslidepdfcomreaderfullew-afgewerkte-final 4759
47
Individual stations do not observe at exactly the same timeIn order to validate the existence of such a marginal reported sunspot a qualified SIDCscientist must then check the detailed chronology within that day and consider the overallobserver capability (value of K coefficient)In common practice the fact that a sunspot is reported by a significant group of observersleads to the inclusion of the sunspot on that date thus neglecting the no-sunspotobservationsThe rationale is multiple observations of a sunspot exclude the possibility that the reportedsunspot was an independent false detection So a sunspot was really present on that dayalthough it may have existed only for part of the day or it was small enough to be missed bypart of the observers with smaller instruments or imperfect atmospheric conditionsAlso keep in mind that the sunspot index is derived with a limited precision just like any otherindex If the monthly mean sunspot number is 0 or 05 you can definitely say that activitywas low
What index should be used
If you want to perform long-term investigations the definitive ISN series is definitely the mostsuitable However there is a delay of a few months So when investigating the last cycle andrecent evolution use the definitive numbers in combination with the provisional ISN to be upto date to the last month The provisional numbers are also used in models forecasting thesunspot number for the coming months Now if you need a proxy for solar activity in a modelthat runs in real-time then you may use the estimated ISNImprovements and rethinking of the processing method is an ongoing project We arecurrently developing an alternative program for calculating the PISN Of course long-termconsistency is vital Therefore a cross-analysis between the output from the old and newsoftware must be applied over an extended period
832019 Ew Afgewerkte Final
httpslidepdfcomreaderfullew-afgewerkte-final 4859
48
Above graphs show different kinds of the International Sunspot Number The left plot gives an overview from 1700 up to now from the yearly (black) and monthly smoothed Sunspot Number The graph in the right top corner shows the monthly and monthly smoothed sunspot number while the graph in the right bottom corner show the daily monthly smoothed monthly sunspot number For every the time range of investigation there is an appropriate sunspot number
832019 Ew Afgewerkte Final
httpslidepdfcomreaderfullew-afgewerkte-final 4959
49
Appendix XI Filaments and prominences
httpsohowwwnascomnasagovpickoftheweekold26feb2004
This is a picture taken by SOHO on 26 February 2004
832019 Ew Afgewerkte Final
httpslidepdfcomreaderfullew-afgewerkte-final 5059
50
Appendix XII The reconnection of magnetic loops
httpwwwioporgEJarticle0004-637X558287253575webpdfrequest-id=73e38daa-69ae-4e01-b9a6- b4bd0ba071dd
In (a) sunspot B and C have different polarity and move towards each other The twomagnetic loops will reconnect and form one big magnetic loop showed in (b) This will
happen to other magnetic loops too as can be seen in (c) When G en F are close enough they
will reconnect and so E en H will reconnect too It is possible that the magnetic field line is
trapped around another in this case AD The mass ejected from the sun will be trapped
between the magnetic field lines and form a solar prominence
832019 Ew Afgewerkte Final
httpslidepdfcomreaderfullew-afgewerkte-final 5159
832019 Ew Afgewerkte Final
httpslidepdfcomreaderfullew-afgewerkte-final 5259
52
httptheinvisibleagentwordpresscom20090117amazing-celestial-images
An group of active prominences
httpapodnasagovapodap051109html
httpwhassupinthemilkywayblogspotcom200903cloudy-planhtml
A picture taken by SOHO In the left corner you can see the prominence with twisted
magnetic field lines
832019 Ew Afgewerkte Final
httpslidepdfcomreaderfullew-afgewerkte-final 5359
53
Appendix XIV Polar crown
httpsciencenasagovheadlinesy200817sep_polarcrownhtm
Photograph of a polar crown taken on 13 June 1999 by the Meudon Observatory
832019 Ew Afgewerkte Final
httpslidepdfcomreaderfullew-afgewerkte-final 5459
54
Appendix XV Coronal holes
httpsunearthdaynasagov2007multimediagal_020php
The black segment is a huge coronal hole The bright parts are x-rays from sunspots
832019 Ew Afgewerkte Final
httpslidepdfcomreaderfullew-afgewerkte-final 5559
55
Appendix XVI Coronal mass ejection
httpzuserver2staruclacuk~idhapodap000309html
Picture of a CME taken by SOHO in February 2000
832019 Ew Afgewerkte Final
httpslidepdfcomreaderfullew-afgewerkte-final 5659
56
Bibliography
Books
BEATTY JK PETERSEN CC and CHAIKIN A The new solar system fourth edition
Cambridge University Press Cambridge 1999 421 p
COMINS NF and KAUFMANN III WJ Discovering the universe eighth edition WH
Freeman and Company New York 2008 535 p
DETHIER T Het zonnestelsel Standaard Uitgeverij 1992 415 p
GOLUB L and PASACHOFF JM Nearest star the surprising science of our sun Harvard
university press Harvard 2001 267 p
GREEN SF and JONES M H An introduction to the Sun and Stars The Open University
Cambridge 2004 373 p
HILL S and CARLOWITZ M The sun Abrams New York 2006 239 p
HOLMAN GD lsquoThe mysterious origins of solar flaresrsquo Scientific America April 2006 p
24-31 volume 294 number 4
JANSSENS J Zon en aarde een unieke relatie Garant Antwerpen 2003 254 p
KELLER H-U Van Supernovarsquos tot zwarte gaten Tirion Natuur AH Baarn 2003 169 p
LANG KR Sun earth and sky Springer Germany 1995 282 p
LILENSTEN J and BORNAREL J Sous les feux du soleil EDP Sciences Les Ulis Cedex
A 2001 247 p
832019 Ew Afgewerkte Final
httpslidepdfcomreaderfullew-afgewerkte-final 5759
57
Articles
CUYPERS J and others lsquoLa rechercheacute en heacuteliophysique en Belgiquersquo Space connection
October 2007 20 p
DE KEYSER J lsquoDe magnetopauzersquo Heelal maart 1998 p 66-73
JANSSENS J lsquoHet maximum van de 23ste zonnevlekkencyclus (I)rsquo Heelal Oktober 1998 p
256-263
JANSSENS J lsquohet maximum van de 23ste zonnenvlekkencyclus (II)rsquo Heelal November
1998 p 284-290
JANSSENS J lsquoZonnefakkelsrsquo Heelal Oktober 1994 p 256-261
SMITS F lsquoDe coronarsquo Heelal Februari 1999 p 40-42
SMITS F lsquoProtuberanzenrsquo Heelal Juli 1991 p 182-185
VAN DEN BERGHE S lsquoHet Zeemaneffectrsquo Heelal September 1998 p 228-231
832019 Ew Afgewerkte Final
httpslidepdfcomreaderfullew-afgewerkte-final 5859
58
Webography
BOEN B Birth of a coronal mass ejection Internet
(httpwwwnasagovmission_pagessolar-b solar_005html) 290408
BRAEUNIG R A Glossary Internet (httpwwwbraeunigusspaceglossaryhtm) 2006
CORDIS Researchers reveal why Suns atmosphere is hotter than its surface Internet
(httpcordiseuropaeusearchindexcfmfuseaction=newsdocumentampN_LANG=ENampN_R
CN=30598amppid=0ampq=87F36474805A6BEC0B89404F72D0351Famptype=sim) 20032009
DAY C Alfveacuten waves may heat the Sunrsquos corona Internet
(httpblogsphysicstodayorgupdate200903 alfven-waves-may-heat-the-sunshtml)
310309
ELLERMAN F Solar prominences Internet (httparticlesadsabsharvardedufull
1928ASPL173E 0000074000html) (03042009)
ENCYCLODPEDIA OF SCIENCE Corona hole Internet
(httpwwwdaviddarlinginfoencyclopediaC coronal_holehtml) (04042009)
HATHAWAY D H The sunspot cycle Internet
(httpspacesciencespacerefcomsslpadsolarsunspots htm) 04012000
JANSSENS J The case of the missing solar cycle (published in lsquoheelalrsquo January 2008)
Internet (httpuserstelenetbejjanssensMSCwebEngpdf)
KNISELY D Solar prominences Internet
(httpwwwicstarscomHTMLSolarSectionHAlphaOBSERVINGTHESUNHAlpha3html)
(03042009)
KOPANSKI J Atom Internet (httpknolgooglecomkjan-
kopanskiatom1amrwrct7rvi27) 060209
MARTENS PC and ZWAAN C Origin and evolution of filament-prominence systems
Internet (http wwwioporgEJarticle0004-637X558287253575webpdfrequest-
id=73e38daa-69ae-4e01-b9a6-b4bd0ba071dd) 092001
NASA The corona Internet (httpsolarsciencemsfcnasagovcoronashtml) 180107
NASA The heliosphere Internet (httpheliosgsfcnasagovheliosphhtml) 20012009
OFFICIAL SITE OF STONEHENGE About Stonehenge Internet
(httpwwwstonehengecouk) (03022009)
OTTERSDORF M Astronomy On the sunspot cycle Internet
(httpuserszoominternetnet~matto MCASsunspot_cyclehtmZeemaneffect) 031103
PARIAT E and SCHMIEDER B Magnetic flux emergence Internet(httpwwwscholarpediaorgarticleMagnetic_field_emergence) 18042008
832019 Ew Afgewerkte Final
httpslidepdfcomreaderfullew-afgewerkte-final 5959
59
PRIEST E R Dynamics and Structure of Quiescent Solar Prominences Internet
(httpbooksgooglebe booksid=h599q3jz1w4Campdq=quiescent+prominencesampprintsec=fro
ntcoverampsource=blampots=58b79Qeyabampsig=1eklQ-
WszOIebZZaq7fq7gm6bxAamphl=nlampei=urPtSe7ZCo61-
Qa166jHDwampsa=Xampoi=book_resultampct=result ampresnum=3PPA6M2) 1989
RUSSELL R Rotation of the sun Internet
(httpwwwwindowsucaredutourlink=sunSolar_interior
Sun_layersdifferential_rotationhtml) 16082005
RUSSELL R Sunspots and magnetic fields Internet
(httpwwwwindowsucaredutourlink=sunatmospheresunspot_magnetismhtmlampedu=hig
h) 060908
UNIVERSITY OF GLASGOW Bibliography of Peter Sweet Internet
(httpwwwuniversitystoryglaacuk biographyid=WH2144amptype=P) (10042009)
WIKIPEDIA Orbiting Solar Observatory Internet
(httpenwikipediaorgwikiOrbiting_Solar_Observatory) 24012009
WINDOWS TEAM Maunderrsquos Butterfly Diagram Internet
(httpwwwwindowsucaredutourlink=sun activitybutterflyhtml) 2000

832019 Ew Afgewerkte Final
httpslidepdfcomreaderfullew-afgewerkte-final 659
6
Introduction
The sunrsquos magnetic field and its effect on the sunrsquos plasma 1 are complex phenomena to
understand and to explain However even if yoursquore not an expert on this subject you still
should be capable to understand this paper on the magnetic field of the sun
In the first chapter you will find an introduction to the anatomy of the sun which can be
helpful to understand the phenomena described in the following chapters Chapter two
contains some history and facts about the observation of the sun always interesting to know
Next you will find a brief explanation of the sunrsquos magnetic field in chapter three and four
Chapter three deals with the magnetic field from a long term perspective It describes the so-
called solar cycle Chapter four is about the magnetic field on a smaller scale Sunspots and
solar flares are well-known but what is the underlying explanation for these phenomena
I must admit that science is not yet capable to fully explain all the phenomena that originate
from the sunrsquos magnetic field Most of the time astronomers can explain what happens butthey cannot tell exactly why Thatrsquos why astronomy is an important science and even today a
lot of questions remain unresolved
1 Words which are explained in the glossary are marked with a
832019 Ew Afgewerkte Final
httpslidepdfcomreaderfullew-afgewerkte-final 759
7
Chapter 1 Anatomy of the sun
11 The three outer layers of the sun
The three outer layers of the sun are the photosphere the chromosphere and the corona
In these three layers the phenomena caused by the magnetic field take place You can find thesun in figures in appendix I and a cross-cut of the sun in appendix II
12 The photosphere2
If we look at the sun3 it is the photosphere (sphere of light) we can see The photosphere is
the innermost of the three outer layers and it is about 500km thick which is negligible in
comparison with the sunrsquos total diameter Because the other two layers are transparent to most
wavelengths of visible light we see through them and hence we see the photosphere The
photosphere has a temperature of around 5800K and consists of plasma It emits 99 of the
total radiation4 Only by observing the suns surface we can already spot different phenomena for example granulation (see appendix III) caused by convection A super
granule can even reach a diameter larger than the earthrsquos and can contain more than 900
smaller granules We can also observe sun spots that are caused by the suns magnetic field
This phenomenon will be discussed in section 41
13 The chromosphere5
The chromosphere (lsquocolour spherersquo) is the layer above the photosphere It is about 10 000
kilometres thick Hence it is also a thin layer of the sunrsquos structure because it is just one
percent of the sunrsquos total diameter For centuries this layer has been only visible during total
solar eclipses (see figure 1) Nowadays astronomers are able to continuously observe the
chromosphere by using special filters that let only pass light with wavelengths that are
strongly emitted by the chromosphere and (almost) not by the photosphere In observation
many different emission lines can be detected but the Hα is the brightest for the
photosphere Hα means that the emitted light of the chromosphere is coming from hydrogen
atoms Thatrsquos why the chromosphere spreads out a red glue The chromosphere is colder than
the photosphere The temperature falls to 4000K but if we move further away from the sun
the temperature will increase again which is very surprising since we move outwards It will
even reach a temperature of 10 000K In the colder chromosphere we can find lots of jets of
gas which are called spicules Spicules can last for several minutes and every second morethan 300 000 spicules cover the sunrsquos chromosphere6 A picture of such spicules can be found
in appendix IV
2 COMINS NF and KAUFMANN III WJ Discovering the universe eighth edition WH Freeman and
Company New York 2008 p 288-2893 Never try to look at the sun without special eye protection or if you are using a telescope without a safe
solar filter 4 LILENSTEN J and BORNAREL J Sous les feux du soleil EDP Sciences Les Ulis Cedex A 2001 p 245 COMINS NF and KAUFMANN III WJ Discovering the universe eight edition WH Freeman and
Company New York 2008 p 2906COMINS NF and KAUFMANN III WJ Discovering the universe eighth edition WH Freeman and
Company New York 2008 p291
832019 Ew Afgewerkte Final
httpslidepdfcomreaderfullew-afgewerkte-final 859
8
Figure 1 The chromosphere spreading out red
httpwwwwindowsucaredusunimageseclipsechromosphere_sun_eclipse_1999jpg
14 The corona7
A lot of people have already seen a (partial) solar eclipse On some places when the moon is
completely in front of the sun we can see a wonderful glow appearing around the dark
shadow of the moon This wide-stretched expanding glue of light is called the corona
However we cannot see the suns corona when there isnt a solar eclipse because the light
emitted by the suns surface outshines the coronas light by far Yet we can use a coronagraph
to observe the sun This instrument is like a telescope but it covers the surface of the sun with
a black circle If we take a closer look at the suns corona we can distinguish some visible
structures such as corona loops which are explained in chapter 4 The lines which can be
observed in the corona suggest that the sun has a strong magnetic field
Figure 2 The sunrsquos corona
httpapodnasagovapodap060407html
The corona extends millions of kilometres into space and is a very tenuous layer of the sun
Yet it reaches a temperature of over one million Kelvin This enormous increase of the
temperature was discovered around 1940 by Bengt Edleacuten (a Swedish professor of physics and
astronomer who was specialized in spectroscopy 1906-1993) who did some experiments
with ionized gas8 The spectrum of the sunrsquos corona contained much emission lines from
7
SMITS F lsquoDe coronarsquo Heelal February 1999 p 40-428GREEN SF and JONES M H An introduction to the Sun and Stars The Open University Cambridge
2004 p 31
832019 Ew Afgewerkte Final
httpslidepdfcomreaderfullew-afgewerkte-final 959
9
some highly ionised elements for example Fe13+ which tells us that the corona has a
temperature from one million Kelvin up to two million Kelvin 9 Despite this very high
temperature the corona has a very low density If it had the density of the sunrsquos surface it
would certainly outshine the photosphere10
Yet not all the secrets of the corona have been solved yet Some scientists already had someideas of where the high temperature of the corona comes from but none of them are fully
satisfactory One of the explanations is the theory of the spicules These spicules would heat
the temperature of the corona since they are very common on the sunrsquos surface On the other
hand it is possible that little solar flares heat up the corona Their amount seems so large that
these small solar flares can be an important element in the explanation for the high
temperature of the sunrsquos corona But the most acceptable explanation so far is the one of the
Alfveacuten waves11 Alfveacuten waves are formed by the local movement of the magnetic fields The
gas in the corona moves upwards and downwards along the magnetic field lines But the gas
struggles against this vibration The Alfveacuten wave will lose its energy and it will convert this
energy into heat But there are also many other possible explanations for the extremely high
temperature of the sunrsquos corona Recently the idea of reconnection has been developed Theconcept of the reconnection is briefly explained in the section of solar flares 12
The sunrsquos corona may look ordinary but yet it gives birth to an event that is called the solar
wind (see chapter 4) This solar wind is caused by an outflow of gases coming from the
sun13 Itrsquos important to understand how the solar wind works because the solar wind can
cause some aggravating side effects on earth for example it can cut off the electricity on earth
for millions of people or disturb the working of satellites if it gets too strong But the solar
wind also causes the beautiful phenomenon of the aurora on earth Yet this is not the focus
of this paper
9 GREEN SF and JONES M H An introduction to the Sun and Stars The Open University Cambridge2004 p 3110
NASA The corona Internet (httpsolarsciencemsfcnasagovcoronashtml) 180107COMINS NF and KAUFMANN III WJ Discovering the universe eighth edition WH Freeman andCompany New York 2008 p 29111 DAY C Alfveacuten waves may heat the Sunrsquos corona Internet (httpblogsphysicstodayorgupdate200903alfven-waves-may-heat-the-sunshtml) 310309
12 JANSSENS J Zon en aarde een unieke relatie Garant Antwerpen 2003 p 4913BEATTY JK PETERSEN CC and CHAIKIN A The new solar system eighth edition Cambridge
University Press Cambridge 1999 p 28
832019 Ew Afgewerkte Final
httpslidepdfcomreaderfullew-afgewerkte-final 1059
10
Chapter 2 Observation of the sun
21 History
Men have been observing the sun from the very beginning We know that the sun was very
important for the prehistoric people many historical monuments testify this One of the mostfamous monuments is Stonehenge14 Men were constructing Stonehenge for centuries during
the Stone Age We cannot assume that ancient observers of the sun could predict solar
eclipses but they were able to build a construction that was adjusted to the rising of the sun
on special days such as Solstice Stonehenge is not the only example of the importance of
the sun over the years There is also Newgrange a well-known passage-tomb situated in
Ireland north of Dublin and many other monuments
In the beginning our sun was regarded as a God Nowadays we no longer see the sun as a
God or a natural force But still the sun is strongly influencing our lives It still provides us
with light and warmth and makes it possible to live on earth Many scientists have been
interested in the sun All of them wanted to know how the sun really functions
Letrsquos take a quick tour through the history of the observation of the sun Scientists of ancient
China made the first record of a solar eclipse in 2134 BC In the Middle Ages Galileo (1564-
1642) used the first telescope to map the sunspots he saw on the sunrsquos surface
Unfortunately he watched through his telescope without a special filter blinding himself On
April 2 1845 Louis Feacutezeau and Leacuteon Foucault had a world scoop they took the first
photograph of the sun clearly registrating the sunspots15
Years later the first satellites observing the sun called OSOrsquos (Orbiting Solar
Observatories)
16
have been launched into space to observe the 11-year-solar cycle between1962 and 197517 Many of them followed the most important satellites observing the sun are
described in appendix V Nowadays satellites keep an eye on the sun every second Still the
mystery of the sun and her magnetic field hasnrsquot been solved completely yet
22 Light18
221 Visible light
Light is a form of electromagnetic waves The light we see is actually only a small fraction of
all the light emitted in the universe A huge part of all the emitted light is not visible to our eyes Thatrsquos why men made telescopes especially designed to observe the light we canrsquot see
with our eyes
14 OFFICIAL SITE OF STONEHENGE About Stonehenge Internet (httpwwwstonehengecouk)(03022009)15
HILL S and CARLOWITZ M The sun Abrams New York 2006 p 82 83 9316
JANSSENS J Zon en aarde een unieke relatie Garant Antwerpen 2003 p 8917
WIKIPEDIA Orbiting Solar Observatory Internet (httpenwikipediaorgwikiOrbiting_Solar_Observatory)2401200918 COMINS NF and KAUFMANN III WJ Discovering the universe eighth edition WH Freeman and
Company New York 2008 chapter 4GREEN SF and JONES M H An introduction to the Sun and Stars The Open University Cambridge 2004 p 18-26
832019 Ew Afgewerkte Final
httpslidepdfcomreaderfullew-afgewerkte-final 1159
11
222 Composition of light
Light is composed of waves Different wavelengths represent different colours The colour of
the light depends on the wavelength λ Wavelength is measured in nanometre Visible light
has a range from 400 nanometre to 700 nanometre It consists of red orange yellow green
blue and violet Of all the visible light violet light has the shortest wavelength and red lightthe longest
223 Non-visible light
As previously mentioned visible light is not the only light in the universe There are many
more wavelengths Maxwell (1831-1879) discovered the infrared radiation This light has a
longer wavelength than red light This however is not visible to the human eye Apart from
infrared light much other not-visible light has been discovered Radio waves have the longest
wavelength of all We use them for example for our mobile phones Gamma rays have the
shortest wavelength of all We use gamma rays for cancer radiotherapy The other wavelengths of light are visible in appendix VI
23 Spectroscopy19
231 Introduction to spectroscopy
An interesting way of observing the sun is using spectroscopy We can distinguish 3
different types of spectra continuous spectrum absorption spectrum and emission spectrum
The last two are called line spectra This means we will not observe the spectrum of the
emitting body itself but we will use another medium in this case thin gas
232 Continuous spectrum
Continuous spectrum means we use the unbroken range of wavelengths to observe objects
emitting light We observe the light emitted by an object directly without using a medium
This method however isnrsquot used very often because itrsquos difficult to observe an object
directly
233 Line spectrum20
2331 Absorption spectrum
For the absorption spectrum we use absorption lines These lines are created by the thin gas
(which gas doesnrsquot matter but the absorption lines will be different then) The wavelengths of
the body we want to observe go through the tin gas but the atoms of the gas will absorb some
of the wavelengths Because those wavelengths are absorbed by the atoms of the gas the
19 GREEN SF and JONES M H An introduction to the Sun and Stars The Open University Cambridge
2004 p 20-2620COMINS NF and KAUFMANN III WJ Discovering the universe eighth edition WH Freeman and
Company New York 2008 p 109-113
832019 Ew Afgewerkte Final
httpslidepdfcomreaderfullew-afgewerkte-final 1259
12
wavelengths cannot appear in the absorption spectrum of the body we observe We can notice
in appendix VII the absence of some wavelengths by the black lines Such lines are called
absorption lines They correspond to the wavelengths that are absorbed by the gas
2332 Emission spectrum
We can also examine the light emitted by the gas The atoms of the gas absorb some
wavelengths emitted by the object we actually want to observe but afterwards they will emit
those wavelengths again as photons This gives us a number of bright lines called emission
lines For many gases the wavelengths of the absorption lines will be the same as those
from the emission lines
234 The Zeemaneffect 21
In 1896 Pieter Zeeman (1865-1943) discovered that some spectrum lines split up A spectrumline emitted in a magnetic field will split up into different spectrum lines close to each other
This is called the Zeemaneffect
If the magnetic field is strong enough and is parallel with the direction of observation the
absorption line splits up into two lines one on the left side of the normal absorption line
(which means a smaller wavelength) and one on the right side of the absorption line (which
means a higher wavelength) If there is a magnetic field straight on our direction of
observation the absorption line will even split up into three lines one line will represent the
normal absorption line the other two will be just like with a parallel magnetic field
Figure 3 The Zeemaneffect
httpchemteaminfoGalleryGallery16html
How does a magnetic field influence an electron We can find an explanation in the Quantum
theory The magnetic field will interact with the atoms so that the electrons will reach
slightly different energy levels Atoms with different energy levels will emit different
wavelengths This explains the multiple lines of the Zeemaneffect
The divergence of the splitting depends on the force of the magnetic field which means we
can determine the size of the magnetic field by observing the Zeemaneffect
21VAN DEN BERGHE S lsquoHet Zeemaneffectrsquo Heelal september 1998 p 228-231
KOPANSKI J Atom Internet (httpknolgooglecomkjan-kopanskiatom1amrwrct7rvi27) 060209
832019 Ew Afgewerkte Final
httpslidepdfcomreaderfullew-afgewerkte-final 1359
13
Chapter 3 The solar cycle
31 Introduction
In this chapter we will concentrate on the long term evolution of the global magnetic field of
the sun It is important to understand the long-term evolution of the global magnetic field of the sun because the global magnetic field has a great influence on the magnetic field on a
local scale The sunrsquos magnetic field changes every 11 years This is why we call it the 11-
year-solar cycle However strictly speaking it is a 22-year-cycle This will be explained later
on in this chapter The record of the first solar cycle started in 175522 Since then itrsquos
currently already the 24th solar cycle
32 Differential rotation
As well as the earth the sun rotates But the sun isnrsquot made of the same matter as our earth on
the surface The sunrsquos surface is made of plasma Because of the plasma the sun will rotateat different speeds depending on latitude At the equator the sun makes a full rotation every
25 days But the rotation will slow down when the latitude increases This means that at the
poles the sun will rotate much slower At the poles the rotation time is 36 days This creates a
gap of more than 10 days23
Astronomers believe that it is only the surface of the sun that undergoes differential rotation
The inner core moves more like a solid body such as the earth but it is still unclear if this is
the case24
33 When the years passhellip25
Differential rotation is the main cause of all the complex phenomena that will be discussed
later on because this differential rotation causes the solar cycle and magnetic disturbance
As mentioned previously before the sunrsquos surface rotates much faster at the equator than at
the poles the plasma around the equator will move faster This is shown in figure 4 on the
next page Since the sun keeps on rotating in the same direction the plasma at the equator will
move much faster26
The magnetic field that the sun normally would have is the same type as the magnetic field of the earth This means the sun normally has the magnetic field resembling to the magnetic field
of a bar magnet Magnetic field lines move from north to south and at the poles the density of
the magnetic field is compact because there the magnetic field lines come together
22 JANSSENS J The case of the missing solar cycle (published in lsquoheelalrsquo January 2008) Internet (httpusers
telenet be jjanssensMSCwebEngpdf)23
DETHIER T Het zonnestelsel Standaard Uitgeverij 1992 p 77-7824
RUSSELL R Rotation of the sun Internet (httpwwwwindowsucaredutourlink=sunSolar_interiorSun_layersdifferential_rotationhtml) 1608200525 CUYPERS J and others lsquoLa rechercheacute en heacuteliophysique en Belgiquersquo Space connection October 2007 p
6-726GREEN SF and JONES M H An introduction to the Sun and Stars The Open University Cambridge
2004 p 72-73
832019 Ew Afgewerkte Final
httpslidepdfcomreaderfullew-afgewerkte-final 1459
14
Figure 4 The magnetic field lines of the sun change because of the differential rotation
httpircameraasarizonaeduNatSci102lecturessunhtm
If we apply the differential rotation on this magnetic field the magnetic field lines under the
photosphere of the sun will move faster at the equator This will cause the following
structure seen on figure 4 on the sun in the middle The magnetic field lines will continue to
get mixed up and the magnetic field lines will pile up This process takes several years
Finally the magnetic field lines will be stacked almost parallel to the sunrsquos equator This is
the sun on the right side in figure 427 You can find a more specific drawing of this process in
appendix VIII
Eventually after approximately eleven years the magnetic field lines will be piled up in such
a way that finally the magnetic field lines will start to pop out of the sunrsquos surface This willcause sunspots Sunspots appear in pairs one with a south ldquopolerdquo and one with a north
ldquopolerdquo The north ldquopolerdquo contains magnetic field lines that are directed outwards and the south
ldquopolerdquo contains magnetic field lines that point inwards28 Sunspots are discussed in more
detail in the next chapter When the sunspots almost come to an end the loops will reconnect
with another sunspot over the equator This connection will cause a switch of the poles (see
figure 5) The South Pole will become the North Pole and vice versa This model is called the
magnetic dynamo proposed by Horace Babcock (1912-2003)29
27GREEN SF and JONES M H An introduction to the Sun and Stars The Open University Cambridge
2004 p 72-7328 LANG KR Sun earth and sky Springer Germany 1995 p 8229
COMINS NF and KAUFMANN III WJ Discovering the universe eighth edition WH Freeman andCompany New York 2008 p 297-298JANSSENS J lsquohet maximum van de 23ste zonnenvlekkencyclus (II)rsquo Heelal November 1998 p 284
832019 Ew Afgewerkte Final
httpslidepdfcomreaderfullew-afgewerkte-final 1559
15
Figure 5 The switching of the magnetic poles of the sun
GREEN SF and JONES M H An introduction to the Sun and Stars The Open University Cambridge 2004 p73
When finally the poles have switched and the magnetic field lines are disentangled the cycle
will just start over again for another eleven years Because the magnetic poles of the sun
switch every eleven years the cycle is called the 11-year-solar cycle
34 Other cycles
341 The 22-year-cycle
If we take the magnetic poles into account however the 11-year-cycle becomes a 22-year-
cycle because the magnetic poles switch If we want to consider the strict cycle which means
that we take the magnetic poles into account we have to call the solar cycle a 22-year-cycleIt takes eleven years to switch the magnetic North Pole into a South Pole and another eleven
years to switch them back This cycle is called the Hale-cycle named after George Ellery
Hale (1868-1938) who was an American solar astonomer and active in different
observatories30
342 The 27-day-cycle31
The 27-day-cycle taking the average of the sunrsquos rotation time is a cycle that is directly
connected to the rotation time of the sun The sunspots the coronal holes and other
phenomena that are related to the activity of the sun rotate too This means that the activity of the sun is connected to the rotation cycle For example the part of the sun that we can see will
be less active when the sunspots are not visible because the sunspots influence the solar
activity When the sunspots appear again the activity of the sun will rise This cycle is also
known because of the coronal holes that influence the solar wind
30JANSSENS J lsquohet maximum van de 23
stezonnenvlekkencyclus (II)rsquo Heelal November 1998 p 284-290
31 JANSSENS J Zon en aarde een unieke relatie Garant Antwerpen 2003 p 113
832019 Ew Afgewerkte Final
httpslidepdfcomreaderfullew-afgewerkte-final 1659
16
343 Other cycles
Astronomers believe that there must be some other cycles of an even longer basis Different
researchers have been looking for other solar cycles Some thought they found a 55-year
cycle However this cycle was very irregular Max Waldmeier (1912-2000 a very eminent
solar astronomer of the 20th
century) found a 90-year-cycle However lots of other cycleshave been ldquofoundrdquo There have been postulated a 2300-year-cycle too But the records of
solar cycles are too recent to prove this cycle 32
35 Solar maximum and minimum
The Royal Greenwich Observatory has been observing the sunspots since 1874 The
information of their observations includes the size the position and the number of sunspots
during all the recorded solar cycles If we put all this information into a graph we can see the
so-called butterfly-graph (appendix IX) With this information we can conclude that sunspots
do not appear at random33
At the beginning of a new solar cycle the first sunspots appear at latitude of 45 degrees Later
on sunspots will appear at the equator too When the sunspots begin to appear at 45 degrees a
new cycle has started again34 The solar minimum is the starting point of the solar cycle At
the beginning sunspots are very rare sometimes there are none If there are any sunspots they
will occur at higher latitudes The solar activity is the least on solar minimum Then it is a
good time for astronauts to go into space because there are less sunspots and less solar flares
and other phenomena that can influence the solar wind and so the space weather When the
solar activity is the highest the solar cycle reaches its maximum There will be a lot of
sunspots which now occur on lower latitudes too35 The time to go from a solar minimum to a
solar maximum is around four years During this time the solar activity will rise and when it
reaches its maximum it will slowly decline The decrease takes much more time than the
increase of the solar activity around 7 years The time between a solar minimum and
maximum and between a solar maximum and minimum can vary and is different for every
solar cycle36
36 Mysteries of the solar cycle
Astronomers have been able to find out a lot of details about the solar cycle However we are
still not able to predict the maximums and minimums of the solar cycles preciselyAstronomers havenrsquot been capable to draw up a model that allows us to predict the exact
number of sunspotshellip You can compare it to predictions for the weather to comehellip
32JANSSENS J Zon en aarde een unieke relatie Garant Antwerpen 2003 p 113-114
33HATHAWAY D H The sunspot cycle Internet (httpspacesciencespacerefcomsslpadsolarsunspots
htm) 0401200034 JANSSENS J Zon en aarde een unieke relatie Garant Antwerpen 2003 p 10335
WINDOWS TEAM Maunderrsquos Butterfly Diagram Internet (httpwwwwindowsucaredutourlink=sunactivitybutterflyhtml) 200036 JANSSENS J Zon en aarde een unieke relatie Garant Antwerpen 2003 p 99-100
832019 Ew Afgewerkte Final
httpslidepdfcomreaderfullew-afgewerkte-final 1759
17
Chapter 4 Phenomena caused by the magnetic field of the sun
41 Sunspots
411 What are sunspots
Sunspots appear on the sunrsquos surface when the magnetic field lines under the photosphere
are piled up too much and they finally pop out into the chromosphere Sunspots are normally
found in groups The number of sunspots is dependent on the solar activity when the solar
activity reaches its maximum there will be many more sunspots than at solar minimum
Measuring the magnetic field in sunspots with the Zeemaneffect makes clear that the
strength of the magnetic field is much stronger in sunspots than in the surrounding
photosphere Itrsquos more than thousand times stronger the magnetic field strength in magnetic
fields varies from 1000 to 4000 Gauss while the surrounding area circles around 1 Gauss
(comparison the earthrsquos magnetic field strength is about 05 Gauss)37
412 What do sunspots look like
When magnetic field lines pop out of the photosphere they will form magnetic loops (figure
6 on the right side) Between this magnetic loops there will be formed a flux tube The
magnetic field lines in the sunspot will distort the convection under the surface (see figure 6
on the left side) They will pull the plasma downwards and will prevent the warm plasma
from going upwards and reach the sunrsquos surface Eventually the temperature in the sunspot
will cool down38
Figure 6 Left side convection in sunspotsRight side magnetic field lines in sunspots
JANSSENS J Zon en aarde een unieke relatie Garant Antwerpen 2003 p41
37
RUSSELL R Sunspots and magnetic fields Internet (httpwwwwindowsucaredutourlink=sunatmospheresunspot_magnetismhtmlampedu=high) 06090838 JANSSENS J Zon en aarde een unieke relatie Garant Antwerpen 2003 p 40-41
832019 Ew Afgewerkte Final
httpslidepdfcomreaderfullew-afgewerkte-final 1859
18
We can distinguish 2 areas the black sunspot and the surrounding bright surface of the sun
The sunspot itself consists of the very dark centre called the umbra and the surrounding
orange-brown environment called the penumbra The penumbra consists of an amount of
small little striated f igures that come out of the umbra A sunspot can reach a diameter of
300 000 kilometres39 The temperature in the sunspots centre is much cooler than in the
photosphere because of the convection explained above It measures around 4 200 K whilethe photosphere has a temperature of 6000 K40
Figure 7 The composition of a sunspot
httpwwwjaxajparticlespecialastroshimizu02_ehtml
A sunspot appears black to our eyes However appearances are deceptive the dark sunspot
only seems dark because we see it against a much warmer environment If we h ad seen itagainst a black surface it would have been much brighter than the moonrsquos glowing41
The amount of sunspots varies from very few till over more than a hundred The amount of
sunspots can be predicted by the Wolf-numbers named after Johann R udolf Wolf (1816-
1893) a Swiss astronomer best known for his research on sunspots42 However I wonrsquot
explain this method in this paper You can find a briefly explanation in appendix X Yet this
method is only capable to predict the amount of sunspots approximately
42 Prominences
421 What is a prominence
The luminosity of the sun outshines lots of phenomena that take place on the surface of the
sun and even far away from the sun The sunrsquos corona is one example But luckily
prominences are quite visibly when we observe the sun A prominence is a huge cloud of gas
that is cooler than his environment It is trapped between two horizontal magnetic field lines
For human eyes it seems to spread out dark but this is only because a prominence has a much
39 LILENSTEN J and BORNAREL J Sous les feux du soleil EDP Sciences Les Ulis Cedex A 2001 p 3540 OTTERSDORF M Astronomy On the sunspot cycle Internet (httpuserszoominternetnet~matto
MCASsunspot_cyclehtmZeeman effect) 03110341JANSSENS J Zon en aarde een unieke relatie Garant Antwerpen 2003 p 41
42 JANSSENS J lsquoHet maximum van de 23ste zonnevlekkencyclus (I)rsquo Heelal October 1998 p 256-263
832019 Ew Afgewerkte Final
httpslidepdfcomreaderfullew-afgewerkte-final 1959
19
lower temperature then the sunrsquos chromosphere (similar to sunspots which spread out dark
too) The dark lines in appendix XI are also known as filaments A filament is a line between
to magnetic fields with opposite polarities (appendix XI)43
Figure 8 A solar prominence
httpcosmic-webcoukp=274more-274
422 What is a prominence made of
The gas from the prominence is coming from the chromosphere So the prominences have
approximately the same composition as the chromosphere A good way to observe
prominences is to use red Hα or blue Hβ spectrum lines Hα absorption lines indicate a
temperature lower than 10 000 Kelvin These spectrum lines justif y that the temperature of a prominence is remarkably lower than the temperature of the corona 44
423 How do prominences originate
A prominence is a result of the magnetic field Particles of the sun can transport warmth very
fast if they move alongside magnetic field lines If they want to move straight to a magnetic
field line the transport of warmth is negligible So prominences that are trapped between 2
magnetic fields only have one way to be heated This brings on a temperature that is notably
lower then the temperature in the corona45
The origin of prominences is similar to the origin of solar flares When two magnetic loops
of opposite polarity start to approach each other they will reconnect and form some new
loops This is shown in appendix XII Some mass from the sun will be trapped between the
new magnetic field lines and will form a solar prominence 46
43COMINS NF and KAUFMANN III WJ Discovering the universe eighth edition WH Freeman and
Company New York 2008 p 29944 SMITS F lsquoProtuberanzenrsquo Heelal Juli 1991 p 18345 LANG KR Sun earth and sky Springer Germany 1995 p 134-14046
MARTENS PC and ZWAAN C Origin and evolution of filament-prominence systems Internet ( httpwwwioporgEJarticle0004-637X558287253575webpdfrequest-id=73e38daa-69ae-4e01-b9a6- b4bd0ba071dd) 092001
832019 Ew Afgewerkte Final
httpslidepdfcomreaderfullew-afgewerkte-final 2059
20
424 What do prominences look like47
4241 Different groups of prominences
As you can see on the pictures in appendix XIII prominences can have different shapes and
forms Thatrsquos why astronomers classify them into different groups the quiescent prominences the active prominences and eruptive prominences
4242 Quiescent prominences
Quiescent prominences can appear everywhere on the sun and are not depending on latitude
They can reach into the corona over 2 500 till 40 000 kilometres Quiescent prominences last
the longest of all prominences Some of them even last several solar rotations long These
prominences are very long and not so wide During its lifetime a quiescent prominence moves
slowly to the poles When they are found at the poles of the sun they are called a lsquopolar
crownrsquo (appendix XIV)48
4243 Active prominences
Their name already suggests where they can be found active prominences are found in the
active regions of the sun moreover in the presence of sunspots These prominences
however only have a short lifespan only several hours But within this short lifespan they do
change form adjusting to the magnetic field lines within a short period of time Because
these prominences are located in active regions there are many more reconnections and so
the form will change more rapidly
4244 Eruptive prominences
These prominences only last a couple of minutes and are connected to active sunspots as well
It is possible that after one died out another immediately gives birth in the same region Other
eruptive prominences are known to be bubbles of gas that are issued from active sunspots
There have been some records of eruptive prominences that bump into other prominences and
push the other prominences back in the sunspot49
47 KNISELY D Solar prominences Internet (httpwwwicstarscomHTMLSolarSectionHAlpha OBSERVINGTHESUNHAlpha3html) (03042009)
SMITS F lsquoProtuberanzenrsquo Heelal Juli 1991 p 182-185
ELLERMAN F Solar prominences Internet (httparticlesadsabsharvardedufull 1928ASPL173E0000074000html) (03042009)48
KNISLEY D Solar prominences Internet (httpwwwicstarscomHTMLSolarSectionHAlphaOBSERVINGTHESUNHAlpha3html) (03042009)49 PRIEST E R Dynamics and Structure of Quiescent Solar Prominences Internet (httpbooksgooglebe
booksid=h599q3jz1w4Campdq=quiescent+prominencesampprintsec=frontcoverampsource=blampots=58b79Qeyabampsig=1eklQ-WszOIebZZaq7fq7gm6bxAamphl=nlampei=urPtSe7ZCo61-Qa166jHDwampsa=Xampoi=book_resultampct=resultampresnum=3PPA6M2) 1989
832019 Ew Afgewerkte Final
httpslidepdfcomreaderfullew-afgewerkte-final 2159
21
43 Coronal holes50
When looking at the sun with an x-ray telescope we can see dark regions across the sun
These dark regions are called coronal holes Coronal holes have an open magnetic field
structure This means that the magnetic fields lines do not angle downwards but they extend
into space indefinitely Due to this the particles of the sun are capable to reach out far intospace without any struggles against the magnetic field With this outflow of gases from the
sun coronal holes are one of the most important sources of the (high-speed) solar wind
(appendix XV)
44 Corona loops
441 What is a corona loop
If we look closer at a pair of sunspots we can see an emission of plasma alongside
magnetic field lines that originate in the sun spots A corona loop can extend into the coronaas the name suggests Those loops contain plasma that can reach a temperature higher than
106 Kelvin Corona loops can best be observed by ultra-violet and x-ray images because of
the high temperature The high temper ature brings on a high vibration of the atoms This
trembling causes the emission of x-rays51
Figure 9 A close up of corona loops
httpwwwdaviddarlinginfoencyclopediaCcoronal_loophtml
442 Where and when do corona loops originate
The magnetic field lines of sunspots move outwards from the sun into the corona and form
broad loops This makes it possible to trap hot gas with a temperature up to 40 million K
Those magnetic field loops trap hot plasma into the sunrsquos atmosphere The magnetic force
pushes particles around along the magnetic lines but at the same time the atoms circulate
around the magnetic field lines (see figure 10) The speed of their movements depends on the
50
ENCYCLODPEDIA OF SCIENCE Corona hole Internet (httpwwwdaviddarlinginfoencyclopediaC coronal_holehtml) (04042009)51 JANSSENS J Zon en aarde een unieke relatie Garant Antwerpen 2003 p 52-54
832019 Ew Afgewerkte Final
httpslidepdfcomreaderfullew-afgewerkte-final 2259
22
density of the magnetic field So if a particle moves from the top of a loop to the bottom it
will slow down just like in traffic jams Eventually it will reach the bottom but the bottom is
highly compressed (because the magnetic field lines converge at the bottom of the loops) so
that the particle will be shot back along the magnetic field line (see figure 10)
Figure 10 the movement of particles in corona loops
GD HOLMAN lsquoThe mysterious origins of solar flaresrsquo Scientific America April 2006 p24-29 volume 294number 4
Hence the particles will move up and down along the magnetic field lines Atoms that are
charged the same will cause electric currents (just like in a battery) These currents will
generate a new magnetic field and the old magnetic field in combination with the new one
will cause a high distortion in the magnetic field of the sun This is the moment when the
corona loop will transform into a solar flare
45 Solar flare52
451 What is a solar flare
A solar flare is a sudden powerful explosion in the solar atmosphere caused by a disruption
in the magnetic field of the sun Because of the disruption mass from the sun will be movedup and form a solar flare A solar flare can equal the energy of billions of atomic bombs
within a few minutes The strongest solar flares are measured during the solar maximums
because then the sunrsquos magnetic activity is the strongest53 Since the sunspots in the presence
of solar flare have a very high magnetic field it is likely that a solar flare would even have a
higher magnetic field But in reality the magnetic field of a solar flare is only half of the
magnetic field of a sunspot The intensity of the magnetic field is lsquoonlyrsquo 500 Gauss54
52 HOLMAN GD lsquoThe mysterious origins of solar flaresrsquo Scientific America April 2006 p 24-31 volume
294 number 453JANSSENS J Zon en aarde een unieke relatie Garant Antwerpen 2003 p 55-57
54 JANSSENS J lsquoZonnefakkelsrsquo Heelal Oktober 1994 p 256
832019 Ew Afgewerkte Final
httpslidepdfcomreaderfullew-afgewerkte-final 2359
23
Figure 11 You can see the magnetic fieldlines in the solar flare on the right side
Large solar flare recorded by SOHO EIT304 instrument 512x512 version Animation (980kMPEG) CourtesySOHO(ESAampNASA)
httpwwwteachersparadisecomencyenwikipediassusunhtml
452 Where and how do sun flares originate
Astronomers have long been speculating how solar flares exactly originate In 1992 Satoshi
Masuda (graduated at the University of Tokyo) discovered on pictures of the Japanese
Yohkoh Satellite that the far end of a solar flare emitted unusually short wavelengths very
short x-rays The source must be a concentration of gas with a temperature of about 100million K concluded Masuda But this discovery provoked some new questions why was the
high temperature at the top of the flare and not at the bottom where the gas is more compact
Why does the plasma stay confined instead of spreading out into the universe In order to
obtain more information to try to solve this problem astronomers started observing the sunrsquos
radiation of ultraviolet and x-rays frequently In 2002 NASA even launched the RHESSI
(Ramaty High Energy Solar Spectroscopic Imager) which was intended to bring solar flares
into pictures55
These observations provided evidence that sun flares surge up in regions where the magnetic
field is very strong ndashmost common in the presence of sun spots At this point we have to call
over the corona loops As mentioned before corona loops are electric currents of atoms
which move alongside magnetic field lines When the atoms are shot back alongside the
magnetic field line there seems to occur a distortion of the magnetic field This distortion will
end up in a solar flare All the mass of the corona loop will be shot into space and form a solar
flare
But how can such enormous mass of the solar flares be shot into s pace This has been a very
interesting question However Peter Alan Sweet (1921-2005)56 succeeded in finding an
55 GD HOLMAN lsquoThe mysterious origins of solar flaresrsquo Scientific America April 2006 p 27 volume 294
number 456UNIVERSITY OF GLASGOW Bibliography of Peter Sweet Internet (httpwwwuniversitystoryglaacuk
biographyid=WH2144amptype=P) (10042009)
832019 Ew Afgewerkte Final
httpslidepdfcomreaderfullew-afgewerkte-final 2459
24
answer already in 1956 If magnetic field lines break apart and then reconnect they bring
together two opposing fields that will cancel each other and cause a huge burst of energy The
reconnection will create new magnetic field lines This reconnection is called the Sweet-
Parker reconnection Yet this is a slow reconnection which cannot take place at the base of a
solar flare with a dazzling speed Fortunately Harry P Petschek published an article about
reconnection in 1964 and solved that problem under certain circumstances it is possible toreconnect much faster which explains solar flares This faster reconnection is also called the
Petschek reconnection But unfortunately with the current technology it is not yet possible to
take pictures of those reconnections57
If the energy comes from the reconnection then where does this reconnection take place
From pictures of solar flares astronomers discovered that at the top of the corona loop a
mysterious x-ray source was found The x-ray source began to give a higher energy level and
at the same time the particles move down towards the sunrsquos surface Yet the x-ray source
stays at the same placehellipThen when the x-rays reach their maximum the loop suddenly
changes direction But this time the x-ray source will move upwards too unexpectedly it
moves at the speed of light approximately three hundred thousands kilometres an hour awayfrom the sun This is the same speed as the coronal mass ejections
46 Coronal mass ejections
461 What is a coronal mass ejection58
Coronal mass ejections (CMErsquos) (appendix XVI) are huge amounts of gas some billions of
plasma from the sun that are ejected into space Their temperature can reach 25 million K59
A coronal mass ejection can last for several hours and it can at last enter the solar wind A
CME can reach a speed of 50kms- 2000kms which means more than 7 million kilometres
an hour60 The mass of a large CME varies from 5 x 10⁶ to 5 x 10¹³ kg61 During a solar
maximum there are more coronal mass ejections than during a minimum but they can occur
at any time of the solar cycle Coronal mass ejections are related both to solar flares and
prominences Very heavy coronal mass ejections can cause some geomagnetic storms on
earth
462 Reconnection
The reconnection of a solar flare can end up in a coronal mass ejection When magneticfield lines that are opposite are starting to reconnect and form new magnetic field lines half of
the magnetic field lines will point downwards and join some existing magnetic loops
However the other part of the magnetic field lines will move upwards at a very high speed
and will form some loops more upwards Between those loops that moved downwards and
those that moved upwards there is some mass that isnrsquot connected to the sun anymore It is
57GD HOLMAN lsquoThe mysterious origins of solar flaresrsquo Scientific America April 2006 p 29 volume 294
number 458
BRAEUNIG R A Glossary Internet (httpwwwbraeunigusspaceglossaryhtm) 200659 LILENSTEN J and BORNAREL J Sous les feux du soleil EDP Sciences Les Ulis Cedex A 2001 p 4460 Cuypers J and others lsquoLa rechercheacute en heacuteliophysique en Belgiquersquo Space connection October 2007 p 10-
1161GREEN SF and JONES M H An introduction to the Sun and Stars The Open University Cambridge
2004 p 68
832019 Ew Afgewerkte Final
httpslidepdfcomreaderfullew-afgewerkte-final 2559
25
known that for an amount of solar flares that this mass between the loops will end up in a
coronal mass ejection Yet this doesnrsquot count for all the solar flares The coronal mass
ejection only takes place if the magnetic field lines twist around each other while forming the
letter lsquoSrsquo (see figure 12)62
Figure 12 Here you can see the reconnection that takes place before the coronal mass ejection starts
httpwwwnasagovmission_pagessolar-bsolar_005html
Certainly we will be capable to answer all the questions about solar flares and coronal mass
ejections in the nearby future But there are also some very interesting questions left what is
at the basis of the acceleration of the atoms in solar flares How does magnetic reconnection
originate Hopefully we will find the answers in the near future
47 Solar wind
471 What is the solar wind
Every second of every day of the year the sunrsquos corona emits a continuous stream of mass
from the sun The temperature of the corona is so high that the sunrsquos magnetic field just
cannot control the outflow of particles We know that the particles are accelerated but
astronomers cannot explain all the details about the solar wind yet
472 What do we know about the solar wind
The speed of the solar wind can change it differs from 300kmh up to 800kmh This speed
depends on the outflow of gases If there is a corona hole pointing towards the earth the solar
wind will reach a speed of around 800kmh The different speeds can interact with each other
and form a new speed according to the rules of light emission When two emissions connect
with each other they can form a faster or slower solar wind just like waves can interact and
form new waves
62BOEN B Birth of a coronal mass ejection Internet (httpwwwnasagovmission_pagessolar-b
solar_005html) 290408
832019 Ew Afgewerkte Final
httpslidepdfcomreaderfullew-afgewerkte-final 2659
26
The ionized atoms with very high temperature coming from the sunrsquos corona are one of the
most important parts of the solar wind but the magnetic fields are important too The
magnetic field outside the sun gets wrapped into a spiral called the Parker-spiral named after
the scientist who described it as the first one (because the sun rotates) This influences the
magnetic field of the sun from the outside The solar wind is emitted in spiral too (see figure
13)
Figure 13 The course of the solar wind caused by the rotation of the sun
httpheliosgsfcnasagovsolarmaghtml
473 Heliosphere
We can describe the heliosphere as a gigantic magnetic bubble around the sun This is
everywhere in space till where the sunrsquos magnetic field reaches and still has an influence The
heliosphere is filled with solar wind although the solar wind has a very low density Yet it
is a very hot wind but because of the very low density it does not have such a great influence
on earth However it can cause some energetic storms on earth63
63 NASA The heliosphere Internet (httpheliosgsfcnasagovheliosphhtml) 20012009
832019 Ew Afgewerkte Final
httpslidepdfcomreaderfullew-afgewerkte-final 2759
27
Conclusion
The sunrsquos magnetic field is a complex system to understand Yet I hope you have learned a
lot from this paper and that you do understand the exiting phenomena described in the
previous chapters
We can discuss the sunrsquos magnetic field from two perspectives The first one is looking at the
magnetic field for global long-term changing dimensions The second way is based on
phenomena on lower scale
The global changes involve the solar cycle and the switch of the magnetic poles The solar
cycle is divided into a decrease of the solar activity until it reaches solar minimum and an
increase of the solar activity until it reaches solar maximum The frequency of the phenomena
that can be found in the outer layers of the sun are directly connected to the solar activity and
thus to the solar cycle Sunspots are the easiest to see they appear as black spots against the
much brighter surface of the sun Corona loops are connected to sunspots and can extend into
solar flares and solar prominences These flares and prominences can burst out into a coronalmass ejection All these phenomena influence the sun and its solar wind how small their part
may be The solar wind has a directly influence on the earth
There is still much to be discovered Astronomers hope to discover much more about the
magnetic field of the sun Today many astronomers and scientists are observing the sun and
every day they discover more and more aspects of the sun Recently a group of researchers
led by David Jess of Queens University Belfast has revealed why the sunrsquos atmosphere is
hotter than its surface64 As you can see astronomy is a very developing science
64
CORDIS Researchers reveal why Suns atmosphere is hotter than its surface Internet (httpcordiseuropaeusearchindexcfmfuseaction=newsdocumentampN_LANG=ENampN_RCN=30598amppid=0ampq=87F36474805A6BEC0B89404F72D0351Famptype=sim) 20032009
832019 Ew Afgewerkte Final
httpslidepdfcomreaderfullew-afgewerkte-final 2859
28
Glossary
Absorption lines A dark line superimposed on a continuous spectrum when a gas absorbs
light from a continuous source that is hotter than the absorbing gas
Aurora Light radiated by atoms and ions formed by the solar wind in the earthrsquos upper atmosphere seen most commonly in the polar regions
Chromosphere The layer in the solar atmosphere between the photosphere and the corona It
is the lowest layer of the atmosphere characterized by reddish hue and by an increase of the
temperature with altitude through all but its lower regions
Convection The transfer of heat from a region of high temperature to a region of lower
temperature by the displacement of the cooler molecules by the warmer molecules The hot
gas will be moved upwards the cool gas will be pushed downwards into the sun
Corona The sunrsquos outer atmosphere It is very extensive and has a very low density It isextremely hot
Coronal hole A dark region of the sunrsquos inner corona as seen at X-ray wavelengths
Coronal loop Closed loops of magnetic field lines extending from the sunrsquos photosphere into
the corona which contain plasma at high temperature They are typically observed through
ultraviolet or x-ray emission from the hot plasma
Coronal mass ejection Large volumes of high energy gas released from the sunrsquos corona
Differential rotation The rotation of a non rigid object in which parts at different latitudes or
different radial distances move at different speeds
Dynamo theory The generation of a magnetic field by circulating electric charges
Eclipse The blocking of a part or all of the light from the moon by the earth (lunar eclipse) or
from the sun by the moon (solar eclipse)
Emission lines Emission lines are used in physics chemistry and astronomy to determine
what kind of gas is doing the emission Every element has a different electronic structure and
will thus have a different emission line fingerprint Emission lines are produced whenelectrons in atoms jump from one energy level to lower energy level
Filament A dark curve seen above the sunrsquos photosphere that is the top view of a solar
prominence
Flux tube Is a generally tube-like (cylindrical) region of space containing a magnetic field
such that the field at the side surfaces is parallel to them Both the cross-sectional area of the
tube and the field contained may vary along the length of the tube but the magnetic flux is
always constant
832019 Ew Afgewerkte Final
httpslidepdfcomreaderfullew-afgewerkte-final 2959
29
Geomagnetic storm When unusually strong surges of solar wind (charged particles from the
Sun) hit the Earth This effect causes variations in the magnetic field which surrounds the
Earth The visible results are eg the aurora (Northern and Southern lights)
Granulation Granules are related to the convective zone The granulation that shows up in the
photosphere is a result of the rising and falling of hot gas that takes place in the convectivezone
Hα absorption line An absorption line due to an electronic transition in hydrogen atoms in
which the atom absorbs a photon so that the electron makes a transition from a state
corresponding to the electronic energy level with n=2 to the one above with n=3 The photon
wavelength in a vacuum is 6563 nm
Heliosphere The volume of space within which the sun through the solar wind influences its
environment in the interstellar medium
Magnetic dynamo A theory that explains phenomena of the solar cycle as a result of periodicwinding and unwinding of the sunrsquos magnetic field in the solar atmosphere
Magnetic reconnection A process taking place in a plasma in which neighbouring
oppositely directed magnetic field lines suddenly part and reconnect in a new configuration
The abrupt change in a magnetic field represented by this process can release large amounts
of energy and it is thought to be important in explaining solar flares and other phenomena
Penumbra The portion of a shadow in which only part of the light source is covered by the
shadow-making body
Photosphere The region in the solar atmosphere from which most of the visible light escapes
into space
Plasma A fourth state of matter (not found naturally on Earth) of very hot gases Plasma is a
fluid with the ability to carry electric currents with no local accumulations of electric charge
Prominence Flamelike protrusion seen near the limb of the sun and extending into the solar
corona The side view of a filament
Quantum theory A theory in physics based on the principle that matter and energy have the
properties of both particles and waves created to explain the radiation of energy from a blackbody the photoelectric effect and the Bohr theory and now used to account for a wide
range of physical phenomena including the existence of discrete packets of energy and
matter the uncertainty principle and the exclusion principle Itrsquos a theory of the interaction of
matter and radiation developed early in the twentieth century which is based on the
quantization of energy and applied to a wide variety of processes that involve an exchange of
energy at the atomic level
Reconnection See magnetic reconnection
Solar cycle A 22-year-cycle during which the sunrsquos magnetic field reverses its polarity twice
Solar flare A violent eruption on the sunrsquos surface
832019 Ew Afgewerkte Final
httpslidepdfcomreaderfullew-afgewerkte-final 3059
30
Solar wind An outward flow of particles (mostly electrons and protons) from the sun
Solstice Either of two points along the ecliptic at which the Sun reaches its maximum
distance north or south of the celestial equator
Spectroscopy Concerns the production and study of spectra
Spectrum The result of electromagnetic radiation passing through a prism or grating so that
different wavelengths are separated
Spicule Short-lived (lifetime from rising to falling is about 15 minutes) jets vertical to the
solar surface that are several thousand kilometres long and about 1 kilometre thick (see also
appendix IV) in the solar chromosphere
Sunspot A temporary cool region in the solar photosphere created by protruding magnetic
fields
Umbra The central completely dark portion of a shadow
Zeemaneffect A splitting of spectra lines in the presence of a magnetic field
Bibliography and webography of the glossary
COMINS NF and KAUFMANN III WJ Discovering the universe eighth edition WH
Freeman and Company New York 2008 535 p
GREEN SF and JONES M H An introduction to the Sun and Stars The Open University
Cambridge 2004 373 p
httpenmimihuastronomygranulationhtml
httpenmimihuastronomyplasmahtml
httpwwwspacecomspacewatchspace_weather_glossaryhtml
httpenmimihuastronomyemission_linehtml
httpenmimihuastronomyabsorption_linehtml
httpwwwpbsorgfaithandreasonphysglossqm-bodyhtml
httpwwwanswerscomtopicquantum-theory
httpenwikipediaorgwikiFlux_tube
832019 Ew Afgewerkte Final
httpslidepdfcomreaderfullew-afgewerkte-final 3159
31
Appendix I The sun in figures
Physical quantity Comment
Radius 695 510 km 109 x earths radius
Mass 1989 x1030 kg 332 946 earths mass
Mass sun in the solar
system
9986 Total mass sun total mass of
our solar system
Volume 1412 x10sup3sup3 cmsup3 13 million x earths volume
Age 455 milliard years
Luminosity 3854 x 10sup3sup3 ergss
Magnitude -2773
Density center 1513 gcmsup3
Density mean 1409 gcmsup3
Pressure center 2334 x1011 bars
Pressure photosphere 00001 bar
Temperature center 15 557 000deg K
Temperature photosphere 5 780deg K Various sources mention
different grades
Temperature corona 2 000 000 to 3 000 000deg K
Rotation time at North or
South pole
up to 35 days on earth
Rotation time at Equator 25 days on earth The difference in rotation
times is called differential
rotation
Rotation time general 2538 days on earth
Mean distance sun-earth
(AU)
14959787 x108 km 1 AU = 1 Astronomical Unit
= 149 598 000 km
Chemical composition of
the sun ( of total number
of atoms)
Hydrogen 921
Helium 78
All others 01
Various sources mention
slightly different percentages
832019 Ew Afgewerkte Final
httpslidepdfcomreaderfullew-afgewerkte-final 3259
32
Chemical composition of
the sun ( of total mass)
Hydrogen 7346
Helium 2485
All others 169
Various sources mention
slightly different percentages
Total transforming of
hydrogen into helium persecond
700 billions of kilograms of
hydrogen are transformedinto 6957 billions of
kilograms of helium each
second
Based on the following references
- BEATTY JK PETERSEN CC and CHAIKIN A The new solar system fourth edition
Cambridge University Press Cambridge 1999 p 421
- LILENSTEN J and BORNAREL J Sous les feux du soleil EDP Sciences Les Ulis
Cedex A 2001 p 247
- LANG KR Sun earth and sky Springer Germany 1995 p 282- DENTHIER T Het zonnestelsel Standaard Uitgeverij 1992 p 415
- JANSSENS J Zon en aarde een unieke relatie Garant Antwerpen 2003 p 254- VOLKSSTERRENWACHT URANIA VZW De zon Internet(httpwwwuraniabesterrenkundezonnestelselzonphp) (01012009)
832019 Ew Afgewerkte Final
httpslidepdfcomreaderfullew-afgewerkte-final 3359
33
Appendix II Anatomy of the sun
httpwwwcosmographicacomgalleryinfographicssolar_anatomyhtml
The middle the sun consists of a heavy core this consists of plasma just as the outer layers
of the sun but the pressure in the core is so high that it behaves much more like a solid bodyThe most outer layer is the corona it reaches far into space More to the inside there is the
chromosphere and then the photosphere The corona the chromosphere and the
photosphere are explained in chapter 1
832019 Ew Afgewerkte Final
httpslidepdfcomreaderfullew-afgewerkte-final 3459
34
Appendix III Granulation
httpwwwwindowsucaredutourlink=sunSolar_interiorsolar_furnacehtml
At the surface of the sun we can find granules These are created by convection the warmest
parts of the sunrsquos interior move upwards and the colder parts at the surface move downwardsThis causes currents of plasma The dark lines are the colder particles We see them darker
because they emit less light than their surrounding neighbourhood
832019 Ew Afgewerkte Final
httpslidepdfcomreaderfullew-afgewerkte-final 3559
35
Appendix IV Spicules
Picture httplpc1clpccdcccauslpcharpellastro20a20deinfo_s09htmInformation httpwwwdaviddarlinginfoencyclopediaSspiculehtml
On this picture you can see spicules Spicules only last for several minutes and can be foundin the chromosphere They are little jets of gas There also exist macrospicules that can be
approximately ten times larger than a normal spicule
832019 Ew Afgewerkte Final
httpslidepdfcomreaderfullew-afgewerkte-final 3659
36
Appendix V The most important satellites observing the sun
Here you can find the most important satellites observing the sun and their missions
Solar and Heliospheric Obseratory (SOHO)
httpsohowwwnascomnasagovaboutabouthtml
SOHO the Solar amp Heliospheric Observatory is a project of international collaboration
between ESA and NASA to study the Sun from its deep core to the outer corona and the solar
wind
SOHO was launched on December 2 1995 The SOHO spacecraft was built in Europe by an
industry team led by prime contractor Matra Marconi Space (now EADS Astrium) under
overall management by ESA The twelve instruments on board SOHO were provided by
European and American scientists Nine of the international instrument consortia are led by
European Principal Investigators (PIs) three by PIs from the US Large engineering teamsand more than 200 co-investigators from many institutions supported the PIs in the
development of the instruments and in the preparation of their operations and data analysis
NASA was responsible for the launch and is now responsible for mission operations Large
radio dishes around the world which form NASAs Deep Space Network are used for data
downlink and commanding Mission control is based at Goddard Space Flight Center in
Maryland
More information about SOHO can be found on
httpsohowwwnascomnasagovaboutdocsSOHO_Fact_Sheetpdf
832019 Ew Afgewerkte Final
httpslidepdfcomreaderfullew-afgewerkte-final 3759
37
Transition Region and Coronal Explorer (TRACE)
httptracelmsalcomProjectMissionmissionhtm
TRACE enables solar physicists to study the connections between fine-scale magnetic fields
and the associated plasma structures on the Sun in a quantitative way by observing the photosphere the transition region and the corona With TRACE these temperature domains
are observed nearly simultaneously (with as little delay as only a second between different
wavelengths) with a spatial resolution of one second of arc
This is accomplished by obtaining precisely coaligned image sequences of photosphere
transition region and corona with high spatial resolution and uninterrupted viewing of the
Sun for up to eight months
TRACE Mission
TRACE explores the magnetic field in the solar atmosphere by studyingbull The 3-dimensional field structure
bull Its temporal evolution in response to photospheric flows
bull The time-dependent coronal fine structure
bull The coronal and transition region thermal topology
TRACE was launched on a Pegasus launch vehicle from Vandenberg Air Force Base in April
1998 The launch was scheduled to allow joint observations with SOHO during the rising
phase of the solar cycle to sunspot maximum No transition region or coronal imager has
witnessed the onset and rise of a solar cycle
Pegasus in flight
The two satellites provide complementary observations TRACE produces the high spatial
and temporal resolution images while SoHO yields images and spectral data out to 30 solar
radii at much lower spatial and temporal resolution Jointly they provide the opportunity to
obtain simultaneous digital measurements of all the temperature regimes of the solar
atmosphere in both high-resolution imaging and spectroscopy
With these data we expect to shatter the current ignorance of coronal heating and impulsive
MHD phenomena with benefits not only to solar physics but also to studies ranging from
stellar activity to the MHD of accretion disks The magnetograms produced by MDI on SoHO
provide a complete record of the eruption and distribution of photosphere magnetic fields
which will be invaluable for understanding TRACE observations of coronal hole formation
and coronal mass ejections Both of these phenomena have profound effects on our space
environment and the Earth`s magnetic field
TRACE is the first US solar research satellite since the Solar Maximum Mission
Coordination with SOHO provides an unprecedented opportunity to follow the emergence of
magnetic flux from the base of the convection zone deep inside the Sun through the
photosphere chromosphere and transitional region to the low-beta outer corona while
observing the effects of this emergence such as coronal mass ejections with high spatial andtemporal resolution
832019 Ew Afgewerkte Final
httpslidepdfcomreaderfullew-afgewerkte-final 3859
38
The transition from the photosphere where magnetic fields and plasma are in rough
equipartition to the corona where magnetic fields dominate is extremely difficult to model
and until recently to observe at high temporal and spatial resolution Many of the physical
problems that arise here such as plasma confinement reconnection wave propagation and plasma heating arise throughout space physics and astrophysics The detailed study of these
processed in the solar outer atmosphere is invaluable to astrophysics in general and stellar
studies in particular
More information about TRACE observations can be found on
httptracelmsalcomOperationsGeneraloperatiohtm
832019 Ew Afgewerkte Final
httpslidepdfcomreaderfullew-afgewerkte-final 3959
39
Reuven Ramaty High Energy Solar Spectroscopic Imager (RHESSI)
httphesperiagsfcnasagovhessibrochurehtm
What Questions will HESSI Address
bull How is such a large amount of energy released so rapidly during a flare
bull How are so many electrons and protons accelerated so quickly to such high energies
bull Where are the electrons and protons accelerated in the solar atmosphere and where do
they deposit their energy
How will HESSI Address these Questions
HESSI shown below will concentrate on electrons and protons accelerated in solar flares
through observations of the X-rays and gamma rays that they produce
bull HESSI will obtain the first ever X-ray and gamma-ray images of flares from 100 keV
to 20 MeVbull HESSI will do the first ever nuclear gamma-ray line spectroscopy of solar flares
bull HESSI will obtain pictures of flares in X-rays with an angular resolution of 2
arcseconds a factor of three better than previously possible
bull HESSI will measure X-ray and gamma-ray spectra with less than 1 keV energy
resolution a factor of 20-40 better than previously possible with scintillation counters
More information about the RHESSIrsquos Mission can be found on
httphesperiagsfcnasagovhessiconcepthtm
832019 Ew Afgewerkte Final
httpslidepdfcomreaderfullew-afgewerkte-final 4059
40
Solar Radiation and Climate Experiment (SORCE)
httplaspcoloradoedusorcesciencebackgroundhtm
The Solar Radiation and Climate Experiment (SORCE) is a NASA-sponsored satellite
mission that is providing state-of-the-art measurements of incoming x-ray ultraviolet visiblenear-infrared and total solar radiation The measurements provided by SORCE specifically
address long-term climate change natural variability and enhanced climate prediction and
atmospheric ozone and UV-B radiation These measurements are critical to studies of the Sun
its effect on our Earth system and its influence on humankind
The SORCE spacecraft was launched on January 25 2003 on a Pegasus XL launch vehicle to
provide NASAs Earth Science Enterprise (ESE) with precise measurements of solar
radiation It launched into a 645 km 40 degree orbit and is operated by the Laboratory for
Atmospheric and Space Physics (LASP) at the University of Colorado (CU) in Boulder
Colorado USA It will continue the precise measurements of total solar irradiance (TSI) that
began with the ERB instrument in 1979 and has continued to the present with the ACRIM series of measurements SORCE will also provide the measurements of the solar spectral
irradiance from 1nm to 2000nm accounting for 95 of the spectral contribution to TSI
SORCE carries four instruments including the Spectral Irradiance Monitor (SIM) Solar
Stellar Irradiance Comparison Experiment (SOLSTICE) Total Irradiance Monitor (TIM) and
the XUV Photometer System (XPS)
The primary goal of the NASA Earth Observing Systems (EOS) SOlar Radiation and Climate
Experiment (SORCE) is to enable solar-terrestrial studies by providing precise daily
measurements of the total solar irradiance (TSI) and the solar spectral irradiance atwavelengths extending from the ultraviolet to the near infrared The following lists the
SORCE science objectives
1 Make accurate measurements with high precision of total solar irradiance connect
them to previous TSI measurements and continue this long-term climate record
Provide TSI with an accuracy of 001 (100 parts per million) based on SI units and
with a long-term repeatability of 0001yr
2 Make daily measurements of the solar ultraviolet irradiance from 120 to 300 nm with
a spectral resolution of 1 nm Achieve this spectral irradiance measurement with an
accuracy of better than 5 and with a long-term repeatability of 05yr Use the
solarstellar comparison technique to relate the solar irradiance to the ensembleaverage flux from a number of bright early-type stars (same stars used by the UARS
SOLSTICE program)
3 Make the first measurements of the visible and near IR solar irradiance with sufficient
precision for future climate studies Obtain daily measurements of solar spectral
irradiance between 03 and 2 microm with a spectral resolution of at least 130 an
accuracy of 003 and a long-term repeatability of better than 001yr
4 Improve the understanding of how and why solar irradiance varies estimate past and
future solar behavior and investigate climate responses
More information about SORCE can be found on
httplaspcoloradoedusorcesciencescience_opshtm
832019 Ew Afgewerkte Final
httpslidepdfcomreaderfullew-afgewerkte-final 4159
41
Appendix VI Wavelengths
httpeosweblarcnasagovEDDOCSWavelengths_for_Colorshtml
As you can see on the figure visible light situates in the centre of the wavelengths having not
the shortest nor the longest wavelengths Gamma rays have the shortest wavelength radioways the longest All sort of wavelengths are used for daily purpose like radio waves for
radio and TV and gamma rays for treatments
832019 Ew Afgewerkte Final
httpslidepdfcomreaderfullew-afgewerkte-final 4259
42
Appendix VII Absorption lines in the sunrsquos spectrum
Picture httpwwwsolarnavigatornetthe_sunhtmExplanation COMINS NF and KAUFMANN III WJ Discovering the universe eighth edition WHFreeman and Company New York 2008 p 109
This photo is called a spectrogram It contains the spectrum of the sun All the black lines are
absorption lines The amount of black lines is related to the amount of elements that the sun
is emitting From a spectrogram we can deduct a lot of things including their mass the
temperature of the surface the chemical composition of the sun rotation rates and much
more
832019 Ew Afgewerkte Final
httpslidepdfcomreaderfullew-afgewerkte-final 4359
832019 Ew Afgewerkte Final
httpslidepdfcomreaderfullew-afgewerkte-final 4459
44
Appendix IX Butterfly-diagram
httpspacesciencespacerefcomsslpadsolarimagesbflygif
A butterfly-diagram
In a butterfly-diagram we can find the sunspots with their latitude (y-axis) through the years(x-axis) As you can see the sunspots appear like lsquobutterfliesrsquo this was discovered in 1904 by
Edward Maunder (1851-1928 an English astronomer best remembered for his study of
sunspots and the solar magnetic cycle) Thatrsquos why this graph is also called Maunders
butterfly diagram
832019 Ew Afgewerkte Final
httpslidepdfcomreaderfullew-afgewerkte-final 4559
45
Appendix X The Wolf-numbers
httpsidcomabenews106sunspotnumberclarifiedpdf
The sunspot number clarified By Petra Vanlommel
Which kinds of daily International Sunspot Numbers (ISN) are currentlypublished by the SIDC
Three daily indices are currently published by the SIDCthe Estimated ISN (EISN)the Provisional ISN (PISN)the Definitive ISN (DISN)Although they are all based on the same type of observations ie visual sunspot counts as ameasure of solar activity they are obtained from different data sets by different processingmethods with different accuracies and they serve different purposes
In the ideal case the three numbers are equal but in practice it is inevitable that there aresmall differences Therefore It is useful to explain what each index actually means
What is the source of the Wolf number
Once per day observers worldwide communicate their measured Wolf number (= 10G + S)based on visual sunspot (S) and group (G) counts to the World Data Center for the SunspotIndex Presently this is done through a dedicated password-protected WEB form the Wolfinterface However some observers still use the old way of reporting their observations onpaper through regular mail This method slows down the final processing but for the sake ofcontinuity in the index it is important to keep these observers included as some of them
represent the longest individual datasetsThe observers give the exact observing time the observing conditions the total numbers(group count sunspot count and Wolf number) and optionally the NorthSouth and centralzone numbers The observers using the web interface can provide their results to the SIDCimmediately after each observation However some users prefer to insert their data as ablock creating some delay but this must be done at least once a month
The personal reduction coefficient K
A personal reduction coefficient K is calculated for each station It has values typically in therange 04 and 17 and leads to a normalized sunspot number K(10G+S) In other words theK factor rescales the raw sunspot counts of each observer to the ones of Rudolph Wolf the
astronomer who introduced the above Wolf formula thus simulating the same eyes sametelescope and same conditionsDuring the procedure for calculating the Provisional ISN the K factor of every station iscomputed for every observation that passes the elimination procedure Once a year apersonal K factor for every station and for every month of the previous year is calculated Ayearly mean K value per station is also computed
The estimated sunspot index
The Estimated ISN (EISN) is calculated and issued on a daily basis for the day of calculationand the day before Only the total EISN is calculated with no hemispheric index It is anautomated procedure and no manual intervention is done The EISN is meant as a quicktemporary and approximate index for real-time applications
832019 Ew Afgewerkte Final
httpslidepdfcomreaderfullew-afgewerkte-final 4659
46
We use the raw Wolf number from all observatories that have provided counts early in theday ie before 1230 UT Typically there is between 10 and 20 stations available Thecalculation of the EISN is based on a simple and straightforward statistical method The Wolfnumbers are multiplied with the yearly mean K factor (see paragraph about the personalreduction coefficient K) The EISN is a simple average of the K-scaled values after excludingany individual value that deviates abnormally from the other valuesOnce the Provisional ISN (PISN) is calculated after the end of a month the temporary EISNis dropped and replaced by the PISN
The provisional sunspot Index
The Provisional ISN (PISN) is calculated and issued on the first of every month Theoutcome is a daily total and hemispheric sunspot number for the entire elapsed month Anexample on the first of September we calculate the daily PISN for each day of August ThePISN is computed semi-automatically with as little manual intervention as possibleTo calculate the PISN values for the concerned month we use all Wolf numbers Typicallythere is data from around 65 stations available
The calculation of the PISN is based on an extensive statistical treatment This treatmentfilters out any abnormal daily observation or the complete data set from an erratic station(quality control) This prevents long-term drifts in the resulting index One of the key elementsderived from this processing is to update the K reduction coefficients for each station theevolution of each station is monitored for each day relative to the entire networkA subset of the contributing stations also provides hemispheric counts A similar process isapplied to the North and South counts to derive the hemispheric PISN There is an additionalconstraint the sum of the North and South ISN must match the total ISNThe PISN replaces the EISN And once the Definitive ISN (DISN) is calculated the DISNreplaces the PISN
The definitive sunspot index
The Definitive ISN is calculated and issued on a quarterly basis when we have collecteddata from all the contributing observatories This is the final index and it is appended to thehistorical sunspot index time series The same semi-automated treatment as for the PISN isnow applied to the full data set If the result agrees within 5 of the PISN value the PISN iskept and becomes definitive Otherwise the new calculated value replaces the PISN andbecomes the definitive ISNIt is only at this stage and only in peculiar situations that a manual verification by ourscientific staff is required For example this happens when the observed raw Wolf valuesfrom the whole network are clustered around two distinct values This special case can becaused by small short-lived isolated sunspots (lifetimes lt 24 hours) or by the appearance ordisappearance of a large group at the solar limb in the course of one UT dayThe DISN replaces the provisional and estimated International Sunspot Number
Handling very low activity levels
One of the situations requiring a human arbitration is associated with single small isolatedand short-lived sunspots This is most noticeable around the minimum of the solar activitycycle like the one occurring now in 2008 Due to the 24hour binning (observations aregrouped between 0hUT and 24hUT) and the variable ability of each observer to detect thesmallest sunspots we end up with some stations reporting one sunspot and others who didno see any sunspot Let us explain further No sunspot may mean that the sunspot waspresent but the observer was unable to see it because of poor observational conditions such
as weather a small telescope On the other hand it may also indicate that the sunspot hadactually vanished by that time while it was present earlier on the same day
832019 Ew Afgewerkte Final
httpslidepdfcomreaderfullew-afgewerkte-final 4759
47
Individual stations do not observe at exactly the same timeIn order to validate the existence of such a marginal reported sunspot a qualified SIDCscientist must then check the detailed chronology within that day and consider the overallobserver capability (value of K coefficient)In common practice the fact that a sunspot is reported by a significant group of observersleads to the inclusion of the sunspot on that date thus neglecting the no-sunspotobservationsThe rationale is multiple observations of a sunspot exclude the possibility that the reportedsunspot was an independent false detection So a sunspot was really present on that dayalthough it may have existed only for part of the day or it was small enough to be missed bypart of the observers with smaller instruments or imperfect atmospheric conditionsAlso keep in mind that the sunspot index is derived with a limited precision just like any otherindex If the monthly mean sunspot number is 0 or 05 you can definitely say that activitywas low
What index should be used
If you want to perform long-term investigations the definitive ISN series is definitely the mostsuitable However there is a delay of a few months So when investigating the last cycle andrecent evolution use the definitive numbers in combination with the provisional ISN to be upto date to the last month The provisional numbers are also used in models forecasting thesunspot number for the coming months Now if you need a proxy for solar activity in a modelthat runs in real-time then you may use the estimated ISNImprovements and rethinking of the processing method is an ongoing project We arecurrently developing an alternative program for calculating the PISN Of course long-termconsistency is vital Therefore a cross-analysis between the output from the old and newsoftware must be applied over an extended period
832019 Ew Afgewerkte Final
httpslidepdfcomreaderfullew-afgewerkte-final 4859
48
Above graphs show different kinds of the International Sunspot Number The left plot gives an overview from 1700 up to now from the yearly (black) and monthly smoothed Sunspot Number The graph in the right top corner shows the monthly and monthly smoothed sunspot number while the graph in the right bottom corner show the daily monthly smoothed monthly sunspot number For every the time range of investigation there is an appropriate sunspot number
832019 Ew Afgewerkte Final
httpslidepdfcomreaderfullew-afgewerkte-final 4959
49
Appendix XI Filaments and prominences
httpsohowwwnascomnasagovpickoftheweekold26feb2004
This is a picture taken by SOHO on 26 February 2004
832019 Ew Afgewerkte Final
httpslidepdfcomreaderfullew-afgewerkte-final 5059
50
Appendix XII The reconnection of magnetic loops
httpwwwioporgEJarticle0004-637X558287253575webpdfrequest-id=73e38daa-69ae-4e01-b9a6- b4bd0ba071dd
In (a) sunspot B and C have different polarity and move towards each other The twomagnetic loops will reconnect and form one big magnetic loop showed in (b) This will
happen to other magnetic loops too as can be seen in (c) When G en F are close enough they
will reconnect and so E en H will reconnect too It is possible that the magnetic field line is
trapped around another in this case AD The mass ejected from the sun will be trapped
between the magnetic field lines and form a solar prominence
832019 Ew Afgewerkte Final
httpslidepdfcomreaderfullew-afgewerkte-final 5159
832019 Ew Afgewerkte Final
httpslidepdfcomreaderfullew-afgewerkte-final 5259
52
httptheinvisibleagentwordpresscom20090117amazing-celestial-images
An group of active prominences
httpapodnasagovapodap051109html
httpwhassupinthemilkywayblogspotcom200903cloudy-planhtml
A picture taken by SOHO In the left corner you can see the prominence with twisted
magnetic field lines
832019 Ew Afgewerkte Final
httpslidepdfcomreaderfullew-afgewerkte-final 5359
53
Appendix XIV Polar crown
httpsciencenasagovheadlinesy200817sep_polarcrownhtm
Photograph of a polar crown taken on 13 June 1999 by the Meudon Observatory
832019 Ew Afgewerkte Final
httpslidepdfcomreaderfullew-afgewerkte-final 5459
54
Appendix XV Coronal holes
httpsunearthdaynasagov2007multimediagal_020php
The black segment is a huge coronal hole The bright parts are x-rays from sunspots
832019 Ew Afgewerkte Final
httpslidepdfcomreaderfullew-afgewerkte-final 5559
55
Appendix XVI Coronal mass ejection
httpzuserver2staruclacuk~idhapodap000309html
Picture of a CME taken by SOHO in February 2000
832019 Ew Afgewerkte Final
httpslidepdfcomreaderfullew-afgewerkte-final 5659
56
Bibliography
Books
BEATTY JK PETERSEN CC and CHAIKIN A The new solar system fourth edition
Cambridge University Press Cambridge 1999 421 p
COMINS NF and KAUFMANN III WJ Discovering the universe eighth edition WH
Freeman and Company New York 2008 535 p
DETHIER T Het zonnestelsel Standaard Uitgeverij 1992 415 p
GOLUB L and PASACHOFF JM Nearest star the surprising science of our sun Harvard
university press Harvard 2001 267 p
GREEN SF and JONES M H An introduction to the Sun and Stars The Open University
Cambridge 2004 373 p
HILL S and CARLOWITZ M The sun Abrams New York 2006 239 p
HOLMAN GD lsquoThe mysterious origins of solar flaresrsquo Scientific America April 2006 p
24-31 volume 294 number 4
JANSSENS J Zon en aarde een unieke relatie Garant Antwerpen 2003 254 p
KELLER H-U Van Supernovarsquos tot zwarte gaten Tirion Natuur AH Baarn 2003 169 p
LANG KR Sun earth and sky Springer Germany 1995 282 p
LILENSTEN J and BORNAREL J Sous les feux du soleil EDP Sciences Les Ulis Cedex
A 2001 247 p
832019 Ew Afgewerkte Final
httpslidepdfcomreaderfullew-afgewerkte-final 5759
57
Articles
CUYPERS J and others lsquoLa rechercheacute en heacuteliophysique en Belgiquersquo Space connection
October 2007 20 p
DE KEYSER J lsquoDe magnetopauzersquo Heelal maart 1998 p 66-73
JANSSENS J lsquoHet maximum van de 23ste zonnevlekkencyclus (I)rsquo Heelal Oktober 1998 p
256-263
JANSSENS J lsquohet maximum van de 23ste zonnenvlekkencyclus (II)rsquo Heelal November
1998 p 284-290
JANSSENS J lsquoZonnefakkelsrsquo Heelal Oktober 1994 p 256-261
SMITS F lsquoDe coronarsquo Heelal Februari 1999 p 40-42
SMITS F lsquoProtuberanzenrsquo Heelal Juli 1991 p 182-185
VAN DEN BERGHE S lsquoHet Zeemaneffectrsquo Heelal September 1998 p 228-231
832019 Ew Afgewerkte Final
httpslidepdfcomreaderfullew-afgewerkte-final 5859
58
Webography
BOEN B Birth of a coronal mass ejection Internet
(httpwwwnasagovmission_pagessolar-b solar_005html) 290408
BRAEUNIG R A Glossary Internet (httpwwwbraeunigusspaceglossaryhtm) 2006
CORDIS Researchers reveal why Suns atmosphere is hotter than its surface Internet
(httpcordiseuropaeusearchindexcfmfuseaction=newsdocumentampN_LANG=ENampN_R
CN=30598amppid=0ampq=87F36474805A6BEC0B89404F72D0351Famptype=sim) 20032009
DAY C Alfveacuten waves may heat the Sunrsquos corona Internet
(httpblogsphysicstodayorgupdate200903 alfven-waves-may-heat-the-sunshtml)
310309
ELLERMAN F Solar prominences Internet (httparticlesadsabsharvardedufull
1928ASPL173E 0000074000html) (03042009)
ENCYCLODPEDIA OF SCIENCE Corona hole Internet
(httpwwwdaviddarlinginfoencyclopediaC coronal_holehtml) (04042009)
HATHAWAY D H The sunspot cycle Internet
(httpspacesciencespacerefcomsslpadsolarsunspots htm) 04012000
JANSSENS J The case of the missing solar cycle (published in lsquoheelalrsquo January 2008)
Internet (httpuserstelenetbejjanssensMSCwebEngpdf)
KNISELY D Solar prominences Internet
(httpwwwicstarscomHTMLSolarSectionHAlphaOBSERVINGTHESUNHAlpha3html)
(03042009)
KOPANSKI J Atom Internet (httpknolgooglecomkjan-
kopanskiatom1amrwrct7rvi27) 060209
MARTENS PC and ZWAAN C Origin and evolution of filament-prominence systems
Internet (http wwwioporgEJarticle0004-637X558287253575webpdfrequest-
id=73e38daa-69ae-4e01-b9a6-b4bd0ba071dd) 092001
NASA The corona Internet (httpsolarsciencemsfcnasagovcoronashtml) 180107
NASA The heliosphere Internet (httpheliosgsfcnasagovheliosphhtml) 20012009
OFFICIAL SITE OF STONEHENGE About Stonehenge Internet
(httpwwwstonehengecouk) (03022009)
OTTERSDORF M Astronomy On the sunspot cycle Internet
(httpuserszoominternetnet~matto MCASsunspot_cyclehtmZeemaneffect) 031103
PARIAT E and SCHMIEDER B Magnetic flux emergence Internet(httpwwwscholarpediaorgarticleMagnetic_field_emergence) 18042008
832019 Ew Afgewerkte Final
httpslidepdfcomreaderfullew-afgewerkte-final 5959
59
PRIEST E R Dynamics and Structure of Quiescent Solar Prominences Internet
(httpbooksgooglebe booksid=h599q3jz1w4Campdq=quiescent+prominencesampprintsec=fro
ntcoverampsource=blampots=58b79Qeyabampsig=1eklQ-
WszOIebZZaq7fq7gm6bxAamphl=nlampei=urPtSe7ZCo61-
Qa166jHDwampsa=Xampoi=book_resultampct=result ampresnum=3PPA6M2) 1989
RUSSELL R Rotation of the sun Internet
(httpwwwwindowsucaredutourlink=sunSolar_interior
Sun_layersdifferential_rotationhtml) 16082005
RUSSELL R Sunspots and magnetic fields Internet
(httpwwwwindowsucaredutourlink=sunatmospheresunspot_magnetismhtmlampedu=hig
h) 060908
UNIVERSITY OF GLASGOW Bibliography of Peter Sweet Internet
(httpwwwuniversitystoryglaacuk biographyid=WH2144amptype=P) (10042009)
WIKIPEDIA Orbiting Solar Observatory Internet
(httpenwikipediaorgwikiOrbiting_Solar_Observatory) 24012009
WINDOWS TEAM Maunderrsquos Butterfly Diagram Internet
(httpwwwwindowsucaredutourlink=sun activitybutterflyhtml) 2000
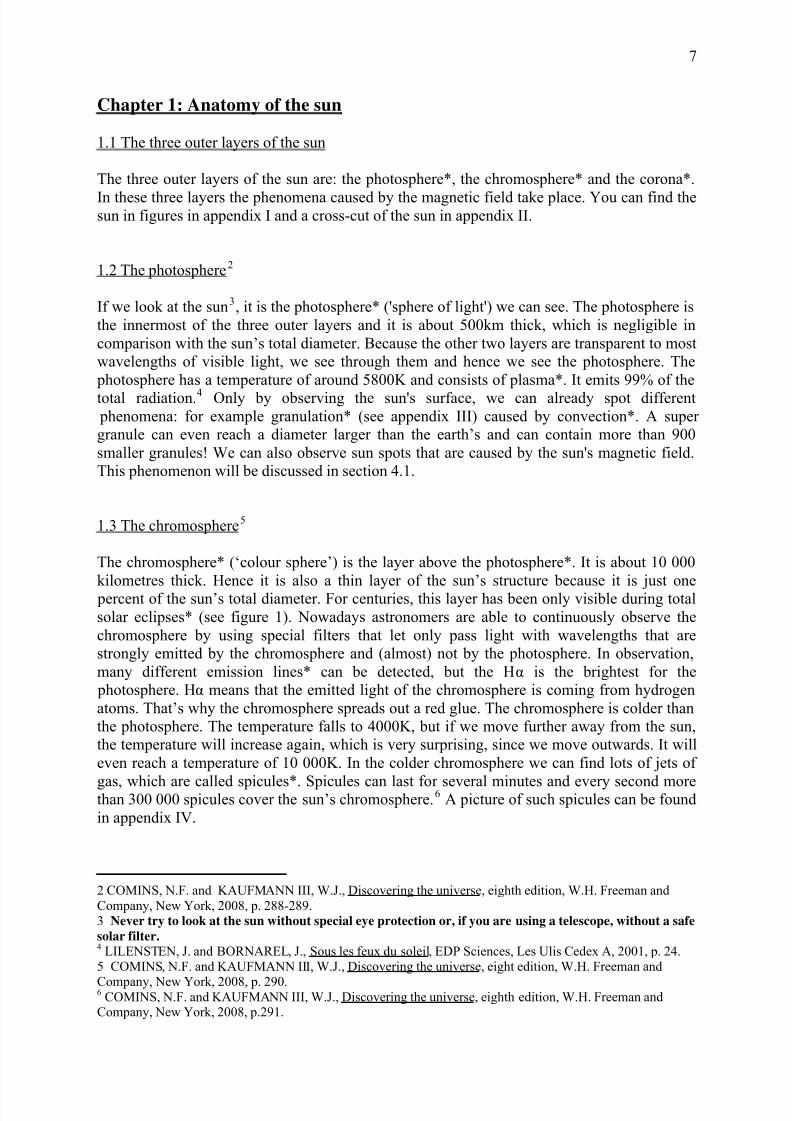
832019 Ew Afgewerkte Final
httpslidepdfcomreaderfullew-afgewerkte-final 759
7
Chapter 1 Anatomy of the sun
11 The three outer layers of the sun
The three outer layers of the sun are the photosphere the chromosphere and the corona
In these three layers the phenomena caused by the magnetic field take place You can find thesun in figures in appendix I and a cross-cut of the sun in appendix II
12 The photosphere2
If we look at the sun3 it is the photosphere (sphere of light) we can see The photosphere is
the innermost of the three outer layers and it is about 500km thick which is negligible in
comparison with the sunrsquos total diameter Because the other two layers are transparent to most
wavelengths of visible light we see through them and hence we see the photosphere The
photosphere has a temperature of around 5800K and consists of plasma It emits 99 of the
total radiation4 Only by observing the suns surface we can already spot different phenomena for example granulation (see appendix III) caused by convection A super
granule can even reach a diameter larger than the earthrsquos and can contain more than 900
smaller granules We can also observe sun spots that are caused by the suns magnetic field
This phenomenon will be discussed in section 41
13 The chromosphere5
The chromosphere (lsquocolour spherersquo) is the layer above the photosphere It is about 10 000
kilometres thick Hence it is also a thin layer of the sunrsquos structure because it is just one
percent of the sunrsquos total diameter For centuries this layer has been only visible during total
solar eclipses (see figure 1) Nowadays astronomers are able to continuously observe the
chromosphere by using special filters that let only pass light with wavelengths that are
strongly emitted by the chromosphere and (almost) not by the photosphere In observation
many different emission lines can be detected but the Hα is the brightest for the
photosphere Hα means that the emitted light of the chromosphere is coming from hydrogen
atoms Thatrsquos why the chromosphere spreads out a red glue The chromosphere is colder than
the photosphere The temperature falls to 4000K but if we move further away from the sun
the temperature will increase again which is very surprising since we move outwards It will
even reach a temperature of 10 000K In the colder chromosphere we can find lots of jets of
gas which are called spicules Spicules can last for several minutes and every second morethan 300 000 spicules cover the sunrsquos chromosphere6 A picture of such spicules can be found
in appendix IV
2 COMINS NF and KAUFMANN III WJ Discovering the universe eighth edition WH Freeman and
Company New York 2008 p 288-2893 Never try to look at the sun without special eye protection or if you are using a telescope without a safe
solar filter 4 LILENSTEN J and BORNAREL J Sous les feux du soleil EDP Sciences Les Ulis Cedex A 2001 p 245 COMINS NF and KAUFMANN III WJ Discovering the universe eight edition WH Freeman and
Company New York 2008 p 2906COMINS NF and KAUFMANN III WJ Discovering the universe eighth edition WH Freeman and
Company New York 2008 p291
832019 Ew Afgewerkte Final
httpslidepdfcomreaderfullew-afgewerkte-final 859
8
Figure 1 The chromosphere spreading out red
httpwwwwindowsucaredusunimageseclipsechromosphere_sun_eclipse_1999jpg
14 The corona7
A lot of people have already seen a (partial) solar eclipse On some places when the moon is
completely in front of the sun we can see a wonderful glow appearing around the dark
shadow of the moon This wide-stretched expanding glue of light is called the corona
However we cannot see the suns corona when there isnt a solar eclipse because the light
emitted by the suns surface outshines the coronas light by far Yet we can use a coronagraph
to observe the sun This instrument is like a telescope but it covers the surface of the sun with
a black circle If we take a closer look at the suns corona we can distinguish some visible
structures such as corona loops which are explained in chapter 4 The lines which can be
observed in the corona suggest that the sun has a strong magnetic field
Figure 2 The sunrsquos corona
httpapodnasagovapodap060407html
The corona extends millions of kilometres into space and is a very tenuous layer of the sun
Yet it reaches a temperature of over one million Kelvin This enormous increase of the
temperature was discovered around 1940 by Bengt Edleacuten (a Swedish professor of physics and
astronomer who was specialized in spectroscopy 1906-1993) who did some experiments
with ionized gas8 The spectrum of the sunrsquos corona contained much emission lines from
7
SMITS F lsquoDe coronarsquo Heelal February 1999 p 40-428GREEN SF and JONES M H An introduction to the Sun and Stars The Open University Cambridge
2004 p 31
832019 Ew Afgewerkte Final
httpslidepdfcomreaderfullew-afgewerkte-final 959
9
some highly ionised elements for example Fe13+ which tells us that the corona has a
temperature from one million Kelvin up to two million Kelvin 9 Despite this very high
temperature the corona has a very low density If it had the density of the sunrsquos surface it
would certainly outshine the photosphere10
Yet not all the secrets of the corona have been solved yet Some scientists already had someideas of where the high temperature of the corona comes from but none of them are fully
satisfactory One of the explanations is the theory of the spicules These spicules would heat
the temperature of the corona since they are very common on the sunrsquos surface On the other
hand it is possible that little solar flares heat up the corona Their amount seems so large that
these small solar flares can be an important element in the explanation for the high
temperature of the sunrsquos corona But the most acceptable explanation so far is the one of the
Alfveacuten waves11 Alfveacuten waves are formed by the local movement of the magnetic fields The
gas in the corona moves upwards and downwards along the magnetic field lines But the gas
struggles against this vibration The Alfveacuten wave will lose its energy and it will convert this
energy into heat But there are also many other possible explanations for the extremely high
temperature of the sunrsquos corona Recently the idea of reconnection has been developed Theconcept of the reconnection is briefly explained in the section of solar flares 12
The sunrsquos corona may look ordinary but yet it gives birth to an event that is called the solar
wind (see chapter 4) This solar wind is caused by an outflow of gases coming from the
sun13 Itrsquos important to understand how the solar wind works because the solar wind can
cause some aggravating side effects on earth for example it can cut off the electricity on earth
for millions of people or disturb the working of satellites if it gets too strong But the solar
wind also causes the beautiful phenomenon of the aurora on earth Yet this is not the focus
of this paper
9 GREEN SF and JONES M H An introduction to the Sun and Stars The Open University Cambridge2004 p 3110
NASA The corona Internet (httpsolarsciencemsfcnasagovcoronashtml) 180107COMINS NF and KAUFMANN III WJ Discovering the universe eighth edition WH Freeman andCompany New York 2008 p 29111 DAY C Alfveacuten waves may heat the Sunrsquos corona Internet (httpblogsphysicstodayorgupdate200903alfven-waves-may-heat-the-sunshtml) 310309
12 JANSSENS J Zon en aarde een unieke relatie Garant Antwerpen 2003 p 4913BEATTY JK PETERSEN CC and CHAIKIN A The new solar system eighth edition Cambridge
University Press Cambridge 1999 p 28
832019 Ew Afgewerkte Final
httpslidepdfcomreaderfullew-afgewerkte-final 1059
10
Chapter 2 Observation of the sun
21 History
Men have been observing the sun from the very beginning We know that the sun was very
important for the prehistoric people many historical monuments testify this One of the mostfamous monuments is Stonehenge14 Men were constructing Stonehenge for centuries during
the Stone Age We cannot assume that ancient observers of the sun could predict solar
eclipses but they were able to build a construction that was adjusted to the rising of the sun
on special days such as Solstice Stonehenge is not the only example of the importance of
the sun over the years There is also Newgrange a well-known passage-tomb situated in
Ireland north of Dublin and many other monuments
In the beginning our sun was regarded as a God Nowadays we no longer see the sun as a
God or a natural force But still the sun is strongly influencing our lives It still provides us
with light and warmth and makes it possible to live on earth Many scientists have been
interested in the sun All of them wanted to know how the sun really functions
Letrsquos take a quick tour through the history of the observation of the sun Scientists of ancient
China made the first record of a solar eclipse in 2134 BC In the Middle Ages Galileo (1564-
1642) used the first telescope to map the sunspots he saw on the sunrsquos surface
Unfortunately he watched through his telescope without a special filter blinding himself On
April 2 1845 Louis Feacutezeau and Leacuteon Foucault had a world scoop they took the first
photograph of the sun clearly registrating the sunspots15
Years later the first satellites observing the sun called OSOrsquos (Orbiting Solar
Observatories)
16
have been launched into space to observe the 11-year-solar cycle between1962 and 197517 Many of them followed the most important satellites observing the sun are
described in appendix V Nowadays satellites keep an eye on the sun every second Still the
mystery of the sun and her magnetic field hasnrsquot been solved completely yet
22 Light18
221 Visible light
Light is a form of electromagnetic waves The light we see is actually only a small fraction of
all the light emitted in the universe A huge part of all the emitted light is not visible to our eyes Thatrsquos why men made telescopes especially designed to observe the light we canrsquot see
with our eyes
14 OFFICIAL SITE OF STONEHENGE About Stonehenge Internet (httpwwwstonehengecouk)(03022009)15
HILL S and CARLOWITZ M The sun Abrams New York 2006 p 82 83 9316
JANSSENS J Zon en aarde een unieke relatie Garant Antwerpen 2003 p 8917
WIKIPEDIA Orbiting Solar Observatory Internet (httpenwikipediaorgwikiOrbiting_Solar_Observatory)2401200918 COMINS NF and KAUFMANN III WJ Discovering the universe eighth edition WH Freeman and
Company New York 2008 chapter 4GREEN SF and JONES M H An introduction to the Sun and Stars The Open University Cambridge 2004 p 18-26
832019 Ew Afgewerkte Final
httpslidepdfcomreaderfullew-afgewerkte-final 1159
11
222 Composition of light
Light is composed of waves Different wavelengths represent different colours The colour of
the light depends on the wavelength λ Wavelength is measured in nanometre Visible light
has a range from 400 nanometre to 700 nanometre It consists of red orange yellow green
blue and violet Of all the visible light violet light has the shortest wavelength and red lightthe longest
223 Non-visible light
As previously mentioned visible light is not the only light in the universe There are many
more wavelengths Maxwell (1831-1879) discovered the infrared radiation This light has a
longer wavelength than red light This however is not visible to the human eye Apart from
infrared light much other not-visible light has been discovered Radio waves have the longest
wavelength of all We use them for example for our mobile phones Gamma rays have the
shortest wavelength of all We use gamma rays for cancer radiotherapy The other wavelengths of light are visible in appendix VI
23 Spectroscopy19
231 Introduction to spectroscopy
An interesting way of observing the sun is using spectroscopy We can distinguish 3
different types of spectra continuous spectrum absorption spectrum and emission spectrum
The last two are called line spectra This means we will not observe the spectrum of the
emitting body itself but we will use another medium in this case thin gas
232 Continuous spectrum
Continuous spectrum means we use the unbroken range of wavelengths to observe objects
emitting light We observe the light emitted by an object directly without using a medium
This method however isnrsquot used very often because itrsquos difficult to observe an object
directly
233 Line spectrum20
2331 Absorption spectrum
For the absorption spectrum we use absorption lines These lines are created by the thin gas
(which gas doesnrsquot matter but the absorption lines will be different then) The wavelengths of
the body we want to observe go through the tin gas but the atoms of the gas will absorb some
of the wavelengths Because those wavelengths are absorbed by the atoms of the gas the
19 GREEN SF and JONES M H An introduction to the Sun and Stars The Open University Cambridge
2004 p 20-2620COMINS NF and KAUFMANN III WJ Discovering the universe eighth edition WH Freeman and
Company New York 2008 p 109-113
832019 Ew Afgewerkte Final
httpslidepdfcomreaderfullew-afgewerkte-final 1259
12
wavelengths cannot appear in the absorption spectrum of the body we observe We can notice
in appendix VII the absence of some wavelengths by the black lines Such lines are called
absorption lines They correspond to the wavelengths that are absorbed by the gas
2332 Emission spectrum
We can also examine the light emitted by the gas The atoms of the gas absorb some
wavelengths emitted by the object we actually want to observe but afterwards they will emit
those wavelengths again as photons This gives us a number of bright lines called emission
lines For many gases the wavelengths of the absorption lines will be the same as those
from the emission lines
234 The Zeemaneffect 21
In 1896 Pieter Zeeman (1865-1943) discovered that some spectrum lines split up A spectrumline emitted in a magnetic field will split up into different spectrum lines close to each other
This is called the Zeemaneffect
If the magnetic field is strong enough and is parallel with the direction of observation the
absorption line splits up into two lines one on the left side of the normal absorption line
(which means a smaller wavelength) and one on the right side of the absorption line (which
means a higher wavelength) If there is a magnetic field straight on our direction of
observation the absorption line will even split up into three lines one line will represent the
normal absorption line the other two will be just like with a parallel magnetic field
Figure 3 The Zeemaneffect
httpchemteaminfoGalleryGallery16html
How does a magnetic field influence an electron We can find an explanation in the Quantum
theory The magnetic field will interact with the atoms so that the electrons will reach
slightly different energy levels Atoms with different energy levels will emit different
wavelengths This explains the multiple lines of the Zeemaneffect
The divergence of the splitting depends on the force of the magnetic field which means we
can determine the size of the magnetic field by observing the Zeemaneffect
21VAN DEN BERGHE S lsquoHet Zeemaneffectrsquo Heelal september 1998 p 228-231
KOPANSKI J Atom Internet (httpknolgooglecomkjan-kopanskiatom1amrwrct7rvi27) 060209
832019 Ew Afgewerkte Final
httpslidepdfcomreaderfullew-afgewerkte-final 1359
13
Chapter 3 The solar cycle
31 Introduction
In this chapter we will concentrate on the long term evolution of the global magnetic field of
the sun It is important to understand the long-term evolution of the global magnetic field of the sun because the global magnetic field has a great influence on the magnetic field on a
local scale The sunrsquos magnetic field changes every 11 years This is why we call it the 11-
year-solar cycle However strictly speaking it is a 22-year-cycle This will be explained later
on in this chapter The record of the first solar cycle started in 175522 Since then itrsquos
currently already the 24th solar cycle
32 Differential rotation
As well as the earth the sun rotates But the sun isnrsquot made of the same matter as our earth on
the surface The sunrsquos surface is made of plasma Because of the plasma the sun will rotateat different speeds depending on latitude At the equator the sun makes a full rotation every
25 days But the rotation will slow down when the latitude increases This means that at the
poles the sun will rotate much slower At the poles the rotation time is 36 days This creates a
gap of more than 10 days23
Astronomers believe that it is only the surface of the sun that undergoes differential rotation
The inner core moves more like a solid body such as the earth but it is still unclear if this is
the case24
33 When the years passhellip25
Differential rotation is the main cause of all the complex phenomena that will be discussed
later on because this differential rotation causes the solar cycle and magnetic disturbance
As mentioned previously before the sunrsquos surface rotates much faster at the equator than at
the poles the plasma around the equator will move faster This is shown in figure 4 on the
next page Since the sun keeps on rotating in the same direction the plasma at the equator will
move much faster26
The magnetic field that the sun normally would have is the same type as the magnetic field of the earth This means the sun normally has the magnetic field resembling to the magnetic field
of a bar magnet Magnetic field lines move from north to south and at the poles the density of
the magnetic field is compact because there the magnetic field lines come together
22 JANSSENS J The case of the missing solar cycle (published in lsquoheelalrsquo January 2008) Internet (httpusers
telenet be jjanssensMSCwebEngpdf)23
DETHIER T Het zonnestelsel Standaard Uitgeverij 1992 p 77-7824
RUSSELL R Rotation of the sun Internet (httpwwwwindowsucaredutourlink=sunSolar_interiorSun_layersdifferential_rotationhtml) 1608200525 CUYPERS J and others lsquoLa rechercheacute en heacuteliophysique en Belgiquersquo Space connection October 2007 p
6-726GREEN SF and JONES M H An introduction to the Sun and Stars The Open University Cambridge
2004 p 72-73
832019 Ew Afgewerkte Final
httpslidepdfcomreaderfullew-afgewerkte-final 1459
14
Figure 4 The magnetic field lines of the sun change because of the differential rotation
httpircameraasarizonaeduNatSci102lecturessunhtm
If we apply the differential rotation on this magnetic field the magnetic field lines under the
photosphere of the sun will move faster at the equator This will cause the following
structure seen on figure 4 on the sun in the middle The magnetic field lines will continue to
get mixed up and the magnetic field lines will pile up This process takes several years
Finally the magnetic field lines will be stacked almost parallel to the sunrsquos equator This is
the sun on the right side in figure 427 You can find a more specific drawing of this process in
appendix VIII
Eventually after approximately eleven years the magnetic field lines will be piled up in such
a way that finally the magnetic field lines will start to pop out of the sunrsquos surface This willcause sunspots Sunspots appear in pairs one with a south ldquopolerdquo and one with a north
ldquopolerdquo The north ldquopolerdquo contains magnetic field lines that are directed outwards and the south
ldquopolerdquo contains magnetic field lines that point inwards28 Sunspots are discussed in more
detail in the next chapter When the sunspots almost come to an end the loops will reconnect
with another sunspot over the equator This connection will cause a switch of the poles (see
figure 5) The South Pole will become the North Pole and vice versa This model is called the
magnetic dynamo proposed by Horace Babcock (1912-2003)29
27GREEN SF and JONES M H An introduction to the Sun and Stars The Open University Cambridge
2004 p 72-7328 LANG KR Sun earth and sky Springer Germany 1995 p 8229
COMINS NF and KAUFMANN III WJ Discovering the universe eighth edition WH Freeman andCompany New York 2008 p 297-298JANSSENS J lsquohet maximum van de 23ste zonnenvlekkencyclus (II)rsquo Heelal November 1998 p 284
832019 Ew Afgewerkte Final
httpslidepdfcomreaderfullew-afgewerkte-final 1559
15
Figure 5 The switching of the magnetic poles of the sun
GREEN SF and JONES M H An introduction to the Sun and Stars The Open University Cambridge 2004 p73
When finally the poles have switched and the magnetic field lines are disentangled the cycle
will just start over again for another eleven years Because the magnetic poles of the sun
switch every eleven years the cycle is called the 11-year-solar cycle
34 Other cycles
341 The 22-year-cycle
If we take the magnetic poles into account however the 11-year-cycle becomes a 22-year-
cycle because the magnetic poles switch If we want to consider the strict cycle which means
that we take the magnetic poles into account we have to call the solar cycle a 22-year-cycleIt takes eleven years to switch the magnetic North Pole into a South Pole and another eleven
years to switch them back This cycle is called the Hale-cycle named after George Ellery
Hale (1868-1938) who was an American solar astonomer and active in different
observatories30
342 The 27-day-cycle31
The 27-day-cycle taking the average of the sunrsquos rotation time is a cycle that is directly
connected to the rotation time of the sun The sunspots the coronal holes and other
phenomena that are related to the activity of the sun rotate too This means that the activity of the sun is connected to the rotation cycle For example the part of the sun that we can see will
be less active when the sunspots are not visible because the sunspots influence the solar
activity When the sunspots appear again the activity of the sun will rise This cycle is also
known because of the coronal holes that influence the solar wind
30JANSSENS J lsquohet maximum van de 23
stezonnenvlekkencyclus (II)rsquo Heelal November 1998 p 284-290
31 JANSSENS J Zon en aarde een unieke relatie Garant Antwerpen 2003 p 113
832019 Ew Afgewerkte Final
httpslidepdfcomreaderfullew-afgewerkte-final 1659
16
343 Other cycles
Astronomers believe that there must be some other cycles of an even longer basis Different
researchers have been looking for other solar cycles Some thought they found a 55-year
cycle However this cycle was very irregular Max Waldmeier (1912-2000 a very eminent
solar astronomer of the 20th
century) found a 90-year-cycle However lots of other cycleshave been ldquofoundrdquo There have been postulated a 2300-year-cycle too But the records of
solar cycles are too recent to prove this cycle 32
35 Solar maximum and minimum
The Royal Greenwich Observatory has been observing the sunspots since 1874 The
information of their observations includes the size the position and the number of sunspots
during all the recorded solar cycles If we put all this information into a graph we can see the
so-called butterfly-graph (appendix IX) With this information we can conclude that sunspots
do not appear at random33
At the beginning of a new solar cycle the first sunspots appear at latitude of 45 degrees Later
on sunspots will appear at the equator too When the sunspots begin to appear at 45 degrees a
new cycle has started again34 The solar minimum is the starting point of the solar cycle At
the beginning sunspots are very rare sometimes there are none If there are any sunspots they
will occur at higher latitudes The solar activity is the least on solar minimum Then it is a
good time for astronauts to go into space because there are less sunspots and less solar flares
and other phenomena that can influence the solar wind and so the space weather When the
solar activity is the highest the solar cycle reaches its maximum There will be a lot of
sunspots which now occur on lower latitudes too35 The time to go from a solar minimum to a
solar maximum is around four years During this time the solar activity will rise and when it
reaches its maximum it will slowly decline The decrease takes much more time than the
increase of the solar activity around 7 years The time between a solar minimum and
maximum and between a solar maximum and minimum can vary and is different for every
solar cycle36
36 Mysteries of the solar cycle
Astronomers have been able to find out a lot of details about the solar cycle However we are
still not able to predict the maximums and minimums of the solar cycles preciselyAstronomers havenrsquot been capable to draw up a model that allows us to predict the exact
number of sunspotshellip You can compare it to predictions for the weather to comehellip
32JANSSENS J Zon en aarde een unieke relatie Garant Antwerpen 2003 p 113-114
33HATHAWAY D H The sunspot cycle Internet (httpspacesciencespacerefcomsslpadsolarsunspots
htm) 0401200034 JANSSENS J Zon en aarde een unieke relatie Garant Antwerpen 2003 p 10335
WINDOWS TEAM Maunderrsquos Butterfly Diagram Internet (httpwwwwindowsucaredutourlink=sunactivitybutterflyhtml) 200036 JANSSENS J Zon en aarde een unieke relatie Garant Antwerpen 2003 p 99-100
832019 Ew Afgewerkte Final
httpslidepdfcomreaderfullew-afgewerkte-final 1759
17
Chapter 4 Phenomena caused by the magnetic field of the sun
41 Sunspots
411 What are sunspots
Sunspots appear on the sunrsquos surface when the magnetic field lines under the photosphere
are piled up too much and they finally pop out into the chromosphere Sunspots are normally
found in groups The number of sunspots is dependent on the solar activity when the solar
activity reaches its maximum there will be many more sunspots than at solar minimum
Measuring the magnetic field in sunspots with the Zeemaneffect makes clear that the
strength of the magnetic field is much stronger in sunspots than in the surrounding
photosphere Itrsquos more than thousand times stronger the magnetic field strength in magnetic
fields varies from 1000 to 4000 Gauss while the surrounding area circles around 1 Gauss
(comparison the earthrsquos magnetic field strength is about 05 Gauss)37
412 What do sunspots look like
When magnetic field lines pop out of the photosphere they will form magnetic loops (figure
6 on the right side) Between this magnetic loops there will be formed a flux tube The
magnetic field lines in the sunspot will distort the convection under the surface (see figure 6
on the left side) They will pull the plasma downwards and will prevent the warm plasma
from going upwards and reach the sunrsquos surface Eventually the temperature in the sunspot
will cool down38
Figure 6 Left side convection in sunspotsRight side magnetic field lines in sunspots
JANSSENS J Zon en aarde een unieke relatie Garant Antwerpen 2003 p41
37
RUSSELL R Sunspots and magnetic fields Internet (httpwwwwindowsucaredutourlink=sunatmospheresunspot_magnetismhtmlampedu=high) 06090838 JANSSENS J Zon en aarde een unieke relatie Garant Antwerpen 2003 p 40-41
832019 Ew Afgewerkte Final
httpslidepdfcomreaderfullew-afgewerkte-final 1859
18
We can distinguish 2 areas the black sunspot and the surrounding bright surface of the sun
The sunspot itself consists of the very dark centre called the umbra and the surrounding
orange-brown environment called the penumbra The penumbra consists of an amount of
small little striated f igures that come out of the umbra A sunspot can reach a diameter of
300 000 kilometres39 The temperature in the sunspots centre is much cooler than in the
photosphere because of the convection explained above It measures around 4 200 K whilethe photosphere has a temperature of 6000 K40
Figure 7 The composition of a sunspot
httpwwwjaxajparticlespecialastroshimizu02_ehtml
A sunspot appears black to our eyes However appearances are deceptive the dark sunspot
only seems dark because we see it against a much warmer environment If we h ad seen itagainst a black surface it would have been much brighter than the moonrsquos glowing41
The amount of sunspots varies from very few till over more than a hundred The amount of
sunspots can be predicted by the Wolf-numbers named after Johann R udolf Wolf (1816-
1893) a Swiss astronomer best known for his research on sunspots42 However I wonrsquot
explain this method in this paper You can find a briefly explanation in appendix X Yet this
method is only capable to predict the amount of sunspots approximately
42 Prominences
421 What is a prominence
The luminosity of the sun outshines lots of phenomena that take place on the surface of the
sun and even far away from the sun The sunrsquos corona is one example But luckily
prominences are quite visibly when we observe the sun A prominence is a huge cloud of gas
that is cooler than his environment It is trapped between two horizontal magnetic field lines
For human eyes it seems to spread out dark but this is only because a prominence has a much
39 LILENSTEN J and BORNAREL J Sous les feux du soleil EDP Sciences Les Ulis Cedex A 2001 p 3540 OTTERSDORF M Astronomy On the sunspot cycle Internet (httpuserszoominternetnet~matto
MCASsunspot_cyclehtmZeeman effect) 03110341JANSSENS J Zon en aarde een unieke relatie Garant Antwerpen 2003 p 41
42 JANSSENS J lsquoHet maximum van de 23ste zonnevlekkencyclus (I)rsquo Heelal October 1998 p 256-263
832019 Ew Afgewerkte Final
httpslidepdfcomreaderfullew-afgewerkte-final 1959
19
lower temperature then the sunrsquos chromosphere (similar to sunspots which spread out dark
too) The dark lines in appendix XI are also known as filaments A filament is a line between
to magnetic fields with opposite polarities (appendix XI)43
Figure 8 A solar prominence
httpcosmic-webcoukp=274more-274
422 What is a prominence made of
The gas from the prominence is coming from the chromosphere So the prominences have
approximately the same composition as the chromosphere A good way to observe
prominences is to use red Hα or blue Hβ spectrum lines Hα absorption lines indicate a
temperature lower than 10 000 Kelvin These spectrum lines justif y that the temperature of a prominence is remarkably lower than the temperature of the corona 44
423 How do prominences originate
A prominence is a result of the magnetic field Particles of the sun can transport warmth very
fast if they move alongside magnetic field lines If they want to move straight to a magnetic
field line the transport of warmth is negligible So prominences that are trapped between 2
magnetic fields only have one way to be heated This brings on a temperature that is notably
lower then the temperature in the corona45
The origin of prominences is similar to the origin of solar flares When two magnetic loops
of opposite polarity start to approach each other they will reconnect and form some new
loops This is shown in appendix XII Some mass from the sun will be trapped between the
new magnetic field lines and will form a solar prominence 46
43COMINS NF and KAUFMANN III WJ Discovering the universe eighth edition WH Freeman and
Company New York 2008 p 29944 SMITS F lsquoProtuberanzenrsquo Heelal Juli 1991 p 18345 LANG KR Sun earth and sky Springer Germany 1995 p 134-14046
MARTENS PC and ZWAAN C Origin and evolution of filament-prominence systems Internet ( httpwwwioporgEJarticle0004-637X558287253575webpdfrequest-id=73e38daa-69ae-4e01-b9a6- b4bd0ba071dd) 092001
832019 Ew Afgewerkte Final
httpslidepdfcomreaderfullew-afgewerkte-final 2059
20
424 What do prominences look like47
4241 Different groups of prominences
As you can see on the pictures in appendix XIII prominences can have different shapes and
forms Thatrsquos why astronomers classify them into different groups the quiescent prominences the active prominences and eruptive prominences
4242 Quiescent prominences
Quiescent prominences can appear everywhere on the sun and are not depending on latitude
They can reach into the corona over 2 500 till 40 000 kilometres Quiescent prominences last
the longest of all prominences Some of them even last several solar rotations long These
prominences are very long and not so wide During its lifetime a quiescent prominence moves
slowly to the poles When they are found at the poles of the sun they are called a lsquopolar
crownrsquo (appendix XIV)48
4243 Active prominences
Their name already suggests where they can be found active prominences are found in the
active regions of the sun moreover in the presence of sunspots These prominences
however only have a short lifespan only several hours But within this short lifespan they do
change form adjusting to the magnetic field lines within a short period of time Because
these prominences are located in active regions there are many more reconnections and so
the form will change more rapidly
4244 Eruptive prominences
These prominences only last a couple of minutes and are connected to active sunspots as well
It is possible that after one died out another immediately gives birth in the same region Other
eruptive prominences are known to be bubbles of gas that are issued from active sunspots
There have been some records of eruptive prominences that bump into other prominences and
push the other prominences back in the sunspot49
47 KNISELY D Solar prominences Internet (httpwwwicstarscomHTMLSolarSectionHAlpha OBSERVINGTHESUNHAlpha3html) (03042009)
SMITS F lsquoProtuberanzenrsquo Heelal Juli 1991 p 182-185
ELLERMAN F Solar prominences Internet (httparticlesadsabsharvardedufull 1928ASPL173E0000074000html) (03042009)48
KNISLEY D Solar prominences Internet (httpwwwicstarscomHTMLSolarSectionHAlphaOBSERVINGTHESUNHAlpha3html) (03042009)49 PRIEST E R Dynamics and Structure of Quiescent Solar Prominences Internet (httpbooksgooglebe
booksid=h599q3jz1w4Campdq=quiescent+prominencesampprintsec=frontcoverampsource=blampots=58b79Qeyabampsig=1eklQ-WszOIebZZaq7fq7gm6bxAamphl=nlampei=urPtSe7ZCo61-Qa166jHDwampsa=Xampoi=book_resultampct=resultampresnum=3PPA6M2) 1989
832019 Ew Afgewerkte Final
httpslidepdfcomreaderfullew-afgewerkte-final 2159
21
43 Coronal holes50
When looking at the sun with an x-ray telescope we can see dark regions across the sun
These dark regions are called coronal holes Coronal holes have an open magnetic field
structure This means that the magnetic fields lines do not angle downwards but they extend
into space indefinitely Due to this the particles of the sun are capable to reach out far intospace without any struggles against the magnetic field With this outflow of gases from the
sun coronal holes are one of the most important sources of the (high-speed) solar wind
(appendix XV)
44 Corona loops
441 What is a corona loop
If we look closer at a pair of sunspots we can see an emission of plasma alongside
magnetic field lines that originate in the sun spots A corona loop can extend into the coronaas the name suggests Those loops contain plasma that can reach a temperature higher than
106 Kelvin Corona loops can best be observed by ultra-violet and x-ray images because of
the high temperature The high temper ature brings on a high vibration of the atoms This
trembling causes the emission of x-rays51
Figure 9 A close up of corona loops
httpwwwdaviddarlinginfoencyclopediaCcoronal_loophtml
442 Where and when do corona loops originate
The magnetic field lines of sunspots move outwards from the sun into the corona and form
broad loops This makes it possible to trap hot gas with a temperature up to 40 million K
Those magnetic field loops trap hot plasma into the sunrsquos atmosphere The magnetic force
pushes particles around along the magnetic lines but at the same time the atoms circulate
around the magnetic field lines (see figure 10) The speed of their movements depends on the
50
ENCYCLODPEDIA OF SCIENCE Corona hole Internet (httpwwwdaviddarlinginfoencyclopediaC coronal_holehtml) (04042009)51 JANSSENS J Zon en aarde een unieke relatie Garant Antwerpen 2003 p 52-54
832019 Ew Afgewerkte Final
httpslidepdfcomreaderfullew-afgewerkte-final 2259
22
density of the magnetic field So if a particle moves from the top of a loop to the bottom it
will slow down just like in traffic jams Eventually it will reach the bottom but the bottom is
highly compressed (because the magnetic field lines converge at the bottom of the loops) so
that the particle will be shot back along the magnetic field line (see figure 10)
Figure 10 the movement of particles in corona loops
GD HOLMAN lsquoThe mysterious origins of solar flaresrsquo Scientific America April 2006 p24-29 volume 294number 4
Hence the particles will move up and down along the magnetic field lines Atoms that are
charged the same will cause electric currents (just like in a battery) These currents will
generate a new magnetic field and the old magnetic field in combination with the new one
will cause a high distortion in the magnetic field of the sun This is the moment when the
corona loop will transform into a solar flare
45 Solar flare52
451 What is a solar flare
A solar flare is a sudden powerful explosion in the solar atmosphere caused by a disruption
in the magnetic field of the sun Because of the disruption mass from the sun will be movedup and form a solar flare A solar flare can equal the energy of billions of atomic bombs
within a few minutes The strongest solar flares are measured during the solar maximums
because then the sunrsquos magnetic activity is the strongest53 Since the sunspots in the presence
of solar flare have a very high magnetic field it is likely that a solar flare would even have a
higher magnetic field But in reality the magnetic field of a solar flare is only half of the
magnetic field of a sunspot The intensity of the magnetic field is lsquoonlyrsquo 500 Gauss54
52 HOLMAN GD lsquoThe mysterious origins of solar flaresrsquo Scientific America April 2006 p 24-31 volume
294 number 453JANSSENS J Zon en aarde een unieke relatie Garant Antwerpen 2003 p 55-57
54 JANSSENS J lsquoZonnefakkelsrsquo Heelal Oktober 1994 p 256
832019 Ew Afgewerkte Final
httpslidepdfcomreaderfullew-afgewerkte-final 2359
23
Figure 11 You can see the magnetic fieldlines in the solar flare on the right side
Large solar flare recorded by SOHO EIT304 instrument 512x512 version Animation (980kMPEG) CourtesySOHO(ESAampNASA)
httpwwwteachersparadisecomencyenwikipediassusunhtml
452 Where and how do sun flares originate
Astronomers have long been speculating how solar flares exactly originate In 1992 Satoshi
Masuda (graduated at the University of Tokyo) discovered on pictures of the Japanese
Yohkoh Satellite that the far end of a solar flare emitted unusually short wavelengths very
short x-rays The source must be a concentration of gas with a temperature of about 100million K concluded Masuda But this discovery provoked some new questions why was the
high temperature at the top of the flare and not at the bottom where the gas is more compact
Why does the plasma stay confined instead of spreading out into the universe In order to
obtain more information to try to solve this problem astronomers started observing the sunrsquos
radiation of ultraviolet and x-rays frequently In 2002 NASA even launched the RHESSI
(Ramaty High Energy Solar Spectroscopic Imager) which was intended to bring solar flares
into pictures55
These observations provided evidence that sun flares surge up in regions where the magnetic
field is very strong ndashmost common in the presence of sun spots At this point we have to call
over the corona loops As mentioned before corona loops are electric currents of atoms
which move alongside magnetic field lines When the atoms are shot back alongside the
magnetic field line there seems to occur a distortion of the magnetic field This distortion will
end up in a solar flare All the mass of the corona loop will be shot into space and form a solar
flare
But how can such enormous mass of the solar flares be shot into s pace This has been a very
interesting question However Peter Alan Sweet (1921-2005)56 succeeded in finding an
55 GD HOLMAN lsquoThe mysterious origins of solar flaresrsquo Scientific America April 2006 p 27 volume 294
number 456UNIVERSITY OF GLASGOW Bibliography of Peter Sweet Internet (httpwwwuniversitystoryglaacuk
biographyid=WH2144amptype=P) (10042009)
832019 Ew Afgewerkte Final
httpslidepdfcomreaderfullew-afgewerkte-final 2459
24
answer already in 1956 If magnetic field lines break apart and then reconnect they bring
together two opposing fields that will cancel each other and cause a huge burst of energy The
reconnection will create new magnetic field lines This reconnection is called the Sweet-
Parker reconnection Yet this is a slow reconnection which cannot take place at the base of a
solar flare with a dazzling speed Fortunately Harry P Petschek published an article about
reconnection in 1964 and solved that problem under certain circumstances it is possible toreconnect much faster which explains solar flares This faster reconnection is also called the
Petschek reconnection But unfortunately with the current technology it is not yet possible to
take pictures of those reconnections57
If the energy comes from the reconnection then where does this reconnection take place
From pictures of solar flares astronomers discovered that at the top of the corona loop a
mysterious x-ray source was found The x-ray source began to give a higher energy level and
at the same time the particles move down towards the sunrsquos surface Yet the x-ray source
stays at the same placehellipThen when the x-rays reach their maximum the loop suddenly
changes direction But this time the x-ray source will move upwards too unexpectedly it
moves at the speed of light approximately three hundred thousands kilometres an hour awayfrom the sun This is the same speed as the coronal mass ejections
46 Coronal mass ejections
461 What is a coronal mass ejection58
Coronal mass ejections (CMErsquos) (appendix XVI) are huge amounts of gas some billions of
plasma from the sun that are ejected into space Their temperature can reach 25 million K59
A coronal mass ejection can last for several hours and it can at last enter the solar wind A
CME can reach a speed of 50kms- 2000kms which means more than 7 million kilometres
an hour60 The mass of a large CME varies from 5 x 10⁶ to 5 x 10¹³ kg61 During a solar
maximum there are more coronal mass ejections than during a minimum but they can occur
at any time of the solar cycle Coronal mass ejections are related both to solar flares and
prominences Very heavy coronal mass ejections can cause some geomagnetic storms on
earth
462 Reconnection
The reconnection of a solar flare can end up in a coronal mass ejection When magneticfield lines that are opposite are starting to reconnect and form new magnetic field lines half of
the magnetic field lines will point downwards and join some existing magnetic loops
However the other part of the magnetic field lines will move upwards at a very high speed
and will form some loops more upwards Between those loops that moved downwards and
those that moved upwards there is some mass that isnrsquot connected to the sun anymore It is
57GD HOLMAN lsquoThe mysterious origins of solar flaresrsquo Scientific America April 2006 p 29 volume 294
number 458
BRAEUNIG R A Glossary Internet (httpwwwbraeunigusspaceglossaryhtm) 200659 LILENSTEN J and BORNAREL J Sous les feux du soleil EDP Sciences Les Ulis Cedex A 2001 p 4460 Cuypers J and others lsquoLa rechercheacute en heacuteliophysique en Belgiquersquo Space connection October 2007 p 10-
1161GREEN SF and JONES M H An introduction to the Sun and Stars The Open University Cambridge
2004 p 68
832019 Ew Afgewerkte Final
httpslidepdfcomreaderfullew-afgewerkte-final 2559
25
known that for an amount of solar flares that this mass between the loops will end up in a
coronal mass ejection Yet this doesnrsquot count for all the solar flares The coronal mass
ejection only takes place if the magnetic field lines twist around each other while forming the
letter lsquoSrsquo (see figure 12)62
Figure 12 Here you can see the reconnection that takes place before the coronal mass ejection starts
httpwwwnasagovmission_pagessolar-bsolar_005html
Certainly we will be capable to answer all the questions about solar flares and coronal mass
ejections in the nearby future But there are also some very interesting questions left what is
at the basis of the acceleration of the atoms in solar flares How does magnetic reconnection
originate Hopefully we will find the answers in the near future
47 Solar wind
471 What is the solar wind
Every second of every day of the year the sunrsquos corona emits a continuous stream of mass
from the sun The temperature of the corona is so high that the sunrsquos magnetic field just
cannot control the outflow of particles We know that the particles are accelerated but
astronomers cannot explain all the details about the solar wind yet
472 What do we know about the solar wind
The speed of the solar wind can change it differs from 300kmh up to 800kmh This speed
depends on the outflow of gases If there is a corona hole pointing towards the earth the solar
wind will reach a speed of around 800kmh The different speeds can interact with each other
and form a new speed according to the rules of light emission When two emissions connect
with each other they can form a faster or slower solar wind just like waves can interact and
form new waves
62BOEN B Birth of a coronal mass ejection Internet (httpwwwnasagovmission_pagessolar-b
solar_005html) 290408
832019 Ew Afgewerkte Final
httpslidepdfcomreaderfullew-afgewerkte-final 2659
26
The ionized atoms with very high temperature coming from the sunrsquos corona are one of the
most important parts of the solar wind but the magnetic fields are important too The
magnetic field outside the sun gets wrapped into a spiral called the Parker-spiral named after
the scientist who described it as the first one (because the sun rotates) This influences the
magnetic field of the sun from the outside The solar wind is emitted in spiral too (see figure
13)
Figure 13 The course of the solar wind caused by the rotation of the sun
httpheliosgsfcnasagovsolarmaghtml
473 Heliosphere
We can describe the heliosphere as a gigantic magnetic bubble around the sun This is
everywhere in space till where the sunrsquos magnetic field reaches and still has an influence The
heliosphere is filled with solar wind although the solar wind has a very low density Yet it
is a very hot wind but because of the very low density it does not have such a great influence
on earth However it can cause some energetic storms on earth63
63 NASA The heliosphere Internet (httpheliosgsfcnasagovheliosphhtml) 20012009
832019 Ew Afgewerkte Final
httpslidepdfcomreaderfullew-afgewerkte-final 2759
27
Conclusion
The sunrsquos magnetic field is a complex system to understand Yet I hope you have learned a
lot from this paper and that you do understand the exiting phenomena described in the
previous chapters
We can discuss the sunrsquos magnetic field from two perspectives The first one is looking at the
magnetic field for global long-term changing dimensions The second way is based on
phenomena on lower scale
The global changes involve the solar cycle and the switch of the magnetic poles The solar
cycle is divided into a decrease of the solar activity until it reaches solar minimum and an
increase of the solar activity until it reaches solar maximum The frequency of the phenomena
that can be found in the outer layers of the sun are directly connected to the solar activity and
thus to the solar cycle Sunspots are the easiest to see they appear as black spots against the
much brighter surface of the sun Corona loops are connected to sunspots and can extend into
solar flares and solar prominences These flares and prominences can burst out into a coronalmass ejection All these phenomena influence the sun and its solar wind how small their part
may be The solar wind has a directly influence on the earth
There is still much to be discovered Astronomers hope to discover much more about the
magnetic field of the sun Today many astronomers and scientists are observing the sun and
every day they discover more and more aspects of the sun Recently a group of researchers
led by David Jess of Queens University Belfast has revealed why the sunrsquos atmosphere is
hotter than its surface64 As you can see astronomy is a very developing science
64
CORDIS Researchers reveal why Suns atmosphere is hotter than its surface Internet (httpcordiseuropaeusearchindexcfmfuseaction=newsdocumentampN_LANG=ENampN_RCN=30598amppid=0ampq=87F36474805A6BEC0B89404F72D0351Famptype=sim) 20032009
832019 Ew Afgewerkte Final
httpslidepdfcomreaderfullew-afgewerkte-final 2859
28
Glossary
Absorption lines A dark line superimposed on a continuous spectrum when a gas absorbs
light from a continuous source that is hotter than the absorbing gas
Aurora Light radiated by atoms and ions formed by the solar wind in the earthrsquos upper atmosphere seen most commonly in the polar regions
Chromosphere The layer in the solar atmosphere between the photosphere and the corona It
is the lowest layer of the atmosphere characterized by reddish hue and by an increase of the
temperature with altitude through all but its lower regions
Convection The transfer of heat from a region of high temperature to a region of lower
temperature by the displacement of the cooler molecules by the warmer molecules The hot
gas will be moved upwards the cool gas will be pushed downwards into the sun
Corona The sunrsquos outer atmosphere It is very extensive and has a very low density It isextremely hot
Coronal hole A dark region of the sunrsquos inner corona as seen at X-ray wavelengths
Coronal loop Closed loops of magnetic field lines extending from the sunrsquos photosphere into
the corona which contain plasma at high temperature They are typically observed through
ultraviolet or x-ray emission from the hot plasma
Coronal mass ejection Large volumes of high energy gas released from the sunrsquos corona
Differential rotation The rotation of a non rigid object in which parts at different latitudes or
different radial distances move at different speeds
Dynamo theory The generation of a magnetic field by circulating electric charges
Eclipse The blocking of a part or all of the light from the moon by the earth (lunar eclipse) or
from the sun by the moon (solar eclipse)
Emission lines Emission lines are used in physics chemistry and astronomy to determine
what kind of gas is doing the emission Every element has a different electronic structure and
will thus have a different emission line fingerprint Emission lines are produced whenelectrons in atoms jump from one energy level to lower energy level
Filament A dark curve seen above the sunrsquos photosphere that is the top view of a solar
prominence
Flux tube Is a generally tube-like (cylindrical) region of space containing a magnetic field
such that the field at the side surfaces is parallel to them Both the cross-sectional area of the
tube and the field contained may vary along the length of the tube but the magnetic flux is
always constant
832019 Ew Afgewerkte Final
httpslidepdfcomreaderfullew-afgewerkte-final 2959
29
Geomagnetic storm When unusually strong surges of solar wind (charged particles from the
Sun) hit the Earth This effect causes variations in the magnetic field which surrounds the
Earth The visible results are eg the aurora (Northern and Southern lights)
Granulation Granules are related to the convective zone The granulation that shows up in the
photosphere is a result of the rising and falling of hot gas that takes place in the convectivezone
Hα absorption line An absorption line due to an electronic transition in hydrogen atoms in
which the atom absorbs a photon so that the electron makes a transition from a state
corresponding to the electronic energy level with n=2 to the one above with n=3 The photon
wavelength in a vacuum is 6563 nm
Heliosphere The volume of space within which the sun through the solar wind influences its
environment in the interstellar medium
Magnetic dynamo A theory that explains phenomena of the solar cycle as a result of periodicwinding and unwinding of the sunrsquos magnetic field in the solar atmosphere
Magnetic reconnection A process taking place in a plasma in which neighbouring
oppositely directed magnetic field lines suddenly part and reconnect in a new configuration
The abrupt change in a magnetic field represented by this process can release large amounts
of energy and it is thought to be important in explaining solar flares and other phenomena
Penumbra The portion of a shadow in which only part of the light source is covered by the
shadow-making body
Photosphere The region in the solar atmosphere from which most of the visible light escapes
into space
Plasma A fourth state of matter (not found naturally on Earth) of very hot gases Plasma is a
fluid with the ability to carry electric currents with no local accumulations of electric charge
Prominence Flamelike protrusion seen near the limb of the sun and extending into the solar
corona The side view of a filament
Quantum theory A theory in physics based on the principle that matter and energy have the
properties of both particles and waves created to explain the radiation of energy from a blackbody the photoelectric effect and the Bohr theory and now used to account for a wide
range of physical phenomena including the existence of discrete packets of energy and
matter the uncertainty principle and the exclusion principle Itrsquos a theory of the interaction of
matter and radiation developed early in the twentieth century which is based on the
quantization of energy and applied to a wide variety of processes that involve an exchange of
energy at the atomic level
Reconnection See magnetic reconnection
Solar cycle A 22-year-cycle during which the sunrsquos magnetic field reverses its polarity twice
Solar flare A violent eruption on the sunrsquos surface
832019 Ew Afgewerkte Final
httpslidepdfcomreaderfullew-afgewerkte-final 3059
30
Solar wind An outward flow of particles (mostly electrons and protons) from the sun
Solstice Either of two points along the ecliptic at which the Sun reaches its maximum
distance north or south of the celestial equator
Spectroscopy Concerns the production and study of spectra
Spectrum The result of electromagnetic radiation passing through a prism or grating so that
different wavelengths are separated
Spicule Short-lived (lifetime from rising to falling is about 15 minutes) jets vertical to the
solar surface that are several thousand kilometres long and about 1 kilometre thick (see also
appendix IV) in the solar chromosphere
Sunspot A temporary cool region in the solar photosphere created by protruding magnetic
fields
Umbra The central completely dark portion of a shadow
Zeemaneffect A splitting of spectra lines in the presence of a magnetic field
Bibliography and webography of the glossary
COMINS NF and KAUFMANN III WJ Discovering the universe eighth edition WH
Freeman and Company New York 2008 535 p
GREEN SF and JONES M H An introduction to the Sun and Stars The Open University
Cambridge 2004 373 p
httpenmimihuastronomygranulationhtml
httpenmimihuastronomyplasmahtml
httpwwwspacecomspacewatchspace_weather_glossaryhtml
httpenmimihuastronomyemission_linehtml
httpenmimihuastronomyabsorption_linehtml
httpwwwpbsorgfaithandreasonphysglossqm-bodyhtml
httpwwwanswerscomtopicquantum-theory
httpenwikipediaorgwikiFlux_tube
832019 Ew Afgewerkte Final
httpslidepdfcomreaderfullew-afgewerkte-final 3159
31
Appendix I The sun in figures
Physical quantity Comment
Radius 695 510 km 109 x earths radius
Mass 1989 x1030 kg 332 946 earths mass
Mass sun in the solar
system
9986 Total mass sun total mass of
our solar system
Volume 1412 x10sup3sup3 cmsup3 13 million x earths volume
Age 455 milliard years
Luminosity 3854 x 10sup3sup3 ergss
Magnitude -2773
Density center 1513 gcmsup3
Density mean 1409 gcmsup3
Pressure center 2334 x1011 bars
Pressure photosphere 00001 bar
Temperature center 15 557 000deg K
Temperature photosphere 5 780deg K Various sources mention
different grades
Temperature corona 2 000 000 to 3 000 000deg K
Rotation time at North or
South pole
up to 35 days on earth
Rotation time at Equator 25 days on earth The difference in rotation
times is called differential
rotation
Rotation time general 2538 days on earth
Mean distance sun-earth
(AU)
14959787 x108 km 1 AU = 1 Astronomical Unit
= 149 598 000 km
Chemical composition of
the sun ( of total number
of atoms)
Hydrogen 921
Helium 78
All others 01
Various sources mention
slightly different percentages
832019 Ew Afgewerkte Final
httpslidepdfcomreaderfullew-afgewerkte-final 3259
32
Chemical composition of
the sun ( of total mass)
Hydrogen 7346
Helium 2485
All others 169
Various sources mention
slightly different percentages
Total transforming of
hydrogen into helium persecond
700 billions of kilograms of
hydrogen are transformedinto 6957 billions of
kilograms of helium each
second
Based on the following references
- BEATTY JK PETERSEN CC and CHAIKIN A The new solar system fourth edition
Cambridge University Press Cambridge 1999 p 421
- LILENSTEN J and BORNAREL J Sous les feux du soleil EDP Sciences Les Ulis
Cedex A 2001 p 247
- LANG KR Sun earth and sky Springer Germany 1995 p 282- DENTHIER T Het zonnestelsel Standaard Uitgeverij 1992 p 415
- JANSSENS J Zon en aarde een unieke relatie Garant Antwerpen 2003 p 254- VOLKSSTERRENWACHT URANIA VZW De zon Internet(httpwwwuraniabesterrenkundezonnestelselzonphp) (01012009)
832019 Ew Afgewerkte Final
httpslidepdfcomreaderfullew-afgewerkte-final 3359
33
Appendix II Anatomy of the sun
httpwwwcosmographicacomgalleryinfographicssolar_anatomyhtml
The middle the sun consists of a heavy core this consists of plasma just as the outer layers
of the sun but the pressure in the core is so high that it behaves much more like a solid bodyThe most outer layer is the corona it reaches far into space More to the inside there is the
chromosphere and then the photosphere The corona the chromosphere and the
photosphere are explained in chapter 1
832019 Ew Afgewerkte Final
httpslidepdfcomreaderfullew-afgewerkte-final 3459
34
Appendix III Granulation
httpwwwwindowsucaredutourlink=sunSolar_interiorsolar_furnacehtml
At the surface of the sun we can find granules These are created by convection the warmest
parts of the sunrsquos interior move upwards and the colder parts at the surface move downwardsThis causes currents of plasma The dark lines are the colder particles We see them darker
because they emit less light than their surrounding neighbourhood
832019 Ew Afgewerkte Final
httpslidepdfcomreaderfullew-afgewerkte-final 3559
35
Appendix IV Spicules
Picture httplpc1clpccdcccauslpcharpellastro20a20deinfo_s09htmInformation httpwwwdaviddarlinginfoencyclopediaSspiculehtml
On this picture you can see spicules Spicules only last for several minutes and can be foundin the chromosphere They are little jets of gas There also exist macrospicules that can be
approximately ten times larger than a normal spicule
832019 Ew Afgewerkte Final
httpslidepdfcomreaderfullew-afgewerkte-final 3659
36
Appendix V The most important satellites observing the sun
Here you can find the most important satellites observing the sun and their missions
Solar and Heliospheric Obseratory (SOHO)
httpsohowwwnascomnasagovaboutabouthtml
SOHO the Solar amp Heliospheric Observatory is a project of international collaboration
between ESA and NASA to study the Sun from its deep core to the outer corona and the solar
wind
SOHO was launched on December 2 1995 The SOHO spacecraft was built in Europe by an
industry team led by prime contractor Matra Marconi Space (now EADS Astrium) under
overall management by ESA The twelve instruments on board SOHO were provided by
European and American scientists Nine of the international instrument consortia are led by
European Principal Investigators (PIs) three by PIs from the US Large engineering teamsand more than 200 co-investigators from many institutions supported the PIs in the
development of the instruments and in the preparation of their operations and data analysis
NASA was responsible for the launch and is now responsible for mission operations Large
radio dishes around the world which form NASAs Deep Space Network are used for data
downlink and commanding Mission control is based at Goddard Space Flight Center in
Maryland
More information about SOHO can be found on
httpsohowwwnascomnasagovaboutdocsSOHO_Fact_Sheetpdf
832019 Ew Afgewerkte Final
httpslidepdfcomreaderfullew-afgewerkte-final 3759
37
Transition Region and Coronal Explorer (TRACE)
httptracelmsalcomProjectMissionmissionhtm
TRACE enables solar physicists to study the connections between fine-scale magnetic fields
and the associated plasma structures on the Sun in a quantitative way by observing the photosphere the transition region and the corona With TRACE these temperature domains
are observed nearly simultaneously (with as little delay as only a second between different
wavelengths) with a spatial resolution of one second of arc
This is accomplished by obtaining precisely coaligned image sequences of photosphere
transition region and corona with high spatial resolution and uninterrupted viewing of the
Sun for up to eight months
TRACE Mission
TRACE explores the magnetic field in the solar atmosphere by studyingbull The 3-dimensional field structure
bull Its temporal evolution in response to photospheric flows
bull The time-dependent coronal fine structure
bull The coronal and transition region thermal topology
TRACE was launched on a Pegasus launch vehicle from Vandenberg Air Force Base in April
1998 The launch was scheduled to allow joint observations with SOHO during the rising
phase of the solar cycle to sunspot maximum No transition region or coronal imager has
witnessed the onset and rise of a solar cycle
Pegasus in flight
The two satellites provide complementary observations TRACE produces the high spatial
and temporal resolution images while SoHO yields images and spectral data out to 30 solar
radii at much lower spatial and temporal resolution Jointly they provide the opportunity to
obtain simultaneous digital measurements of all the temperature regimes of the solar
atmosphere in both high-resolution imaging and spectroscopy
With these data we expect to shatter the current ignorance of coronal heating and impulsive
MHD phenomena with benefits not only to solar physics but also to studies ranging from
stellar activity to the MHD of accretion disks The magnetograms produced by MDI on SoHO
provide a complete record of the eruption and distribution of photosphere magnetic fields
which will be invaluable for understanding TRACE observations of coronal hole formation
and coronal mass ejections Both of these phenomena have profound effects on our space
environment and the Earth`s magnetic field
TRACE is the first US solar research satellite since the Solar Maximum Mission
Coordination with SOHO provides an unprecedented opportunity to follow the emergence of
magnetic flux from the base of the convection zone deep inside the Sun through the
photosphere chromosphere and transitional region to the low-beta outer corona while
observing the effects of this emergence such as coronal mass ejections with high spatial andtemporal resolution
832019 Ew Afgewerkte Final
httpslidepdfcomreaderfullew-afgewerkte-final 3859
38
The transition from the photosphere where magnetic fields and plasma are in rough
equipartition to the corona where magnetic fields dominate is extremely difficult to model
and until recently to observe at high temporal and spatial resolution Many of the physical
problems that arise here such as plasma confinement reconnection wave propagation and plasma heating arise throughout space physics and astrophysics The detailed study of these
processed in the solar outer atmosphere is invaluable to astrophysics in general and stellar
studies in particular
More information about TRACE observations can be found on
httptracelmsalcomOperationsGeneraloperatiohtm
832019 Ew Afgewerkte Final
httpslidepdfcomreaderfullew-afgewerkte-final 3959
39
Reuven Ramaty High Energy Solar Spectroscopic Imager (RHESSI)
httphesperiagsfcnasagovhessibrochurehtm
What Questions will HESSI Address
bull How is such a large amount of energy released so rapidly during a flare
bull How are so many electrons and protons accelerated so quickly to such high energies
bull Where are the electrons and protons accelerated in the solar atmosphere and where do
they deposit their energy
How will HESSI Address these Questions
HESSI shown below will concentrate on electrons and protons accelerated in solar flares
through observations of the X-rays and gamma rays that they produce
bull HESSI will obtain the first ever X-ray and gamma-ray images of flares from 100 keV
to 20 MeVbull HESSI will do the first ever nuclear gamma-ray line spectroscopy of solar flares
bull HESSI will obtain pictures of flares in X-rays with an angular resolution of 2
arcseconds a factor of three better than previously possible
bull HESSI will measure X-ray and gamma-ray spectra with less than 1 keV energy
resolution a factor of 20-40 better than previously possible with scintillation counters
More information about the RHESSIrsquos Mission can be found on
httphesperiagsfcnasagovhessiconcepthtm
832019 Ew Afgewerkte Final
httpslidepdfcomreaderfullew-afgewerkte-final 4059
40
Solar Radiation and Climate Experiment (SORCE)
httplaspcoloradoedusorcesciencebackgroundhtm
The Solar Radiation and Climate Experiment (SORCE) is a NASA-sponsored satellite
mission that is providing state-of-the-art measurements of incoming x-ray ultraviolet visiblenear-infrared and total solar radiation The measurements provided by SORCE specifically
address long-term climate change natural variability and enhanced climate prediction and
atmospheric ozone and UV-B radiation These measurements are critical to studies of the Sun
its effect on our Earth system and its influence on humankind
The SORCE spacecraft was launched on January 25 2003 on a Pegasus XL launch vehicle to
provide NASAs Earth Science Enterprise (ESE) with precise measurements of solar
radiation It launched into a 645 km 40 degree orbit and is operated by the Laboratory for
Atmospheric and Space Physics (LASP) at the University of Colorado (CU) in Boulder
Colorado USA It will continue the precise measurements of total solar irradiance (TSI) that
began with the ERB instrument in 1979 and has continued to the present with the ACRIM series of measurements SORCE will also provide the measurements of the solar spectral
irradiance from 1nm to 2000nm accounting for 95 of the spectral contribution to TSI
SORCE carries four instruments including the Spectral Irradiance Monitor (SIM) Solar
Stellar Irradiance Comparison Experiment (SOLSTICE) Total Irradiance Monitor (TIM) and
the XUV Photometer System (XPS)
The primary goal of the NASA Earth Observing Systems (EOS) SOlar Radiation and Climate
Experiment (SORCE) is to enable solar-terrestrial studies by providing precise daily
measurements of the total solar irradiance (TSI) and the solar spectral irradiance atwavelengths extending from the ultraviolet to the near infrared The following lists the
SORCE science objectives
1 Make accurate measurements with high precision of total solar irradiance connect
them to previous TSI measurements and continue this long-term climate record
Provide TSI with an accuracy of 001 (100 parts per million) based on SI units and
with a long-term repeatability of 0001yr
2 Make daily measurements of the solar ultraviolet irradiance from 120 to 300 nm with
a spectral resolution of 1 nm Achieve this spectral irradiance measurement with an
accuracy of better than 5 and with a long-term repeatability of 05yr Use the
solarstellar comparison technique to relate the solar irradiance to the ensembleaverage flux from a number of bright early-type stars (same stars used by the UARS
SOLSTICE program)
3 Make the first measurements of the visible and near IR solar irradiance with sufficient
precision for future climate studies Obtain daily measurements of solar spectral
irradiance between 03 and 2 microm with a spectral resolution of at least 130 an
accuracy of 003 and a long-term repeatability of better than 001yr
4 Improve the understanding of how and why solar irradiance varies estimate past and
future solar behavior and investigate climate responses
More information about SORCE can be found on
httplaspcoloradoedusorcesciencescience_opshtm
832019 Ew Afgewerkte Final
httpslidepdfcomreaderfullew-afgewerkte-final 4159
41
Appendix VI Wavelengths
httpeosweblarcnasagovEDDOCSWavelengths_for_Colorshtml
As you can see on the figure visible light situates in the centre of the wavelengths having not
the shortest nor the longest wavelengths Gamma rays have the shortest wavelength radioways the longest All sort of wavelengths are used for daily purpose like radio waves for
radio and TV and gamma rays for treatments
832019 Ew Afgewerkte Final
httpslidepdfcomreaderfullew-afgewerkte-final 4259
42
Appendix VII Absorption lines in the sunrsquos spectrum
Picture httpwwwsolarnavigatornetthe_sunhtmExplanation COMINS NF and KAUFMANN III WJ Discovering the universe eighth edition WHFreeman and Company New York 2008 p 109
This photo is called a spectrogram It contains the spectrum of the sun All the black lines are
absorption lines The amount of black lines is related to the amount of elements that the sun
is emitting From a spectrogram we can deduct a lot of things including their mass the
temperature of the surface the chemical composition of the sun rotation rates and much
more
832019 Ew Afgewerkte Final
httpslidepdfcomreaderfullew-afgewerkte-final 4359
832019 Ew Afgewerkte Final
httpslidepdfcomreaderfullew-afgewerkte-final 4459
44
Appendix IX Butterfly-diagram
httpspacesciencespacerefcomsslpadsolarimagesbflygif
A butterfly-diagram
In a butterfly-diagram we can find the sunspots with their latitude (y-axis) through the years(x-axis) As you can see the sunspots appear like lsquobutterfliesrsquo this was discovered in 1904 by
Edward Maunder (1851-1928 an English astronomer best remembered for his study of
sunspots and the solar magnetic cycle) Thatrsquos why this graph is also called Maunders
butterfly diagram
832019 Ew Afgewerkte Final
httpslidepdfcomreaderfullew-afgewerkte-final 4559
45
Appendix X The Wolf-numbers
httpsidcomabenews106sunspotnumberclarifiedpdf
The sunspot number clarified By Petra Vanlommel
Which kinds of daily International Sunspot Numbers (ISN) are currentlypublished by the SIDC
Three daily indices are currently published by the SIDCthe Estimated ISN (EISN)the Provisional ISN (PISN)the Definitive ISN (DISN)Although they are all based on the same type of observations ie visual sunspot counts as ameasure of solar activity they are obtained from different data sets by different processingmethods with different accuracies and they serve different purposes
In the ideal case the three numbers are equal but in practice it is inevitable that there aresmall differences Therefore It is useful to explain what each index actually means
What is the source of the Wolf number
Once per day observers worldwide communicate their measured Wolf number (= 10G + S)based on visual sunspot (S) and group (G) counts to the World Data Center for the SunspotIndex Presently this is done through a dedicated password-protected WEB form the Wolfinterface However some observers still use the old way of reporting their observations onpaper through regular mail This method slows down the final processing but for the sake ofcontinuity in the index it is important to keep these observers included as some of them
represent the longest individual datasetsThe observers give the exact observing time the observing conditions the total numbers(group count sunspot count and Wolf number) and optionally the NorthSouth and centralzone numbers The observers using the web interface can provide their results to the SIDCimmediately after each observation However some users prefer to insert their data as ablock creating some delay but this must be done at least once a month
The personal reduction coefficient K
A personal reduction coefficient K is calculated for each station It has values typically in therange 04 and 17 and leads to a normalized sunspot number K(10G+S) In other words theK factor rescales the raw sunspot counts of each observer to the ones of Rudolph Wolf the
astronomer who introduced the above Wolf formula thus simulating the same eyes sametelescope and same conditionsDuring the procedure for calculating the Provisional ISN the K factor of every station iscomputed for every observation that passes the elimination procedure Once a year apersonal K factor for every station and for every month of the previous year is calculated Ayearly mean K value per station is also computed
The estimated sunspot index
The Estimated ISN (EISN) is calculated and issued on a daily basis for the day of calculationand the day before Only the total EISN is calculated with no hemispheric index It is anautomated procedure and no manual intervention is done The EISN is meant as a quicktemporary and approximate index for real-time applications
832019 Ew Afgewerkte Final
httpslidepdfcomreaderfullew-afgewerkte-final 4659
46
We use the raw Wolf number from all observatories that have provided counts early in theday ie before 1230 UT Typically there is between 10 and 20 stations available Thecalculation of the EISN is based on a simple and straightforward statistical method The Wolfnumbers are multiplied with the yearly mean K factor (see paragraph about the personalreduction coefficient K) The EISN is a simple average of the K-scaled values after excludingany individual value that deviates abnormally from the other valuesOnce the Provisional ISN (PISN) is calculated after the end of a month the temporary EISNis dropped and replaced by the PISN
The provisional sunspot Index
The Provisional ISN (PISN) is calculated and issued on the first of every month Theoutcome is a daily total and hemispheric sunspot number for the entire elapsed month Anexample on the first of September we calculate the daily PISN for each day of August ThePISN is computed semi-automatically with as little manual intervention as possibleTo calculate the PISN values for the concerned month we use all Wolf numbers Typicallythere is data from around 65 stations available
The calculation of the PISN is based on an extensive statistical treatment This treatmentfilters out any abnormal daily observation or the complete data set from an erratic station(quality control) This prevents long-term drifts in the resulting index One of the key elementsderived from this processing is to update the K reduction coefficients for each station theevolution of each station is monitored for each day relative to the entire networkA subset of the contributing stations also provides hemispheric counts A similar process isapplied to the North and South counts to derive the hemispheric PISN There is an additionalconstraint the sum of the North and South ISN must match the total ISNThe PISN replaces the EISN And once the Definitive ISN (DISN) is calculated the DISNreplaces the PISN
The definitive sunspot index
The Definitive ISN is calculated and issued on a quarterly basis when we have collecteddata from all the contributing observatories This is the final index and it is appended to thehistorical sunspot index time series The same semi-automated treatment as for the PISN isnow applied to the full data set If the result agrees within 5 of the PISN value the PISN iskept and becomes definitive Otherwise the new calculated value replaces the PISN andbecomes the definitive ISNIt is only at this stage and only in peculiar situations that a manual verification by ourscientific staff is required For example this happens when the observed raw Wolf valuesfrom the whole network are clustered around two distinct values This special case can becaused by small short-lived isolated sunspots (lifetimes lt 24 hours) or by the appearance ordisappearance of a large group at the solar limb in the course of one UT dayThe DISN replaces the provisional and estimated International Sunspot Number
Handling very low activity levels
One of the situations requiring a human arbitration is associated with single small isolatedand short-lived sunspots This is most noticeable around the minimum of the solar activitycycle like the one occurring now in 2008 Due to the 24hour binning (observations aregrouped between 0hUT and 24hUT) and the variable ability of each observer to detect thesmallest sunspots we end up with some stations reporting one sunspot and others who didno see any sunspot Let us explain further No sunspot may mean that the sunspot waspresent but the observer was unable to see it because of poor observational conditions such
as weather a small telescope On the other hand it may also indicate that the sunspot hadactually vanished by that time while it was present earlier on the same day
832019 Ew Afgewerkte Final
httpslidepdfcomreaderfullew-afgewerkte-final 4759
47
Individual stations do not observe at exactly the same timeIn order to validate the existence of such a marginal reported sunspot a qualified SIDCscientist must then check the detailed chronology within that day and consider the overallobserver capability (value of K coefficient)In common practice the fact that a sunspot is reported by a significant group of observersleads to the inclusion of the sunspot on that date thus neglecting the no-sunspotobservationsThe rationale is multiple observations of a sunspot exclude the possibility that the reportedsunspot was an independent false detection So a sunspot was really present on that dayalthough it may have existed only for part of the day or it was small enough to be missed bypart of the observers with smaller instruments or imperfect atmospheric conditionsAlso keep in mind that the sunspot index is derived with a limited precision just like any otherindex If the monthly mean sunspot number is 0 or 05 you can definitely say that activitywas low
What index should be used
If you want to perform long-term investigations the definitive ISN series is definitely the mostsuitable However there is a delay of a few months So when investigating the last cycle andrecent evolution use the definitive numbers in combination with the provisional ISN to be upto date to the last month The provisional numbers are also used in models forecasting thesunspot number for the coming months Now if you need a proxy for solar activity in a modelthat runs in real-time then you may use the estimated ISNImprovements and rethinking of the processing method is an ongoing project We arecurrently developing an alternative program for calculating the PISN Of course long-termconsistency is vital Therefore a cross-analysis between the output from the old and newsoftware must be applied over an extended period
832019 Ew Afgewerkte Final
httpslidepdfcomreaderfullew-afgewerkte-final 4859
48
Above graphs show different kinds of the International Sunspot Number The left plot gives an overview from 1700 up to now from the yearly (black) and monthly smoothed Sunspot Number The graph in the right top corner shows the monthly and monthly smoothed sunspot number while the graph in the right bottom corner show the daily monthly smoothed monthly sunspot number For every the time range of investigation there is an appropriate sunspot number
832019 Ew Afgewerkte Final
httpslidepdfcomreaderfullew-afgewerkte-final 4959
49
Appendix XI Filaments and prominences
httpsohowwwnascomnasagovpickoftheweekold26feb2004
This is a picture taken by SOHO on 26 February 2004
832019 Ew Afgewerkte Final
httpslidepdfcomreaderfullew-afgewerkte-final 5059
50
Appendix XII The reconnection of magnetic loops
httpwwwioporgEJarticle0004-637X558287253575webpdfrequest-id=73e38daa-69ae-4e01-b9a6- b4bd0ba071dd
In (a) sunspot B and C have different polarity and move towards each other The twomagnetic loops will reconnect and form one big magnetic loop showed in (b) This will
happen to other magnetic loops too as can be seen in (c) When G en F are close enough they
will reconnect and so E en H will reconnect too It is possible that the magnetic field line is
trapped around another in this case AD The mass ejected from the sun will be trapped
between the magnetic field lines and form a solar prominence
832019 Ew Afgewerkte Final
httpslidepdfcomreaderfullew-afgewerkte-final 5159
832019 Ew Afgewerkte Final
httpslidepdfcomreaderfullew-afgewerkte-final 5259
52
httptheinvisibleagentwordpresscom20090117amazing-celestial-images
An group of active prominences
httpapodnasagovapodap051109html
httpwhassupinthemilkywayblogspotcom200903cloudy-planhtml
A picture taken by SOHO In the left corner you can see the prominence with twisted
magnetic field lines
832019 Ew Afgewerkte Final
httpslidepdfcomreaderfullew-afgewerkte-final 5359
53
Appendix XIV Polar crown
httpsciencenasagovheadlinesy200817sep_polarcrownhtm
Photograph of a polar crown taken on 13 June 1999 by the Meudon Observatory
832019 Ew Afgewerkte Final
httpslidepdfcomreaderfullew-afgewerkte-final 5459
54
Appendix XV Coronal holes
httpsunearthdaynasagov2007multimediagal_020php
The black segment is a huge coronal hole The bright parts are x-rays from sunspots
832019 Ew Afgewerkte Final
httpslidepdfcomreaderfullew-afgewerkte-final 5559
55
Appendix XVI Coronal mass ejection
httpzuserver2staruclacuk~idhapodap000309html
Picture of a CME taken by SOHO in February 2000
832019 Ew Afgewerkte Final
httpslidepdfcomreaderfullew-afgewerkte-final 5659
56
Bibliography
Books
BEATTY JK PETERSEN CC and CHAIKIN A The new solar system fourth edition
Cambridge University Press Cambridge 1999 421 p
COMINS NF and KAUFMANN III WJ Discovering the universe eighth edition WH
Freeman and Company New York 2008 535 p
DETHIER T Het zonnestelsel Standaard Uitgeverij 1992 415 p
GOLUB L and PASACHOFF JM Nearest star the surprising science of our sun Harvard
university press Harvard 2001 267 p
GREEN SF and JONES M H An introduction to the Sun and Stars The Open University
Cambridge 2004 373 p
HILL S and CARLOWITZ M The sun Abrams New York 2006 239 p
HOLMAN GD lsquoThe mysterious origins of solar flaresrsquo Scientific America April 2006 p
24-31 volume 294 number 4
JANSSENS J Zon en aarde een unieke relatie Garant Antwerpen 2003 254 p
KELLER H-U Van Supernovarsquos tot zwarte gaten Tirion Natuur AH Baarn 2003 169 p
LANG KR Sun earth and sky Springer Germany 1995 282 p
LILENSTEN J and BORNAREL J Sous les feux du soleil EDP Sciences Les Ulis Cedex
A 2001 247 p
832019 Ew Afgewerkte Final
httpslidepdfcomreaderfullew-afgewerkte-final 5759
57
Articles
CUYPERS J and others lsquoLa rechercheacute en heacuteliophysique en Belgiquersquo Space connection
October 2007 20 p
DE KEYSER J lsquoDe magnetopauzersquo Heelal maart 1998 p 66-73
JANSSENS J lsquoHet maximum van de 23ste zonnevlekkencyclus (I)rsquo Heelal Oktober 1998 p
256-263
JANSSENS J lsquohet maximum van de 23ste zonnenvlekkencyclus (II)rsquo Heelal November
1998 p 284-290
JANSSENS J lsquoZonnefakkelsrsquo Heelal Oktober 1994 p 256-261
SMITS F lsquoDe coronarsquo Heelal Februari 1999 p 40-42
SMITS F lsquoProtuberanzenrsquo Heelal Juli 1991 p 182-185
VAN DEN BERGHE S lsquoHet Zeemaneffectrsquo Heelal September 1998 p 228-231
832019 Ew Afgewerkte Final
httpslidepdfcomreaderfullew-afgewerkte-final 5859
58
Webography
BOEN B Birth of a coronal mass ejection Internet
(httpwwwnasagovmission_pagessolar-b solar_005html) 290408
BRAEUNIG R A Glossary Internet (httpwwwbraeunigusspaceglossaryhtm) 2006
CORDIS Researchers reveal why Suns atmosphere is hotter than its surface Internet
(httpcordiseuropaeusearchindexcfmfuseaction=newsdocumentampN_LANG=ENampN_R
CN=30598amppid=0ampq=87F36474805A6BEC0B89404F72D0351Famptype=sim) 20032009
DAY C Alfveacuten waves may heat the Sunrsquos corona Internet
(httpblogsphysicstodayorgupdate200903 alfven-waves-may-heat-the-sunshtml)
310309
ELLERMAN F Solar prominences Internet (httparticlesadsabsharvardedufull
1928ASPL173E 0000074000html) (03042009)
ENCYCLODPEDIA OF SCIENCE Corona hole Internet
(httpwwwdaviddarlinginfoencyclopediaC coronal_holehtml) (04042009)
HATHAWAY D H The sunspot cycle Internet
(httpspacesciencespacerefcomsslpadsolarsunspots htm) 04012000
JANSSENS J The case of the missing solar cycle (published in lsquoheelalrsquo January 2008)
Internet (httpuserstelenetbejjanssensMSCwebEngpdf)
KNISELY D Solar prominences Internet
(httpwwwicstarscomHTMLSolarSectionHAlphaOBSERVINGTHESUNHAlpha3html)
(03042009)
KOPANSKI J Atom Internet (httpknolgooglecomkjan-
kopanskiatom1amrwrct7rvi27) 060209
MARTENS PC and ZWAAN C Origin and evolution of filament-prominence systems
Internet (http wwwioporgEJarticle0004-637X558287253575webpdfrequest-
id=73e38daa-69ae-4e01-b9a6-b4bd0ba071dd) 092001
NASA The corona Internet (httpsolarsciencemsfcnasagovcoronashtml) 180107
NASA The heliosphere Internet (httpheliosgsfcnasagovheliosphhtml) 20012009
OFFICIAL SITE OF STONEHENGE About Stonehenge Internet
(httpwwwstonehengecouk) (03022009)
OTTERSDORF M Astronomy On the sunspot cycle Internet
(httpuserszoominternetnet~matto MCASsunspot_cyclehtmZeemaneffect) 031103
PARIAT E and SCHMIEDER B Magnetic flux emergence Internet(httpwwwscholarpediaorgarticleMagnetic_field_emergence) 18042008
832019 Ew Afgewerkte Final
httpslidepdfcomreaderfullew-afgewerkte-final 5959
59
PRIEST E R Dynamics and Structure of Quiescent Solar Prominences Internet
(httpbooksgooglebe booksid=h599q3jz1w4Campdq=quiescent+prominencesampprintsec=fro
ntcoverampsource=blampots=58b79Qeyabampsig=1eklQ-
WszOIebZZaq7fq7gm6bxAamphl=nlampei=urPtSe7ZCo61-
Qa166jHDwampsa=Xampoi=book_resultampct=result ampresnum=3PPA6M2) 1989
RUSSELL R Rotation of the sun Internet
(httpwwwwindowsucaredutourlink=sunSolar_interior
Sun_layersdifferential_rotationhtml) 16082005
RUSSELL R Sunspots and magnetic fields Internet
(httpwwwwindowsucaredutourlink=sunatmospheresunspot_magnetismhtmlampedu=hig
h) 060908
UNIVERSITY OF GLASGOW Bibliography of Peter Sweet Internet
(httpwwwuniversitystoryglaacuk biographyid=WH2144amptype=P) (10042009)
WIKIPEDIA Orbiting Solar Observatory Internet
(httpenwikipediaorgwikiOrbiting_Solar_Observatory) 24012009
WINDOWS TEAM Maunderrsquos Butterfly Diagram Internet
(httpwwwwindowsucaredutourlink=sun activitybutterflyhtml) 2000
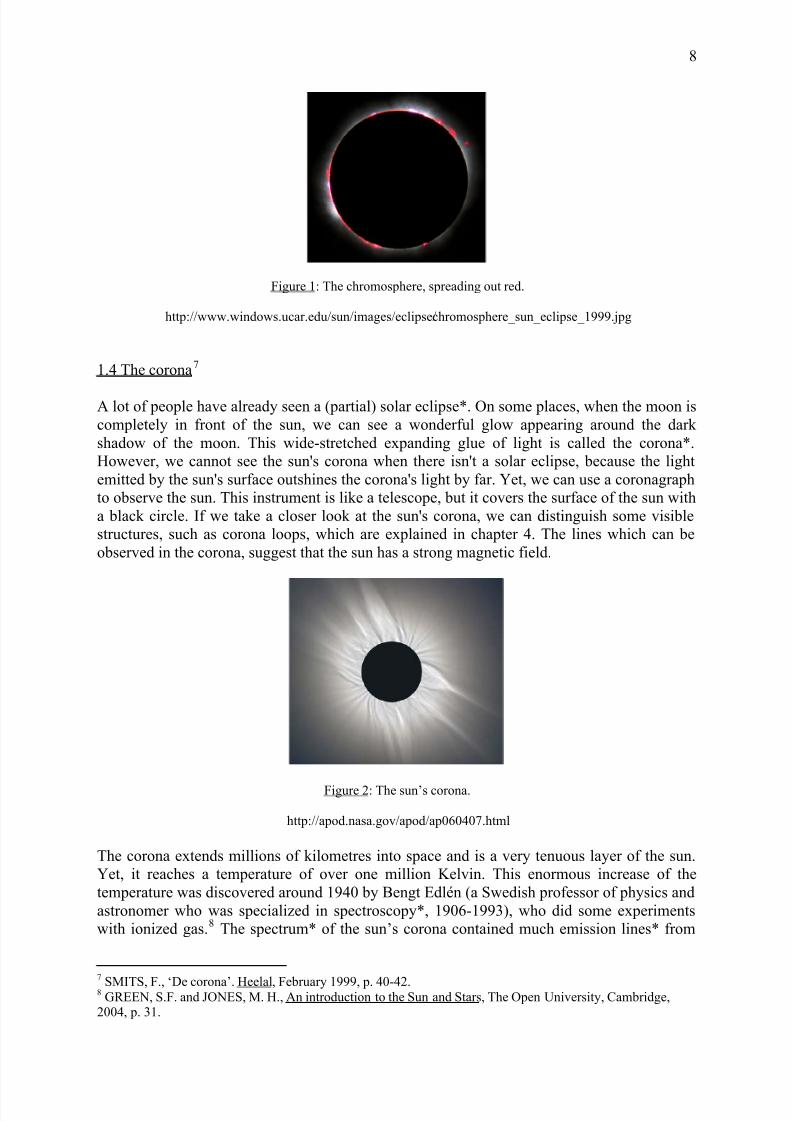
832019 Ew Afgewerkte Final
httpslidepdfcomreaderfullew-afgewerkte-final 859
8
Figure 1 The chromosphere spreading out red
httpwwwwindowsucaredusunimageseclipsechromosphere_sun_eclipse_1999jpg
14 The corona7
A lot of people have already seen a (partial) solar eclipse On some places when the moon is
completely in front of the sun we can see a wonderful glow appearing around the dark
shadow of the moon This wide-stretched expanding glue of light is called the corona
However we cannot see the suns corona when there isnt a solar eclipse because the light
emitted by the suns surface outshines the coronas light by far Yet we can use a coronagraph
to observe the sun This instrument is like a telescope but it covers the surface of the sun with
a black circle If we take a closer look at the suns corona we can distinguish some visible
structures such as corona loops which are explained in chapter 4 The lines which can be
observed in the corona suggest that the sun has a strong magnetic field
Figure 2 The sunrsquos corona
httpapodnasagovapodap060407html
The corona extends millions of kilometres into space and is a very tenuous layer of the sun
Yet it reaches a temperature of over one million Kelvin This enormous increase of the
temperature was discovered around 1940 by Bengt Edleacuten (a Swedish professor of physics and
astronomer who was specialized in spectroscopy 1906-1993) who did some experiments
with ionized gas8 The spectrum of the sunrsquos corona contained much emission lines from
7
SMITS F lsquoDe coronarsquo Heelal February 1999 p 40-428GREEN SF and JONES M H An introduction to the Sun and Stars The Open University Cambridge
2004 p 31
832019 Ew Afgewerkte Final
httpslidepdfcomreaderfullew-afgewerkte-final 959
9
some highly ionised elements for example Fe13+ which tells us that the corona has a
temperature from one million Kelvin up to two million Kelvin 9 Despite this very high
temperature the corona has a very low density If it had the density of the sunrsquos surface it
would certainly outshine the photosphere10
Yet not all the secrets of the corona have been solved yet Some scientists already had someideas of where the high temperature of the corona comes from but none of them are fully
satisfactory One of the explanations is the theory of the spicules These spicules would heat
the temperature of the corona since they are very common on the sunrsquos surface On the other
hand it is possible that little solar flares heat up the corona Their amount seems so large that
these small solar flares can be an important element in the explanation for the high
temperature of the sunrsquos corona But the most acceptable explanation so far is the one of the
Alfveacuten waves11 Alfveacuten waves are formed by the local movement of the magnetic fields The
gas in the corona moves upwards and downwards along the magnetic field lines But the gas
struggles against this vibration The Alfveacuten wave will lose its energy and it will convert this
energy into heat But there are also many other possible explanations for the extremely high
temperature of the sunrsquos corona Recently the idea of reconnection has been developed Theconcept of the reconnection is briefly explained in the section of solar flares 12
The sunrsquos corona may look ordinary but yet it gives birth to an event that is called the solar
wind (see chapter 4) This solar wind is caused by an outflow of gases coming from the
sun13 Itrsquos important to understand how the solar wind works because the solar wind can
cause some aggravating side effects on earth for example it can cut off the electricity on earth
for millions of people or disturb the working of satellites if it gets too strong But the solar
wind also causes the beautiful phenomenon of the aurora on earth Yet this is not the focus
of this paper
9 GREEN SF and JONES M H An introduction to the Sun and Stars The Open University Cambridge2004 p 3110
NASA The corona Internet (httpsolarsciencemsfcnasagovcoronashtml) 180107COMINS NF and KAUFMANN III WJ Discovering the universe eighth edition WH Freeman andCompany New York 2008 p 29111 DAY C Alfveacuten waves may heat the Sunrsquos corona Internet (httpblogsphysicstodayorgupdate200903alfven-waves-may-heat-the-sunshtml) 310309
12 JANSSENS J Zon en aarde een unieke relatie Garant Antwerpen 2003 p 4913BEATTY JK PETERSEN CC and CHAIKIN A The new solar system eighth edition Cambridge
University Press Cambridge 1999 p 28
832019 Ew Afgewerkte Final
httpslidepdfcomreaderfullew-afgewerkte-final 1059
10
Chapter 2 Observation of the sun
21 History
Men have been observing the sun from the very beginning We know that the sun was very
important for the prehistoric people many historical monuments testify this One of the mostfamous monuments is Stonehenge14 Men were constructing Stonehenge for centuries during
the Stone Age We cannot assume that ancient observers of the sun could predict solar
eclipses but they were able to build a construction that was adjusted to the rising of the sun
on special days such as Solstice Stonehenge is not the only example of the importance of
the sun over the years There is also Newgrange a well-known passage-tomb situated in
Ireland north of Dublin and many other monuments
In the beginning our sun was regarded as a God Nowadays we no longer see the sun as a
God or a natural force But still the sun is strongly influencing our lives It still provides us
with light and warmth and makes it possible to live on earth Many scientists have been
interested in the sun All of them wanted to know how the sun really functions
Letrsquos take a quick tour through the history of the observation of the sun Scientists of ancient
China made the first record of a solar eclipse in 2134 BC In the Middle Ages Galileo (1564-
1642) used the first telescope to map the sunspots he saw on the sunrsquos surface
Unfortunately he watched through his telescope without a special filter blinding himself On
April 2 1845 Louis Feacutezeau and Leacuteon Foucault had a world scoop they took the first
photograph of the sun clearly registrating the sunspots15
Years later the first satellites observing the sun called OSOrsquos (Orbiting Solar
Observatories)
16
have been launched into space to observe the 11-year-solar cycle between1962 and 197517 Many of them followed the most important satellites observing the sun are
described in appendix V Nowadays satellites keep an eye on the sun every second Still the
mystery of the sun and her magnetic field hasnrsquot been solved completely yet
22 Light18
221 Visible light
Light is a form of electromagnetic waves The light we see is actually only a small fraction of
all the light emitted in the universe A huge part of all the emitted light is not visible to our eyes Thatrsquos why men made telescopes especially designed to observe the light we canrsquot see
with our eyes
14 OFFICIAL SITE OF STONEHENGE About Stonehenge Internet (httpwwwstonehengecouk)(03022009)15
HILL S and CARLOWITZ M The sun Abrams New York 2006 p 82 83 9316
JANSSENS J Zon en aarde een unieke relatie Garant Antwerpen 2003 p 8917
WIKIPEDIA Orbiting Solar Observatory Internet (httpenwikipediaorgwikiOrbiting_Solar_Observatory)2401200918 COMINS NF and KAUFMANN III WJ Discovering the universe eighth edition WH Freeman and
Company New York 2008 chapter 4GREEN SF and JONES M H An introduction to the Sun and Stars The Open University Cambridge 2004 p 18-26
832019 Ew Afgewerkte Final
httpslidepdfcomreaderfullew-afgewerkte-final 1159
11
222 Composition of light
Light is composed of waves Different wavelengths represent different colours The colour of
the light depends on the wavelength λ Wavelength is measured in nanometre Visible light
has a range from 400 nanometre to 700 nanometre It consists of red orange yellow green
blue and violet Of all the visible light violet light has the shortest wavelength and red lightthe longest
223 Non-visible light
As previously mentioned visible light is not the only light in the universe There are many
more wavelengths Maxwell (1831-1879) discovered the infrared radiation This light has a
longer wavelength than red light This however is not visible to the human eye Apart from
infrared light much other not-visible light has been discovered Radio waves have the longest
wavelength of all We use them for example for our mobile phones Gamma rays have the
shortest wavelength of all We use gamma rays for cancer radiotherapy The other wavelengths of light are visible in appendix VI
23 Spectroscopy19
231 Introduction to spectroscopy
An interesting way of observing the sun is using spectroscopy We can distinguish 3
different types of spectra continuous spectrum absorption spectrum and emission spectrum
The last two are called line spectra This means we will not observe the spectrum of the
emitting body itself but we will use another medium in this case thin gas
232 Continuous spectrum
Continuous spectrum means we use the unbroken range of wavelengths to observe objects
emitting light We observe the light emitted by an object directly without using a medium
This method however isnrsquot used very often because itrsquos difficult to observe an object
directly
233 Line spectrum20
2331 Absorption spectrum
For the absorption spectrum we use absorption lines These lines are created by the thin gas
(which gas doesnrsquot matter but the absorption lines will be different then) The wavelengths of
the body we want to observe go through the tin gas but the atoms of the gas will absorb some
of the wavelengths Because those wavelengths are absorbed by the atoms of the gas the
19 GREEN SF and JONES M H An introduction to the Sun and Stars The Open University Cambridge
2004 p 20-2620COMINS NF and KAUFMANN III WJ Discovering the universe eighth edition WH Freeman and
Company New York 2008 p 109-113
832019 Ew Afgewerkte Final
httpslidepdfcomreaderfullew-afgewerkte-final 1259
12
wavelengths cannot appear in the absorption spectrum of the body we observe We can notice
in appendix VII the absence of some wavelengths by the black lines Such lines are called
absorption lines They correspond to the wavelengths that are absorbed by the gas
2332 Emission spectrum
We can also examine the light emitted by the gas The atoms of the gas absorb some
wavelengths emitted by the object we actually want to observe but afterwards they will emit
those wavelengths again as photons This gives us a number of bright lines called emission
lines For many gases the wavelengths of the absorption lines will be the same as those
from the emission lines
234 The Zeemaneffect 21
In 1896 Pieter Zeeman (1865-1943) discovered that some spectrum lines split up A spectrumline emitted in a magnetic field will split up into different spectrum lines close to each other
This is called the Zeemaneffect
If the magnetic field is strong enough and is parallel with the direction of observation the
absorption line splits up into two lines one on the left side of the normal absorption line
(which means a smaller wavelength) and one on the right side of the absorption line (which
means a higher wavelength) If there is a magnetic field straight on our direction of
observation the absorption line will even split up into three lines one line will represent the
normal absorption line the other two will be just like with a parallel magnetic field
Figure 3 The Zeemaneffect
httpchemteaminfoGalleryGallery16html
How does a magnetic field influence an electron We can find an explanation in the Quantum
theory The magnetic field will interact with the atoms so that the electrons will reach
slightly different energy levels Atoms with different energy levels will emit different
wavelengths This explains the multiple lines of the Zeemaneffect
The divergence of the splitting depends on the force of the magnetic field which means we
can determine the size of the magnetic field by observing the Zeemaneffect
21VAN DEN BERGHE S lsquoHet Zeemaneffectrsquo Heelal september 1998 p 228-231
KOPANSKI J Atom Internet (httpknolgooglecomkjan-kopanskiatom1amrwrct7rvi27) 060209
832019 Ew Afgewerkte Final
httpslidepdfcomreaderfullew-afgewerkte-final 1359
13
Chapter 3 The solar cycle
31 Introduction
In this chapter we will concentrate on the long term evolution of the global magnetic field of
the sun It is important to understand the long-term evolution of the global magnetic field of the sun because the global magnetic field has a great influence on the magnetic field on a
local scale The sunrsquos magnetic field changes every 11 years This is why we call it the 11-
year-solar cycle However strictly speaking it is a 22-year-cycle This will be explained later
on in this chapter The record of the first solar cycle started in 175522 Since then itrsquos
currently already the 24th solar cycle
32 Differential rotation
As well as the earth the sun rotates But the sun isnrsquot made of the same matter as our earth on
the surface The sunrsquos surface is made of plasma Because of the plasma the sun will rotateat different speeds depending on latitude At the equator the sun makes a full rotation every
25 days But the rotation will slow down when the latitude increases This means that at the
poles the sun will rotate much slower At the poles the rotation time is 36 days This creates a
gap of more than 10 days23
Astronomers believe that it is only the surface of the sun that undergoes differential rotation
The inner core moves more like a solid body such as the earth but it is still unclear if this is
the case24
33 When the years passhellip25
Differential rotation is the main cause of all the complex phenomena that will be discussed
later on because this differential rotation causes the solar cycle and magnetic disturbance
As mentioned previously before the sunrsquos surface rotates much faster at the equator than at
the poles the plasma around the equator will move faster This is shown in figure 4 on the
next page Since the sun keeps on rotating in the same direction the plasma at the equator will
move much faster26
The magnetic field that the sun normally would have is the same type as the magnetic field of the earth This means the sun normally has the magnetic field resembling to the magnetic field
of a bar magnet Magnetic field lines move from north to south and at the poles the density of
the magnetic field is compact because there the magnetic field lines come together
22 JANSSENS J The case of the missing solar cycle (published in lsquoheelalrsquo January 2008) Internet (httpusers
telenet be jjanssensMSCwebEngpdf)23
DETHIER T Het zonnestelsel Standaard Uitgeverij 1992 p 77-7824
RUSSELL R Rotation of the sun Internet (httpwwwwindowsucaredutourlink=sunSolar_interiorSun_layersdifferential_rotationhtml) 1608200525 CUYPERS J and others lsquoLa rechercheacute en heacuteliophysique en Belgiquersquo Space connection October 2007 p
6-726GREEN SF and JONES M H An introduction to the Sun and Stars The Open University Cambridge
2004 p 72-73
832019 Ew Afgewerkte Final
httpslidepdfcomreaderfullew-afgewerkte-final 1459
14
Figure 4 The magnetic field lines of the sun change because of the differential rotation
httpircameraasarizonaeduNatSci102lecturessunhtm
If we apply the differential rotation on this magnetic field the magnetic field lines under the
photosphere of the sun will move faster at the equator This will cause the following
structure seen on figure 4 on the sun in the middle The magnetic field lines will continue to
get mixed up and the magnetic field lines will pile up This process takes several years
Finally the magnetic field lines will be stacked almost parallel to the sunrsquos equator This is
the sun on the right side in figure 427 You can find a more specific drawing of this process in
appendix VIII
Eventually after approximately eleven years the magnetic field lines will be piled up in such
a way that finally the magnetic field lines will start to pop out of the sunrsquos surface This willcause sunspots Sunspots appear in pairs one with a south ldquopolerdquo and one with a north
ldquopolerdquo The north ldquopolerdquo contains magnetic field lines that are directed outwards and the south
ldquopolerdquo contains magnetic field lines that point inwards28 Sunspots are discussed in more
detail in the next chapter When the sunspots almost come to an end the loops will reconnect
with another sunspot over the equator This connection will cause a switch of the poles (see
figure 5) The South Pole will become the North Pole and vice versa This model is called the
magnetic dynamo proposed by Horace Babcock (1912-2003)29
27GREEN SF and JONES M H An introduction to the Sun and Stars The Open University Cambridge
2004 p 72-7328 LANG KR Sun earth and sky Springer Germany 1995 p 8229
COMINS NF and KAUFMANN III WJ Discovering the universe eighth edition WH Freeman andCompany New York 2008 p 297-298JANSSENS J lsquohet maximum van de 23ste zonnenvlekkencyclus (II)rsquo Heelal November 1998 p 284
832019 Ew Afgewerkte Final
httpslidepdfcomreaderfullew-afgewerkte-final 1559
15
Figure 5 The switching of the magnetic poles of the sun
GREEN SF and JONES M H An introduction to the Sun and Stars The Open University Cambridge 2004 p73
When finally the poles have switched and the magnetic field lines are disentangled the cycle
will just start over again for another eleven years Because the magnetic poles of the sun
switch every eleven years the cycle is called the 11-year-solar cycle
34 Other cycles
341 The 22-year-cycle
If we take the magnetic poles into account however the 11-year-cycle becomes a 22-year-
cycle because the magnetic poles switch If we want to consider the strict cycle which means
that we take the magnetic poles into account we have to call the solar cycle a 22-year-cycleIt takes eleven years to switch the magnetic North Pole into a South Pole and another eleven
years to switch them back This cycle is called the Hale-cycle named after George Ellery
Hale (1868-1938) who was an American solar astonomer and active in different
observatories30
342 The 27-day-cycle31
The 27-day-cycle taking the average of the sunrsquos rotation time is a cycle that is directly
connected to the rotation time of the sun The sunspots the coronal holes and other
phenomena that are related to the activity of the sun rotate too This means that the activity of the sun is connected to the rotation cycle For example the part of the sun that we can see will
be less active when the sunspots are not visible because the sunspots influence the solar
activity When the sunspots appear again the activity of the sun will rise This cycle is also
known because of the coronal holes that influence the solar wind
30JANSSENS J lsquohet maximum van de 23
stezonnenvlekkencyclus (II)rsquo Heelal November 1998 p 284-290
31 JANSSENS J Zon en aarde een unieke relatie Garant Antwerpen 2003 p 113
832019 Ew Afgewerkte Final
httpslidepdfcomreaderfullew-afgewerkte-final 1659
16
343 Other cycles
Astronomers believe that there must be some other cycles of an even longer basis Different
researchers have been looking for other solar cycles Some thought they found a 55-year
cycle However this cycle was very irregular Max Waldmeier (1912-2000 a very eminent
solar astronomer of the 20th
century) found a 90-year-cycle However lots of other cycleshave been ldquofoundrdquo There have been postulated a 2300-year-cycle too But the records of
solar cycles are too recent to prove this cycle 32
35 Solar maximum and minimum
The Royal Greenwich Observatory has been observing the sunspots since 1874 The
information of their observations includes the size the position and the number of sunspots
during all the recorded solar cycles If we put all this information into a graph we can see the
so-called butterfly-graph (appendix IX) With this information we can conclude that sunspots
do not appear at random33
At the beginning of a new solar cycle the first sunspots appear at latitude of 45 degrees Later
on sunspots will appear at the equator too When the sunspots begin to appear at 45 degrees a
new cycle has started again34 The solar minimum is the starting point of the solar cycle At
the beginning sunspots are very rare sometimes there are none If there are any sunspots they
will occur at higher latitudes The solar activity is the least on solar minimum Then it is a
good time for astronauts to go into space because there are less sunspots and less solar flares
and other phenomena that can influence the solar wind and so the space weather When the
solar activity is the highest the solar cycle reaches its maximum There will be a lot of
sunspots which now occur on lower latitudes too35 The time to go from a solar minimum to a
solar maximum is around four years During this time the solar activity will rise and when it
reaches its maximum it will slowly decline The decrease takes much more time than the
increase of the solar activity around 7 years The time between a solar minimum and
maximum and between a solar maximum and minimum can vary and is different for every
solar cycle36
36 Mysteries of the solar cycle
Astronomers have been able to find out a lot of details about the solar cycle However we are
still not able to predict the maximums and minimums of the solar cycles preciselyAstronomers havenrsquot been capable to draw up a model that allows us to predict the exact
number of sunspotshellip You can compare it to predictions for the weather to comehellip
32JANSSENS J Zon en aarde een unieke relatie Garant Antwerpen 2003 p 113-114
33HATHAWAY D H The sunspot cycle Internet (httpspacesciencespacerefcomsslpadsolarsunspots
htm) 0401200034 JANSSENS J Zon en aarde een unieke relatie Garant Antwerpen 2003 p 10335
WINDOWS TEAM Maunderrsquos Butterfly Diagram Internet (httpwwwwindowsucaredutourlink=sunactivitybutterflyhtml) 200036 JANSSENS J Zon en aarde een unieke relatie Garant Antwerpen 2003 p 99-100
832019 Ew Afgewerkte Final
httpslidepdfcomreaderfullew-afgewerkte-final 1759
17
Chapter 4 Phenomena caused by the magnetic field of the sun
41 Sunspots
411 What are sunspots
Sunspots appear on the sunrsquos surface when the magnetic field lines under the photosphere
are piled up too much and they finally pop out into the chromosphere Sunspots are normally
found in groups The number of sunspots is dependent on the solar activity when the solar
activity reaches its maximum there will be many more sunspots than at solar minimum
Measuring the magnetic field in sunspots with the Zeemaneffect makes clear that the
strength of the magnetic field is much stronger in sunspots than in the surrounding
photosphere Itrsquos more than thousand times stronger the magnetic field strength in magnetic
fields varies from 1000 to 4000 Gauss while the surrounding area circles around 1 Gauss
(comparison the earthrsquos magnetic field strength is about 05 Gauss)37
412 What do sunspots look like
When magnetic field lines pop out of the photosphere they will form magnetic loops (figure
6 on the right side) Between this magnetic loops there will be formed a flux tube The
magnetic field lines in the sunspot will distort the convection under the surface (see figure 6
on the left side) They will pull the plasma downwards and will prevent the warm plasma
from going upwards and reach the sunrsquos surface Eventually the temperature in the sunspot
will cool down38
Figure 6 Left side convection in sunspotsRight side magnetic field lines in sunspots
JANSSENS J Zon en aarde een unieke relatie Garant Antwerpen 2003 p41
37
RUSSELL R Sunspots and magnetic fields Internet (httpwwwwindowsucaredutourlink=sunatmospheresunspot_magnetismhtmlampedu=high) 06090838 JANSSENS J Zon en aarde een unieke relatie Garant Antwerpen 2003 p 40-41
832019 Ew Afgewerkte Final
httpslidepdfcomreaderfullew-afgewerkte-final 1859
18
We can distinguish 2 areas the black sunspot and the surrounding bright surface of the sun
The sunspot itself consists of the very dark centre called the umbra and the surrounding
orange-brown environment called the penumbra The penumbra consists of an amount of
small little striated f igures that come out of the umbra A sunspot can reach a diameter of
300 000 kilometres39 The temperature in the sunspots centre is much cooler than in the
photosphere because of the convection explained above It measures around 4 200 K whilethe photosphere has a temperature of 6000 K40
Figure 7 The composition of a sunspot
httpwwwjaxajparticlespecialastroshimizu02_ehtml
A sunspot appears black to our eyes However appearances are deceptive the dark sunspot
only seems dark because we see it against a much warmer environment If we h ad seen itagainst a black surface it would have been much brighter than the moonrsquos glowing41
The amount of sunspots varies from very few till over more than a hundred The amount of
sunspots can be predicted by the Wolf-numbers named after Johann R udolf Wolf (1816-
1893) a Swiss astronomer best known for his research on sunspots42 However I wonrsquot
explain this method in this paper You can find a briefly explanation in appendix X Yet this
method is only capable to predict the amount of sunspots approximately
42 Prominences
421 What is a prominence
The luminosity of the sun outshines lots of phenomena that take place on the surface of the
sun and even far away from the sun The sunrsquos corona is one example But luckily
prominences are quite visibly when we observe the sun A prominence is a huge cloud of gas
that is cooler than his environment It is trapped between two horizontal magnetic field lines
For human eyes it seems to spread out dark but this is only because a prominence has a much
39 LILENSTEN J and BORNAREL J Sous les feux du soleil EDP Sciences Les Ulis Cedex A 2001 p 3540 OTTERSDORF M Astronomy On the sunspot cycle Internet (httpuserszoominternetnet~matto
MCASsunspot_cyclehtmZeeman effect) 03110341JANSSENS J Zon en aarde een unieke relatie Garant Antwerpen 2003 p 41
42 JANSSENS J lsquoHet maximum van de 23ste zonnevlekkencyclus (I)rsquo Heelal October 1998 p 256-263
832019 Ew Afgewerkte Final
httpslidepdfcomreaderfullew-afgewerkte-final 1959
19
lower temperature then the sunrsquos chromosphere (similar to sunspots which spread out dark
too) The dark lines in appendix XI are also known as filaments A filament is a line between
to magnetic fields with opposite polarities (appendix XI)43
Figure 8 A solar prominence
httpcosmic-webcoukp=274more-274
422 What is a prominence made of
The gas from the prominence is coming from the chromosphere So the prominences have
approximately the same composition as the chromosphere A good way to observe
prominences is to use red Hα or blue Hβ spectrum lines Hα absorption lines indicate a
temperature lower than 10 000 Kelvin These spectrum lines justif y that the temperature of a prominence is remarkably lower than the temperature of the corona 44
423 How do prominences originate
A prominence is a result of the magnetic field Particles of the sun can transport warmth very
fast if they move alongside magnetic field lines If they want to move straight to a magnetic
field line the transport of warmth is negligible So prominences that are trapped between 2
magnetic fields only have one way to be heated This brings on a temperature that is notably
lower then the temperature in the corona45
The origin of prominences is similar to the origin of solar flares When two magnetic loops
of opposite polarity start to approach each other they will reconnect and form some new
loops This is shown in appendix XII Some mass from the sun will be trapped between the
new magnetic field lines and will form a solar prominence 46
43COMINS NF and KAUFMANN III WJ Discovering the universe eighth edition WH Freeman and
Company New York 2008 p 29944 SMITS F lsquoProtuberanzenrsquo Heelal Juli 1991 p 18345 LANG KR Sun earth and sky Springer Germany 1995 p 134-14046
MARTENS PC and ZWAAN C Origin and evolution of filament-prominence systems Internet ( httpwwwioporgEJarticle0004-637X558287253575webpdfrequest-id=73e38daa-69ae-4e01-b9a6- b4bd0ba071dd) 092001
832019 Ew Afgewerkte Final
httpslidepdfcomreaderfullew-afgewerkte-final 2059
20
424 What do prominences look like47
4241 Different groups of prominences
As you can see on the pictures in appendix XIII prominences can have different shapes and
forms Thatrsquos why astronomers classify them into different groups the quiescent prominences the active prominences and eruptive prominences
4242 Quiescent prominences
Quiescent prominences can appear everywhere on the sun and are not depending on latitude
They can reach into the corona over 2 500 till 40 000 kilometres Quiescent prominences last
the longest of all prominences Some of them even last several solar rotations long These
prominences are very long and not so wide During its lifetime a quiescent prominence moves
slowly to the poles When they are found at the poles of the sun they are called a lsquopolar
crownrsquo (appendix XIV)48
4243 Active prominences
Their name already suggests where they can be found active prominences are found in the
active regions of the sun moreover in the presence of sunspots These prominences
however only have a short lifespan only several hours But within this short lifespan they do
change form adjusting to the magnetic field lines within a short period of time Because
these prominences are located in active regions there are many more reconnections and so
the form will change more rapidly
4244 Eruptive prominences
These prominences only last a couple of minutes and are connected to active sunspots as well
It is possible that after one died out another immediately gives birth in the same region Other
eruptive prominences are known to be bubbles of gas that are issued from active sunspots
There have been some records of eruptive prominences that bump into other prominences and
push the other prominences back in the sunspot49
47 KNISELY D Solar prominences Internet (httpwwwicstarscomHTMLSolarSectionHAlpha OBSERVINGTHESUNHAlpha3html) (03042009)
SMITS F lsquoProtuberanzenrsquo Heelal Juli 1991 p 182-185
ELLERMAN F Solar prominences Internet (httparticlesadsabsharvardedufull 1928ASPL173E0000074000html) (03042009)48
KNISLEY D Solar prominences Internet (httpwwwicstarscomHTMLSolarSectionHAlphaOBSERVINGTHESUNHAlpha3html) (03042009)49 PRIEST E R Dynamics and Structure of Quiescent Solar Prominences Internet (httpbooksgooglebe
booksid=h599q3jz1w4Campdq=quiescent+prominencesampprintsec=frontcoverampsource=blampots=58b79Qeyabampsig=1eklQ-WszOIebZZaq7fq7gm6bxAamphl=nlampei=urPtSe7ZCo61-Qa166jHDwampsa=Xampoi=book_resultampct=resultampresnum=3PPA6M2) 1989
832019 Ew Afgewerkte Final
httpslidepdfcomreaderfullew-afgewerkte-final 2159
21
43 Coronal holes50
When looking at the sun with an x-ray telescope we can see dark regions across the sun
These dark regions are called coronal holes Coronal holes have an open magnetic field
structure This means that the magnetic fields lines do not angle downwards but they extend
into space indefinitely Due to this the particles of the sun are capable to reach out far intospace without any struggles against the magnetic field With this outflow of gases from the
sun coronal holes are one of the most important sources of the (high-speed) solar wind
(appendix XV)
44 Corona loops
441 What is a corona loop
If we look closer at a pair of sunspots we can see an emission of plasma alongside
magnetic field lines that originate in the sun spots A corona loop can extend into the coronaas the name suggests Those loops contain plasma that can reach a temperature higher than
106 Kelvin Corona loops can best be observed by ultra-violet and x-ray images because of
the high temperature The high temper ature brings on a high vibration of the atoms This
trembling causes the emission of x-rays51
Figure 9 A close up of corona loops
httpwwwdaviddarlinginfoencyclopediaCcoronal_loophtml
442 Where and when do corona loops originate
The magnetic field lines of sunspots move outwards from the sun into the corona and form
broad loops This makes it possible to trap hot gas with a temperature up to 40 million K
Those magnetic field loops trap hot plasma into the sunrsquos atmosphere The magnetic force
pushes particles around along the magnetic lines but at the same time the atoms circulate
around the magnetic field lines (see figure 10) The speed of their movements depends on the
50
ENCYCLODPEDIA OF SCIENCE Corona hole Internet (httpwwwdaviddarlinginfoencyclopediaC coronal_holehtml) (04042009)51 JANSSENS J Zon en aarde een unieke relatie Garant Antwerpen 2003 p 52-54
832019 Ew Afgewerkte Final
httpslidepdfcomreaderfullew-afgewerkte-final 2259
22
density of the magnetic field So if a particle moves from the top of a loop to the bottom it
will slow down just like in traffic jams Eventually it will reach the bottom but the bottom is
highly compressed (because the magnetic field lines converge at the bottom of the loops) so
that the particle will be shot back along the magnetic field line (see figure 10)
Figure 10 the movement of particles in corona loops
GD HOLMAN lsquoThe mysterious origins of solar flaresrsquo Scientific America April 2006 p24-29 volume 294number 4
Hence the particles will move up and down along the magnetic field lines Atoms that are
charged the same will cause electric currents (just like in a battery) These currents will
generate a new magnetic field and the old magnetic field in combination with the new one
will cause a high distortion in the magnetic field of the sun This is the moment when the
corona loop will transform into a solar flare
45 Solar flare52
451 What is a solar flare
A solar flare is a sudden powerful explosion in the solar atmosphere caused by a disruption
in the magnetic field of the sun Because of the disruption mass from the sun will be movedup and form a solar flare A solar flare can equal the energy of billions of atomic bombs
within a few minutes The strongest solar flares are measured during the solar maximums
because then the sunrsquos magnetic activity is the strongest53 Since the sunspots in the presence
of solar flare have a very high magnetic field it is likely that a solar flare would even have a
higher magnetic field But in reality the magnetic field of a solar flare is only half of the
magnetic field of a sunspot The intensity of the magnetic field is lsquoonlyrsquo 500 Gauss54
52 HOLMAN GD lsquoThe mysterious origins of solar flaresrsquo Scientific America April 2006 p 24-31 volume
294 number 453JANSSENS J Zon en aarde een unieke relatie Garant Antwerpen 2003 p 55-57
54 JANSSENS J lsquoZonnefakkelsrsquo Heelal Oktober 1994 p 256
832019 Ew Afgewerkte Final
httpslidepdfcomreaderfullew-afgewerkte-final 2359
23
Figure 11 You can see the magnetic fieldlines in the solar flare on the right side
Large solar flare recorded by SOHO EIT304 instrument 512x512 version Animation (980kMPEG) CourtesySOHO(ESAampNASA)
httpwwwteachersparadisecomencyenwikipediassusunhtml
452 Where and how do sun flares originate
Astronomers have long been speculating how solar flares exactly originate In 1992 Satoshi
Masuda (graduated at the University of Tokyo) discovered on pictures of the Japanese
Yohkoh Satellite that the far end of a solar flare emitted unusually short wavelengths very
short x-rays The source must be a concentration of gas with a temperature of about 100million K concluded Masuda But this discovery provoked some new questions why was the
high temperature at the top of the flare and not at the bottom where the gas is more compact
Why does the plasma stay confined instead of spreading out into the universe In order to
obtain more information to try to solve this problem astronomers started observing the sunrsquos
radiation of ultraviolet and x-rays frequently In 2002 NASA even launched the RHESSI
(Ramaty High Energy Solar Spectroscopic Imager) which was intended to bring solar flares
into pictures55
These observations provided evidence that sun flares surge up in regions where the magnetic
field is very strong ndashmost common in the presence of sun spots At this point we have to call
over the corona loops As mentioned before corona loops are electric currents of atoms
which move alongside magnetic field lines When the atoms are shot back alongside the
magnetic field line there seems to occur a distortion of the magnetic field This distortion will
end up in a solar flare All the mass of the corona loop will be shot into space and form a solar
flare
But how can such enormous mass of the solar flares be shot into s pace This has been a very
interesting question However Peter Alan Sweet (1921-2005)56 succeeded in finding an
55 GD HOLMAN lsquoThe mysterious origins of solar flaresrsquo Scientific America April 2006 p 27 volume 294
number 456UNIVERSITY OF GLASGOW Bibliography of Peter Sweet Internet (httpwwwuniversitystoryglaacuk
biographyid=WH2144amptype=P) (10042009)
832019 Ew Afgewerkte Final
httpslidepdfcomreaderfullew-afgewerkte-final 2459
24
answer already in 1956 If magnetic field lines break apart and then reconnect they bring
together two opposing fields that will cancel each other and cause a huge burst of energy The
reconnection will create new magnetic field lines This reconnection is called the Sweet-
Parker reconnection Yet this is a slow reconnection which cannot take place at the base of a
solar flare with a dazzling speed Fortunately Harry P Petschek published an article about
reconnection in 1964 and solved that problem under certain circumstances it is possible toreconnect much faster which explains solar flares This faster reconnection is also called the
Petschek reconnection But unfortunately with the current technology it is not yet possible to
take pictures of those reconnections57
If the energy comes from the reconnection then where does this reconnection take place
From pictures of solar flares astronomers discovered that at the top of the corona loop a
mysterious x-ray source was found The x-ray source began to give a higher energy level and
at the same time the particles move down towards the sunrsquos surface Yet the x-ray source
stays at the same placehellipThen when the x-rays reach their maximum the loop suddenly
changes direction But this time the x-ray source will move upwards too unexpectedly it
moves at the speed of light approximately three hundred thousands kilometres an hour awayfrom the sun This is the same speed as the coronal mass ejections
46 Coronal mass ejections
461 What is a coronal mass ejection58
Coronal mass ejections (CMErsquos) (appendix XVI) are huge amounts of gas some billions of
plasma from the sun that are ejected into space Their temperature can reach 25 million K59
A coronal mass ejection can last for several hours and it can at last enter the solar wind A
CME can reach a speed of 50kms- 2000kms which means more than 7 million kilometres
an hour60 The mass of a large CME varies from 5 x 10⁶ to 5 x 10¹³ kg61 During a solar
maximum there are more coronal mass ejections than during a minimum but they can occur
at any time of the solar cycle Coronal mass ejections are related both to solar flares and
prominences Very heavy coronal mass ejections can cause some geomagnetic storms on
earth
462 Reconnection
The reconnection of a solar flare can end up in a coronal mass ejection When magneticfield lines that are opposite are starting to reconnect and form new magnetic field lines half of
the magnetic field lines will point downwards and join some existing magnetic loops
However the other part of the magnetic field lines will move upwards at a very high speed
and will form some loops more upwards Between those loops that moved downwards and
those that moved upwards there is some mass that isnrsquot connected to the sun anymore It is
57GD HOLMAN lsquoThe mysterious origins of solar flaresrsquo Scientific America April 2006 p 29 volume 294
number 458
BRAEUNIG R A Glossary Internet (httpwwwbraeunigusspaceglossaryhtm) 200659 LILENSTEN J and BORNAREL J Sous les feux du soleil EDP Sciences Les Ulis Cedex A 2001 p 4460 Cuypers J and others lsquoLa rechercheacute en heacuteliophysique en Belgiquersquo Space connection October 2007 p 10-
1161GREEN SF and JONES M H An introduction to the Sun and Stars The Open University Cambridge
2004 p 68
832019 Ew Afgewerkte Final
httpslidepdfcomreaderfullew-afgewerkte-final 2559
25
known that for an amount of solar flares that this mass between the loops will end up in a
coronal mass ejection Yet this doesnrsquot count for all the solar flares The coronal mass
ejection only takes place if the magnetic field lines twist around each other while forming the
letter lsquoSrsquo (see figure 12)62
Figure 12 Here you can see the reconnection that takes place before the coronal mass ejection starts
httpwwwnasagovmission_pagessolar-bsolar_005html
Certainly we will be capable to answer all the questions about solar flares and coronal mass
ejections in the nearby future But there are also some very interesting questions left what is
at the basis of the acceleration of the atoms in solar flares How does magnetic reconnection
originate Hopefully we will find the answers in the near future
47 Solar wind
471 What is the solar wind
Every second of every day of the year the sunrsquos corona emits a continuous stream of mass
from the sun The temperature of the corona is so high that the sunrsquos magnetic field just
cannot control the outflow of particles We know that the particles are accelerated but
astronomers cannot explain all the details about the solar wind yet
472 What do we know about the solar wind
The speed of the solar wind can change it differs from 300kmh up to 800kmh This speed
depends on the outflow of gases If there is a corona hole pointing towards the earth the solar
wind will reach a speed of around 800kmh The different speeds can interact with each other
and form a new speed according to the rules of light emission When two emissions connect
with each other they can form a faster or slower solar wind just like waves can interact and
form new waves
62BOEN B Birth of a coronal mass ejection Internet (httpwwwnasagovmission_pagessolar-b
solar_005html) 290408
832019 Ew Afgewerkte Final
httpslidepdfcomreaderfullew-afgewerkte-final 2659
26
The ionized atoms with very high temperature coming from the sunrsquos corona are one of the
most important parts of the solar wind but the magnetic fields are important too The
magnetic field outside the sun gets wrapped into a spiral called the Parker-spiral named after
the scientist who described it as the first one (because the sun rotates) This influences the
magnetic field of the sun from the outside The solar wind is emitted in spiral too (see figure
13)
Figure 13 The course of the solar wind caused by the rotation of the sun
httpheliosgsfcnasagovsolarmaghtml
473 Heliosphere
We can describe the heliosphere as a gigantic magnetic bubble around the sun This is
everywhere in space till where the sunrsquos magnetic field reaches and still has an influence The
heliosphere is filled with solar wind although the solar wind has a very low density Yet it
is a very hot wind but because of the very low density it does not have such a great influence
on earth However it can cause some energetic storms on earth63
63 NASA The heliosphere Internet (httpheliosgsfcnasagovheliosphhtml) 20012009
832019 Ew Afgewerkte Final
httpslidepdfcomreaderfullew-afgewerkte-final 2759
27
Conclusion
The sunrsquos magnetic field is a complex system to understand Yet I hope you have learned a
lot from this paper and that you do understand the exiting phenomena described in the
previous chapters
We can discuss the sunrsquos magnetic field from two perspectives The first one is looking at the
magnetic field for global long-term changing dimensions The second way is based on
phenomena on lower scale
The global changes involve the solar cycle and the switch of the magnetic poles The solar
cycle is divided into a decrease of the solar activity until it reaches solar minimum and an
increase of the solar activity until it reaches solar maximum The frequency of the phenomena
that can be found in the outer layers of the sun are directly connected to the solar activity and
thus to the solar cycle Sunspots are the easiest to see they appear as black spots against the
much brighter surface of the sun Corona loops are connected to sunspots and can extend into
solar flares and solar prominences These flares and prominences can burst out into a coronalmass ejection All these phenomena influence the sun and its solar wind how small their part
may be The solar wind has a directly influence on the earth
There is still much to be discovered Astronomers hope to discover much more about the
magnetic field of the sun Today many astronomers and scientists are observing the sun and
every day they discover more and more aspects of the sun Recently a group of researchers
led by David Jess of Queens University Belfast has revealed why the sunrsquos atmosphere is
hotter than its surface64 As you can see astronomy is a very developing science
64
CORDIS Researchers reveal why Suns atmosphere is hotter than its surface Internet (httpcordiseuropaeusearchindexcfmfuseaction=newsdocumentampN_LANG=ENampN_RCN=30598amppid=0ampq=87F36474805A6BEC0B89404F72D0351Famptype=sim) 20032009
832019 Ew Afgewerkte Final
httpslidepdfcomreaderfullew-afgewerkte-final 2859
28
Glossary
Absorption lines A dark line superimposed on a continuous spectrum when a gas absorbs
light from a continuous source that is hotter than the absorbing gas
Aurora Light radiated by atoms and ions formed by the solar wind in the earthrsquos upper atmosphere seen most commonly in the polar regions
Chromosphere The layer in the solar atmosphere between the photosphere and the corona It
is the lowest layer of the atmosphere characterized by reddish hue and by an increase of the
temperature with altitude through all but its lower regions
Convection The transfer of heat from a region of high temperature to a region of lower
temperature by the displacement of the cooler molecules by the warmer molecules The hot
gas will be moved upwards the cool gas will be pushed downwards into the sun
Corona The sunrsquos outer atmosphere It is very extensive and has a very low density It isextremely hot
Coronal hole A dark region of the sunrsquos inner corona as seen at X-ray wavelengths
Coronal loop Closed loops of magnetic field lines extending from the sunrsquos photosphere into
the corona which contain plasma at high temperature They are typically observed through
ultraviolet or x-ray emission from the hot plasma
Coronal mass ejection Large volumes of high energy gas released from the sunrsquos corona
Differential rotation The rotation of a non rigid object in which parts at different latitudes or
different radial distances move at different speeds
Dynamo theory The generation of a magnetic field by circulating electric charges
Eclipse The blocking of a part or all of the light from the moon by the earth (lunar eclipse) or
from the sun by the moon (solar eclipse)
Emission lines Emission lines are used in physics chemistry and astronomy to determine
what kind of gas is doing the emission Every element has a different electronic structure and
will thus have a different emission line fingerprint Emission lines are produced whenelectrons in atoms jump from one energy level to lower energy level
Filament A dark curve seen above the sunrsquos photosphere that is the top view of a solar
prominence
Flux tube Is a generally tube-like (cylindrical) region of space containing a magnetic field
such that the field at the side surfaces is parallel to them Both the cross-sectional area of the
tube and the field contained may vary along the length of the tube but the magnetic flux is
always constant
832019 Ew Afgewerkte Final
httpslidepdfcomreaderfullew-afgewerkte-final 2959
29
Geomagnetic storm When unusually strong surges of solar wind (charged particles from the
Sun) hit the Earth This effect causes variations in the magnetic field which surrounds the
Earth The visible results are eg the aurora (Northern and Southern lights)
Granulation Granules are related to the convective zone The granulation that shows up in the
photosphere is a result of the rising and falling of hot gas that takes place in the convectivezone
Hα absorption line An absorption line due to an electronic transition in hydrogen atoms in
which the atom absorbs a photon so that the electron makes a transition from a state
corresponding to the electronic energy level with n=2 to the one above with n=3 The photon
wavelength in a vacuum is 6563 nm
Heliosphere The volume of space within which the sun through the solar wind influences its
environment in the interstellar medium
Magnetic dynamo A theory that explains phenomena of the solar cycle as a result of periodicwinding and unwinding of the sunrsquos magnetic field in the solar atmosphere
Magnetic reconnection A process taking place in a plasma in which neighbouring
oppositely directed magnetic field lines suddenly part and reconnect in a new configuration
The abrupt change in a magnetic field represented by this process can release large amounts
of energy and it is thought to be important in explaining solar flares and other phenomena
Penumbra The portion of a shadow in which only part of the light source is covered by the
shadow-making body
Photosphere The region in the solar atmosphere from which most of the visible light escapes
into space
Plasma A fourth state of matter (not found naturally on Earth) of very hot gases Plasma is a
fluid with the ability to carry electric currents with no local accumulations of electric charge
Prominence Flamelike protrusion seen near the limb of the sun and extending into the solar
corona The side view of a filament
Quantum theory A theory in physics based on the principle that matter and energy have the
properties of both particles and waves created to explain the radiation of energy from a blackbody the photoelectric effect and the Bohr theory and now used to account for a wide
range of physical phenomena including the existence of discrete packets of energy and
matter the uncertainty principle and the exclusion principle Itrsquos a theory of the interaction of
matter and radiation developed early in the twentieth century which is based on the
quantization of energy and applied to a wide variety of processes that involve an exchange of
energy at the atomic level
Reconnection See magnetic reconnection
Solar cycle A 22-year-cycle during which the sunrsquos magnetic field reverses its polarity twice
Solar flare A violent eruption on the sunrsquos surface
832019 Ew Afgewerkte Final
httpslidepdfcomreaderfullew-afgewerkte-final 3059
30
Solar wind An outward flow of particles (mostly electrons and protons) from the sun
Solstice Either of two points along the ecliptic at which the Sun reaches its maximum
distance north or south of the celestial equator
Spectroscopy Concerns the production and study of spectra
Spectrum The result of electromagnetic radiation passing through a prism or grating so that
different wavelengths are separated
Spicule Short-lived (lifetime from rising to falling is about 15 minutes) jets vertical to the
solar surface that are several thousand kilometres long and about 1 kilometre thick (see also
appendix IV) in the solar chromosphere
Sunspot A temporary cool region in the solar photosphere created by protruding magnetic
fields
Umbra The central completely dark portion of a shadow
Zeemaneffect A splitting of spectra lines in the presence of a magnetic field
Bibliography and webography of the glossary
COMINS NF and KAUFMANN III WJ Discovering the universe eighth edition WH
Freeman and Company New York 2008 535 p
GREEN SF and JONES M H An introduction to the Sun and Stars The Open University
Cambridge 2004 373 p
httpenmimihuastronomygranulationhtml
httpenmimihuastronomyplasmahtml
httpwwwspacecomspacewatchspace_weather_glossaryhtml
httpenmimihuastronomyemission_linehtml
httpenmimihuastronomyabsorption_linehtml
httpwwwpbsorgfaithandreasonphysglossqm-bodyhtml
httpwwwanswerscomtopicquantum-theory
httpenwikipediaorgwikiFlux_tube
832019 Ew Afgewerkte Final
httpslidepdfcomreaderfullew-afgewerkte-final 3159
31
Appendix I The sun in figures
Physical quantity Comment
Radius 695 510 km 109 x earths radius
Mass 1989 x1030 kg 332 946 earths mass
Mass sun in the solar
system
9986 Total mass sun total mass of
our solar system
Volume 1412 x10sup3sup3 cmsup3 13 million x earths volume
Age 455 milliard years
Luminosity 3854 x 10sup3sup3 ergss
Magnitude -2773
Density center 1513 gcmsup3
Density mean 1409 gcmsup3
Pressure center 2334 x1011 bars
Pressure photosphere 00001 bar
Temperature center 15 557 000deg K
Temperature photosphere 5 780deg K Various sources mention
different grades
Temperature corona 2 000 000 to 3 000 000deg K
Rotation time at North or
South pole
up to 35 days on earth
Rotation time at Equator 25 days on earth The difference in rotation
times is called differential
rotation
Rotation time general 2538 days on earth
Mean distance sun-earth
(AU)
14959787 x108 km 1 AU = 1 Astronomical Unit
= 149 598 000 km
Chemical composition of
the sun ( of total number
of atoms)
Hydrogen 921
Helium 78
All others 01
Various sources mention
slightly different percentages
832019 Ew Afgewerkte Final
httpslidepdfcomreaderfullew-afgewerkte-final 3259
32
Chemical composition of
the sun ( of total mass)
Hydrogen 7346
Helium 2485
All others 169
Various sources mention
slightly different percentages
Total transforming of
hydrogen into helium persecond
700 billions of kilograms of
hydrogen are transformedinto 6957 billions of
kilograms of helium each
second
Based on the following references
- BEATTY JK PETERSEN CC and CHAIKIN A The new solar system fourth edition
Cambridge University Press Cambridge 1999 p 421
- LILENSTEN J and BORNAREL J Sous les feux du soleil EDP Sciences Les Ulis
Cedex A 2001 p 247
- LANG KR Sun earth and sky Springer Germany 1995 p 282- DENTHIER T Het zonnestelsel Standaard Uitgeverij 1992 p 415
- JANSSENS J Zon en aarde een unieke relatie Garant Antwerpen 2003 p 254- VOLKSSTERRENWACHT URANIA VZW De zon Internet(httpwwwuraniabesterrenkundezonnestelselzonphp) (01012009)
832019 Ew Afgewerkte Final
httpslidepdfcomreaderfullew-afgewerkte-final 3359
33
Appendix II Anatomy of the sun
httpwwwcosmographicacomgalleryinfographicssolar_anatomyhtml
The middle the sun consists of a heavy core this consists of plasma just as the outer layers
of the sun but the pressure in the core is so high that it behaves much more like a solid bodyThe most outer layer is the corona it reaches far into space More to the inside there is the
chromosphere and then the photosphere The corona the chromosphere and the
photosphere are explained in chapter 1
832019 Ew Afgewerkte Final
httpslidepdfcomreaderfullew-afgewerkte-final 3459
34
Appendix III Granulation
httpwwwwindowsucaredutourlink=sunSolar_interiorsolar_furnacehtml
At the surface of the sun we can find granules These are created by convection the warmest
parts of the sunrsquos interior move upwards and the colder parts at the surface move downwardsThis causes currents of plasma The dark lines are the colder particles We see them darker
because they emit less light than their surrounding neighbourhood
832019 Ew Afgewerkte Final
httpslidepdfcomreaderfullew-afgewerkte-final 3559
35
Appendix IV Spicules
Picture httplpc1clpccdcccauslpcharpellastro20a20deinfo_s09htmInformation httpwwwdaviddarlinginfoencyclopediaSspiculehtml
On this picture you can see spicules Spicules only last for several minutes and can be foundin the chromosphere They are little jets of gas There also exist macrospicules that can be
approximately ten times larger than a normal spicule
832019 Ew Afgewerkte Final
httpslidepdfcomreaderfullew-afgewerkte-final 3659
36
Appendix V The most important satellites observing the sun
Here you can find the most important satellites observing the sun and their missions
Solar and Heliospheric Obseratory (SOHO)
httpsohowwwnascomnasagovaboutabouthtml
SOHO the Solar amp Heliospheric Observatory is a project of international collaboration
between ESA and NASA to study the Sun from its deep core to the outer corona and the solar
wind
SOHO was launched on December 2 1995 The SOHO spacecraft was built in Europe by an
industry team led by prime contractor Matra Marconi Space (now EADS Astrium) under
overall management by ESA The twelve instruments on board SOHO were provided by
European and American scientists Nine of the international instrument consortia are led by
European Principal Investigators (PIs) three by PIs from the US Large engineering teamsand more than 200 co-investigators from many institutions supported the PIs in the
development of the instruments and in the preparation of their operations and data analysis
NASA was responsible for the launch and is now responsible for mission operations Large
radio dishes around the world which form NASAs Deep Space Network are used for data
downlink and commanding Mission control is based at Goddard Space Flight Center in
Maryland
More information about SOHO can be found on
httpsohowwwnascomnasagovaboutdocsSOHO_Fact_Sheetpdf
832019 Ew Afgewerkte Final
httpslidepdfcomreaderfullew-afgewerkte-final 3759
37
Transition Region and Coronal Explorer (TRACE)
httptracelmsalcomProjectMissionmissionhtm
TRACE enables solar physicists to study the connections between fine-scale magnetic fields
and the associated plasma structures on the Sun in a quantitative way by observing the photosphere the transition region and the corona With TRACE these temperature domains
are observed nearly simultaneously (with as little delay as only a second between different
wavelengths) with a spatial resolution of one second of arc
This is accomplished by obtaining precisely coaligned image sequences of photosphere
transition region and corona with high spatial resolution and uninterrupted viewing of the
Sun for up to eight months
TRACE Mission
TRACE explores the magnetic field in the solar atmosphere by studyingbull The 3-dimensional field structure
bull Its temporal evolution in response to photospheric flows
bull The time-dependent coronal fine structure
bull The coronal and transition region thermal topology
TRACE was launched on a Pegasus launch vehicle from Vandenberg Air Force Base in April
1998 The launch was scheduled to allow joint observations with SOHO during the rising
phase of the solar cycle to sunspot maximum No transition region or coronal imager has
witnessed the onset and rise of a solar cycle
Pegasus in flight
The two satellites provide complementary observations TRACE produces the high spatial
and temporal resolution images while SoHO yields images and spectral data out to 30 solar
radii at much lower spatial and temporal resolution Jointly they provide the opportunity to
obtain simultaneous digital measurements of all the temperature regimes of the solar
atmosphere in both high-resolution imaging and spectroscopy
With these data we expect to shatter the current ignorance of coronal heating and impulsive
MHD phenomena with benefits not only to solar physics but also to studies ranging from
stellar activity to the MHD of accretion disks The magnetograms produced by MDI on SoHO
provide a complete record of the eruption and distribution of photosphere magnetic fields
which will be invaluable for understanding TRACE observations of coronal hole formation
and coronal mass ejections Both of these phenomena have profound effects on our space
environment and the Earth`s magnetic field
TRACE is the first US solar research satellite since the Solar Maximum Mission
Coordination with SOHO provides an unprecedented opportunity to follow the emergence of
magnetic flux from the base of the convection zone deep inside the Sun through the
photosphere chromosphere and transitional region to the low-beta outer corona while
observing the effects of this emergence such as coronal mass ejections with high spatial andtemporal resolution
832019 Ew Afgewerkte Final
httpslidepdfcomreaderfullew-afgewerkte-final 3859
38
The transition from the photosphere where magnetic fields and plasma are in rough
equipartition to the corona where magnetic fields dominate is extremely difficult to model
and until recently to observe at high temporal and spatial resolution Many of the physical
problems that arise here such as plasma confinement reconnection wave propagation and plasma heating arise throughout space physics and astrophysics The detailed study of these
processed in the solar outer atmosphere is invaluable to astrophysics in general and stellar
studies in particular
More information about TRACE observations can be found on
httptracelmsalcomOperationsGeneraloperatiohtm
832019 Ew Afgewerkte Final
httpslidepdfcomreaderfullew-afgewerkte-final 3959
39
Reuven Ramaty High Energy Solar Spectroscopic Imager (RHESSI)
httphesperiagsfcnasagovhessibrochurehtm
What Questions will HESSI Address
bull How is such a large amount of energy released so rapidly during a flare
bull How are so many electrons and protons accelerated so quickly to such high energies
bull Where are the electrons and protons accelerated in the solar atmosphere and where do
they deposit their energy
How will HESSI Address these Questions
HESSI shown below will concentrate on electrons and protons accelerated in solar flares
through observations of the X-rays and gamma rays that they produce
bull HESSI will obtain the first ever X-ray and gamma-ray images of flares from 100 keV
to 20 MeVbull HESSI will do the first ever nuclear gamma-ray line spectroscopy of solar flares
bull HESSI will obtain pictures of flares in X-rays with an angular resolution of 2
arcseconds a factor of three better than previously possible
bull HESSI will measure X-ray and gamma-ray spectra with less than 1 keV energy
resolution a factor of 20-40 better than previously possible with scintillation counters
More information about the RHESSIrsquos Mission can be found on
httphesperiagsfcnasagovhessiconcepthtm
832019 Ew Afgewerkte Final
httpslidepdfcomreaderfullew-afgewerkte-final 4059
40
Solar Radiation and Climate Experiment (SORCE)
httplaspcoloradoedusorcesciencebackgroundhtm
The Solar Radiation and Climate Experiment (SORCE) is a NASA-sponsored satellite
mission that is providing state-of-the-art measurements of incoming x-ray ultraviolet visiblenear-infrared and total solar radiation The measurements provided by SORCE specifically
address long-term climate change natural variability and enhanced climate prediction and
atmospheric ozone and UV-B radiation These measurements are critical to studies of the Sun
its effect on our Earth system and its influence on humankind
The SORCE spacecraft was launched on January 25 2003 on a Pegasus XL launch vehicle to
provide NASAs Earth Science Enterprise (ESE) with precise measurements of solar
radiation It launched into a 645 km 40 degree orbit and is operated by the Laboratory for
Atmospheric and Space Physics (LASP) at the University of Colorado (CU) in Boulder
Colorado USA It will continue the precise measurements of total solar irradiance (TSI) that
began with the ERB instrument in 1979 and has continued to the present with the ACRIM series of measurements SORCE will also provide the measurements of the solar spectral
irradiance from 1nm to 2000nm accounting for 95 of the spectral contribution to TSI
SORCE carries four instruments including the Spectral Irradiance Monitor (SIM) Solar
Stellar Irradiance Comparison Experiment (SOLSTICE) Total Irradiance Monitor (TIM) and
the XUV Photometer System (XPS)
The primary goal of the NASA Earth Observing Systems (EOS) SOlar Radiation and Climate
Experiment (SORCE) is to enable solar-terrestrial studies by providing precise daily
measurements of the total solar irradiance (TSI) and the solar spectral irradiance atwavelengths extending from the ultraviolet to the near infrared The following lists the
SORCE science objectives
1 Make accurate measurements with high precision of total solar irradiance connect
them to previous TSI measurements and continue this long-term climate record
Provide TSI with an accuracy of 001 (100 parts per million) based on SI units and
with a long-term repeatability of 0001yr
2 Make daily measurements of the solar ultraviolet irradiance from 120 to 300 nm with
a spectral resolution of 1 nm Achieve this spectral irradiance measurement with an
accuracy of better than 5 and with a long-term repeatability of 05yr Use the
solarstellar comparison technique to relate the solar irradiance to the ensembleaverage flux from a number of bright early-type stars (same stars used by the UARS
SOLSTICE program)
3 Make the first measurements of the visible and near IR solar irradiance with sufficient
precision for future climate studies Obtain daily measurements of solar spectral
irradiance between 03 and 2 microm with a spectral resolution of at least 130 an
accuracy of 003 and a long-term repeatability of better than 001yr
4 Improve the understanding of how and why solar irradiance varies estimate past and
future solar behavior and investigate climate responses
More information about SORCE can be found on
httplaspcoloradoedusorcesciencescience_opshtm
832019 Ew Afgewerkte Final
httpslidepdfcomreaderfullew-afgewerkte-final 4159
41
Appendix VI Wavelengths
httpeosweblarcnasagovEDDOCSWavelengths_for_Colorshtml
As you can see on the figure visible light situates in the centre of the wavelengths having not
the shortest nor the longest wavelengths Gamma rays have the shortest wavelength radioways the longest All sort of wavelengths are used for daily purpose like radio waves for
radio and TV and gamma rays for treatments
832019 Ew Afgewerkte Final
httpslidepdfcomreaderfullew-afgewerkte-final 4259
42
Appendix VII Absorption lines in the sunrsquos spectrum
Picture httpwwwsolarnavigatornetthe_sunhtmExplanation COMINS NF and KAUFMANN III WJ Discovering the universe eighth edition WHFreeman and Company New York 2008 p 109
This photo is called a spectrogram It contains the spectrum of the sun All the black lines are
absorption lines The amount of black lines is related to the amount of elements that the sun
is emitting From a spectrogram we can deduct a lot of things including their mass the
temperature of the surface the chemical composition of the sun rotation rates and much
more
832019 Ew Afgewerkte Final
httpslidepdfcomreaderfullew-afgewerkte-final 4359
832019 Ew Afgewerkte Final
httpslidepdfcomreaderfullew-afgewerkte-final 4459
44
Appendix IX Butterfly-diagram
httpspacesciencespacerefcomsslpadsolarimagesbflygif
A butterfly-diagram
In a butterfly-diagram we can find the sunspots with their latitude (y-axis) through the years(x-axis) As you can see the sunspots appear like lsquobutterfliesrsquo this was discovered in 1904 by
Edward Maunder (1851-1928 an English astronomer best remembered for his study of
sunspots and the solar magnetic cycle) Thatrsquos why this graph is also called Maunders
butterfly diagram
832019 Ew Afgewerkte Final
httpslidepdfcomreaderfullew-afgewerkte-final 4559
45
Appendix X The Wolf-numbers
httpsidcomabenews106sunspotnumberclarifiedpdf
The sunspot number clarified By Petra Vanlommel
Which kinds of daily International Sunspot Numbers (ISN) are currentlypublished by the SIDC
Three daily indices are currently published by the SIDCthe Estimated ISN (EISN)the Provisional ISN (PISN)the Definitive ISN (DISN)Although they are all based on the same type of observations ie visual sunspot counts as ameasure of solar activity they are obtained from different data sets by different processingmethods with different accuracies and they serve different purposes
In the ideal case the three numbers are equal but in practice it is inevitable that there aresmall differences Therefore It is useful to explain what each index actually means
What is the source of the Wolf number
Once per day observers worldwide communicate their measured Wolf number (= 10G + S)based on visual sunspot (S) and group (G) counts to the World Data Center for the SunspotIndex Presently this is done through a dedicated password-protected WEB form the Wolfinterface However some observers still use the old way of reporting their observations onpaper through regular mail This method slows down the final processing but for the sake ofcontinuity in the index it is important to keep these observers included as some of them
represent the longest individual datasetsThe observers give the exact observing time the observing conditions the total numbers(group count sunspot count and Wolf number) and optionally the NorthSouth and centralzone numbers The observers using the web interface can provide their results to the SIDCimmediately after each observation However some users prefer to insert their data as ablock creating some delay but this must be done at least once a month
The personal reduction coefficient K
A personal reduction coefficient K is calculated for each station It has values typically in therange 04 and 17 and leads to a normalized sunspot number K(10G+S) In other words theK factor rescales the raw sunspot counts of each observer to the ones of Rudolph Wolf the
astronomer who introduced the above Wolf formula thus simulating the same eyes sametelescope and same conditionsDuring the procedure for calculating the Provisional ISN the K factor of every station iscomputed for every observation that passes the elimination procedure Once a year apersonal K factor for every station and for every month of the previous year is calculated Ayearly mean K value per station is also computed
The estimated sunspot index
The Estimated ISN (EISN) is calculated and issued on a daily basis for the day of calculationand the day before Only the total EISN is calculated with no hemispheric index It is anautomated procedure and no manual intervention is done The EISN is meant as a quicktemporary and approximate index for real-time applications
832019 Ew Afgewerkte Final
httpslidepdfcomreaderfullew-afgewerkte-final 4659
46
We use the raw Wolf number from all observatories that have provided counts early in theday ie before 1230 UT Typically there is between 10 and 20 stations available Thecalculation of the EISN is based on a simple and straightforward statistical method The Wolfnumbers are multiplied with the yearly mean K factor (see paragraph about the personalreduction coefficient K) The EISN is a simple average of the K-scaled values after excludingany individual value that deviates abnormally from the other valuesOnce the Provisional ISN (PISN) is calculated after the end of a month the temporary EISNis dropped and replaced by the PISN
The provisional sunspot Index
The Provisional ISN (PISN) is calculated and issued on the first of every month Theoutcome is a daily total and hemispheric sunspot number for the entire elapsed month Anexample on the first of September we calculate the daily PISN for each day of August ThePISN is computed semi-automatically with as little manual intervention as possibleTo calculate the PISN values for the concerned month we use all Wolf numbers Typicallythere is data from around 65 stations available
The calculation of the PISN is based on an extensive statistical treatment This treatmentfilters out any abnormal daily observation or the complete data set from an erratic station(quality control) This prevents long-term drifts in the resulting index One of the key elementsderived from this processing is to update the K reduction coefficients for each station theevolution of each station is monitored for each day relative to the entire networkA subset of the contributing stations also provides hemispheric counts A similar process isapplied to the North and South counts to derive the hemispheric PISN There is an additionalconstraint the sum of the North and South ISN must match the total ISNThe PISN replaces the EISN And once the Definitive ISN (DISN) is calculated the DISNreplaces the PISN
The definitive sunspot index
The Definitive ISN is calculated and issued on a quarterly basis when we have collecteddata from all the contributing observatories This is the final index and it is appended to thehistorical sunspot index time series The same semi-automated treatment as for the PISN isnow applied to the full data set If the result agrees within 5 of the PISN value the PISN iskept and becomes definitive Otherwise the new calculated value replaces the PISN andbecomes the definitive ISNIt is only at this stage and only in peculiar situations that a manual verification by ourscientific staff is required For example this happens when the observed raw Wolf valuesfrom the whole network are clustered around two distinct values This special case can becaused by small short-lived isolated sunspots (lifetimes lt 24 hours) or by the appearance ordisappearance of a large group at the solar limb in the course of one UT dayThe DISN replaces the provisional and estimated International Sunspot Number
Handling very low activity levels
One of the situations requiring a human arbitration is associated with single small isolatedand short-lived sunspots This is most noticeable around the minimum of the solar activitycycle like the one occurring now in 2008 Due to the 24hour binning (observations aregrouped between 0hUT and 24hUT) and the variable ability of each observer to detect thesmallest sunspots we end up with some stations reporting one sunspot and others who didno see any sunspot Let us explain further No sunspot may mean that the sunspot waspresent but the observer was unable to see it because of poor observational conditions such
as weather a small telescope On the other hand it may also indicate that the sunspot hadactually vanished by that time while it was present earlier on the same day
832019 Ew Afgewerkte Final
httpslidepdfcomreaderfullew-afgewerkte-final 4759
47
Individual stations do not observe at exactly the same timeIn order to validate the existence of such a marginal reported sunspot a qualified SIDCscientist must then check the detailed chronology within that day and consider the overallobserver capability (value of K coefficient)In common practice the fact that a sunspot is reported by a significant group of observersleads to the inclusion of the sunspot on that date thus neglecting the no-sunspotobservationsThe rationale is multiple observations of a sunspot exclude the possibility that the reportedsunspot was an independent false detection So a sunspot was really present on that dayalthough it may have existed only for part of the day or it was small enough to be missed bypart of the observers with smaller instruments or imperfect atmospheric conditionsAlso keep in mind that the sunspot index is derived with a limited precision just like any otherindex If the monthly mean sunspot number is 0 or 05 you can definitely say that activitywas low
What index should be used
If you want to perform long-term investigations the definitive ISN series is definitely the mostsuitable However there is a delay of a few months So when investigating the last cycle andrecent evolution use the definitive numbers in combination with the provisional ISN to be upto date to the last month The provisional numbers are also used in models forecasting thesunspot number for the coming months Now if you need a proxy for solar activity in a modelthat runs in real-time then you may use the estimated ISNImprovements and rethinking of the processing method is an ongoing project We arecurrently developing an alternative program for calculating the PISN Of course long-termconsistency is vital Therefore a cross-analysis between the output from the old and newsoftware must be applied over an extended period
832019 Ew Afgewerkte Final
httpslidepdfcomreaderfullew-afgewerkte-final 4859
48
Above graphs show different kinds of the International Sunspot Number The left plot gives an overview from 1700 up to now from the yearly (black) and monthly smoothed Sunspot Number The graph in the right top corner shows the monthly and monthly smoothed sunspot number while the graph in the right bottom corner show the daily monthly smoothed monthly sunspot number For every the time range of investigation there is an appropriate sunspot number
832019 Ew Afgewerkte Final
httpslidepdfcomreaderfullew-afgewerkte-final 4959
49
Appendix XI Filaments and prominences
httpsohowwwnascomnasagovpickoftheweekold26feb2004
This is a picture taken by SOHO on 26 February 2004
832019 Ew Afgewerkte Final
httpslidepdfcomreaderfullew-afgewerkte-final 5059
50
Appendix XII The reconnection of magnetic loops
httpwwwioporgEJarticle0004-637X558287253575webpdfrequest-id=73e38daa-69ae-4e01-b9a6- b4bd0ba071dd
In (a) sunspot B and C have different polarity and move towards each other The twomagnetic loops will reconnect and form one big magnetic loop showed in (b) This will
happen to other magnetic loops too as can be seen in (c) When G en F are close enough they
will reconnect and so E en H will reconnect too It is possible that the magnetic field line is
trapped around another in this case AD The mass ejected from the sun will be trapped
between the magnetic field lines and form a solar prominence
832019 Ew Afgewerkte Final
httpslidepdfcomreaderfullew-afgewerkte-final 5159
832019 Ew Afgewerkte Final
httpslidepdfcomreaderfullew-afgewerkte-final 5259
52
httptheinvisibleagentwordpresscom20090117amazing-celestial-images
An group of active prominences
httpapodnasagovapodap051109html
httpwhassupinthemilkywayblogspotcom200903cloudy-planhtml
A picture taken by SOHO In the left corner you can see the prominence with twisted
magnetic field lines
832019 Ew Afgewerkte Final
httpslidepdfcomreaderfullew-afgewerkte-final 5359
53
Appendix XIV Polar crown
httpsciencenasagovheadlinesy200817sep_polarcrownhtm
Photograph of a polar crown taken on 13 June 1999 by the Meudon Observatory
832019 Ew Afgewerkte Final
httpslidepdfcomreaderfullew-afgewerkte-final 5459
54
Appendix XV Coronal holes
httpsunearthdaynasagov2007multimediagal_020php
The black segment is a huge coronal hole The bright parts are x-rays from sunspots
832019 Ew Afgewerkte Final
httpslidepdfcomreaderfullew-afgewerkte-final 5559
55
Appendix XVI Coronal mass ejection
httpzuserver2staruclacuk~idhapodap000309html
Picture of a CME taken by SOHO in February 2000
832019 Ew Afgewerkte Final
httpslidepdfcomreaderfullew-afgewerkte-final 5659
56
Bibliography
Books
BEATTY JK PETERSEN CC and CHAIKIN A The new solar system fourth edition
Cambridge University Press Cambridge 1999 421 p
COMINS NF and KAUFMANN III WJ Discovering the universe eighth edition WH
Freeman and Company New York 2008 535 p
DETHIER T Het zonnestelsel Standaard Uitgeverij 1992 415 p
GOLUB L and PASACHOFF JM Nearest star the surprising science of our sun Harvard
university press Harvard 2001 267 p
GREEN SF and JONES M H An introduction to the Sun and Stars The Open University
Cambridge 2004 373 p
HILL S and CARLOWITZ M The sun Abrams New York 2006 239 p
HOLMAN GD lsquoThe mysterious origins of solar flaresrsquo Scientific America April 2006 p
24-31 volume 294 number 4
JANSSENS J Zon en aarde een unieke relatie Garant Antwerpen 2003 254 p
KELLER H-U Van Supernovarsquos tot zwarte gaten Tirion Natuur AH Baarn 2003 169 p
LANG KR Sun earth and sky Springer Germany 1995 282 p
LILENSTEN J and BORNAREL J Sous les feux du soleil EDP Sciences Les Ulis Cedex
A 2001 247 p
832019 Ew Afgewerkte Final
httpslidepdfcomreaderfullew-afgewerkte-final 5759
57
Articles
CUYPERS J and others lsquoLa rechercheacute en heacuteliophysique en Belgiquersquo Space connection
October 2007 20 p
DE KEYSER J lsquoDe magnetopauzersquo Heelal maart 1998 p 66-73
JANSSENS J lsquoHet maximum van de 23ste zonnevlekkencyclus (I)rsquo Heelal Oktober 1998 p
256-263
JANSSENS J lsquohet maximum van de 23ste zonnenvlekkencyclus (II)rsquo Heelal November
1998 p 284-290
JANSSENS J lsquoZonnefakkelsrsquo Heelal Oktober 1994 p 256-261
SMITS F lsquoDe coronarsquo Heelal Februari 1999 p 40-42
SMITS F lsquoProtuberanzenrsquo Heelal Juli 1991 p 182-185
VAN DEN BERGHE S lsquoHet Zeemaneffectrsquo Heelal September 1998 p 228-231
832019 Ew Afgewerkte Final
httpslidepdfcomreaderfullew-afgewerkte-final 5859
58
Webography
BOEN B Birth of a coronal mass ejection Internet
(httpwwwnasagovmission_pagessolar-b solar_005html) 290408
BRAEUNIG R A Glossary Internet (httpwwwbraeunigusspaceglossaryhtm) 2006
CORDIS Researchers reveal why Suns atmosphere is hotter than its surface Internet
(httpcordiseuropaeusearchindexcfmfuseaction=newsdocumentampN_LANG=ENampN_R
CN=30598amppid=0ampq=87F36474805A6BEC0B89404F72D0351Famptype=sim) 20032009
DAY C Alfveacuten waves may heat the Sunrsquos corona Internet
(httpblogsphysicstodayorgupdate200903 alfven-waves-may-heat-the-sunshtml)
310309
ELLERMAN F Solar prominences Internet (httparticlesadsabsharvardedufull
1928ASPL173E 0000074000html) (03042009)
ENCYCLODPEDIA OF SCIENCE Corona hole Internet
(httpwwwdaviddarlinginfoencyclopediaC coronal_holehtml) (04042009)
HATHAWAY D H The sunspot cycle Internet
(httpspacesciencespacerefcomsslpadsolarsunspots htm) 04012000
JANSSENS J The case of the missing solar cycle (published in lsquoheelalrsquo January 2008)
Internet (httpuserstelenetbejjanssensMSCwebEngpdf)
KNISELY D Solar prominences Internet
(httpwwwicstarscomHTMLSolarSectionHAlphaOBSERVINGTHESUNHAlpha3html)
(03042009)
KOPANSKI J Atom Internet (httpknolgooglecomkjan-
kopanskiatom1amrwrct7rvi27) 060209
MARTENS PC and ZWAAN C Origin and evolution of filament-prominence systems
Internet (http wwwioporgEJarticle0004-637X558287253575webpdfrequest-
id=73e38daa-69ae-4e01-b9a6-b4bd0ba071dd) 092001
NASA The corona Internet (httpsolarsciencemsfcnasagovcoronashtml) 180107
NASA The heliosphere Internet (httpheliosgsfcnasagovheliosphhtml) 20012009
OFFICIAL SITE OF STONEHENGE About Stonehenge Internet
(httpwwwstonehengecouk) (03022009)
OTTERSDORF M Astronomy On the sunspot cycle Internet
(httpuserszoominternetnet~matto MCASsunspot_cyclehtmZeemaneffect) 031103
PARIAT E and SCHMIEDER B Magnetic flux emergence Internet(httpwwwscholarpediaorgarticleMagnetic_field_emergence) 18042008
832019 Ew Afgewerkte Final
httpslidepdfcomreaderfullew-afgewerkte-final 5959
59
PRIEST E R Dynamics and Structure of Quiescent Solar Prominences Internet
(httpbooksgooglebe booksid=h599q3jz1w4Campdq=quiescent+prominencesampprintsec=fro
ntcoverampsource=blampots=58b79Qeyabampsig=1eklQ-
WszOIebZZaq7fq7gm6bxAamphl=nlampei=urPtSe7ZCo61-
Qa166jHDwampsa=Xampoi=book_resultampct=result ampresnum=3PPA6M2) 1989
RUSSELL R Rotation of the sun Internet
(httpwwwwindowsucaredutourlink=sunSolar_interior
Sun_layersdifferential_rotationhtml) 16082005
RUSSELL R Sunspots and magnetic fields Internet
(httpwwwwindowsucaredutourlink=sunatmospheresunspot_magnetismhtmlampedu=hig
h) 060908
UNIVERSITY OF GLASGOW Bibliography of Peter Sweet Internet
(httpwwwuniversitystoryglaacuk biographyid=WH2144amptype=P) (10042009)
WIKIPEDIA Orbiting Solar Observatory Internet
(httpenwikipediaorgwikiOrbiting_Solar_Observatory) 24012009
WINDOWS TEAM Maunderrsquos Butterfly Diagram Internet
(httpwwwwindowsucaredutourlink=sun activitybutterflyhtml) 2000
832019 Ew Afgewerkte Final
httpslidepdfcomreaderfullew-afgewerkte-final 1059
10
Chapter 2 Observation of the sun
21 History
Men have been observing the sun from the very beginning We know that the sun was very
important for the prehistoric people many historical monuments testify this One of the mostfamous monuments is Stonehenge14 Men were constructing Stonehenge for centuries during
the Stone Age We cannot assume that ancient observers of the sun could predict solar
eclipses but they were able to build a construction that was adjusted to the rising of the sun
on special days such as Solstice Stonehenge is not the only example of the importance of
the sun over the years There is also Newgrange a well-known passage-tomb situated in
Ireland north of Dublin and many other monuments
In the beginning our sun was regarded as a God Nowadays we no longer see the sun as a
God or a natural force But still the sun is strongly influencing our lives It still provides us
with light and warmth and makes it possible to live on earth Many scientists have been
interested in the sun All of them wanted to know how the sun really functions
Letrsquos take a quick tour through the history of the observation of the sun Scientists of ancient
China made the first record of a solar eclipse in 2134 BC In the Middle Ages Galileo (1564-
1642) used the first telescope to map the sunspots he saw on the sunrsquos surface
Unfortunately he watched through his telescope without a special filter blinding himself On
April 2 1845 Louis Feacutezeau and Leacuteon Foucault had a world scoop they took the first
photograph of the sun clearly registrating the sunspots15
Years later the first satellites observing the sun called OSOrsquos (Orbiting Solar
Observatories)
16
have been launched into space to observe the 11-year-solar cycle between1962 and 197517 Many of them followed the most important satellites observing the sun are
described in appendix V Nowadays satellites keep an eye on the sun every second Still the
mystery of the sun and her magnetic field hasnrsquot been solved completely yet
22 Light18
221 Visible light
Light is a form of electromagnetic waves The light we see is actually only a small fraction of
all the light emitted in the universe A huge part of all the emitted light is not visible to our eyes Thatrsquos why men made telescopes especially designed to observe the light we canrsquot see
with our eyes
14 OFFICIAL SITE OF STONEHENGE About Stonehenge Internet (httpwwwstonehengecouk)(03022009)15
HILL S and CARLOWITZ M The sun Abrams New York 2006 p 82 83 9316
JANSSENS J Zon en aarde een unieke relatie Garant Antwerpen 2003 p 8917
WIKIPEDIA Orbiting Solar Observatory Internet (httpenwikipediaorgwikiOrbiting_Solar_Observatory)2401200918 COMINS NF and KAUFMANN III WJ Discovering the universe eighth edition WH Freeman and
Company New York 2008 chapter 4GREEN SF and JONES M H An introduction to the Sun and Stars The Open University Cambridge 2004 p 18-26
832019 Ew Afgewerkte Final
httpslidepdfcomreaderfullew-afgewerkte-final 1159
11
222 Composition of light
Light is composed of waves Different wavelengths represent different colours The colour of
the light depends on the wavelength λ Wavelength is measured in nanometre Visible light
has a range from 400 nanometre to 700 nanometre It consists of red orange yellow green
blue and violet Of all the visible light violet light has the shortest wavelength and red lightthe longest
223 Non-visible light
As previously mentioned visible light is not the only light in the universe There are many
more wavelengths Maxwell (1831-1879) discovered the infrared radiation This light has a
longer wavelength than red light This however is not visible to the human eye Apart from
infrared light much other not-visible light has been discovered Radio waves have the longest
wavelength of all We use them for example for our mobile phones Gamma rays have the
shortest wavelength of all We use gamma rays for cancer radiotherapy The other wavelengths of light are visible in appendix VI
23 Spectroscopy19
231 Introduction to spectroscopy
An interesting way of observing the sun is using spectroscopy We can distinguish 3
different types of spectra continuous spectrum absorption spectrum and emission spectrum
The last two are called line spectra This means we will not observe the spectrum of the
emitting body itself but we will use another medium in this case thin gas
232 Continuous spectrum
Continuous spectrum means we use the unbroken range of wavelengths to observe objects
emitting light We observe the light emitted by an object directly without using a medium
This method however isnrsquot used very often because itrsquos difficult to observe an object
directly
233 Line spectrum20
2331 Absorption spectrum
For the absorption spectrum we use absorption lines These lines are created by the thin gas
(which gas doesnrsquot matter but the absorption lines will be different then) The wavelengths of
the body we want to observe go through the tin gas but the atoms of the gas will absorb some
of the wavelengths Because those wavelengths are absorbed by the atoms of the gas the
19 GREEN SF and JONES M H An introduction to the Sun and Stars The Open University Cambridge
2004 p 20-2620COMINS NF and KAUFMANN III WJ Discovering the universe eighth edition WH Freeman and
Company New York 2008 p 109-113
832019 Ew Afgewerkte Final
httpslidepdfcomreaderfullew-afgewerkte-final 1259
12
wavelengths cannot appear in the absorption spectrum of the body we observe We can notice
in appendix VII the absence of some wavelengths by the black lines Such lines are called
absorption lines They correspond to the wavelengths that are absorbed by the gas
2332 Emission spectrum
We can also examine the light emitted by the gas The atoms of the gas absorb some
wavelengths emitted by the object we actually want to observe but afterwards they will emit
those wavelengths again as photons This gives us a number of bright lines called emission
lines For many gases the wavelengths of the absorption lines will be the same as those
from the emission lines
234 The Zeemaneffect 21
In 1896 Pieter Zeeman (1865-1943) discovered that some spectrum lines split up A spectrumline emitted in a magnetic field will split up into different spectrum lines close to each other
This is called the Zeemaneffect
If the magnetic field is strong enough and is parallel with the direction of observation the
absorption line splits up into two lines one on the left side of the normal absorption line
(which means a smaller wavelength) and one on the right side of the absorption line (which
means a higher wavelength) If there is a magnetic field straight on our direction of
observation the absorption line will even split up into three lines one line will represent the
normal absorption line the other two will be just like with a parallel magnetic field
Figure 3 The Zeemaneffect
httpchemteaminfoGalleryGallery16html
How does a magnetic field influence an electron We can find an explanation in the Quantum
theory The magnetic field will interact with the atoms so that the electrons will reach
slightly different energy levels Atoms with different energy levels will emit different
wavelengths This explains the multiple lines of the Zeemaneffect
The divergence of the splitting depends on the force of the magnetic field which means we
can determine the size of the magnetic field by observing the Zeemaneffect
21VAN DEN BERGHE S lsquoHet Zeemaneffectrsquo Heelal september 1998 p 228-231
KOPANSKI J Atom Internet (httpknolgooglecomkjan-kopanskiatom1amrwrct7rvi27) 060209
832019 Ew Afgewerkte Final
httpslidepdfcomreaderfullew-afgewerkte-final 1359
13
Chapter 3 The solar cycle
31 Introduction
In this chapter we will concentrate on the long term evolution of the global magnetic field of
the sun It is important to understand the long-term evolution of the global magnetic field of the sun because the global magnetic field has a great influence on the magnetic field on a
local scale The sunrsquos magnetic field changes every 11 years This is why we call it the 11-
year-solar cycle However strictly speaking it is a 22-year-cycle This will be explained later
on in this chapter The record of the first solar cycle started in 175522 Since then itrsquos
currently already the 24th solar cycle
32 Differential rotation
As well as the earth the sun rotates But the sun isnrsquot made of the same matter as our earth on
the surface The sunrsquos surface is made of plasma Because of the plasma the sun will rotateat different speeds depending on latitude At the equator the sun makes a full rotation every
25 days But the rotation will slow down when the latitude increases This means that at the
poles the sun will rotate much slower At the poles the rotation time is 36 days This creates a
gap of more than 10 days23
Astronomers believe that it is only the surface of the sun that undergoes differential rotation
The inner core moves more like a solid body such as the earth but it is still unclear if this is
the case24
33 When the years passhellip25
Differential rotation is the main cause of all the complex phenomena that will be discussed
later on because this differential rotation causes the solar cycle and magnetic disturbance
As mentioned previously before the sunrsquos surface rotates much faster at the equator than at
the poles the plasma around the equator will move faster This is shown in figure 4 on the
next page Since the sun keeps on rotating in the same direction the plasma at the equator will
move much faster26
The magnetic field that the sun normally would have is the same type as the magnetic field of the earth This means the sun normally has the magnetic field resembling to the magnetic field
of a bar magnet Magnetic field lines move from north to south and at the poles the density of
the magnetic field is compact because there the magnetic field lines come together
22 JANSSENS J The case of the missing solar cycle (published in lsquoheelalrsquo January 2008) Internet (httpusers
telenet be jjanssensMSCwebEngpdf)23
DETHIER T Het zonnestelsel Standaard Uitgeverij 1992 p 77-7824
RUSSELL R Rotation of the sun Internet (httpwwwwindowsucaredutourlink=sunSolar_interiorSun_layersdifferential_rotationhtml) 1608200525 CUYPERS J and others lsquoLa rechercheacute en heacuteliophysique en Belgiquersquo Space connection October 2007 p
6-726GREEN SF and JONES M H An introduction to the Sun and Stars The Open University Cambridge
2004 p 72-73
832019 Ew Afgewerkte Final
httpslidepdfcomreaderfullew-afgewerkte-final 1459
14
Figure 4 The magnetic field lines of the sun change because of the differential rotation
httpircameraasarizonaeduNatSci102lecturessunhtm
If we apply the differential rotation on this magnetic field the magnetic field lines under the
photosphere of the sun will move faster at the equator This will cause the following
structure seen on figure 4 on the sun in the middle The magnetic field lines will continue to
get mixed up and the magnetic field lines will pile up This process takes several years
Finally the magnetic field lines will be stacked almost parallel to the sunrsquos equator This is
the sun on the right side in figure 427 You can find a more specific drawing of this process in
appendix VIII
Eventually after approximately eleven years the magnetic field lines will be piled up in such
a way that finally the magnetic field lines will start to pop out of the sunrsquos surface This willcause sunspots Sunspots appear in pairs one with a south ldquopolerdquo and one with a north
ldquopolerdquo The north ldquopolerdquo contains magnetic field lines that are directed outwards and the south
ldquopolerdquo contains magnetic field lines that point inwards28 Sunspots are discussed in more
detail in the next chapter When the sunspots almost come to an end the loops will reconnect
with another sunspot over the equator This connection will cause a switch of the poles (see
figure 5) The South Pole will become the North Pole and vice versa This model is called the
magnetic dynamo proposed by Horace Babcock (1912-2003)29
27GREEN SF and JONES M H An introduction to the Sun and Stars The Open University Cambridge
2004 p 72-7328 LANG KR Sun earth and sky Springer Germany 1995 p 8229
COMINS NF and KAUFMANN III WJ Discovering the universe eighth edition WH Freeman andCompany New York 2008 p 297-298JANSSENS J lsquohet maximum van de 23ste zonnenvlekkencyclus (II)rsquo Heelal November 1998 p 284
832019 Ew Afgewerkte Final
httpslidepdfcomreaderfullew-afgewerkte-final 1559
15
Figure 5 The switching of the magnetic poles of the sun
GREEN SF and JONES M H An introduction to the Sun and Stars The Open University Cambridge 2004 p73
When finally the poles have switched and the magnetic field lines are disentangled the cycle
will just start over again for another eleven years Because the magnetic poles of the sun
switch every eleven years the cycle is called the 11-year-solar cycle
34 Other cycles
341 The 22-year-cycle
If we take the magnetic poles into account however the 11-year-cycle becomes a 22-year-
cycle because the magnetic poles switch If we want to consider the strict cycle which means
that we take the magnetic poles into account we have to call the solar cycle a 22-year-cycleIt takes eleven years to switch the magnetic North Pole into a South Pole and another eleven
years to switch them back This cycle is called the Hale-cycle named after George Ellery
Hale (1868-1938) who was an American solar astonomer and active in different
observatories30
342 The 27-day-cycle31
The 27-day-cycle taking the average of the sunrsquos rotation time is a cycle that is directly
connected to the rotation time of the sun The sunspots the coronal holes and other
phenomena that are related to the activity of the sun rotate too This means that the activity of the sun is connected to the rotation cycle For example the part of the sun that we can see will
be less active when the sunspots are not visible because the sunspots influence the solar
activity When the sunspots appear again the activity of the sun will rise This cycle is also
known because of the coronal holes that influence the solar wind
30JANSSENS J lsquohet maximum van de 23
stezonnenvlekkencyclus (II)rsquo Heelal November 1998 p 284-290
31 JANSSENS J Zon en aarde een unieke relatie Garant Antwerpen 2003 p 113
832019 Ew Afgewerkte Final
httpslidepdfcomreaderfullew-afgewerkte-final 1659
16
343 Other cycles
Astronomers believe that there must be some other cycles of an even longer basis Different
researchers have been looking for other solar cycles Some thought they found a 55-year
cycle However this cycle was very irregular Max Waldmeier (1912-2000 a very eminent
solar astronomer of the 20th
century) found a 90-year-cycle However lots of other cycleshave been ldquofoundrdquo There have been postulated a 2300-year-cycle too But the records of
solar cycles are too recent to prove this cycle 32
35 Solar maximum and minimum
The Royal Greenwich Observatory has been observing the sunspots since 1874 The
information of their observations includes the size the position and the number of sunspots
during all the recorded solar cycles If we put all this information into a graph we can see the
so-called butterfly-graph (appendix IX) With this information we can conclude that sunspots
do not appear at random33
At the beginning of a new solar cycle the first sunspots appear at latitude of 45 degrees Later
on sunspots will appear at the equator too When the sunspots begin to appear at 45 degrees a
new cycle has started again34 The solar minimum is the starting point of the solar cycle At
the beginning sunspots are very rare sometimes there are none If there are any sunspots they
will occur at higher latitudes The solar activity is the least on solar minimum Then it is a
good time for astronauts to go into space because there are less sunspots and less solar flares
and other phenomena that can influence the solar wind and so the space weather When the
solar activity is the highest the solar cycle reaches its maximum There will be a lot of
sunspots which now occur on lower latitudes too35 The time to go from a solar minimum to a
solar maximum is around four years During this time the solar activity will rise and when it
reaches its maximum it will slowly decline The decrease takes much more time than the
increase of the solar activity around 7 years The time between a solar minimum and
maximum and between a solar maximum and minimum can vary and is different for every
solar cycle36
36 Mysteries of the solar cycle
Astronomers have been able to find out a lot of details about the solar cycle However we are
still not able to predict the maximums and minimums of the solar cycles preciselyAstronomers havenrsquot been capable to draw up a model that allows us to predict the exact
number of sunspotshellip You can compare it to predictions for the weather to comehellip
32JANSSENS J Zon en aarde een unieke relatie Garant Antwerpen 2003 p 113-114
33HATHAWAY D H The sunspot cycle Internet (httpspacesciencespacerefcomsslpadsolarsunspots
htm) 0401200034 JANSSENS J Zon en aarde een unieke relatie Garant Antwerpen 2003 p 10335
WINDOWS TEAM Maunderrsquos Butterfly Diagram Internet (httpwwwwindowsucaredutourlink=sunactivitybutterflyhtml) 200036 JANSSENS J Zon en aarde een unieke relatie Garant Antwerpen 2003 p 99-100
832019 Ew Afgewerkte Final
httpslidepdfcomreaderfullew-afgewerkte-final 1759
17
Chapter 4 Phenomena caused by the magnetic field of the sun
41 Sunspots
411 What are sunspots
Sunspots appear on the sunrsquos surface when the magnetic field lines under the photosphere
are piled up too much and they finally pop out into the chromosphere Sunspots are normally
found in groups The number of sunspots is dependent on the solar activity when the solar
activity reaches its maximum there will be many more sunspots than at solar minimum
Measuring the magnetic field in sunspots with the Zeemaneffect makes clear that the
strength of the magnetic field is much stronger in sunspots than in the surrounding
photosphere Itrsquos more than thousand times stronger the magnetic field strength in magnetic
fields varies from 1000 to 4000 Gauss while the surrounding area circles around 1 Gauss
(comparison the earthrsquos magnetic field strength is about 05 Gauss)37
412 What do sunspots look like
When magnetic field lines pop out of the photosphere they will form magnetic loops (figure
6 on the right side) Between this magnetic loops there will be formed a flux tube The
magnetic field lines in the sunspot will distort the convection under the surface (see figure 6
on the left side) They will pull the plasma downwards and will prevent the warm plasma
from going upwards and reach the sunrsquos surface Eventually the temperature in the sunspot
will cool down38
Figure 6 Left side convection in sunspotsRight side magnetic field lines in sunspots
JANSSENS J Zon en aarde een unieke relatie Garant Antwerpen 2003 p41
37
RUSSELL R Sunspots and magnetic fields Internet (httpwwwwindowsucaredutourlink=sunatmospheresunspot_magnetismhtmlampedu=high) 06090838 JANSSENS J Zon en aarde een unieke relatie Garant Antwerpen 2003 p 40-41
832019 Ew Afgewerkte Final
httpslidepdfcomreaderfullew-afgewerkte-final 1859
18
We can distinguish 2 areas the black sunspot and the surrounding bright surface of the sun
The sunspot itself consists of the very dark centre called the umbra and the surrounding
orange-brown environment called the penumbra The penumbra consists of an amount of
small little striated f igures that come out of the umbra A sunspot can reach a diameter of
300 000 kilometres39 The temperature in the sunspots centre is much cooler than in the
photosphere because of the convection explained above It measures around 4 200 K whilethe photosphere has a temperature of 6000 K40
Figure 7 The composition of a sunspot
httpwwwjaxajparticlespecialastroshimizu02_ehtml
A sunspot appears black to our eyes However appearances are deceptive the dark sunspot
only seems dark because we see it against a much warmer environment If we h ad seen itagainst a black surface it would have been much brighter than the moonrsquos glowing41
The amount of sunspots varies from very few till over more than a hundred The amount of
sunspots can be predicted by the Wolf-numbers named after Johann R udolf Wolf (1816-
1893) a Swiss astronomer best known for his research on sunspots42 However I wonrsquot
explain this method in this paper You can find a briefly explanation in appendix X Yet this
method is only capable to predict the amount of sunspots approximately
42 Prominences
421 What is a prominence
The luminosity of the sun outshines lots of phenomena that take place on the surface of the
sun and even far away from the sun The sunrsquos corona is one example But luckily
prominences are quite visibly when we observe the sun A prominence is a huge cloud of gas
that is cooler than his environment It is trapped between two horizontal magnetic field lines
For human eyes it seems to spread out dark but this is only because a prominence has a much
39 LILENSTEN J and BORNAREL J Sous les feux du soleil EDP Sciences Les Ulis Cedex A 2001 p 3540 OTTERSDORF M Astronomy On the sunspot cycle Internet (httpuserszoominternetnet~matto
MCASsunspot_cyclehtmZeeman effect) 03110341JANSSENS J Zon en aarde een unieke relatie Garant Antwerpen 2003 p 41
42 JANSSENS J lsquoHet maximum van de 23ste zonnevlekkencyclus (I)rsquo Heelal October 1998 p 256-263
832019 Ew Afgewerkte Final
httpslidepdfcomreaderfullew-afgewerkte-final 1959
19
lower temperature then the sunrsquos chromosphere (similar to sunspots which spread out dark
too) The dark lines in appendix XI are also known as filaments A filament is a line between
to magnetic fields with opposite polarities (appendix XI)43
Figure 8 A solar prominence
httpcosmic-webcoukp=274more-274
422 What is a prominence made of
The gas from the prominence is coming from the chromosphere So the prominences have
approximately the same composition as the chromosphere A good way to observe
prominences is to use red Hα or blue Hβ spectrum lines Hα absorption lines indicate a
temperature lower than 10 000 Kelvin These spectrum lines justif y that the temperature of a prominence is remarkably lower than the temperature of the corona 44
423 How do prominences originate
A prominence is a result of the magnetic field Particles of the sun can transport warmth very
fast if they move alongside magnetic field lines If they want to move straight to a magnetic
field line the transport of warmth is negligible So prominences that are trapped between 2
magnetic fields only have one way to be heated This brings on a temperature that is notably
lower then the temperature in the corona45
The origin of prominences is similar to the origin of solar flares When two magnetic loops
of opposite polarity start to approach each other they will reconnect and form some new
loops This is shown in appendix XII Some mass from the sun will be trapped between the
new magnetic field lines and will form a solar prominence 46
43COMINS NF and KAUFMANN III WJ Discovering the universe eighth edition WH Freeman and
Company New York 2008 p 29944 SMITS F lsquoProtuberanzenrsquo Heelal Juli 1991 p 18345 LANG KR Sun earth and sky Springer Germany 1995 p 134-14046
MARTENS PC and ZWAAN C Origin and evolution of filament-prominence systems Internet ( httpwwwioporgEJarticle0004-637X558287253575webpdfrequest-id=73e38daa-69ae-4e01-b9a6- b4bd0ba071dd) 092001
832019 Ew Afgewerkte Final
httpslidepdfcomreaderfullew-afgewerkte-final 2059
20
424 What do prominences look like47
4241 Different groups of prominences
As you can see on the pictures in appendix XIII prominences can have different shapes and
forms Thatrsquos why astronomers classify them into different groups the quiescent prominences the active prominences and eruptive prominences
4242 Quiescent prominences
Quiescent prominences can appear everywhere on the sun and are not depending on latitude
They can reach into the corona over 2 500 till 40 000 kilometres Quiescent prominences last
the longest of all prominences Some of them even last several solar rotations long These
prominences are very long and not so wide During its lifetime a quiescent prominence moves
slowly to the poles When they are found at the poles of the sun they are called a lsquopolar
crownrsquo (appendix XIV)48
4243 Active prominences
Their name already suggests where they can be found active prominences are found in the
active regions of the sun moreover in the presence of sunspots These prominences
however only have a short lifespan only several hours But within this short lifespan they do
change form adjusting to the magnetic field lines within a short period of time Because
these prominences are located in active regions there are many more reconnections and so
the form will change more rapidly
4244 Eruptive prominences
These prominences only last a couple of minutes and are connected to active sunspots as well
It is possible that after one died out another immediately gives birth in the same region Other
eruptive prominences are known to be bubbles of gas that are issued from active sunspots
There have been some records of eruptive prominences that bump into other prominences and
push the other prominences back in the sunspot49
47 KNISELY D Solar prominences Internet (httpwwwicstarscomHTMLSolarSectionHAlpha OBSERVINGTHESUNHAlpha3html) (03042009)
SMITS F lsquoProtuberanzenrsquo Heelal Juli 1991 p 182-185
ELLERMAN F Solar prominences Internet (httparticlesadsabsharvardedufull 1928ASPL173E0000074000html) (03042009)48
KNISLEY D Solar prominences Internet (httpwwwicstarscomHTMLSolarSectionHAlphaOBSERVINGTHESUNHAlpha3html) (03042009)49 PRIEST E R Dynamics and Structure of Quiescent Solar Prominences Internet (httpbooksgooglebe
booksid=h599q3jz1w4Campdq=quiescent+prominencesampprintsec=frontcoverampsource=blampots=58b79Qeyabampsig=1eklQ-WszOIebZZaq7fq7gm6bxAamphl=nlampei=urPtSe7ZCo61-Qa166jHDwampsa=Xampoi=book_resultampct=resultampresnum=3PPA6M2) 1989
832019 Ew Afgewerkte Final
httpslidepdfcomreaderfullew-afgewerkte-final 2159
21
43 Coronal holes50
When looking at the sun with an x-ray telescope we can see dark regions across the sun
These dark regions are called coronal holes Coronal holes have an open magnetic field
structure This means that the magnetic fields lines do not angle downwards but they extend
into space indefinitely Due to this the particles of the sun are capable to reach out far intospace without any struggles against the magnetic field With this outflow of gases from the
sun coronal holes are one of the most important sources of the (high-speed) solar wind
(appendix XV)
44 Corona loops
441 What is a corona loop
If we look closer at a pair of sunspots we can see an emission of plasma alongside
magnetic field lines that originate in the sun spots A corona loop can extend into the coronaas the name suggests Those loops contain plasma that can reach a temperature higher than
106 Kelvin Corona loops can best be observed by ultra-violet and x-ray images because of
the high temperature The high temper ature brings on a high vibration of the atoms This
trembling causes the emission of x-rays51
Figure 9 A close up of corona loops
httpwwwdaviddarlinginfoencyclopediaCcoronal_loophtml
442 Where and when do corona loops originate
The magnetic field lines of sunspots move outwards from the sun into the corona and form
broad loops This makes it possible to trap hot gas with a temperature up to 40 million K
Those magnetic field loops trap hot plasma into the sunrsquos atmosphere The magnetic force
pushes particles around along the magnetic lines but at the same time the atoms circulate
around the magnetic field lines (see figure 10) The speed of their movements depends on the
50
ENCYCLODPEDIA OF SCIENCE Corona hole Internet (httpwwwdaviddarlinginfoencyclopediaC coronal_holehtml) (04042009)51 JANSSENS J Zon en aarde een unieke relatie Garant Antwerpen 2003 p 52-54
832019 Ew Afgewerkte Final
httpslidepdfcomreaderfullew-afgewerkte-final 2259
22
density of the magnetic field So if a particle moves from the top of a loop to the bottom it
will slow down just like in traffic jams Eventually it will reach the bottom but the bottom is
highly compressed (because the magnetic field lines converge at the bottom of the loops) so
that the particle will be shot back along the magnetic field line (see figure 10)
Figure 10 the movement of particles in corona loops
GD HOLMAN lsquoThe mysterious origins of solar flaresrsquo Scientific America April 2006 p24-29 volume 294number 4
Hence the particles will move up and down along the magnetic field lines Atoms that are
charged the same will cause electric currents (just like in a battery) These currents will
generate a new magnetic field and the old magnetic field in combination with the new one
will cause a high distortion in the magnetic field of the sun This is the moment when the
corona loop will transform into a solar flare
45 Solar flare52
451 What is a solar flare
A solar flare is a sudden powerful explosion in the solar atmosphere caused by a disruption
in the magnetic field of the sun Because of the disruption mass from the sun will be movedup and form a solar flare A solar flare can equal the energy of billions of atomic bombs
within a few minutes The strongest solar flares are measured during the solar maximums
because then the sunrsquos magnetic activity is the strongest53 Since the sunspots in the presence
of solar flare have a very high magnetic field it is likely that a solar flare would even have a
higher magnetic field But in reality the magnetic field of a solar flare is only half of the
magnetic field of a sunspot The intensity of the magnetic field is lsquoonlyrsquo 500 Gauss54
52 HOLMAN GD lsquoThe mysterious origins of solar flaresrsquo Scientific America April 2006 p 24-31 volume
294 number 453JANSSENS J Zon en aarde een unieke relatie Garant Antwerpen 2003 p 55-57
54 JANSSENS J lsquoZonnefakkelsrsquo Heelal Oktober 1994 p 256
832019 Ew Afgewerkte Final
httpslidepdfcomreaderfullew-afgewerkte-final 2359
23
Figure 11 You can see the magnetic fieldlines in the solar flare on the right side
Large solar flare recorded by SOHO EIT304 instrument 512x512 version Animation (980kMPEG) CourtesySOHO(ESAampNASA)
httpwwwteachersparadisecomencyenwikipediassusunhtml
452 Where and how do sun flares originate
Astronomers have long been speculating how solar flares exactly originate In 1992 Satoshi
Masuda (graduated at the University of Tokyo) discovered on pictures of the Japanese
Yohkoh Satellite that the far end of a solar flare emitted unusually short wavelengths very
short x-rays The source must be a concentration of gas with a temperature of about 100million K concluded Masuda But this discovery provoked some new questions why was the
high temperature at the top of the flare and not at the bottom where the gas is more compact
Why does the plasma stay confined instead of spreading out into the universe In order to
obtain more information to try to solve this problem astronomers started observing the sunrsquos
radiation of ultraviolet and x-rays frequently In 2002 NASA even launched the RHESSI
(Ramaty High Energy Solar Spectroscopic Imager) which was intended to bring solar flares
into pictures55
These observations provided evidence that sun flares surge up in regions where the magnetic
field is very strong ndashmost common in the presence of sun spots At this point we have to call
over the corona loops As mentioned before corona loops are electric currents of atoms
which move alongside magnetic field lines When the atoms are shot back alongside the
magnetic field line there seems to occur a distortion of the magnetic field This distortion will
end up in a solar flare All the mass of the corona loop will be shot into space and form a solar
flare
But how can such enormous mass of the solar flares be shot into s pace This has been a very
interesting question However Peter Alan Sweet (1921-2005)56 succeeded in finding an
55 GD HOLMAN lsquoThe mysterious origins of solar flaresrsquo Scientific America April 2006 p 27 volume 294
number 456UNIVERSITY OF GLASGOW Bibliography of Peter Sweet Internet (httpwwwuniversitystoryglaacuk
biographyid=WH2144amptype=P) (10042009)
832019 Ew Afgewerkte Final
httpslidepdfcomreaderfullew-afgewerkte-final 2459
24
answer already in 1956 If magnetic field lines break apart and then reconnect they bring
together two opposing fields that will cancel each other and cause a huge burst of energy The
reconnection will create new magnetic field lines This reconnection is called the Sweet-
Parker reconnection Yet this is a slow reconnection which cannot take place at the base of a
solar flare with a dazzling speed Fortunately Harry P Petschek published an article about
reconnection in 1964 and solved that problem under certain circumstances it is possible toreconnect much faster which explains solar flares This faster reconnection is also called the
Petschek reconnection But unfortunately with the current technology it is not yet possible to
take pictures of those reconnections57
If the energy comes from the reconnection then where does this reconnection take place
From pictures of solar flares astronomers discovered that at the top of the corona loop a
mysterious x-ray source was found The x-ray source began to give a higher energy level and
at the same time the particles move down towards the sunrsquos surface Yet the x-ray source
stays at the same placehellipThen when the x-rays reach their maximum the loop suddenly
changes direction But this time the x-ray source will move upwards too unexpectedly it
moves at the speed of light approximately three hundred thousands kilometres an hour awayfrom the sun This is the same speed as the coronal mass ejections
46 Coronal mass ejections
461 What is a coronal mass ejection58
Coronal mass ejections (CMErsquos) (appendix XVI) are huge amounts of gas some billions of
plasma from the sun that are ejected into space Their temperature can reach 25 million K59
A coronal mass ejection can last for several hours and it can at last enter the solar wind A
CME can reach a speed of 50kms- 2000kms which means more than 7 million kilometres
an hour60 The mass of a large CME varies from 5 x 10⁶ to 5 x 10¹³ kg61 During a solar
maximum there are more coronal mass ejections than during a minimum but they can occur
at any time of the solar cycle Coronal mass ejections are related both to solar flares and
prominences Very heavy coronal mass ejections can cause some geomagnetic storms on
earth
462 Reconnection
The reconnection of a solar flare can end up in a coronal mass ejection When magneticfield lines that are opposite are starting to reconnect and form new magnetic field lines half of
the magnetic field lines will point downwards and join some existing magnetic loops
However the other part of the magnetic field lines will move upwards at a very high speed
and will form some loops more upwards Between those loops that moved downwards and
those that moved upwards there is some mass that isnrsquot connected to the sun anymore It is
57GD HOLMAN lsquoThe mysterious origins of solar flaresrsquo Scientific America April 2006 p 29 volume 294
number 458
BRAEUNIG R A Glossary Internet (httpwwwbraeunigusspaceglossaryhtm) 200659 LILENSTEN J and BORNAREL J Sous les feux du soleil EDP Sciences Les Ulis Cedex A 2001 p 4460 Cuypers J and others lsquoLa rechercheacute en heacuteliophysique en Belgiquersquo Space connection October 2007 p 10-
1161GREEN SF and JONES M H An introduction to the Sun and Stars The Open University Cambridge
2004 p 68
832019 Ew Afgewerkte Final
httpslidepdfcomreaderfullew-afgewerkte-final 2559
25
known that for an amount of solar flares that this mass between the loops will end up in a
coronal mass ejection Yet this doesnrsquot count for all the solar flares The coronal mass
ejection only takes place if the magnetic field lines twist around each other while forming the
letter lsquoSrsquo (see figure 12)62
Figure 12 Here you can see the reconnection that takes place before the coronal mass ejection starts
httpwwwnasagovmission_pagessolar-bsolar_005html
Certainly we will be capable to answer all the questions about solar flares and coronal mass
ejections in the nearby future But there are also some very interesting questions left what is
at the basis of the acceleration of the atoms in solar flares How does magnetic reconnection
originate Hopefully we will find the answers in the near future
47 Solar wind
471 What is the solar wind
Every second of every day of the year the sunrsquos corona emits a continuous stream of mass
from the sun The temperature of the corona is so high that the sunrsquos magnetic field just
cannot control the outflow of particles We know that the particles are accelerated but
astronomers cannot explain all the details about the solar wind yet
472 What do we know about the solar wind
The speed of the solar wind can change it differs from 300kmh up to 800kmh This speed
depends on the outflow of gases If there is a corona hole pointing towards the earth the solar
wind will reach a speed of around 800kmh The different speeds can interact with each other
and form a new speed according to the rules of light emission When two emissions connect
with each other they can form a faster or slower solar wind just like waves can interact and
form new waves
62BOEN B Birth of a coronal mass ejection Internet (httpwwwnasagovmission_pagessolar-b
solar_005html) 290408
832019 Ew Afgewerkte Final
httpslidepdfcomreaderfullew-afgewerkte-final 2659
26
The ionized atoms with very high temperature coming from the sunrsquos corona are one of the
most important parts of the solar wind but the magnetic fields are important too The
magnetic field outside the sun gets wrapped into a spiral called the Parker-spiral named after
the scientist who described it as the first one (because the sun rotates) This influences the
magnetic field of the sun from the outside The solar wind is emitted in spiral too (see figure
13)
Figure 13 The course of the solar wind caused by the rotation of the sun
httpheliosgsfcnasagovsolarmaghtml
473 Heliosphere
We can describe the heliosphere as a gigantic magnetic bubble around the sun This is
everywhere in space till where the sunrsquos magnetic field reaches and still has an influence The
heliosphere is filled with solar wind although the solar wind has a very low density Yet it
is a very hot wind but because of the very low density it does not have such a great influence
on earth However it can cause some energetic storms on earth63
63 NASA The heliosphere Internet (httpheliosgsfcnasagovheliosphhtml) 20012009
832019 Ew Afgewerkte Final
httpslidepdfcomreaderfullew-afgewerkte-final 2759
27
Conclusion
The sunrsquos magnetic field is a complex system to understand Yet I hope you have learned a
lot from this paper and that you do understand the exiting phenomena described in the
previous chapters
We can discuss the sunrsquos magnetic field from two perspectives The first one is looking at the
magnetic field for global long-term changing dimensions The second way is based on
phenomena on lower scale
The global changes involve the solar cycle and the switch of the magnetic poles The solar
cycle is divided into a decrease of the solar activity until it reaches solar minimum and an
increase of the solar activity until it reaches solar maximum The frequency of the phenomena
that can be found in the outer layers of the sun are directly connected to the solar activity and
thus to the solar cycle Sunspots are the easiest to see they appear as black spots against the
much brighter surface of the sun Corona loops are connected to sunspots and can extend into
solar flares and solar prominences These flares and prominences can burst out into a coronalmass ejection All these phenomena influence the sun and its solar wind how small their part
may be The solar wind has a directly influence on the earth
There is still much to be discovered Astronomers hope to discover much more about the
magnetic field of the sun Today many astronomers and scientists are observing the sun and
every day they discover more and more aspects of the sun Recently a group of researchers
led by David Jess of Queens University Belfast has revealed why the sunrsquos atmosphere is
hotter than its surface64 As you can see astronomy is a very developing science
64
CORDIS Researchers reveal why Suns atmosphere is hotter than its surface Internet (httpcordiseuropaeusearchindexcfmfuseaction=newsdocumentampN_LANG=ENampN_RCN=30598amppid=0ampq=87F36474805A6BEC0B89404F72D0351Famptype=sim) 20032009
832019 Ew Afgewerkte Final
httpslidepdfcomreaderfullew-afgewerkte-final 2859
28
Glossary
Absorption lines A dark line superimposed on a continuous spectrum when a gas absorbs
light from a continuous source that is hotter than the absorbing gas
Aurora Light radiated by atoms and ions formed by the solar wind in the earthrsquos upper atmosphere seen most commonly in the polar regions
Chromosphere The layer in the solar atmosphere between the photosphere and the corona It
is the lowest layer of the atmosphere characterized by reddish hue and by an increase of the
temperature with altitude through all but its lower regions
Convection The transfer of heat from a region of high temperature to a region of lower
temperature by the displacement of the cooler molecules by the warmer molecules The hot
gas will be moved upwards the cool gas will be pushed downwards into the sun
Corona The sunrsquos outer atmosphere It is very extensive and has a very low density It isextremely hot
Coronal hole A dark region of the sunrsquos inner corona as seen at X-ray wavelengths
Coronal loop Closed loops of magnetic field lines extending from the sunrsquos photosphere into
the corona which contain plasma at high temperature They are typically observed through
ultraviolet or x-ray emission from the hot plasma
Coronal mass ejection Large volumes of high energy gas released from the sunrsquos corona
Differential rotation The rotation of a non rigid object in which parts at different latitudes or
different radial distances move at different speeds
Dynamo theory The generation of a magnetic field by circulating electric charges
Eclipse The blocking of a part or all of the light from the moon by the earth (lunar eclipse) or
from the sun by the moon (solar eclipse)
Emission lines Emission lines are used in physics chemistry and astronomy to determine
what kind of gas is doing the emission Every element has a different electronic structure and
will thus have a different emission line fingerprint Emission lines are produced whenelectrons in atoms jump from one energy level to lower energy level
Filament A dark curve seen above the sunrsquos photosphere that is the top view of a solar
prominence
Flux tube Is a generally tube-like (cylindrical) region of space containing a magnetic field
such that the field at the side surfaces is parallel to them Both the cross-sectional area of the
tube and the field contained may vary along the length of the tube but the magnetic flux is
always constant
832019 Ew Afgewerkte Final
httpslidepdfcomreaderfullew-afgewerkte-final 2959
29
Geomagnetic storm When unusually strong surges of solar wind (charged particles from the
Sun) hit the Earth This effect causes variations in the magnetic field which surrounds the
Earth The visible results are eg the aurora (Northern and Southern lights)
Granulation Granules are related to the convective zone The granulation that shows up in the
photosphere is a result of the rising and falling of hot gas that takes place in the convectivezone
Hα absorption line An absorption line due to an electronic transition in hydrogen atoms in
which the atom absorbs a photon so that the electron makes a transition from a state
corresponding to the electronic energy level with n=2 to the one above with n=3 The photon
wavelength in a vacuum is 6563 nm
Heliosphere The volume of space within which the sun through the solar wind influences its
environment in the interstellar medium
Magnetic dynamo A theory that explains phenomena of the solar cycle as a result of periodicwinding and unwinding of the sunrsquos magnetic field in the solar atmosphere
Magnetic reconnection A process taking place in a plasma in which neighbouring
oppositely directed magnetic field lines suddenly part and reconnect in a new configuration
The abrupt change in a magnetic field represented by this process can release large amounts
of energy and it is thought to be important in explaining solar flares and other phenomena
Penumbra The portion of a shadow in which only part of the light source is covered by the
shadow-making body
Photosphere The region in the solar atmosphere from which most of the visible light escapes
into space
Plasma A fourth state of matter (not found naturally on Earth) of very hot gases Plasma is a
fluid with the ability to carry electric currents with no local accumulations of electric charge
Prominence Flamelike protrusion seen near the limb of the sun and extending into the solar
corona The side view of a filament
Quantum theory A theory in physics based on the principle that matter and energy have the
properties of both particles and waves created to explain the radiation of energy from a blackbody the photoelectric effect and the Bohr theory and now used to account for a wide
range of physical phenomena including the existence of discrete packets of energy and
matter the uncertainty principle and the exclusion principle Itrsquos a theory of the interaction of
matter and radiation developed early in the twentieth century which is based on the
quantization of energy and applied to a wide variety of processes that involve an exchange of
energy at the atomic level
Reconnection See magnetic reconnection
Solar cycle A 22-year-cycle during which the sunrsquos magnetic field reverses its polarity twice
Solar flare A violent eruption on the sunrsquos surface
832019 Ew Afgewerkte Final
httpslidepdfcomreaderfullew-afgewerkte-final 3059
30
Solar wind An outward flow of particles (mostly electrons and protons) from the sun
Solstice Either of two points along the ecliptic at which the Sun reaches its maximum
distance north or south of the celestial equator
Spectroscopy Concerns the production and study of spectra
Spectrum The result of electromagnetic radiation passing through a prism or grating so that
different wavelengths are separated
Spicule Short-lived (lifetime from rising to falling is about 15 minutes) jets vertical to the
solar surface that are several thousand kilometres long and about 1 kilometre thick (see also
appendix IV) in the solar chromosphere
Sunspot A temporary cool region in the solar photosphere created by protruding magnetic
fields
Umbra The central completely dark portion of a shadow
Zeemaneffect A splitting of spectra lines in the presence of a magnetic field
Bibliography and webography of the glossary
COMINS NF and KAUFMANN III WJ Discovering the universe eighth edition WH
Freeman and Company New York 2008 535 p
GREEN SF and JONES M H An introduction to the Sun and Stars The Open University
Cambridge 2004 373 p
httpenmimihuastronomygranulationhtml
httpenmimihuastronomyplasmahtml
httpwwwspacecomspacewatchspace_weather_glossaryhtml
httpenmimihuastronomyemission_linehtml
httpenmimihuastronomyabsorption_linehtml
httpwwwpbsorgfaithandreasonphysglossqm-bodyhtml
httpwwwanswerscomtopicquantum-theory
httpenwikipediaorgwikiFlux_tube
832019 Ew Afgewerkte Final
httpslidepdfcomreaderfullew-afgewerkte-final 3159
31
Appendix I The sun in figures
Physical quantity Comment
Radius 695 510 km 109 x earths radius
Mass 1989 x1030 kg 332 946 earths mass
Mass sun in the solar
system
9986 Total mass sun total mass of
our solar system
Volume 1412 x10sup3sup3 cmsup3 13 million x earths volume
Age 455 milliard years
Luminosity 3854 x 10sup3sup3 ergss
Magnitude -2773
Density center 1513 gcmsup3
Density mean 1409 gcmsup3
Pressure center 2334 x1011 bars
Pressure photosphere 00001 bar
Temperature center 15 557 000deg K
Temperature photosphere 5 780deg K Various sources mention
different grades
Temperature corona 2 000 000 to 3 000 000deg K
Rotation time at North or
South pole
up to 35 days on earth
Rotation time at Equator 25 days on earth The difference in rotation
times is called differential
rotation
Rotation time general 2538 days on earth
Mean distance sun-earth
(AU)
14959787 x108 km 1 AU = 1 Astronomical Unit
= 149 598 000 km
Chemical composition of
the sun ( of total number
of atoms)
Hydrogen 921
Helium 78
All others 01
Various sources mention
slightly different percentages
832019 Ew Afgewerkte Final
httpslidepdfcomreaderfullew-afgewerkte-final 3259
32
Chemical composition of
the sun ( of total mass)
Hydrogen 7346
Helium 2485
All others 169
Various sources mention
slightly different percentages
Total transforming of
hydrogen into helium persecond
700 billions of kilograms of
hydrogen are transformedinto 6957 billions of
kilograms of helium each
second
Based on the following references
- BEATTY JK PETERSEN CC and CHAIKIN A The new solar system fourth edition
Cambridge University Press Cambridge 1999 p 421
- LILENSTEN J and BORNAREL J Sous les feux du soleil EDP Sciences Les Ulis
Cedex A 2001 p 247
- LANG KR Sun earth and sky Springer Germany 1995 p 282- DENTHIER T Het zonnestelsel Standaard Uitgeverij 1992 p 415
- JANSSENS J Zon en aarde een unieke relatie Garant Antwerpen 2003 p 254- VOLKSSTERRENWACHT URANIA VZW De zon Internet(httpwwwuraniabesterrenkundezonnestelselzonphp) (01012009)
832019 Ew Afgewerkte Final
httpslidepdfcomreaderfullew-afgewerkte-final 3359
33
Appendix II Anatomy of the sun
httpwwwcosmographicacomgalleryinfographicssolar_anatomyhtml
The middle the sun consists of a heavy core this consists of plasma just as the outer layers
of the sun but the pressure in the core is so high that it behaves much more like a solid bodyThe most outer layer is the corona it reaches far into space More to the inside there is the
chromosphere and then the photosphere The corona the chromosphere and the
photosphere are explained in chapter 1
832019 Ew Afgewerkte Final
httpslidepdfcomreaderfullew-afgewerkte-final 3459
34
Appendix III Granulation
httpwwwwindowsucaredutourlink=sunSolar_interiorsolar_furnacehtml
At the surface of the sun we can find granules These are created by convection the warmest
parts of the sunrsquos interior move upwards and the colder parts at the surface move downwardsThis causes currents of plasma The dark lines are the colder particles We see them darker
because they emit less light than their surrounding neighbourhood
832019 Ew Afgewerkte Final
httpslidepdfcomreaderfullew-afgewerkte-final 3559
35
Appendix IV Spicules
Picture httplpc1clpccdcccauslpcharpellastro20a20deinfo_s09htmInformation httpwwwdaviddarlinginfoencyclopediaSspiculehtml
On this picture you can see spicules Spicules only last for several minutes and can be foundin the chromosphere They are little jets of gas There also exist macrospicules that can be
approximately ten times larger than a normal spicule
832019 Ew Afgewerkte Final
httpslidepdfcomreaderfullew-afgewerkte-final 3659
36
Appendix V The most important satellites observing the sun
Here you can find the most important satellites observing the sun and their missions
Solar and Heliospheric Obseratory (SOHO)
httpsohowwwnascomnasagovaboutabouthtml
SOHO the Solar amp Heliospheric Observatory is a project of international collaboration
between ESA and NASA to study the Sun from its deep core to the outer corona and the solar
wind
SOHO was launched on December 2 1995 The SOHO spacecraft was built in Europe by an
industry team led by prime contractor Matra Marconi Space (now EADS Astrium) under
overall management by ESA The twelve instruments on board SOHO were provided by
European and American scientists Nine of the international instrument consortia are led by
European Principal Investigators (PIs) three by PIs from the US Large engineering teamsand more than 200 co-investigators from many institutions supported the PIs in the
development of the instruments and in the preparation of their operations and data analysis
NASA was responsible for the launch and is now responsible for mission operations Large
radio dishes around the world which form NASAs Deep Space Network are used for data
downlink and commanding Mission control is based at Goddard Space Flight Center in
Maryland
More information about SOHO can be found on
httpsohowwwnascomnasagovaboutdocsSOHO_Fact_Sheetpdf
832019 Ew Afgewerkte Final
httpslidepdfcomreaderfullew-afgewerkte-final 3759
37
Transition Region and Coronal Explorer (TRACE)
httptracelmsalcomProjectMissionmissionhtm
TRACE enables solar physicists to study the connections between fine-scale magnetic fields
and the associated plasma structures on the Sun in a quantitative way by observing the photosphere the transition region and the corona With TRACE these temperature domains
are observed nearly simultaneously (with as little delay as only a second between different
wavelengths) with a spatial resolution of one second of arc
This is accomplished by obtaining precisely coaligned image sequences of photosphere
transition region and corona with high spatial resolution and uninterrupted viewing of the
Sun for up to eight months
TRACE Mission
TRACE explores the magnetic field in the solar atmosphere by studyingbull The 3-dimensional field structure
bull Its temporal evolution in response to photospheric flows
bull The time-dependent coronal fine structure
bull The coronal and transition region thermal topology
TRACE was launched on a Pegasus launch vehicle from Vandenberg Air Force Base in April
1998 The launch was scheduled to allow joint observations with SOHO during the rising
phase of the solar cycle to sunspot maximum No transition region or coronal imager has
witnessed the onset and rise of a solar cycle
Pegasus in flight
The two satellites provide complementary observations TRACE produces the high spatial
and temporal resolution images while SoHO yields images and spectral data out to 30 solar
radii at much lower spatial and temporal resolution Jointly they provide the opportunity to
obtain simultaneous digital measurements of all the temperature regimes of the solar
atmosphere in both high-resolution imaging and spectroscopy
With these data we expect to shatter the current ignorance of coronal heating and impulsive
MHD phenomena with benefits not only to solar physics but also to studies ranging from
stellar activity to the MHD of accretion disks The magnetograms produced by MDI on SoHO
provide a complete record of the eruption and distribution of photosphere magnetic fields
which will be invaluable for understanding TRACE observations of coronal hole formation
and coronal mass ejections Both of these phenomena have profound effects on our space
environment and the Earth`s magnetic field
TRACE is the first US solar research satellite since the Solar Maximum Mission
Coordination with SOHO provides an unprecedented opportunity to follow the emergence of
magnetic flux from the base of the convection zone deep inside the Sun through the
photosphere chromosphere and transitional region to the low-beta outer corona while
observing the effects of this emergence such as coronal mass ejections with high spatial andtemporal resolution
832019 Ew Afgewerkte Final
httpslidepdfcomreaderfullew-afgewerkte-final 3859
38
The transition from the photosphere where magnetic fields and plasma are in rough
equipartition to the corona where magnetic fields dominate is extremely difficult to model
and until recently to observe at high temporal and spatial resolution Many of the physical
problems that arise here such as plasma confinement reconnection wave propagation and plasma heating arise throughout space physics and astrophysics The detailed study of these
processed in the solar outer atmosphere is invaluable to astrophysics in general and stellar
studies in particular
More information about TRACE observations can be found on
httptracelmsalcomOperationsGeneraloperatiohtm
832019 Ew Afgewerkte Final
httpslidepdfcomreaderfullew-afgewerkte-final 3959
39
Reuven Ramaty High Energy Solar Spectroscopic Imager (RHESSI)
httphesperiagsfcnasagovhessibrochurehtm
What Questions will HESSI Address
bull How is such a large amount of energy released so rapidly during a flare
bull How are so many electrons and protons accelerated so quickly to such high energies
bull Where are the electrons and protons accelerated in the solar atmosphere and where do
they deposit their energy
How will HESSI Address these Questions
HESSI shown below will concentrate on electrons and protons accelerated in solar flares
through observations of the X-rays and gamma rays that they produce
bull HESSI will obtain the first ever X-ray and gamma-ray images of flares from 100 keV
to 20 MeVbull HESSI will do the first ever nuclear gamma-ray line spectroscopy of solar flares
bull HESSI will obtain pictures of flares in X-rays with an angular resolution of 2
arcseconds a factor of three better than previously possible
bull HESSI will measure X-ray and gamma-ray spectra with less than 1 keV energy
resolution a factor of 20-40 better than previously possible with scintillation counters
More information about the RHESSIrsquos Mission can be found on
httphesperiagsfcnasagovhessiconcepthtm
832019 Ew Afgewerkte Final
httpslidepdfcomreaderfullew-afgewerkte-final 4059
40
Solar Radiation and Climate Experiment (SORCE)
httplaspcoloradoedusorcesciencebackgroundhtm
The Solar Radiation and Climate Experiment (SORCE) is a NASA-sponsored satellite
mission that is providing state-of-the-art measurements of incoming x-ray ultraviolet visiblenear-infrared and total solar radiation The measurements provided by SORCE specifically
address long-term climate change natural variability and enhanced climate prediction and
atmospheric ozone and UV-B radiation These measurements are critical to studies of the Sun
its effect on our Earth system and its influence on humankind
The SORCE spacecraft was launched on January 25 2003 on a Pegasus XL launch vehicle to
provide NASAs Earth Science Enterprise (ESE) with precise measurements of solar
radiation It launched into a 645 km 40 degree orbit and is operated by the Laboratory for
Atmospheric and Space Physics (LASP) at the University of Colorado (CU) in Boulder
Colorado USA It will continue the precise measurements of total solar irradiance (TSI) that
began with the ERB instrument in 1979 and has continued to the present with the ACRIM series of measurements SORCE will also provide the measurements of the solar spectral
irradiance from 1nm to 2000nm accounting for 95 of the spectral contribution to TSI
SORCE carries four instruments including the Spectral Irradiance Monitor (SIM) Solar
Stellar Irradiance Comparison Experiment (SOLSTICE) Total Irradiance Monitor (TIM) and
the XUV Photometer System (XPS)
The primary goal of the NASA Earth Observing Systems (EOS) SOlar Radiation and Climate
Experiment (SORCE) is to enable solar-terrestrial studies by providing precise daily
measurements of the total solar irradiance (TSI) and the solar spectral irradiance atwavelengths extending from the ultraviolet to the near infrared The following lists the
SORCE science objectives
1 Make accurate measurements with high precision of total solar irradiance connect
them to previous TSI measurements and continue this long-term climate record
Provide TSI with an accuracy of 001 (100 parts per million) based on SI units and
with a long-term repeatability of 0001yr
2 Make daily measurements of the solar ultraviolet irradiance from 120 to 300 nm with
a spectral resolution of 1 nm Achieve this spectral irradiance measurement with an
accuracy of better than 5 and with a long-term repeatability of 05yr Use the
solarstellar comparison technique to relate the solar irradiance to the ensembleaverage flux from a number of bright early-type stars (same stars used by the UARS
SOLSTICE program)
3 Make the first measurements of the visible and near IR solar irradiance with sufficient
precision for future climate studies Obtain daily measurements of solar spectral
irradiance between 03 and 2 microm with a spectral resolution of at least 130 an
accuracy of 003 and a long-term repeatability of better than 001yr
4 Improve the understanding of how and why solar irradiance varies estimate past and
future solar behavior and investigate climate responses
More information about SORCE can be found on
httplaspcoloradoedusorcesciencescience_opshtm
832019 Ew Afgewerkte Final
httpslidepdfcomreaderfullew-afgewerkte-final 4159
41
Appendix VI Wavelengths
httpeosweblarcnasagovEDDOCSWavelengths_for_Colorshtml
As you can see on the figure visible light situates in the centre of the wavelengths having not
the shortest nor the longest wavelengths Gamma rays have the shortest wavelength radioways the longest All sort of wavelengths are used for daily purpose like radio waves for
radio and TV and gamma rays for treatments
832019 Ew Afgewerkte Final
httpslidepdfcomreaderfullew-afgewerkte-final 4259
42
Appendix VII Absorption lines in the sunrsquos spectrum
Picture httpwwwsolarnavigatornetthe_sunhtmExplanation COMINS NF and KAUFMANN III WJ Discovering the universe eighth edition WHFreeman and Company New York 2008 p 109
This photo is called a spectrogram It contains the spectrum of the sun All the black lines are
absorption lines The amount of black lines is related to the amount of elements that the sun
is emitting From a spectrogram we can deduct a lot of things including their mass the
temperature of the surface the chemical composition of the sun rotation rates and much
more
832019 Ew Afgewerkte Final
httpslidepdfcomreaderfullew-afgewerkte-final 4359
832019 Ew Afgewerkte Final
httpslidepdfcomreaderfullew-afgewerkte-final 4459
44
Appendix IX Butterfly-diagram
httpspacesciencespacerefcomsslpadsolarimagesbflygif
A butterfly-diagram
In a butterfly-diagram we can find the sunspots with their latitude (y-axis) through the years(x-axis) As you can see the sunspots appear like lsquobutterfliesrsquo this was discovered in 1904 by
Edward Maunder (1851-1928 an English astronomer best remembered for his study of
sunspots and the solar magnetic cycle) Thatrsquos why this graph is also called Maunders
butterfly diagram
832019 Ew Afgewerkte Final
httpslidepdfcomreaderfullew-afgewerkte-final 4559
45
Appendix X The Wolf-numbers
httpsidcomabenews106sunspotnumberclarifiedpdf
The sunspot number clarified By Petra Vanlommel
Which kinds of daily International Sunspot Numbers (ISN) are currentlypublished by the SIDC
Three daily indices are currently published by the SIDCthe Estimated ISN (EISN)the Provisional ISN (PISN)the Definitive ISN (DISN)Although they are all based on the same type of observations ie visual sunspot counts as ameasure of solar activity they are obtained from different data sets by different processingmethods with different accuracies and they serve different purposes
In the ideal case the three numbers are equal but in practice it is inevitable that there aresmall differences Therefore It is useful to explain what each index actually means
What is the source of the Wolf number
Once per day observers worldwide communicate their measured Wolf number (= 10G + S)based on visual sunspot (S) and group (G) counts to the World Data Center for the SunspotIndex Presently this is done through a dedicated password-protected WEB form the Wolfinterface However some observers still use the old way of reporting their observations onpaper through regular mail This method slows down the final processing but for the sake ofcontinuity in the index it is important to keep these observers included as some of them
represent the longest individual datasetsThe observers give the exact observing time the observing conditions the total numbers(group count sunspot count and Wolf number) and optionally the NorthSouth and centralzone numbers The observers using the web interface can provide their results to the SIDCimmediately after each observation However some users prefer to insert their data as ablock creating some delay but this must be done at least once a month
The personal reduction coefficient K
A personal reduction coefficient K is calculated for each station It has values typically in therange 04 and 17 and leads to a normalized sunspot number K(10G+S) In other words theK factor rescales the raw sunspot counts of each observer to the ones of Rudolph Wolf the
astronomer who introduced the above Wolf formula thus simulating the same eyes sametelescope and same conditionsDuring the procedure for calculating the Provisional ISN the K factor of every station iscomputed for every observation that passes the elimination procedure Once a year apersonal K factor for every station and for every month of the previous year is calculated Ayearly mean K value per station is also computed
The estimated sunspot index
The Estimated ISN (EISN) is calculated and issued on a daily basis for the day of calculationand the day before Only the total EISN is calculated with no hemispheric index It is anautomated procedure and no manual intervention is done The EISN is meant as a quicktemporary and approximate index for real-time applications
832019 Ew Afgewerkte Final
httpslidepdfcomreaderfullew-afgewerkte-final 4659
46
We use the raw Wolf number from all observatories that have provided counts early in theday ie before 1230 UT Typically there is between 10 and 20 stations available Thecalculation of the EISN is based on a simple and straightforward statistical method The Wolfnumbers are multiplied with the yearly mean K factor (see paragraph about the personalreduction coefficient K) The EISN is a simple average of the K-scaled values after excludingany individual value that deviates abnormally from the other valuesOnce the Provisional ISN (PISN) is calculated after the end of a month the temporary EISNis dropped and replaced by the PISN
The provisional sunspot Index
The Provisional ISN (PISN) is calculated and issued on the first of every month Theoutcome is a daily total and hemispheric sunspot number for the entire elapsed month Anexample on the first of September we calculate the daily PISN for each day of August ThePISN is computed semi-automatically with as little manual intervention as possibleTo calculate the PISN values for the concerned month we use all Wolf numbers Typicallythere is data from around 65 stations available
The calculation of the PISN is based on an extensive statistical treatment This treatmentfilters out any abnormal daily observation or the complete data set from an erratic station(quality control) This prevents long-term drifts in the resulting index One of the key elementsderived from this processing is to update the K reduction coefficients for each station theevolution of each station is monitored for each day relative to the entire networkA subset of the contributing stations also provides hemispheric counts A similar process isapplied to the North and South counts to derive the hemispheric PISN There is an additionalconstraint the sum of the North and South ISN must match the total ISNThe PISN replaces the EISN And once the Definitive ISN (DISN) is calculated the DISNreplaces the PISN
The definitive sunspot index
The Definitive ISN is calculated and issued on a quarterly basis when we have collecteddata from all the contributing observatories This is the final index and it is appended to thehistorical sunspot index time series The same semi-automated treatment as for the PISN isnow applied to the full data set If the result agrees within 5 of the PISN value the PISN iskept and becomes definitive Otherwise the new calculated value replaces the PISN andbecomes the definitive ISNIt is only at this stage and only in peculiar situations that a manual verification by ourscientific staff is required For example this happens when the observed raw Wolf valuesfrom the whole network are clustered around two distinct values This special case can becaused by small short-lived isolated sunspots (lifetimes lt 24 hours) or by the appearance ordisappearance of a large group at the solar limb in the course of one UT dayThe DISN replaces the provisional and estimated International Sunspot Number
Handling very low activity levels
One of the situations requiring a human arbitration is associated with single small isolatedand short-lived sunspots This is most noticeable around the minimum of the solar activitycycle like the one occurring now in 2008 Due to the 24hour binning (observations aregrouped between 0hUT and 24hUT) and the variable ability of each observer to detect thesmallest sunspots we end up with some stations reporting one sunspot and others who didno see any sunspot Let us explain further No sunspot may mean that the sunspot waspresent but the observer was unable to see it because of poor observational conditions such
as weather a small telescope On the other hand it may also indicate that the sunspot hadactually vanished by that time while it was present earlier on the same day
832019 Ew Afgewerkte Final
httpslidepdfcomreaderfullew-afgewerkte-final 4759
47
Individual stations do not observe at exactly the same timeIn order to validate the existence of such a marginal reported sunspot a qualified SIDCscientist must then check the detailed chronology within that day and consider the overallobserver capability (value of K coefficient)In common practice the fact that a sunspot is reported by a significant group of observersleads to the inclusion of the sunspot on that date thus neglecting the no-sunspotobservationsThe rationale is multiple observations of a sunspot exclude the possibility that the reportedsunspot was an independent false detection So a sunspot was really present on that dayalthough it may have existed only for part of the day or it was small enough to be missed bypart of the observers with smaller instruments or imperfect atmospheric conditionsAlso keep in mind that the sunspot index is derived with a limited precision just like any otherindex If the monthly mean sunspot number is 0 or 05 you can definitely say that activitywas low
What index should be used
If you want to perform long-term investigations the definitive ISN series is definitely the mostsuitable However there is a delay of a few months So when investigating the last cycle andrecent evolution use the definitive numbers in combination with the provisional ISN to be upto date to the last month The provisional numbers are also used in models forecasting thesunspot number for the coming months Now if you need a proxy for solar activity in a modelthat runs in real-time then you may use the estimated ISNImprovements and rethinking of the processing method is an ongoing project We arecurrently developing an alternative program for calculating the PISN Of course long-termconsistency is vital Therefore a cross-analysis between the output from the old and newsoftware must be applied over an extended period
832019 Ew Afgewerkte Final
httpslidepdfcomreaderfullew-afgewerkte-final 4859
48
Above graphs show different kinds of the International Sunspot Number The left plot gives an overview from 1700 up to now from the yearly (black) and monthly smoothed Sunspot Number The graph in the right top corner shows the monthly and monthly smoothed sunspot number while the graph in the right bottom corner show the daily monthly smoothed monthly sunspot number For every the time range of investigation there is an appropriate sunspot number
832019 Ew Afgewerkte Final
httpslidepdfcomreaderfullew-afgewerkte-final 4959
49
Appendix XI Filaments and prominences
httpsohowwwnascomnasagovpickoftheweekold26feb2004
This is a picture taken by SOHO on 26 February 2004
832019 Ew Afgewerkte Final
httpslidepdfcomreaderfullew-afgewerkte-final 5059
50
Appendix XII The reconnection of magnetic loops
httpwwwioporgEJarticle0004-637X558287253575webpdfrequest-id=73e38daa-69ae-4e01-b9a6- b4bd0ba071dd
In (a) sunspot B and C have different polarity and move towards each other The twomagnetic loops will reconnect and form one big magnetic loop showed in (b) This will
happen to other magnetic loops too as can be seen in (c) When G en F are close enough they
will reconnect and so E en H will reconnect too It is possible that the magnetic field line is
trapped around another in this case AD The mass ejected from the sun will be trapped
between the magnetic field lines and form a solar prominence
832019 Ew Afgewerkte Final
httpslidepdfcomreaderfullew-afgewerkte-final 5159
832019 Ew Afgewerkte Final
httpslidepdfcomreaderfullew-afgewerkte-final 5259
52
httptheinvisibleagentwordpresscom20090117amazing-celestial-images
An group of active prominences
httpapodnasagovapodap051109html
httpwhassupinthemilkywayblogspotcom200903cloudy-planhtml
A picture taken by SOHO In the left corner you can see the prominence with twisted
magnetic field lines
832019 Ew Afgewerkte Final
httpslidepdfcomreaderfullew-afgewerkte-final 5359
53
Appendix XIV Polar crown
httpsciencenasagovheadlinesy200817sep_polarcrownhtm
Photograph of a polar crown taken on 13 June 1999 by the Meudon Observatory
832019 Ew Afgewerkte Final
httpslidepdfcomreaderfullew-afgewerkte-final 5459
54
Appendix XV Coronal holes
httpsunearthdaynasagov2007multimediagal_020php
The black segment is a huge coronal hole The bright parts are x-rays from sunspots
832019 Ew Afgewerkte Final
httpslidepdfcomreaderfullew-afgewerkte-final 5559
55
Appendix XVI Coronal mass ejection
httpzuserver2staruclacuk~idhapodap000309html
Picture of a CME taken by SOHO in February 2000
832019 Ew Afgewerkte Final
httpslidepdfcomreaderfullew-afgewerkte-final 5659
56
Bibliography
Books
BEATTY JK PETERSEN CC and CHAIKIN A The new solar system fourth edition
Cambridge University Press Cambridge 1999 421 p
COMINS NF and KAUFMANN III WJ Discovering the universe eighth edition WH
Freeman and Company New York 2008 535 p
DETHIER T Het zonnestelsel Standaard Uitgeverij 1992 415 p
GOLUB L and PASACHOFF JM Nearest star the surprising science of our sun Harvard
university press Harvard 2001 267 p
GREEN SF and JONES M H An introduction to the Sun and Stars The Open University
Cambridge 2004 373 p
HILL S and CARLOWITZ M The sun Abrams New York 2006 239 p
HOLMAN GD lsquoThe mysterious origins of solar flaresrsquo Scientific America April 2006 p
24-31 volume 294 number 4
JANSSENS J Zon en aarde een unieke relatie Garant Antwerpen 2003 254 p
KELLER H-U Van Supernovarsquos tot zwarte gaten Tirion Natuur AH Baarn 2003 169 p
LANG KR Sun earth and sky Springer Germany 1995 282 p
LILENSTEN J and BORNAREL J Sous les feux du soleil EDP Sciences Les Ulis Cedex
A 2001 247 p
832019 Ew Afgewerkte Final
httpslidepdfcomreaderfullew-afgewerkte-final 5759
57
Articles
CUYPERS J and others lsquoLa rechercheacute en heacuteliophysique en Belgiquersquo Space connection
October 2007 20 p
DE KEYSER J lsquoDe magnetopauzersquo Heelal maart 1998 p 66-73
JANSSENS J lsquoHet maximum van de 23ste zonnevlekkencyclus (I)rsquo Heelal Oktober 1998 p
256-263
JANSSENS J lsquohet maximum van de 23ste zonnenvlekkencyclus (II)rsquo Heelal November
1998 p 284-290
JANSSENS J lsquoZonnefakkelsrsquo Heelal Oktober 1994 p 256-261
SMITS F lsquoDe coronarsquo Heelal Februari 1999 p 40-42
SMITS F lsquoProtuberanzenrsquo Heelal Juli 1991 p 182-185
VAN DEN BERGHE S lsquoHet Zeemaneffectrsquo Heelal September 1998 p 228-231
832019 Ew Afgewerkte Final
httpslidepdfcomreaderfullew-afgewerkte-final 5859
58
Webography
BOEN B Birth of a coronal mass ejection Internet
(httpwwwnasagovmission_pagessolar-b solar_005html) 290408
BRAEUNIG R A Glossary Internet (httpwwwbraeunigusspaceglossaryhtm) 2006
CORDIS Researchers reveal why Suns atmosphere is hotter than its surface Internet
(httpcordiseuropaeusearchindexcfmfuseaction=newsdocumentampN_LANG=ENampN_R
CN=30598amppid=0ampq=87F36474805A6BEC0B89404F72D0351Famptype=sim) 20032009
DAY C Alfveacuten waves may heat the Sunrsquos corona Internet
(httpblogsphysicstodayorgupdate200903 alfven-waves-may-heat-the-sunshtml)
310309
ELLERMAN F Solar prominences Internet (httparticlesadsabsharvardedufull
1928ASPL173E 0000074000html) (03042009)
ENCYCLODPEDIA OF SCIENCE Corona hole Internet
(httpwwwdaviddarlinginfoencyclopediaC coronal_holehtml) (04042009)
HATHAWAY D H The sunspot cycle Internet
(httpspacesciencespacerefcomsslpadsolarsunspots htm) 04012000
JANSSENS J The case of the missing solar cycle (published in lsquoheelalrsquo January 2008)
Internet (httpuserstelenetbejjanssensMSCwebEngpdf)
KNISELY D Solar prominences Internet
(httpwwwicstarscomHTMLSolarSectionHAlphaOBSERVINGTHESUNHAlpha3html)
(03042009)
KOPANSKI J Atom Internet (httpknolgooglecomkjan-
kopanskiatom1amrwrct7rvi27) 060209
MARTENS PC and ZWAAN C Origin and evolution of filament-prominence systems
Internet (http wwwioporgEJarticle0004-637X558287253575webpdfrequest-
id=73e38daa-69ae-4e01-b9a6-b4bd0ba071dd) 092001
NASA The corona Internet (httpsolarsciencemsfcnasagovcoronashtml) 180107
NASA The heliosphere Internet (httpheliosgsfcnasagovheliosphhtml) 20012009
OFFICIAL SITE OF STONEHENGE About Stonehenge Internet
(httpwwwstonehengecouk) (03022009)
OTTERSDORF M Astronomy On the sunspot cycle Internet
(httpuserszoominternetnet~matto MCASsunspot_cyclehtmZeemaneffect) 031103
PARIAT E and SCHMIEDER B Magnetic flux emergence Internet(httpwwwscholarpediaorgarticleMagnetic_field_emergence) 18042008
832019 Ew Afgewerkte Final
httpslidepdfcomreaderfullew-afgewerkte-final 5959
59
PRIEST E R Dynamics and Structure of Quiescent Solar Prominences Internet
(httpbooksgooglebe booksid=h599q3jz1w4Campdq=quiescent+prominencesampprintsec=fro
ntcoverampsource=blampots=58b79Qeyabampsig=1eklQ-
WszOIebZZaq7fq7gm6bxAamphl=nlampei=urPtSe7ZCo61-
Qa166jHDwampsa=Xampoi=book_resultampct=result ampresnum=3PPA6M2) 1989
RUSSELL R Rotation of the sun Internet
(httpwwwwindowsucaredutourlink=sunSolar_interior
Sun_layersdifferential_rotationhtml) 16082005
RUSSELL R Sunspots and magnetic fields Internet
(httpwwwwindowsucaredutourlink=sunatmospheresunspot_magnetismhtmlampedu=hig
h) 060908
UNIVERSITY OF GLASGOW Bibliography of Peter Sweet Internet
(httpwwwuniversitystoryglaacuk biographyid=WH2144amptype=P) (10042009)
WIKIPEDIA Orbiting Solar Observatory Internet
(httpenwikipediaorgwikiOrbiting_Solar_Observatory) 24012009
WINDOWS TEAM Maunderrsquos Butterfly Diagram Internet
(httpwwwwindowsucaredutourlink=sun activitybutterflyhtml) 2000
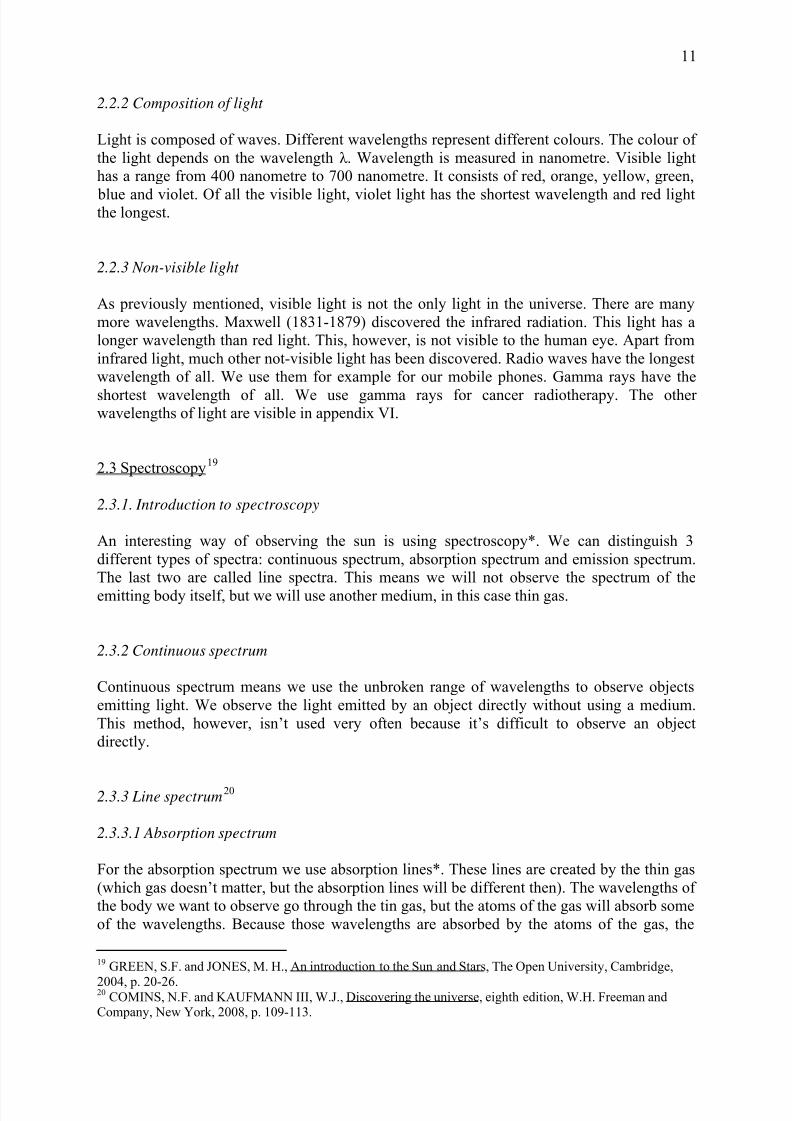
832019 Ew Afgewerkte Final
httpslidepdfcomreaderfullew-afgewerkte-final 1159
11
222 Composition of light
Light is composed of waves Different wavelengths represent different colours The colour of
the light depends on the wavelength λ Wavelength is measured in nanometre Visible light
has a range from 400 nanometre to 700 nanometre It consists of red orange yellow green
blue and violet Of all the visible light violet light has the shortest wavelength and red lightthe longest
223 Non-visible light
As previously mentioned visible light is not the only light in the universe There are many
more wavelengths Maxwell (1831-1879) discovered the infrared radiation This light has a
longer wavelength than red light This however is not visible to the human eye Apart from
infrared light much other not-visible light has been discovered Radio waves have the longest
wavelength of all We use them for example for our mobile phones Gamma rays have the
shortest wavelength of all We use gamma rays for cancer radiotherapy The other wavelengths of light are visible in appendix VI
23 Spectroscopy19
231 Introduction to spectroscopy
An interesting way of observing the sun is using spectroscopy We can distinguish 3
different types of spectra continuous spectrum absorption spectrum and emission spectrum
The last two are called line spectra This means we will not observe the spectrum of the
emitting body itself but we will use another medium in this case thin gas
232 Continuous spectrum
Continuous spectrum means we use the unbroken range of wavelengths to observe objects
emitting light We observe the light emitted by an object directly without using a medium
This method however isnrsquot used very often because itrsquos difficult to observe an object
directly
233 Line spectrum20
2331 Absorption spectrum
For the absorption spectrum we use absorption lines These lines are created by the thin gas
(which gas doesnrsquot matter but the absorption lines will be different then) The wavelengths of
the body we want to observe go through the tin gas but the atoms of the gas will absorb some
of the wavelengths Because those wavelengths are absorbed by the atoms of the gas the
19 GREEN SF and JONES M H An introduction to the Sun and Stars The Open University Cambridge
2004 p 20-2620COMINS NF and KAUFMANN III WJ Discovering the universe eighth edition WH Freeman and
Company New York 2008 p 109-113
832019 Ew Afgewerkte Final
httpslidepdfcomreaderfullew-afgewerkte-final 1259
12
wavelengths cannot appear in the absorption spectrum of the body we observe We can notice
in appendix VII the absence of some wavelengths by the black lines Such lines are called
absorption lines They correspond to the wavelengths that are absorbed by the gas
2332 Emission spectrum
We can also examine the light emitted by the gas The atoms of the gas absorb some
wavelengths emitted by the object we actually want to observe but afterwards they will emit
those wavelengths again as photons This gives us a number of bright lines called emission
lines For many gases the wavelengths of the absorption lines will be the same as those
from the emission lines
234 The Zeemaneffect 21
In 1896 Pieter Zeeman (1865-1943) discovered that some spectrum lines split up A spectrumline emitted in a magnetic field will split up into different spectrum lines close to each other
This is called the Zeemaneffect
If the magnetic field is strong enough and is parallel with the direction of observation the
absorption line splits up into two lines one on the left side of the normal absorption line
(which means a smaller wavelength) and one on the right side of the absorption line (which
means a higher wavelength) If there is a magnetic field straight on our direction of
observation the absorption line will even split up into three lines one line will represent the
normal absorption line the other two will be just like with a parallel magnetic field
Figure 3 The Zeemaneffect
httpchemteaminfoGalleryGallery16html
How does a magnetic field influence an electron We can find an explanation in the Quantum
theory The magnetic field will interact with the atoms so that the electrons will reach
slightly different energy levels Atoms with different energy levels will emit different
wavelengths This explains the multiple lines of the Zeemaneffect
The divergence of the splitting depends on the force of the magnetic field which means we
can determine the size of the magnetic field by observing the Zeemaneffect
21VAN DEN BERGHE S lsquoHet Zeemaneffectrsquo Heelal september 1998 p 228-231
KOPANSKI J Atom Internet (httpknolgooglecomkjan-kopanskiatom1amrwrct7rvi27) 060209
832019 Ew Afgewerkte Final
httpslidepdfcomreaderfullew-afgewerkte-final 1359
13
Chapter 3 The solar cycle
31 Introduction
In this chapter we will concentrate on the long term evolution of the global magnetic field of
the sun It is important to understand the long-term evolution of the global magnetic field of the sun because the global magnetic field has a great influence on the magnetic field on a
local scale The sunrsquos magnetic field changes every 11 years This is why we call it the 11-
year-solar cycle However strictly speaking it is a 22-year-cycle This will be explained later
on in this chapter The record of the first solar cycle started in 175522 Since then itrsquos
currently already the 24th solar cycle
32 Differential rotation
As well as the earth the sun rotates But the sun isnrsquot made of the same matter as our earth on
the surface The sunrsquos surface is made of plasma Because of the plasma the sun will rotateat different speeds depending on latitude At the equator the sun makes a full rotation every
25 days But the rotation will slow down when the latitude increases This means that at the
poles the sun will rotate much slower At the poles the rotation time is 36 days This creates a
gap of more than 10 days23
Astronomers believe that it is only the surface of the sun that undergoes differential rotation
The inner core moves more like a solid body such as the earth but it is still unclear if this is
the case24
33 When the years passhellip25
Differential rotation is the main cause of all the complex phenomena that will be discussed
later on because this differential rotation causes the solar cycle and magnetic disturbance
As mentioned previously before the sunrsquos surface rotates much faster at the equator than at
the poles the plasma around the equator will move faster This is shown in figure 4 on the
next page Since the sun keeps on rotating in the same direction the plasma at the equator will
move much faster26
The magnetic field that the sun normally would have is the same type as the magnetic field of the earth This means the sun normally has the magnetic field resembling to the magnetic field
of a bar magnet Magnetic field lines move from north to south and at the poles the density of
the magnetic field is compact because there the magnetic field lines come together
22 JANSSENS J The case of the missing solar cycle (published in lsquoheelalrsquo January 2008) Internet (httpusers
telenet be jjanssensMSCwebEngpdf)23
DETHIER T Het zonnestelsel Standaard Uitgeverij 1992 p 77-7824
RUSSELL R Rotation of the sun Internet (httpwwwwindowsucaredutourlink=sunSolar_interiorSun_layersdifferential_rotationhtml) 1608200525 CUYPERS J and others lsquoLa rechercheacute en heacuteliophysique en Belgiquersquo Space connection October 2007 p
6-726GREEN SF and JONES M H An introduction to the Sun and Stars The Open University Cambridge
2004 p 72-73
832019 Ew Afgewerkte Final
httpslidepdfcomreaderfullew-afgewerkte-final 1459
14
Figure 4 The magnetic field lines of the sun change because of the differential rotation
httpircameraasarizonaeduNatSci102lecturessunhtm
If we apply the differential rotation on this magnetic field the magnetic field lines under the
photosphere of the sun will move faster at the equator This will cause the following
structure seen on figure 4 on the sun in the middle The magnetic field lines will continue to
get mixed up and the magnetic field lines will pile up This process takes several years
Finally the magnetic field lines will be stacked almost parallel to the sunrsquos equator This is
the sun on the right side in figure 427 You can find a more specific drawing of this process in
appendix VIII
Eventually after approximately eleven years the magnetic field lines will be piled up in such
a way that finally the magnetic field lines will start to pop out of the sunrsquos surface This willcause sunspots Sunspots appear in pairs one with a south ldquopolerdquo and one with a north
ldquopolerdquo The north ldquopolerdquo contains magnetic field lines that are directed outwards and the south
ldquopolerdquo contains magnetic field lines that point inwards28 Sunspots are discussed in more
detail in the next chapter When the sunspots almost come to an end the loops will reconnect
with another sunspot over the equator This connection will cause a switch of the poles (see
figure 5) The South Pole will become the North Pole and vice versa This model is called the
magnetic dynamo proposed by Horace Babcock (1912-2003)29
27GREEN SF and JONES M H An introduction to the Sun and Stars The Open University Cambridge
2004 p 72-7328 LANG KR Sun earth and sky Springer Germany 1995 p 8229
COMINS NF and KAUFMANN III WJ Discovering the universe eighth edition WH Freeman andCompany New York 2008 p 297-298JANSSENS J lsquohet maximum van de 23ste zonnenvlekkencyclus (II)rsquo Heelal November 1998 p 284
832019 Ew Afgewerkte Final
httpslidepdfcomreaderfullew-afgewerkte-final 1559
15
Figure 5 The switching of the magnetic poles of the sun
GREEN SF and JONES M H An introduction to the Sun and Stars The Open University Cambridge 2004 p73
When finally the poles have switched and the magnetic field lines are disentangled the cycle
will just start over again for another eleven years Because the magnetic poles of the sun
switch every eleven years the cycle is called the 11-year-solar cycle
34 Other cycles
341 The 22-year-cycle
If we take the magnetic poles into account however the 11-year-cycle becomes a 22-year-
cycle because the magnetic poles switch If we want to consider the strict cycle which means
that we take the magnetic poles into account we have to call the solar cycle a 22-year-cycleIt takes eleven years to switch the magnetic North Pole into a South Pole and another eleven
years to switch them back This cycle is called the Hale-cycle named after George Ellery
Hale (1868-1938) who was an American solar astonomer and active in different
observatories30
342 The 27-day-cycle31
The 27-day-cycle taking the average of the sunrsquos rotation time is a cycle that is directly
connected to the rotation time of the sun The sunspots the coronal holes and other
phenomena that are related to the activity of the sun rotate too This means that the activity of the sun is connected to the rotation cycle For example the part of the sun that we can see will
be less active when the sunspots are not visible because the sunspots influence the solar
activity When the sunspots appear again the activity of the sun will rise This cycle is also
known because of the coronal holes that influence the solar wind
30JANSSENS J lsquohet maximum van de 23
stezonnenvlekkencyclus (II)rsquo Heelal November 1998 p 284-290
31 JANSSENS J Zon en aarde een unieke relatie Garant Antwerpen 2003 p 113
832019 Ew Afgewerkte Final
httpslidepdfcomreaderfullew-afgewerkte-final 1659
16
343 Other cycles
Astronomers believe that there must be some other cycles of an even longer basis Different
researchers have been looking for other solar cycles Some thought they found a 55-year
cycle However this cycle was very irregular Max Waldmeier (1912-2000 a very eminent
solar astronomer of the 20th
century) found a 90-year-cycle However lots of other cycleshave been ldquofoundrdquo There have been postulated a 2300-year-cycle too But the records of
solar cycles are too recent to prove this cycle 32
35 Solar maximum and minimum
The Royal Greenwich Observatory has been observing the sunspots since 1874 The
information of their observations includes the size the position and the number of sunspots
during all the recorded solar cycles If we put all this information into a graph we can see the
so-called butterfly-graph (appendix IX) With this information we can conclude that sunspots
do not appear at random33
At the beginning of a new solar cycle the first sunspots appear at latitude of 45 degrees Later
on sunspots will appear at the equator too When the sunspots begin to appear at 45 degrees a
new cycle has started again34 The solar minimum is the starting point of the solar cycle At
the beginning sunspots are very rare sometimes there are none If there are any sunspots they
will occur at higher latitudes The solar activity is the least on solar minimum Then it is a
good time for astronauts to go into space because there are less sunspots and less solar flares
and other phenomena that can influence the solar wind and so the space weather When the
solar activity is the highest the solar cycle reaches its maximum There will be a lot of
sunspots which now occur on lower latitudes too35 The time to go from a solar minimum to a
solar maximum is around four years During this time the solar activity will rise and when it
reaches its maximum it will slowly decline The decrease takes much more time than the
increase of the solar activity around 7 years The time between a solar minimum and
maximum and between a solar maximum and minimum can vary and is different for every
solar cycle36
36 Mysteries of the solar cycle
Astronomers have been able to find out a lot of details about the solar cycle However we are
still not able to predict the maximums and minimums of the solar cycles preciselyAstronomers havenrsquot been capable to draw up a model that allows us to predict the exact
number of sunspotshellip You can compare it to predictions for the weather to comehellip
32JANSSENS J Zon en aarde een unieke relatie Garant Antwerpen 2003 p 113-114
33HATHAWAY D H The sunspot cycle Internet (httpspacesciencespacerefcomsslpadsolarsunspots
htm) 0401200034 JANSSENS J Zon en aarde een unieke relatie Garant Antwerpen 2003 p 10335
WINDOWS TEAM Maunderrsquos Butterfly Diagram Internet (httpwwwwindowsucaredutourlink=sunactivitybutterflyhtml) 200036 JANSSENS J Zon en aarde een unieke relatie Garant Antwerpen 2003 p 99-100
832019 Ew Afgewerkte Final
httpslidepdfcomreaderfullew-afgewerkte-final 1759
17
Chapter 4 Phenomena caused by the magnetic field of the sun
41 Sunspots
411 What are sunspots
Sunspots appear on the sunrsquos surface when the magnetic field lines under the photosphere
are piled up too much and they finally pop out into the chromosphere Sunspots are normally
found in groups The number of sunspots is dependent on the solar activity when the solar
activity reaches its maximum there will be many more sunspots than at solar minimum
Measuring the magnetic field in sunspots with the Zeemaneffect makes clear that the
strength of the magnetic field is much stronger in sunspots than in the surrounding
photosphere Itrsquos more than thousand times stronger the magnetic field strength in magnetic
fields varies from 1000 to 4000 Gauss while the surrounding area circles around 1 Gauss
(comparison the earthrsquos magnetic field strength is about 05 Gauss)37
412 What do sunspots look like
When magnetic field lines pop out of the photosphere they will form magnetic loops (figure
6 on the right side) Between this magnetic loops there will be formed a flux tube The
magnetic field lines in the sunspot will distort the convection under the surface (see figure 6
on the left side) They will pull the plasma downwards and will prevent the warm plasma
from going upwards and reach the sunrsquos surface Eventually the temperature in the sunspot
will cool down38
Figure 6 Left side convection in sunspotsRight side magnetic field lines in sunspots
JANSSENS J Zon en aarde een unieke relatie Garant Antwerpen 2003 p41
37
RUSSELL R Sunspots and magnetic fields Internet (httpwwwwindowsucaredutourlink=sunatmospheresunspot_magnetismhtmlampedu=high) 06090838 JANSSENS J Zon en aarde een unieke relatie Garant Antwerpen 2003 p 40-41
832019 Ew Afgewerkte Final
httpslidepdfcomreaderfullew-afgewerkte-final 1859
18
We can distinguish 2 areas the black sunspot and the surrounding bright surface of the sun
The sunspot itself consists of the very dark centre called the umbra and the surrounding
orange-brown environment called the penumbra The penumbra consists of an amount of
small little striated f igures that come out of the umbra A sunspot can reach a diameter of
300 000 kilometres39 The temperature in the sunspots centre is much cooler than in the
photosphere because of the convection explained above It measures around 4 200 K whilethe photosphere has a temperature of 6000 K40
Figure 7 The composition of a sunspot
httpwwwjaxajparticlespecialastroshimizu02_ehtml
A sunspot appears black to our eyes However appearances are deceptive the dark sunspot
only seems dark because we see it against a much warmer environment If we h ad seen itagainst a black surface it would have been much brighter than the moonrsquos glowing41
The amount of sunspots varies from very few till over more than a hundred The amount of
sunspots can be predicted by the Wolf-numbers named after Johann R udolf Wolf (1816-
1893) a Swiss astronomer best known for his research on sunspots42 However I wonrsquot
explain this method in this paper You can find a briefly explanation in appendix X Yet this
method is only capable to predict the amount of sunspots approximately
42 Prominences
421 What is a prominence
The luminosity of the sun outshines lots of phenomena that take place on the surface of the
sun and even far away from the sun The sunrsquos corona is one example But luckily
prominences are quite visibly when we observe the sun A prominence is a huge cloud of gas
that is cooler than his environment It is trapped between two horizontal magnetic field lines
For human eyes it seems to spread out dark but this is only because a prominence has a much
39 LILENSTEN J and BORNAREL J Sous les feux du soleil EDP Sciences Les Ulis Cedex A 2001 p 3540 OTTERSDORF M Astronomy On the sunspot cycle Internet (httpuserszoominternetnet~matto
MCASsunspot_cyclehtmZeeman effect) 03110341JANSSENS J Zon en aarde een unieke relatie Garant Antwerpen 2003 p 41
42 JANSSENS J lsquoHet maximum van de 23ste zonnevlekkencyclus (I)rsquo Heelal October 1998 p 256-263
832019 Ew Afgewerkte Final
httpslidepdfcomreaderfullew-afgewerkte-final 1959
19
lower temperature then the sunrsquos chromosphere (similar to sunspots which spread out dark
too) The dark lines in appendix XI are also known as filaments A filament is a line between
to magnetic fields with opposite polarities (appendix XI)43
Figure 8 A solar prominence
httpcosmic-webcoukp=274more-274
422 What is a prominence made of
The gas from the prominence is coming from the chromosphere So the prominences have
approximately the same composition as the chromosphere A good way to observe
prominences is to use red Hα or blue Hβ spectrum lines Hα absorption lines indicate a
temperature lower than 10 000 Kelvin These spectrum lines justif y that the temperature of a prominence is remarkably lower than the temperature of the corona 44
423 How do prominences originate
A prominence is a result of the magnetic field Particles of the sun can transport warmth very
fast if they move alongside magnetic field lines If they want to move straight to a magnetic
field line the transport of warmth is negligible So prominences that are trapped between 2
magnetic fields only have one way to be heated This brings on a temperature that is notably
lower then the temperature in the corona45
The origin of prominences is similar to the origin of solar flares When two magnetic loops
of opposite polarity start to approach each other they will reconnect and form some new
loops This is shown in appendix XII Some mass from the sun will be trapped between the
new magnetic field lines and will form a solar prominence 46
43COMINS NF and KAUFMANN III WJ Discovering the universe eighth edition WH Freeman and
Company New York 2008 p 29944 SMITS F lsquoProtuberanzenrsquo Heelal Juli 1991 p 18345 LANG KR Sun earth and sky Springer Germany 1995 p 134-14046
MARTENS PC and ZWAAN C Origin and evolution of filament-prominence systems Internet ( httpwwwioporgEJarticle0004-637X558287253575webpdfrequest-id=73e38daa-69ae-4e01-b9a6- b4bd0ba071dd) 092001
832019 Ew Afgewerkte Final
httpslidepdfcomreaderfullew-afgewerkte-final 2059
20
424 What do prominences look like47
4241 Different groups of prominences
As you can see on the pictures in appendix XIII prominences can have different shapes and
forms Thatrsquos why astronomers classify them into different groups the quiescent prominences the active prominences and eruptive prominences
4242 Quiescent prominences
Quiescent prominences can appear everywhere on the sun and are not depending on latitude
They can reach into the corona over 2 500 till 40 000 kilometres Quiescent prominences last
the longest of all prominences Some of them even last several solar rotations long These
prominences are very long and not so wide During its lifetime a quiescent prominence moves
slowly to the poles When they are found at the poles of the sun they are called a lsquopolar
crownrsquo (appendix XIV)48
4243 Active prominences
Their name already suggests where they can be found active prominences are found in the
active regions of the sun moreover in the presence of sunspots These prominences
however only have a short lifespan only several hours But within this short lifespan they do
change form adjusting to the magnetic field lines within a short period of time Because
these prominences are located in active regions there are many more reconnections and so
the form will change more rapidly
4244 Eruptive prominences
These prominences only last a couple of minutes and are connected to active sunspots as well
It is possible that after one died out another immediately gives birth in the same region Other
eruptive prominences are known to be bubbles of gas that are issued from active sunspots
There have been some records of eruptive prominences that bump into other prominences and
push the other prominences back in the sunspot49
47 KNISELY D Solar prominences Internet (httpwwwicstarscomHTMLSolarSectionHAlpha OBSERVINGTHESUNHAlpha3html) (03042009)
SMITS F lsquoProtuberanzenrsquo Heelal Juli 1991 p 182-185
ELLERMAN F Solar prominences Internet (httparticlesadsabsharvardedufull 1928ASPL173E0000074000html) (03042009)48
KNISLEY D Solar prominences Internet (httpwwwicstarscomHTMLSolarSectionHAlphaOBSERVINGTHESUNHAlpha3html) (03042009)49 PRIEST E R Dynamics and Structure of Quiescent Solar Prominences Internet (httpbooksgooglebe
booksid=h599q3jz1w4Campdq=quiescent+prominencesampprintsec=frontcoverampsource=blampots=58b79Qeyabampsig=1eklQ-WszOIebZZaq7fq7gm6bxAamphl=nlampei=urPtSe7ZCo61-Qa166jHDwampsa=Xampoi=book_resultampct=resultampresnum=3PPA6M2) 1989
832019 Ew Afgewerkte Final
httpslidepdfcomreaderfullew-afgewerkte-final 2159
21
43 Coronal holes50
When looking at the sun with an x-ray telescope we can see dark regions across the sun
These dark regions are called coronal holes Coronal holes have an open magnetic field
structure This means that the magnetic fields lines do not angle downwards but they extend
into space indefinitely Due to this the particles of the sun are capable to reach out far intospace without any struggles against the magnetic field With this outflow of gases from the
sun coronal holes are one of the most important sources of the (high-speed) solar wind
(appendix XV)
44 Corona loops
441 What is a corona loop
If we look closer at a pair of sunspots we can see an emission of plasma alongside
magnetic field lines that originate in the sun spots A corona loop can extend into the coronaas the name suggests Those loops contain plasma that can reach a temperature higher than
106 Kelvin Corona loops can best be observed by ultra-violet and x-ray images because of
the high temperature The high temper ature brings on a high vibration of the atoms This
trembling causes the emission of x-rays51
Figure 9 A close up of corona loops
httpwwwdaviddarlinginfoencyclopediaCcoronal_loophtml
442 Where and when do corona loops originate
The magnetic field lines of sunspots move outwards from the sun into the corona and form
broad loops This makes it possible to trap hot gas with a temperature up to 40 million K
Those magnetic field loops trap hot plasma into the sunrsquos atmosphere The magnetic force
pushes particles around along the magnetic lines but at the same time the atoms circulate
around the magnetic field lines (see figure 10) The speed of their movements depends on the
50
ENCYCLODPEDIA OF SCIENCE Corona hole Internet (httpwwwdaviddarlinginfoencyclopediaC coronal_holehtml) (04042009)51 JANSSENS J Zon en aarde een unieke relatie Garant Antwerpen 2003 p 52-54
832019 Ew Afgewerkte Final
httpslidepdfcomreaderfullew-afgewerkte-final 2259
22
density of the magnetic field So if a particle moves from the top of a loop to the bottom it
will slow down just like in traffic jams Eventually it will reach the bottom but the bottom is
highly compressed (because the magnetic field lines converge at the bottom of the loops) so
that the particle will be shot back along the magnetic field line (see figure 10)
Figure 10 the movement of particles in corona loops
GD HOLMAN lsquoThe mysterious origins of solar flaresrsquo Scientific America April 2006 p24-29 volume 294number 4
Hence the particles will move up and down along the magnetic field lines Atoms that are
charged the same will cause electric currents (just like in a battery) These currents will
generate a new magnetic field and the old magnetic field in combination with the new one
will cause a high distortion in the magnetic field of the sun This is the moment when the
corona loop will transform into a solar flare
45 Solar flare52
451 What is a solar flare
A solar flare is a sudden powerful explosion in the solar atmosphere caused by a disruption
in the magnetic field of the sun Because of the disruption mass from the sun will be movedup and form a solar flare A solar flare can equal the energy of billions of atomic bombs
within a few minutes The strongest solar flares are measured during the solar maximums
because then the sunrsquos magnetic activity is the strongest53 Since the sunspots in the presence
of solar flare have a very high magnetic field it is likely that a solar flare would even have a
higher magnetic field But in reality the magnetic field of a solar flare is only half of the
magnetic field of a sunspot The intensity of the magnetic field is lsquoonlyrsquo 500 Gauss54
52 HOLMAN GD lsquoThe mysterious origins of solar flaresrsquo Scientific America April 2006 p 24-31 volume
294 number 453JANSSENS J Zon en aarde een unieke relatie Garant Antwerpen 2003 p 55-57
54 JANSSENS J lsquoZonnefakkelsrsquo Heelal Oktober 1994 p 256
832019 Ew Afgewerkte Final
httpslidepdfcomreaderfullew-afgewerkte-final 2359
23
Figure 11 You can see the magnetic fieldlines in the solar flare on the right side
Large solar flare recorded by SOHO EIT304 instrument 512x512 version Animation (980kMPEG) CourtesySOHO(ESAampNASA)
httpwwwteachersparadisecomencyenwikipediassusunhtml
452 Where and how do sun flares originate
Astronomers have long been speculating how solar flares exactly originate In 1992 Satoshi
Masuda (graduated at the University of Tokyo) discovered on pictures of the Japanese
Yohkoh Satellite that the far end of a solar flare emitted unusually short wavelengths very
short x-rays The source must be a concentration of gas with a temperature of about 100million K concluded Masuda But this discovery provoked some new questions why was the
high temperature at the top of the flare and not at the bottom where the gas is more compact
Why does the plasma stay confined instead of spreading out into the universe In order to
obtain more information to try to solve this problem astronomers started observing the sunrsquos
radiation of ultraviolet and x-rays frequently In 2002 NASA even launched the RHESSI
(Ramaty High Energy Solar Spectroscopic Imager) which was intended to bring solar flares
into pictures55
These observations provided evidence that sun flares surge up in regions where the magnetic
field is very strong ndashmost common in the presence of sun spots At this point we have to call
over the corona loops As mentioned before corona loops are electric currents of atoms
which move alongside magnetic field lines When the atoms are shot back alongside the
magnetic field line there seems to occur a distortion of the magnetic field This distortion will
end up in a solar flare All the mass of the corona loop will be shot into space and form a solar
flare
But how can such enormous mass of the solar flares be shot into s pace This has been a very
interesting question However Peter Alan Sweet (1921-2005)56 succeeded in finding an
55 GD HOLMAN lsquoThe mysterious origins of solar flaresrsquo Scientific America April 2006 p 27 volume 294
number 456UNIVERSITY OF GLASGOW Bibliography of Peter Sweet Internet (httpwwwuniversitystoryglaacuk
biographyid=WH2144amptype=P) (10042009)
832019 Ew Afgewerkte Final
httpslidepdfcomreaderfullew-afgewerkte-final 2459
24
answer already in 1956 If magnetic field lines break apart and then reconnect they bring
together two opposing fields that will cancel each other and cause a huge burst of energy The
reconnection will create new magnetic field lines This reconnection is called the Sweet-
Parker reconnection Yet this is a slow reconnection which cannot take place at the base of a
solar flare with a dazzling speed Fortunately Harry P Petschek published an article about
reconnection in 1964 and solved that problem under certain circumstances it is possible toreconnect much faster which explains solar flares This faster reconnection is also called the
Petschek reconnection But unfortunately with the current technology it is not yet possible to
take pictures of those reconnections57
If the energy comes from the reconnection then where does this reconnection take place
From pictures of solar flares astronomers discovered that at the top of the corona loop a
mysterious x-ray source was found The x-ray source began to give a higher energy level and
at the same time the particles move down towards the sunrsquos surface Yet the x-ray source
stays at the same placehellipThen when the x-rays reach their maximum the loop suddenly
changes direction But this time the x-ray source will move upwards too unexpectedly it
moves at the speed of light approximately three hundred thousands kilometres an hour awayfrom the sun This is the same speed as the coronal mass ejections
46 Coronal mass ejections
461 What is a coronal mass ejection58
Coronal mass ejections (CMErsquos) (appendix XVI) are huge amounts of gas some billions of
plasma from the sun that are ejected into space Their temperature can reach 25 million K59
A coronal mass ejection can last for several hours and it can at last enter the solar wind A
CME can reach a speed of 50kms- 2000kms which means more than 7 million kilometres
an hour60 The mass of a large CME varies from 5 x 10⁶ to 5 x 10¹³ kg61 During a solar
maximum there are more coronal mass ejections than during a minimum but they can occur
at any time of the solar cycle Coronal mass ejections are related both to solar flares and
prominences Very heavy coronal mass ejections can cause some geomagnetic storms on
earth
462 Reconnection
The reconnection of a solar flare can end up in a coronal mass ejection When magneticfield lines that are opposite are starting to reconnect and form new magnetic field lines half of
the magnetic field lines will point downwards and join some existing magnetic loops
However the other part of the magnetic field lines will move upwards at a very high speed
and will form some loops more upwards Between those loops that moved downwards and
those that moved upwards there is some mass that isnrsquot connected to the sun anymore It is
57GD HOLMAN lsquoThe mysterious origins of solar flaresrsquo Scientific America April 2006 p 29 volume 294
number 458
BRAEUNIG R A Glossary Internet (httpwwwbraeunigusspaceglossaryhtm) 200659 LILENSTEN J and BORNAREL J Sous les feux du soleil EDP Sciences Les Ulis Cedex A 2001 p 4460 Cuypers J and others lsquoLa rechercheacute en heacuteliophysique en Belgiquersquo Space connection October 2007 p 10-
1161GREEN SF and JONES M H An introduction to the Sun and Stars The Open University Cambridge
2004 p 68
832019 Ew Afgewerkte Final
httpslidepdfcomreaderfullew-afgewerkte-final 2559
25
known that for an amount of solar flares that this mass between the loops will end up in a
coronal mass ejection Yet this doesnrsquot count for all the solar flares The coronal mass
ejection only takes place if the magnetic field lines twist around each other while forming the
letter lsquoSrsquo (see figure 12)62
Figure 12 Here you can see the reconnection that takes place before the coronal mass ejection starts
httpwwwnasagovmission_pagessolar-bsolar_005html
Certainly we will be capable to answer all the questions about solar flares and coronal mass
ejections in the nearby future But there are also some very interesting questions left what is
at the basis of the acceleration of the atoms in solar flares How does magnetic reconnection
originate Hopefully we will find the answers in the near future
47 Solar wind
471 What is the solar wind
Every second of every day of the year the sunrsquos corona emits a continuous stream of mass
from the sun The temperature of the corona is so high that the sunrsquos magnetic field just
cannot control the outflow of particles We know that the particles are accelerated but
astronomers cannot explain all the details about the solar wind yet
472 What do we know about the solar wind
The speed of the solar wind can change it differs from 300kmh up to 800kmh This speed
depends on the outflow of gases If there is a corona hole pointing towards the earth the solar
wind will reach a speed of around 800kmh The different speeds can interact with each other
and form a new speed according to the rules of light emission When two emissions connect
with each other they can form a faster or slower solar wind just like waves can interact and
form new waves
62BOEN B Birth of a coronal mass ejection Internet (httpwwwnasagovmission_pagessolar-b
solar_005html) 290408
832019 Ew Afgewerkte Final
httpslidepdfcomreaderfullew-afgewerkte-final 2659
26
The ionized atoms with very high temperature coming from the sunrsquos corona are one of the
most important parts of the solar wind but the magnetic fields are important too The
magnetic field outside the sun gets wrapped into a spiral called the Parker-spiral named after
the scientist who described it as the first one (because the sun rotates) This influences the
magnetic field of the sun from the outside The solar wind is emitted in spiral too (see figure
13)
Figure 13 The course of the solar wind caused by the rotation of the sun
httpheliosgsfcnasagovsolarmaghtml
473 Heliosphere
We can describe the heliosphere as a gigantic magnetic bubble around the sun This is
everywhere in space till where the sunrsquos magnetic field reaches and still has an influence The
heliosphere is filled with solar wind although the solar wind has a very low density Yet it
is a very hot wind but because of the very low density it does not have such a great influence
on earth However it can cause some energetic storms on earth63
63 NASA The heliosphere Internet (httpheliosgsfcnasagovheliosphhtml) 20012009
832019 Ew Afgewerkte Final
httpslidepdfcomreaderfullew-afgewerkte-final 2759
27
Conclusion
The sunrsquos magnetic field is a complex system to understand Yet I hope you have learned a
lot from this paper and that you do understand the exiting phenomena described in the
previous chapters
We can discuss the sunrsquos magnetic field from two perspectives The first one is looking at the
magnetic field for global long-term changing dimensions The second way is based on
phenomena on lower scale
The global changes involve the solar cycle and the switch of the magnetic poles The solar
cycle is divided into a decrease of the solar activity until it reaches solar minimum and an
increase of the solar activity until it reaches solar maximum The frequency of the phenomena
that can be found in the outer layers of the sun are directly connected to the solar activity and
thus to the solar cycle Sunspots are the easiest to see they appear as black spots against the
much brighter surface of the sun Corona loops are connected to sunspots and can extend into
solar flares and solar prominences These flares and prominences can burst out into a coronalmass ejection All these phenomena influence the sun and its solar wind how small their part
may be The solar wind has a directly influence on the earth
There is still much to be discovered Astronomers hope to discover much more about the
magnetic field of the sun Today many astronomers and scientists are observing the sun and
every day they discover more and more aspects of the sun Recently a group of researchers
led by David Jess of Queens University Belfast has revealed why the sunrsquos atmosphere is
hotter than its surface64 As you can see astronomy is a very developing science
64
CORDIS Researchers reveal why Suns atmosphere is hotter than its surface Internet (httpcordiseuropaeusearchindexcfmfuseaction=newsdocumentampN_LANG=ENampN_RCN=30598amppid=0ampq=87F36474805A6BEC0B89404F72D0351Famptype=sim) 20032009
832019 Ew Afgewerkte Final
httpslidepdfcomreaderfullew-afgewerkte-final 2859
28
Glossary
Absorption lines A dark line superimposed on a continuous spectrum when a gas absorbs
light from a continuous source that is hotter than the absorbing gas
Aurora Light radiated by atoms and ions formed by the solar wind in the earthrsquos upper atmosphere seen most commonly in the polar regions
Chromosphere The layer in the solar atmosphere between the photosphere and the corona It
is the lowest layer of the atmosphere characterized by reddish hue and by an increase of the
temperature with altitude through all but its lower regions
Convection The transfer of heat from a region of high temperature to a region of lower
temperature by the displacement of the cooler molecules by the warmer molecules The hot
gas will be moved upwards the cool gas will be pushed downwards into the sun
Corona The sunrsquos outer atmosphere It is very extensive and has a very low density It isextremely hot
Coronal hole A dark region of the sunrsquos inner corona as seen at X-ray wavelengths
Coronal loop Closed loops of magnetic field lines extending from the sunrsquos photosphere into
the corona which contain plasma at high temperature They are typically observed through
ultraviolet or x-ray emission from the hot plasma
Coronal mass ejection Large volumes of high energy gas released from the sunrsquos corona
Differential rotation The rotation of a non rigid object in which parts at different latitudes or
different radial distances move at different speeds
Dynamo theory The generation of a magnetic field by circulating electric charges
Eclipse The blocking of a part or all of the light from the moon by the earth (lunar eclipse) or
from the sun by the moon (solar eclipse)
Emission lines Emission lines are used in physics chemistry and astronomy to determine
what kind of gas is doing the emission Every element has a different electronic structure and
will thus have a different emission line fingerprint Emission lines are produced whenelectrons in atoms jump from one energy level to lower energy level
Filament A dark curve seen above the sunrsquos photosphere that is the top view of a solar
prominence
Flux tube Is a generally tube-like (cylindrical) region of space containing a magnetic field
such that the field at the side surfaces is parallel to them Both the cross-sectional area of the
tube and the field contained may vary along the length of the tube but the magnetic flux is
always constant
832019 Ew Afgewerkte Final
httpslidepdfcomreaderfullew-afgewerkte-final 2959
29
Geomagnetic storm When unusually strong surges of solar wind (charged particles from the
Sun) hit the Earth This effect causes variations in the magnetic field which surrounds the
Earth The visible results are eg the aurora (Northern and Southern lights)
Granulation Granules are related to the convective zone The granulation that shows up in the
photosphere is a result of the rising and falling of hot gas that takes place in the convectivezone
Hα absorption line An absorption line due to an electronic transition in hydrogen atoms in
which the atom absorbs a photon so that the electron makes a transition from a state
corresponding to the electronic energy level with n=2 to the one above with n=3 The photon
wavelength in a vacuum is 6563 nm
Heliosphere The volume of space within which the sun through the solar wind influences its
environment in the interstellar medium
Magnetic dynamo A theory that explains phenomena of the solar cycle as a result of periodicwinding and unwinding of the sunrsquos magnetic field in the solar atmosphere
Magnetic reconnection A process taking place in a plasma in which neighbouring
oppositely directed magnetic field lines suddenly part and reconnect in a new configuration
The abrupt change in a magnetic field represented by this process can release large amounts
of energy and it is thought to be important in explaining solar flares and other phenomena
Penumbra The portion of a shadow in which only part of the light source is covered by the
shadow-making body
Photosphere The region in the solar atmosphere from which most of the visible light escapes
into space
Plasma A fourth state of matter (not found naturally on Earth) of very hot gases Plasma is a
fluid with the ability to carry electric currents with no local accumulations of electric charge
Prominence Flamelike protrusion seen near the limb of the sun and extending into the solar
corona The side view of a filament
Quantum theory A theory in physics based on the principle that matter and energy have the
properties of both particles and waves created to explain the radiation of energy from a blackbody the photoelectric effect and the Bohr theory and now used to account for a wide
range of physical phenomena including the existence of discrete packets of energy and
matter the uncertainty principle and the exclusion principle Itrsquos a theory of the interaction of
matter and radiation developed early in the twentieth century which is based on the
quantization of energy and applied to a wide variety of processes that involve an exchange of
energy at the atomic level
Reconnection See magnetic reconnection
Solar cycle A 22-year-cycle during which the sunrsquos magnetic field reverses its polarity twice
Solar flare A violent eruption on the sunrsquos surface
832019 Ew Afgewerkte Final
httpslidepdfcomreaderfullew-afgewerkte-final 3059
30
Solar wind An outward flow of particles (mostly electrons and protons) from the sun
Solstice Either of two points along the ecliptic at which the Sun reaches its maximum
distance north or south of the celestial equator
Spectroscopy Concerns the production and study of spectra
Spectrum The result of electromagnetic radiation passing through a prism or grating so that
different wavelengths are separated
Spicule Short-lived (lifetime from rising to falling is about 15 minutes) jets vertical to the
solar surface that are several thousand kilometres long and about 1 kilometre thick (see also
appendix IV) in the solar chromosphere
Sunspot A temporary cool region in the solar photosphere created by protruding magnetic
fields
Umbra The central completely dark portion of a shadow
Zeemaneffect A splitting of spectra lines in the presence of a magnetic field
Bibliography and webography of the glossary
COMINS NF and KAUFMANN III WJ Discovering the universe eighth edition WH
Freeman and Company New York 2008 535 p
GREEN SF and JONES M H An introduction to the Sun and Stars The Open University
Cambridge 2004 373 p
httpenmimihuastronomygranulationhtml
httpenmimihuastronomyplasmahtml
httpwwwspacecomspacewatchspace_weather_glossaryhtml
httpenmimihuastronomyemission_linehtml
httpenmimihuastronomyabsorption_linehtml
httpwwwpbsorgfaithandreasonphysglossqm-bodyhtml
httpwwwanswerscomtopicquantum-theory
httpenwikipediaorgwikiFlux_tube
832019 Ew Afgewerkte Final
httpslidepdfcomreaderfullew-afgewerkte-final 3159
31
Appendix I The sun in figures
Physical quantity Comment
Radius 695 510 km 109 x earths radius
Mass 1989 x1030 kg 332 946 earths mass
Mass sun in the solar
system
9986 Total mass sun total mass of
our solar system
Volume 1412 x10sup3sup3 cmsup3 13 million x earths volume
Age 455 milliard years
Luminosity 3854 x 10sup3sup3 ergss
Magnitude -2773
Density center 1513 gcmsup3
Density mean 1409 gcmsup3
Pressure center 2334 x1011 bars
Pressure photosphere 00001 bar
Temperature center 15 557 000deg K
Temperature photosphere 5 780deg K Various sources mention
different grades
Temperature corona 2 000 000 to 3 000 000deg K
Rotation time at North or
South pole
up to 35 days on earth
Rotation time at Equator 25 days on earth The difference in rotation
times is called differential
rotation
Rotation time general 2538 days on earth
Mean distance sun-earth
(AU)
14959787 x108 km 1 AU = 1 Astronomical Unit
= 149 598 000 km
Chemical composition of
the sun ( of total number
of atoms)
Hydrogen 921
Helium 78
All others 01
Various sources mention
slightly different percentages
832019 Ew Afgewerkte Final
httpslidepdfcomreaderfullew-afgewerkte-final 3259
32
Chemical composition of
the sun ( of total mass)
Hydrogen 7346
Helium 2485
All others 169
Various sources mention
slightly different percentages
Total transforming of
hydrogen into helium persecond
700 billions of kilograms of
hydrogen are transformedinto 6957 billions of
kilograms of helium each
second
Based on the following references
- BEATTY JK PETERSEN CC and CHAIKIN A The new solar system fourth edition
Cambridge University Press Cambridge 1999 p 421
- LILENSTEN J and BORNAREL J Sous les feux du soleil EDP Sciences Les Ulis
Cedex A 2001 p 247
- LANG KR Sun earth and sky Springer Germany 1995 p 282- DENTHIER T Het zonnestelsel Standaard Uitgeverij 1992 p 415
- JANSSENS J Zon en aarde een unieke relatie Garant Antwerpen 2003 p 254- VOLKSSTERRENWACHT URANIA VZW De zon Internet(httpwwwuraniabesterrenkundezonnestelselzonphp) (01012009)
832019 Ew Afgewerkte Final
httpslidepdfcomreaderfullew-afgewerkte-final 3359
33
Appendix II Anatomy of the sun
httpwwwcosmographicacomgalleryinfographicssolar_anatomyhtml
The middle the sun consists of a heavy core this consists of plasma just as the outer layers
of the sun but the pressure in the core is so high that it behaves much more like a solid bodyThe most outer layer is the corona it reaches far into space More to the inside there is the
chromosphere and then the photosphere The corona the chromosphere and the
photosphere are explained in chapter 1
832019 Ew Afgewerkte Final
httpslidepdfcomreaderfullew-afgewerkte-final 3459
34
Appendix III Granulation
httpwwwwindowsucaredutourlink=sunSolar_interiorsolar_furnacehtml
At the surface of the sun we can find granules These are created by convection the warmest
parts of the sunrsquos interior move upwards and the colder parts at the surface move downwardsThis causes currents of plasma The dark lines are the colder particles We see them darker
because they emit less light than their surrounding neighbourhood
832019 Ew Afgewerkte Final
httpslidepdfcomreaderfullew-afgewerkte-final 3559
35
Appendix IV Spicules
Picture httplpc1clpccdcccauslpcharpellastro20a20deinfo_s09htmInformation httpwwwdaviddarlinginfoencyclopediaSspiculehtml
On this picture you can see spicules Spicules only last for several minutes and can be foundin the chromosphere They are little jets of gas There also exist macrospicules that can be
approximately ten times larger than a normal spicule
832019 Ew Afgewerkte Final
httpslidepdfcomreaderfullew-afgewerkte-final 3659
36
Appendix V The most important satellites observing the sun
Here you can find the most important satellites observing the sun and their missions
Solar and Heliospheric Obseratory (SOHO)
httpsohowwwnascomnasagovaboutabouthtml
SOHO the Solar amp Heliospheric Observatory is a project of international collaboration
between ESA and NASA to study the Sun from its deep core to the outer corona and the solar
wind
SOHO was launched on December 2 1995 The SOHO spacecraft was built in Europe by an
industry team led by prime contractor Matra Marconi Space (now EADS Astrium) under
overall management by ESA The twelve instruments on board SOHO were provided by
European and American scientists Nine of the international instrument consortia are led by
European Principal Investigators (PIs) three by PIs from the US Large engineering teamsand more than 200 co-investigators from many institutions supported the PIs in the
development of the instruments and in the preparation of their operations and data analysis
NASA was responsible for the launch and is now responsible for mission operations Large
radio dishes around the world which form NASAs Deep Space Network are used for data
downlink and commanding Mission control is based at Goddard Space Flight Center in
Maryland
More information about SOHO can be found on
httpsohowwwnascomnasagovaboutdocsSOHO_Fact_Sheetpdf
832019 Ew Afgewerkte Final
httpslidepdfcomreaderfullew-afgewerkte-final 3759
37
Transition Region and Coronal Explorer (TRACE)
httptracelmsalcomProjectMissionmissionhtm
TRACE enables solar physicists to study the connections between fine-scale magnetic fields
and the associated plasma structures on the Sun in a quantitative way by observing the photosphere the transition region and the corona With TRACE these temperature domains
are observed nearly simultaneously (with as little delay as only a second between different
wavelengths) with a spatial resolution of one second of arc
This is accomplished by obtaining precisely coaligned image sequences of photosphere
transition region and corona with high spatial resolution and uninterrupted viewing of the
Sun for up to eight months
TRACE Mission
TRACE explores the magnetic field in the solar atmosphere by studyingbull The 3-dimensional field structure
bull Its temporal evolution in response to photospheric flows
bull The time-dependent coronal fine structure
bull The coronal and transition region thermal topology
TRACE was launched on a Pegasus launch vehicle from Vandenberg Air Force Base in April
1998 The launch was scheduled to allow joint observations with SOHO during the rising
phase of the solar cycle to sunspot maximum No transition region or coronal imager has
witnessed the onset and rise of a solar cycle
Pegasus in flight
The two satellites provide complementary observations TRACE produces the high spatial
and temporal resolution images while SoHO yields images and spectral data out to 30 solar
radii at much lower spatial and temporal resolution Jointly they provide the opportunity to
obtain simultaneous digital measurements of all the temperature regimes of the solar
atmosphere in both high-resolution imaging and spectroscopy
With these data we expect to shatter the current ignorance of coronal heating and impulsive
MHD phenomena with benefits not only to solar physics but also to studies ranging from
stellar activity to the MHD of accretion disks The magnetograms produced by MDI on SoHO
provide a complete record of the eruption and distribution of photosphere magnetic fields
which will be invaluable for understanding TRACE observations of coronal hole formation
and coronal mass ejections Both of these phenomena have profound effects on our space
environment and the Earth`s magnetic field
TRACE is the first US solar research satellite since the Solar Maximum Mission
Coordination with SOHO provides an unprecedented opportunity to follow the emergence of
magnetic flux from the base of the convection zone deep inside the Sun through the
photosphere chromosphere and transitional region to the low-beta outer corona while
observing the effects of this emergence such as coronal mass ejections with high spatial andtemporal resolution
832019 Ew Afgewerkte Final
httpslidepdfcomreaderfullew-afgewerkte-final 3859
38
The transition from the photosphere where magnetic fields and plasma are in rough
equipartition to the corona where magnetic fields dominate is extremely difficult to model
and until recently to observe at high temporal and spatial resolution Many of the physical
problems that arise here such as plasma confinement reconnection wave propagation and plasma heating arise throughout space physics and astrophysics The detailed study of these
processed in the solar outer atmosphere is invaluable to astrophysics in general and stellar
studies in particular
More information about TRACE observations can be found on
httptracelmsalcomOperationsGeneraloperatiohtm
832019 Ew Afgewerkte Final
httpslidepdfcomreaderfullew-afgewerkte-final 3959
39
Reuven Ramaty High Energy Solar Spectroscopic Imager (RHESSI)
httphesperiagsfcnasagovhessibrochurehtm
What Questions will HESSI Address
bull How is such a large amount of energy released so rapidly during a flare
bull How are so many electrons and protons accelerated so quickly to such high energies
bull Where are the electrons and protons accelerated in the solar atmosphere and where do
they deposit their energy
How will HESSI Address these Questions
HESSI shown below will concentrate on electrons and protons accelerated in solar flares
through observations of the X-rays and gamma rays that they produce
bull HESSI will obtain the first ever X-ray and gamma-ray images of flares from 100 keV
to 20 MeVbull HESSI will do the first ever nuclear gamma-ray line spectroscopy of solar flares
bull HESSI will obtain pictures of flares in X-rays with an angular resolution of 2
arcseconds a factor of three better than previously possible
bull HESSI will measure X-ray and gamma-ray spectra with less than 1 keV energy
resolution a factor of 20-40 better than previously possible with scintillation counters
More information about the RHESSIrsquos Mission can be found on
httphesperiagsfcnasagovhessiconcepthtm
832019 Ew Afgewerkte Final
httpslidepdfcomreaderfullew-afgewerkte-final 4059
40
Solar Radiation and Climate Experiment (SORCE)
httplaspcoloradoedusorcesciencebackgroundhtm
The Solar Radiation and Climate Experiment (SORCE) is a NASA-sponsored satellite
mission that is providing state-of-the-art measurements of incoming x-ray ultraviolet visiblenear-infrared and total solar radiation The measurements provided by SORCE specifically
address long-term climate change natural variability and enhanced climate prediction and
atmospheric ozone and UV-B radiation These measurements are critical to studies of the Sun
its effect on our Earth system and its influence on humankind
The SORCE spacecraft was launched on January 25 2003 on a Pegasus XL launch vehicle to
provide NASAs Earth Science Enterprise (ESE) with precise measurements of solar
radiation It launched into a 645 km 40 degree orbit and is operated by the Laboratory for
Atmospheric and Space Physics (LASP) at the University of Colorado (CU) in Boulder
Colorado USA It will continue the precise measurements of total solar irradiance (TSI) that
began with the ERB instrument in 1979 and has continued to the present with the ACRIM series of measurements SORCE will also provide the measurements of the solar spectral
irradiance from 1nm to 2000nm accounting for 95 of the spectral contribution to TSI
SORCE carries four instruments including the Spectral Irradiance Monitor (SIM) Solar
Stellar Irradiance Comparison Experiment (SOLSTICE) Total Irradiance Monitor (TIM) and
the XUV Photometer System (XPS)
The primary goal of the NASA Earth Observing Systems (EOS) SOlar Radiation and Climate
Experiment (SORCE) is to enable solar-terrestrial studies by providing precise daily
measurements of the total solar irradiance (TSI) and the solar spectral irradiance atwavelengths extending from the ultraviolet to the near infrared The following lists the
SORCE science objectives
1 Make accurate measurements with high precision of total solar irradiance connect
them to previous TSI measurements and continue this long-term climate record
Provide TSI with an accuracy of 001 (100 parts per million) based on SI units and
with a long-term repeatability of 0001yr
2 Make daily measurements of the solar ultraviolet irradiance from 120 to 300 nm with
a spectral resolution of 1 nm Achieve this spectral irradiance measurement with an
accuracy of better than 5 and with a long-term repeatability of 05yr Use the
solarstellar comparison technique to relate the solar irradiance to the ensembleaverage flux from a number of bright early-type stars (same stars used by the UARS
SOLSTICE program)
3 Make the first measurements of the visible and near IR solar irradiance with sufficient
precision for future climate studies Obtain daily measurements of solar spectral
irradiance between 03 and 2 microm with a spectral resolution of at least 130 an
accuracy of 003 and a long-term repeatability of better than 001yr
4 Improve the understanding of how and why solar irradiance varies estimate past and
future solar behavior and investigate climate responses
More information about SORCE can be found on
httplaspcoloradoedusorcesciencescience_opshtm
832019 Ew Afgewerkte Final
httpslidepdfcomreaderfullew-afgewerkte-final 4159
41
Appendix VI Wavelengths
httpeosweblarcnasagovEDDOCSWavelengths_for_Colorshtml
As you can see on the figure visible light situates in the centre of the wavelengths having not
the shortest nor the longest wavelengths Gamma rays have the shortest wavelength radioways the longest All sort of wavelengths are used for daily purpose like radio waves for
radio and TV and gamma rays for treatments
832019 Ew Afgewerkte Final
httpslidepdfcomreaderfullew-afgewerkte-final 4259
42
Appendix VII Absorption lines in the sunrsquos spectrum
Picture httpwwwsolarnavigatornetthe_sunhtmExplanation COMINS NF and KAUFMANN III WJ Discovering the universe eighth edition WHFreeman and Company New York 2008 p 109
This photo is called a spectrogram It contains the spectrum of the sun All the black lines are
absorption lines The amount of black lines is related to the amount of elements that the sun
is emitting From a spectrogram we can deduct a lot of things including their mass the
temperature of the surface the chemical composition of the sun rotation rates and much
more
832019 Ew Afgewerkte Final
httpslidepdfcomreaderfullew-afgewerkte-final 4359
832019 Ew Afgewerkte Final
httpslidepdfcomreaderfullew-afgewerkte-final 4459
44
Appendix IX Butterfly-diagram
httpspacesciencespacerefcomsslpadsolarimagesbflygif
A butterfly-diagram
In a butterfly-diagram we can find the sunspots with their latitude (y-axis) through the years(x-axis) As you can see the sunspots appear like lsquobutterfliesrsquo this was discovered in 1904 by
Edward Maunder (1851-1928 an English astronomer best remembered for his study of
sunspots and the solar magnetic cycle) Thatrsquos why this graph is also called Maunders
butterfly diagram
832019 Ew Afgewerkte Final
httpslidepdfcomreaderfullew-afgewerkte-final 4559
45
Appendix X The Wolf-numbers
httpsidcomabenews106sunspotnumberclarifiedpdf
The sunspot number clarified By Petra Vanlommel
Which kinds of daily International Sunspot Numbers (ISN) are currentlypublished by the SIDC
Three daily indices are currently published by the SIDCthe Estimated ISN (EISN)the Provisional ISN (PISN)the Definitive ISN (DISN)Although they are all based on the same type of observations ie visual sunspot counts as ameasure of solar activity they are obtained from different data sets by different processingmethods with different accuracies and they serve different purposes
In the ideal case the three numbers are equal but in practice it is inevitable that there aresmall differences Therefore It is useful to explain what each index actually means
What is the source of the Wolf number
Once per day observers worldwide communicate their measured Wolf number (= 10G + S)based on visual sunspot (S) and group (G) counts to the World Data Center for the SunspotIndex Presently this is done through a dedicated password-protected WEB form the Wolfinterface However some observers still use the old way of reporting their observations onpaper through regular mail This method slows down the final processing but for the sake ofcontinuity in the index it is important to keep these observers included as some of them
represent the longest individual datasetsThe observers give the exact observing time the observing conditions the total numbers(group count sunspot count and Wolf number) and optionally the NorthSouth and centralzone numbers The observers using the web interface can provide their results to the SIDCimmediately after each observation However some users prefer to insert their data as ablock creating some delay but this must be done at least once a month
The personal reduction coefficient K
A personal reduction coefficient K is calculated for each station It has values typically in therange 04 and 17 and leads to a normalized sunspot number K(10G+S) In other words theK factor rescales the raw sunspot counts of each observer to the ones of Rudolph Wolf the
astronomer who introduced the above Wolf formula thus simulating the same eyes sametelescope and same conditionsDuring the procedure for calculating the Provisional ISN the K factor of every station iscomputed for every observation that passes the elimination procedure Once a year apersonal K factor for every station and for every month of the previous year is calculated Ayearly mean K value per station is also computed
The estimated sunspot index
The Estimated ISN (EISN) is calculated and issued on a daily basis for the day of calculationand the day before Only the total EISN is calculated with no hemispheric index It is anautomated procedure and no manual intervention is done The EISN is meant as a quicktemporary and approximate index for real-time applications
832019 Ew Afgewerkte Final
httpslidepdfcomreaderfullew-afgewerkte-final 4659
46
We use the raw Wolf number from all observatories that have provided counts early in theday ie before 1230 UT Typically there is between 10 and 20 stations available Thecalculation of the EISN is based on a simple and straightforward statistical method The Wolfnumbers are multiplied with the yearly mean K factor (see paragraph about the personalreduction coefficient K) The EISN is a simple average of the K-scaled values after excludingany individual value that deviates abnormally from the other valuesOnce the Provisional ISN (PISN) is calculated after the end of a month the temporary EISNis dropped and replaced by the PISN
The provisional sunspot Index
The Provisional ISN (PISN) is calculated and issued on the first of every month Theoutcome is a daily total and hemispheric sunspot number for the entire elapsed month Anexample on the first of September we calculate the daily PISN for each day of August ThePISN is computed semi-automatically with as little manual intervention as possibleTo calculate the PISN values for the concerned month we use all Wolf numbers Typicallythere is data from around 65 stations available
The calculation of the PISN is based on an extensive statistical treatment This treatmentfilters out any abnormal daily observation or the complete data set from an erratic station(quality control) This prevents long-term drifts in the resulting index One of the key elementsderived from this processing is to update the K reduction coefficients for each station theevolution of each station is monitored for each day relative to the entire networkA subset of the contributing stations also provides hemispheric counts A similar process isapplied to the North and South counts to derive the hemispheric PISN There is an additionalconstraint the sum of the North and South ISN must match the total ISNThe PISN replaces the EISN And once the Definitive ISN (DISN) is calculated the DISNreplaces the PISN
The definitive sunspot index
The Definitive ISN is calculated and issued on a quarterly basis when we have collecteddata from all the contributing observatories This is the final index and it is appended to thehistorical sunspot index time series The same semi-automated treatment as for the PISN isnow applied to the full data set If the result agrees within 5 of the PISN value the PISN iskept and becomes definitive Otherwise the new calculated value replaces the PISN andbecomes the definitive ISNIt is only at this stage and only in peculiar situations that a manual verification by ourscientific staff is required For example this happens when the observed raw Wolf valuesfrom the whole network are clustered around two distinct values This special case can becaused by small short-lived isolated sunspots (lifetimes lt 24 hours) or by the appearance ordisappearance of a large group at the solar limb in the course of one UT dayThe DISN replaces the provisional and estimated International Sunspot Number
Handling very low activity levels
One of the situations requiring a human arbitration is associated with single small isolatedand short-lived sunspots This is most noticeable around the minimum of the solar activitycycle like the one occurring now in 2008 Due to the 24hour binning (observations aregrouped between 0hUT and 24hUT) and the variable ability of each observer to detect thesmallest sunspots we end up with some stations reporting one sunspot and others who didno see any sunspot Let us explain further No sunspot may mean that the sunspot waspresent but the observer was unable to see it because of poor observational conditions such
as weather a small telescope On the other hand it may also indicate that the sunspot hadactually vanished by that time while it was present earlier on the same day
832019 Ew Afgewerkte Final
httpslidepdfcomreaderfullew-afgewerkte-final 4759
47
Individual stations do not observe at exactly the same timeIn order to validate the existence of such a marginal reported sunspot a qualified SIDCscientist must then check the detailed chronology within that day and consider the overallobserver capability (value of K coefficient)In common practice the fact that a sunspot is reported by a significant group of observersleads to the inclusion of the sunspot on that date thus neglecting the no-sunspotobservationsThe rationale is multiple observations of a sunspot exclude the possibility that the reportedsunspot was an independent false detection So a sunspot was really present on that dayalthough it may have existed only for part of the day or it was small enough to be missed bypart of the observers with smaller instruments or imperfect atmospheric conditionsAlso keep in mind that the sunspot index is derived with a limited precision just like any otherindex If the monthly mean sunspot number is 0 or 05 you can definitely say that activitywas low
What index should be used
If you want to perform long-term investigations the definitive ISN series is definitely the mostsuitable However there is a delay of a few months So when investigating the last cycle andrecent evolution use the definitive numbers in combination with the provisional ISN to be upto date to the last month The provisional numbers are also used in models forecasting thesunspot number for the coming months Now if you need a proxy for solar activity in a modelthat runs in real-time then you may use the estimated ISNImprovements and rethinking of the processing method is an ongoing project We arecurrently developing an alternative program for calculating the PISN Of course long-termconsistency is vital Therefore a cross-analysis between the output from the old and newsoftware must be applied over an extended period
832019 Ew Afgewerkte Final
httpslidepdfcomreaderfullew-afgewerkte-final 4859
48
Above graphs show different kinds of the International Sunspot Number The left plot gives an overview from 1700 up to now from the yearly (black) and monthly smoothed Sunspot Number The graph in the right top corner shows the monthly and monthly smoothed sunspot number while the graph in the right bottom corner show the daily monthly smoothed monthly sunspot number For every the time range of investigation there is an appropriate sunspot number
832019 Ew Afgewerkte Final
httpslidepdfcomreaderfullew-afgewerkte-final 4959
49
Appendix XI Filaments and prominences
httpsohowwwnascomnasagovpickoftheweekold26feb2004
This is a picture taken by SOHO on 26 February 2004
832019 Ew Afgewerkte Final
httpslidepdfcomreaderfullew-afgewerkte-final 5059
50
Appendix XII The reconnection of magnetic loops
httpwwwioporgEJarticle0004-637X558287253575webpdfrequest-id=73e38daa-69ae-4e01-b9a6- b4bd0ba071dd
In (a) sunspot B and C have different polarity and move towards each other The twomagnetic loops will reconnect and form one big magnetic loop showed in (b) This will
happen to other magnetic loops too as can be seen in (c) When G en F are close enough they
will reconnect and so E en H will reconnect too It is possible that the magnetic field line is
trapped around another in this case AD The mass ejected from the sun will be trapped
between the magnetic field lines and form a solar prominence
832019 Ew Afgewerkte Final
httpslidepdfcomreaderfullew-afgewerkte-final 5159
832019 Ew Afgewerkte Final
httpslidepdfcomreaderfullew-afgewerkte-final 5259
52
httptheinvisibleagentwordpresscom20090117amazing-celestial-images
An group of active prominences
httpapodnasagovapodap051109html
httpwhassupinthemilkywayblogspotcom200903cloudy-planhtml
A picture taken by SOHO In the left corner you can see the prominence with twisted
magnetic field lines
832019 Ew Afgewerkte Final
httpslidepdfcomreaderfullew-afgewerkte-final 5359
53
Appendix XIV Polar crown
httpsciencenasagovheadlinesy200817sep_polarcrownhtm
Photograph of a polar crown taken on 13 June 1999 by the Meudon Observatory
832019 Ew Afgewerkte Final
httpslidepdfcomreaderfullew-afgewerkte-final 5459
54
Appendix XV Coronal holes
httpsunearthdaynasagov2007multimediagal_020php
The black segment is a huge coronal hole The bright parts are x-rays from sunspots
832019 Ew Afgewerkte Final
httpslidepdfcomreaderfullew-afgewerkte-final 5559
55
Appendix XVI Coronal mass ejection
httpzuserver2staruclacuk~idhapodap000309html
Picture of a CME taken by SOHO in February 2000
832019 Ew Afgewerkte Final
httpslidepdfcomreaderfullew-afgewerkte-final 5659
56
Bibliography
Books
BEATTY JK PETERSEN CC and CHAIKIN A The new solar system fourth edition
Cambridge University Press Cambridge 1999 421 p
COMINS NF and KAUFMANN III WJ Discovering the universe eighth edition WH
Freeman and Company New York 2008 535 p
DETHIER T Het zonnestelsel Standaard Uitgeverij 1992 415 p
GOLUB L and PASACHOFF JM Nearest star the surprising science of our sun Harvard
university press Harvard 2001 267 p
GREEN SF and JONES M H An introduction to the Sun and Stars The Open University
Cambridge 2004 373 p
HILL S and CARLOWITZ M The sun Abrams New York 2006 239 p
HOLMAN GD lsquoThe mysterious origins of solar flaresrsquo Scientific America April 2006 p
24-31 volume 294 number 4
JANSSENS J Zon en aarde een unieke relatie Garant Antwerpen 2003 254 p
KELLER H-U Van Supernovarsquos tot zwarte gaten Tirion Natuur AH Baarn 2003 169 p
LANG KR Sun earth and sky Springer Germany 1995 282 p
LILENSTEN J and BORNAREL J Sous les feux du soleil EDP Sciences Les Ulis Cedex
A 2001 247 p
832019 Ew Afgewerkte Final
httpslidepdfcomreaderfullew-afgewerkte-final 5759
57
Articles
CUYPERS J and others lsquoLa rechercheacute en heacuteliophysique en Belgiquersquo Space connection
October 2007 20 p
DE KEYSER J lsquoDe magnetopauzersquo Heelal maart 1998 p 66-73
JANSSENS J lsquoHet maximum van de 23ste zonnevlekkencyclus (I)rsquo Heelal Oktober 1998 p
256-263
JANSSENS J lsquohet maximum van de 23ste zonnenvlekkencyclus (II)rsquo Heelal November
1998 p 284-290
JANSSENS J lsquoZonnefakkelsrsquo Heelal Oktober 1994 p 256-261
SMITS F lsquoDe coronarsquo Heelal Februari 1999 p 40-42
SMITS F lsquoProtuberanzenrsquo Heelal Juli 1991 p 182-185
VAN DEN BERGHE S lsquoHet Zeemaneffectrsquo Heelal September 1998 p 228-231
832019 Ew Afgewerkte Final
httpslidepdfcomreaderfullew-afgewerkte-final 5859
58
Webography
BOEN B Birth of a coronal mass ejection Internet
(httpwwwnasagovmission_pagessolar-b solar_005html) 290408
BRAEUNIG R A Glossary Internet (httpwwwbraeunigusspaceglossaryhtm) 2006
CORDIS Researchers reveal why Suns atmosphere is hotter than its surface Internet
(httpcordiseuropaeusearchindexcfmfuseaction=newsdocumentampN_LANG=ENampN_R
CN=30598amppid=0ampq=87F36474805A6BEC0B89404F72D0351Famptype=sim) 20032009
DAY C Alfveacuten waves may heat the Sunrsquos corona Internet
(httpblogsphysicstodayorgupdate200903 alfven-waves-may-heat-the-sunshtml)
310309
ELLERMAN F Solar prominences Internet (httparticlesadsabsharvardedufull
1928ASPL173E 0000074000html) (03042009)
ENCYCLODPEDIA OF SCIENCE Corona hole Internet
(httpwwwdaviddarlinginfoencyclopediaC coronal_holehtml) (04042009)
HATHAWAY D H The sunspot cycle Internet
(httpspacesciencespacerefcomsslpadsolarsunspots htm) 04012000
JANSSENS J The case of the missing solar cycle (published in lsquoheelalrsquo January 2008)
Internet (httpuserstelenetbejjanssensMSCwebEngpdf)
KNISELY D Solar prominences Internet
(httpwwwicstarscomHTMLSolarSectionHAlphaOBSERVINGTHESUNHAlpha3html)
(03042009)
KOPANSKI J Atom Internet (httpknolgooglecomkjan-
kopanskiatom1amrwrct7rvi27) 060209
MARTENS PC and ZWAAN C Origin and evolution of filament-prominence systems
Internet (http wwwioporgEJarticle0004-637X558287253575webpdfrequest-
id=73e38daa-69ae-4e01-b9a6-b4bd0ba071dd) 092001
NASA The corona Internet (httpsolarsciencemsfcnasagovcoronashtml) 180107
NASA The heliosphere Internet (httpheliosgsfcnasagovheliosphhtml) 20012009
OFFICIAL SITE OF STONEHENGE About Stonehenge Internet
(httpwwwstonehengecouk) (03022009)
OTTERSDORF M Astronomy On the sunspot cycle Internet
(httpuserszoominternetnet~matto MCASsunspot_cyclehtmZeemaneffect) 031103
PARIAT E and SCHMIEDER B Magnetic flux emergence Internet(httpwwwscholarpediaorgarticleMagnetic_field_emergence) 18042008
832019 Ew Afgewerkte Final
httpslidepdfcomreaderfullew-afgewerkte-final 5959
59
PRIEST E R Dynamics and Structure of Quiescent Solar Prominences Internet
(httpbooksgooglebe booksid=h599q3jz1w4Campdq=quiescent+prominencesampprintsec=fro
ntcoverampsource=blampots=58b79Qeyabampsig=1eklQ-
WszOIebZZaq7fq7gm6bxAamphl=nlampei=urPtSe7ZCo61-
Qa166jHDwampsa=Xampoi=book_resultampct=result ampresnum=3PPA6M2) 1989
RUSSELL R Rotation of the sun Internet
(httpwwwwindowsucaredutourlink=sunSolar_interior
Sun_layersdifferential_rotationhtml) 16082005
RUSSELL R Sunspots and magnetic fields Internet
(httpwwwwindowsucaredutourlink=sunatmospheresunspot_magnetismhtmlampedu=hig
h) 060908
UNIVERSITY OF GLASGOW Bibliography of Peter Sweet Internet
(httpwwwuniversitystoryglaacuk biographyid=WH2144amptype=P) (10042009)
WIKIPEDIA Orbiting Solar Observatory Internet
(httpenwikipediaorgwikiOrbiting_Solar_Observatory) 24012009
WINDOWS TEAM Maunderrsquos Butterfly Diagram Internet
(httpwwwwindowsucaredutourlink=sun activitybutterflyhtml) 2000
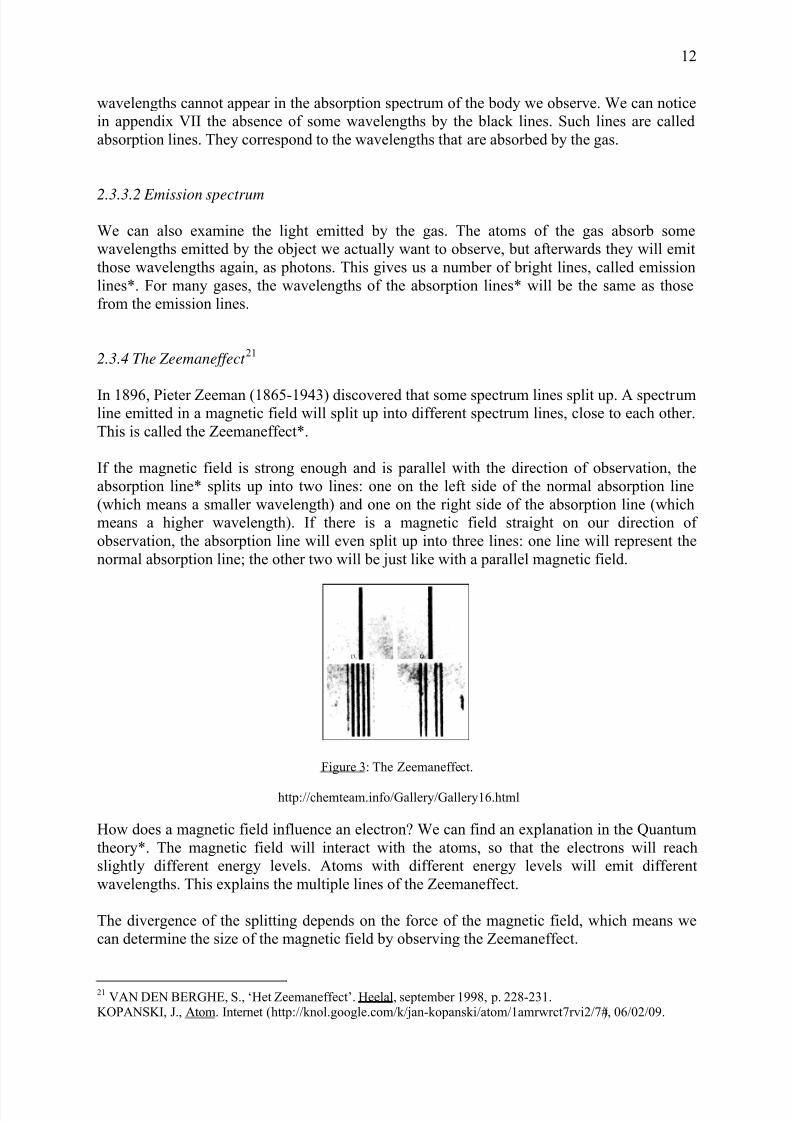
832019 Ew Afgewerkte Final
httpslidepdfcomreaderfullew-afgewerkte-final 1359
13
Chapter 3 The solar cycle
31 Introduction
In this chapter we will concentrate on the long term evolution of the global magnetic field of
the sun It is important to understand the long-term evolution of the global magnetic field of the sun because the global magnetic field has a great influence on the magnetic field on a
local scale The sunrsquos magnetic field changes every 11 years This is why we call it the 11-
year-solar cycle However strictly speaking it is a 22-year-cycle This will be explained later
on in this chapter The record of the first solar cycle started in 175522 Since then itrsquos
currently already the 24th solar cycle
32 Differential rotation
As well as the earth the sun rotates But the sun isnrsquot made of the same matter as our earth on
the surface The sunrsquos surface is made of plasma Because of the plasma the sun will rotateat different speeds depending on latitude At the equator the sun makes a full rotation every
25 days But the rotation will slow down when the latitude increases This means that at the
poles the sun will rotate much slower At the poles the rotation time is 36 days This creates a
gap of more than 10 days23
Astronomers believe that it is only the surface of the sun that undergoes differential rotation
The inner core moves more like a solid body such as the earth but it is still unclear if this is
the case24
33 When the years passhellip25
Differential rotation is the main cause of all the complex phenomena that will be discussed
later on because this differential rotation causes the solar cycle and magnetic disturbance
As mentioned previously before the sunrsquos surface rotates much faster at the equator than at
the poles the plasma around the equator will move faster This is shown in figure 4 on the
next page Since the sun keeps on rotating in the same direction the plasma at the equator will
move much faster26
The magnetic field that the sun normally would have is the same type as the magnetic field of the earth This means the sun normally has the magnetic field resembling to the magnetic field
of a bar magnet Magnetic field lines move from north to south and at the poles the density of
the magnetic field is compact because there the magnetic field lines come together
22 JANSSENS J The case of the missing solar cycle (published in lsquoheelalrsquo January 2008) Internet (httpusers
telenet be jjanssensMSCwebEngpdf)23
DETHIER T Het zonnestelsel Standaard Uitgeverij 1992 p 77-7824
RUSSELL R Rotation of the sun Internet (httpwwwwindowsucaredutourlink=sunSolar_interiorSun_layersdifferential_rotationhtml) 1608200525 CUYPERS J and others lsquoLa rechercheacute en heacuteliophysique en Belgiquersquo Space connection October 2007 p
6-726GREEN SF and JONES M H An introduction to the Sun and Stars The Open University Cambridge
2004 p 72-73
832019 Ew Afgewerkte Final
httpslidepdfcomreaderfullew-afgewerkte-final 1459
14
Figure 4 The magnetic field lines of the sun change because of the differential rotation
httpircameraasarizonaeduNatSci102lecturessunhtm
If we apply the differential rotation on this magnetic field the magnetic field lines under the
photosphere of the sun will move faster at the equator This will cause the following
structure seen on figure 4 on the sun in the middle The magnetic field lines will continue to
get mixed up and the magnetic field lines will pile up This process takes several years
Finally the magnetic field lines will be stacked almost parallel to the sunrsquos equator This is
the sun on the right side in figure 427 You can find a more specific drawing of this process in
appendix VIII
Eventually after approximately eleven years the magnetic field lines will be piled up in such
a way that finally the magnetic field lines will start to pop out of the sunrsquos surface This willcause sunspots Sunspots appear in pairs one with a south ldquopolerdquo and one with a north
ldquopolerdquo The north ldquopolerdquo contains magnetic field lines that are directed outwards and the south
ldquopolerdquo contains magnetic field lines that point inwards28 Sunspots are discussed in more
detail in the next chapter When the sunspots almost come to an end the loops will reconnect
with another sunspot over the equator This connection will cause a switch of the poles (see
figure 5) The South Pole will become the North Pole and vice versa This model is called the
magnetic dynamo proposed by Horace Babcock (1912-2003)29
27GREEN SF and JONES M H An introduction to the Sun and Stars The Open University Cambridge
2004 p 72-7328 LANG KR Sun earth and sky Springer Germany 1995 p 8229
COMINS NF and KAUFMANN III WJ Discovering the universe eighth edition WH Freeman andCompany New York 2008 p 297-298JANSSENS J lsquohet maximum van de 23ste zonnenvlekkencyclus (II)rsquo Heelal November 1998 p 284
832019 Ew Afgewerkte Final
httpslidepdfcomreaderfullew-afgewerkte-final 1559
15
Figure 5 The switching of the magnetic poles of the sun
GREEN SF and JONES M H An introduction to the Sun and Stars The Open University Cambridge 2004 p73
When finally the poles have switched and the magnetic field lines are disentangled the cycle
will just start over again for another eleven years Because the magnetic poles of the sun
switch every eleven years the cycle is called the 11-year-solar cycle
34 Other cycles
341 The 22-year-cycle
If we take the magnetic poles into account however the 11-year-cycle becomes a 22-year-
cycle because the magnetic poles switch If we want to consider the strict cycle which means
that we take the magnetic poles into account we have to call the solar cycle a 22-year-cycleIt takes eleven years to switch the magnetic North Pole into a South Pole and another eleven
years to switch them back This cycle is called the Hale-cycle named after George Ellery
Hale (1868-1938) who was an American solar astonomer and active in different
observatories30
342 The 27-day-cycle31
The 27-day-cycle taking the average of the sunrsquos rotation time is a cycle that is directly
connected to the rotation time of the sun The sunspots the coronal holes and other
phenomena that are related to the activity of the sun rotate too This means that the activity of the sun is connected to the rotation cycle For example the part of the sun that we can see will
be less active when the sunspots are not visible because the sunspots influence the solar
activity When the sunspots appear again the activity of the sun will rise This cycle is also
known because of the coronal holes that influence the solar wind
30JANSSENS J lsquohet maximum van de 23
stezonnenvlekkencyclus (II)rsquo Heelal November 1998 p 284-290
31 JANSSENS J Zon en aarde een unieke relatie Garant Antwerpen 2003 p 113
832019 Ew Afgewerkte Final
httpslidepdfcomreaderfullew-afgewerkte-final 1659
16
343 Other cycles
Astronomers believe that there must be some other cycles of an even longer basis Different
researchers have been looking for other solar cycles Some thought they found a 55-year
cycle However this cycle was very irregular Max Waldmeier (1912-2000 a very eminent
solar astronomer of the 20th
century) found a 90-year-cycle However lots of other cycleshave been ldquofoundrdquo There have been postulated a 2300-year-cycle too But the records of
solar cycles are too recent to prove this cycle 32
35 Solar maximum and minimum
The Royal Greenwich Observatory has been observing the sunspots since 1874 The
information of their observations includes the size the position and the number of sunspots
during all the recorded solar cycles If we put all this information into a graph we can see the
so-called butterfly-graph (appendix IX) With this information we can conclude that sunspots
do not appear at random33
At the beginning of a new solar cycle the first sunspots appear at latitude of 45 degrees Later
on sunspots will appear at the equator too When the sunspots begin to appear at 45 degrees a
new cycle has started again34 The solar minimum is the starting point of the solar cycle At
the beginning sunspots are very rare sometimes there are none If there are any sunspots they
will occur at higher latitudes The solar activity is the least on solar minimum Then it is a
good time for astronauts to go into space because there are less sunspots and less solar flares
and other phenomena that can influence the solar wind and so the space weather When the
solar activity is the highest the solar cycle reaches its maximum There will be a lot of
sunspots which now occur on lower latitudes too35 The time to go from a solar minimum to a
solar maximum is around four years During this time the solar activity will rise and when it
reaches its maximum it will slowly decline The decrease takes much more time than the
increase of the solar activity around 7 years The time between a solar minimum and
maximum and between a solar maximum and minimum can vary and is different for every
solar cycle36
36 Mysteries of the solar cycle
Astronomers have been able to find out a lot of details about the solar cycle However we are
still not able to predict the maximums and minimums of the solar cycles preciselyAstronomers havenrsquot been capable to draw up a model that allows us to predict the exact
number of sunspotshellip You can compare it to predictions for the weather to comehellip
32JANSSENS J Zon en aarde een unieke relatie Garant Antwerpen 2003 p 113-114
33HATHAWAY D H The sunspot cycle Internet (httpspacesciencespacerefcomsslpadsolarsunspots
htm) 0401200034 JANSSENS J Zon en aarde een unieke relatie Garant Antwerpen 2003 p 10335
WINDOWS TEAM Maunderrsquos Butterfly Diagram Internet (httpwwwwindowsucaredutourlink=sunactivitybutterflyhtml) 200036 JANSSENS J Zon en aarde een unieke relatie Garant Antwerpen 2003 p 99-100
832019 Ew Afgewerkte Final
httpslidepdfcomreaderfullew-afgewerkte-final 1759
17
Chapter 4 Phenomena caused by the magnetic field of the sun
41 Sunspots
411 What are sunspots
Sunspots appear on the sunrsquos surface when the magnetic field lines under the photosphere
are piled up too much and they finally pop out into the chromosphere Sunspots are normally
found in groups The number of sunspots is dependent on the solar activity when the solar
activity reaches its maximum there will be many more sunspots than at solar minimum
Measuring the magnetic field in sunspots with the Zeemaneffect makes clear that the
strength of the magnetic field is much stronger in sunspots than in the surrounding
photosphere Itrsquos more than thousand times stronger the magnetic field strength in magnetic
fields varies from 1000 to 4000 Gauss while the surrounding area circles around 1 Gauss
(comparison the earthrsquos magnetic field strength is about 05 Gauss)37
412 What do sunspots look like
When magnetic field lines pop out of the photosphere they will form magnetic loops (figure
6 on the right side) Between this magnetic loops there will be formed a flux tube The
magnetic field lines in the sunspot will distort the convection under the surface (see figure 6
on the left side) They will pull the plasma downwards and will prevent the warm plasma
from going upwards and reach the sunrsquos surface Eventually the temperature in the sunspot
will cool down38
Figure 6 Left side convection in sunspotsRight side magnetic field lines in sunspots
JANSSENS J Zon en aarde een unieke relatie Garant Antwerpen 2003 p41
37
RUSSELL R Sunspots and magnetic fields Internet (httpwwwwindowsucaredutourlink=sunatmospheresunspot_magnetismhtmlampedu=high) 06090838 JANSSENS J Zon en aarde een unieke relatie Garant Antwerpen 2003 p 40-41
832019 Ew Afgewerkte Final
httpslidepdfcomreaderfullew-afgewerkte-final 1859
18
We can distinguish 2 areas the black sunspot and the surrounding bright surface of the sun
The sunspot itself consists of the very dark centre called the umbra and the surrounding
orange-brown environment called the penumbra The penumbra consists of an amount of
small little striated f igures that come out of the umbra A sunspot can reach a diameter of
300 000 kilometres39 The temperature in the sunspots centre is much cooler than in the
photosphere because of the convection explained above It measures around 4 200 K whilethe photosphere has a temperature of 6000 K40
Figure 7 The composition of a sunspot
httpwwwjaxajparticlespecialastroshimizu02_ehtml
A sunspot appears black to our eyes However appearances are deceptive the dark sunspot
only seems dark because we see it against a much warmer environment If we h ad seen itagainst a black surface it would have been much brighter than the moonrsquos glowing41
The amount of sunspots varies from very few till over more than a hundred The amount of
sunspots can be predicted by the Wolf-numbers named after Johann R udolf Wolf (1816-
1893) a Swiss astronomer best known for his research on sunspots42 However I wonrsquot
explain this method in this paper You can find a briefly explanation in appendix X Yet this
method is only capable to predict the amount of sunspots approximately
42 Prominences
421 What is a prominence
The luminosity of the sun outshines lots of phenomena that take place on the surface of the
sun and even far away from the sun The sunrsquos corona is one example But luckily
prominences are quite visibly when we observe the sun A prominence is a huge cloud of gas
that is cooler than his environment It is trapped between two horizontal magnetic field lines
For human eyes it seems to spread out dark but this is only because a prominence has a much
39 LILENSTEN J and BORNAREL J Sous les feux du soleil EDP Sciences Les Ulis Cedex A 2001 p 3540 OTTERSDORF M Astronomy On the sunspot cycle Internet (httpuserszoominternetnet~matto
MCASsunspot_cyclehtmZeeman effect) 03110341JANSSENS J Zon en aarde een unieke relatie Garant Antwerpen 2003 p 41
42 JANSSENS J lsquoHet maximum van de 23ste zonnevlekkencyclus (I)rsquo Heelal October 1998 p 256-263
832019 Ew Afgewerkte Final
httpslidepdfcomreaderfullew-afgewerkte-final 1959
19
lower temperature then the sunrsquos chromosphere (similar to sunspots which spread out dark
too) The dark lines in appendix XI are also known as filaments A filament is a line between
to magnetic fields with opposite polarities (appendix XI)43
Figure 8 A solar prominence
httpcosmic-webcoukp=274more-274
422 What is a prominence made of
The gas from the prominence is coming from the chromosphere So the prominences have
approximately the same composition as the chromosphere A good way to observe
prominences is to use red Hα or blue Hβ spectrum lines Hα absorption lines indicate a
temperature lower than 10 000 Kelvin These spectrum lines justif y that the temperature of a prominence is remarkably lower than the temperature of the corona 44
423 How do prominences originate
A prominence is a result of the magnetic field Particles of the sun can transport warmth very
fast if they move alongside magnetic field lines If they want to move straight to a magnetic
field line the transport of warmth is negligible So prominences that are trapped between 2
magnetic fields only have one way to be heated This brings on a temperature that is notably
lower then the temperature in the corona45
The origin of prominences is similar to the origin of solar flares When two magnetic loops
of opposite polarity start to approach each other they will reconnect and form some new
loops This is shown in appendix XII Some mass from the sun will be trapped between the
new magnetic field lines and will form a solar prominence 46
43COMINS NF and KAUFMANN III WJ Discovering the universe eighth edition WH Freeman and
Company New York 2008 p 29944 SMITS F lsquoProtuberanzenrsquo Heelal Juli 1991 p 18345 LANG KR Sun earth and sky Springer Germany 1995 p 134-14046
MARTENS PC and ZWAAN C Origin and evolution of filament-prominence systems Internet ( httpwwwioporgEJarticle0004-637X558287253575webpdfrequest-id=73e38daa-69ae-4e01-b9a6- b4bd0ba071dd) 092001
832019 Ew Afgewerkte Final
httpslidepdfcomreaderfullew-afgewerkte-final 2059
20
424 What do prominences look like47
4241 Different groups of prominences
As you can see on the pictures in appendix XIII prominences can have different shapes and
forms Thatrsquos why astronomers classify them into different groups the quiescent prominences the active prominences and eruptive prominences
4242 Quiescent prominences
Quiescent prominences can appear everywhere on the sun and are not depending on latitude
They can reach into the corona over 2 500 till 40 000 kilometres Quiescent prominences last
the longest of all prominences Some of them even last several solar rotations long These
prominences are very long and not so wide During its lifetime a quiescent prominence moves
slowly to the poles When they are found at the poles of the sun they are called a lsquopolar
crownrsquo (appendix XIV)48
4243 Active prominences
Their name already suggests where they can be found active prominences are found in the
active regions of the sun moreover in the presence of sunspots These prominences
however only have a short lifespan only several hours But within this short lifespan they do
change form adjusting to the magnetic field lines within a short period of time Because
these prominences are located in active regions there are many more reconnections and so
the form will change more rapidly
4244 Eruptive prominences
These prominences only last a couple of minutes and are connected to active sunspots as well
It is possible that after one died out another immediately gives birth in the same region Other
eruptive prominences are known to be bubbles of gas that are issued from active sunspots
There have been some records of eruptive prominences that bump into other prominences and
push the other prominences back in the sunspot49
47 KNISELY D Solar prominences Internet (httpwwwicstarscomHTMLSolarSectionHAlpha OBSERVINGTHESUNHAlpha3html) (03042009)
SMITS F lsquoProtuberanzenrsquo Heelal Juli 1991 p 182-185
ELLERMAN F Solar prominences Internet (httparticlesadsabsharvardedufull 1928ASPL173E0000074000html) (03042009)48
KNISLEY D Solar prominences Internet (httpwwwicstarscomHTMLSolarSectionHAlphaOBSERVINGTHESUNHAlpha3html) (03042009)49 PRIEST E R Dynamics and Structure of Quiescent Solar Prominences Internet (httpbooksgooglebe
booksid=h599q3jz1w4Campdq=quiescent+prominencesampprintsec=frontcoverampsource=blampots=58b79Qeyabampsig=1eklQ-WszOIebZZaq7fq7gm6bxAamphl=nlampei=urPtSe7ZCo61-Qa166jHDwampsa=Xampoi=book_resultampct=resultampresnum=3PPA6M2) 1989
832019 Ew Afgewerkte Final
httpslidepdfcomreaderfullew-afgewerkte-final 2159
21
43 Coronal holes50
When looking at the sun with an x-ray telescope we can see dark regions across the sun
These dark regions are called coronal holes Coronal holes have an open magnetic field
structure This means that the magnetic fields lines do not angle downwards but they extend
into space indefinitely Due to this the particles of the sun are capable to reach out far intospace without any struggles against the magnetic field With this outflow of gases from the
sun coronal holes are one of the most important sources of the (high-speed) solar wind
(appendix XV)
44 Corona loops
441 What is a corona loop
If we look closer at a pair of sunspots we can see an emission of plasma alongside
magnetic field lines that originate in the sun spots A corona loop can extend into the coronaas the name suggests Those loops contain plasma that can reach a temperature higher than
106 Kelvin Corona loops can best be observed by ultra-violet and x-ray images because of
the high temperature The high temper ature brings on a high vibration of the atoms This
trembling causes the emission of x-rays51
Figure 9 A close up of corona loops
httpwwwdaviddarlinginfoencyclopediaCcoronal_loophtml
442 Where and when do corona loops originate
The magnetic field lines of sunspots move outwards from the sun into the corona and form
broad loops This makes it possible to trap hot gas with a temperature up to 40 million K
Those magnetic field loops trap hot plasma into the sunrsquos atmosphere The magnetic force
pushes particles around along the magnetic lines but at the same time the atoms circulate
around the magnetic field lines (see figure 10) The speed of their movements depends on the
50
ENCYCLODPEDIA OF SCIENCE Corona hole Internet (httpwwwdaviddarlinginfoencyclopediaC coronal_holehtml) (04042009)51 JANSSENS J Zon en aarde een unieke relatie Garant Antwerpen 2003 p 52-54
832019 Ew Afgewerkte Final
httpslidepdfcomreaderfullew-afgewerkte-final 2259
22
density of the magnetic field So if a particle moves from the top of a loop to the bottom it
will slow down just like in traffic jams Eventually it will reach the bottom but the bottom is
highly compressed (because the magnetic field lines converge at the bottom of the loops) so
that the particle will be shot back along the magnetic field line (see figure 10)
Figure 10 the movement of particles in corona loops
GD HOLMAN lsquoThe mysterious origins of solar flaresrsquo Scientific America April 2006 p24-29 volume 294number 4
Hence the particles will move up and down along the magnetic field lines Atoms that are
charged the same will cause electric currents (just like in a battery) These currents will
generate a new magnetic field and the old magnetic field in combination with the new one
will cause a high distortion in the magnetic field of the sun This is the moment when the
corona loop will transform into a solar flare
45 Solar flare52
451 What is a solar flare
A solar flare is a sudden powerful explosion in the solar atmosphere caused by a disruption
in the magnetic field of the sun Because of the disruption mass from the sun will be movedup and form a solar flare A solar flare can equal the energy of billions of atomic bombs
within a few minutes The strongest solar flares are measured during the solar maximums
because then the sunrsquos magnetic activity is the strongest53 Since the sunspots in the presence
of solar flare have a very high magnetic field it is likely that a solar flare would even have a
higher magnetic field But in reality the magnetic field of a solar flare is only half of the
magnetic field of a sunspot The intensity of the magnetic field is lsquoonlyrsquo 500 Gauss54
52 HOLMAN GD lsquoThe mysterious origins of solar flaresrsquo Scientific America April 2006 p 24-31 volume
294 number 453JANSSENS J Zon en aarde een unieke relatie Garant Antwerpen 2003 p 55-57
54 JANSSENS J lsquoZonnefakkelsrsquo Heelal Oktober 1994 p 256
832019 Ew Afgewerkte Final
httpslidepdfcomreaderfullew-afgewerkte-final 2359
23
Figure 11 You can see the magnetic fieldlines in the solar flare on the right side
Large solar flare recorded by SOHO EIT304 instrument 512x512 version Animation (980kMPEG) CourtesySOHO(ESAampNASA)
httpwwwteachersparadisecomencyenwikipediassusunhtml
452 Where and how do sun flares originate
Astronomers have long been speculating how solar flares exactly originate In 1992 Satoshi
Masuda (graduated at the University of Tokyo) discovered on pictures of the Japanese
Yohkoh Satellite that the far end of a solar flare emitted unusually short wavelengths very
short x-rays The source must be a concentration of gas with a temperature of about 100million K concluded Masuda But this discovery provoked some new questions why was the
high temperature at the top of the flare and not at the bottom where the gas is more compact
Why does the plasma stay confined instead of spreading out into the universe In order to
obtain more information to try to solve this problem astronomers started observing the sunrsquos
radiation of ultraviolet and x-rays frequently In 2002 NASA even launched the RHESSI
(Ramaty High Energy Solar Spectroscopic Imager) which was intended to bring solar flares
into pictures55
These observations provided evidence that sun flares surge up in regions where the magnetic
field is very strong ndashmost common in the presence of sun spots At this point we have to call
over the corona loops As mentioned before corona loops are electric currents of atoms
which move alongside magnetic field lines When the atoms are shot back alongside the
magnetic field line there seems to occur a distortion of the magnetic field This distortion will
end up in a solar flare All the mass of the corona loop will be shot into space and form a solar
flare
But how can such enormous mass of the solar flares be shot into s pace This has been a very
interesting question However Peter Alan Sweet (1921-2005)56 succeeded in finding an
55 GD HOLMAN lsquoThe mysterious origins of solar flaresrsquo Scientific America April 2006 p 27 volume 294
number 456UNIVERSITY OF GLASGOW Bibliography of Peter Sweet Internet (httpwwwuniversitystoryglaacuk
biographyid=WH2144amptype=P) (10042009)
832019 Ew Afgewerkte Final
httpslidepdfcomreaderfullew-afgewerkte-final 2459
24
answer already in 1956 If magnetic field lines break apart and then reconnect they bring
together two opposing fields that will cancel each other and cause a huge burst of energy The
reconnection will create new magnetic field lines This reconnection is called the Sweet-
Parker reconnection Yet this is a slow reconnection which cannot take place at the base of a
solar flare with a dazzling speed Fortunately Harry P Petschek published an article about
reconnection in 1964 and solved that problem under certain circumstances it is possible toreconnect much faster which explains solar flares This faster reconnection is also called the
Petschek reconnection But unfortunately with the current technology it is not yet possible to
take pictures of those reconnections57
If the energy comes from the reconnection then where does this reconnection take place
From pictures of solar flares astronomers discovered that at the top of the corona loop a
mysterious x-ray source was found The x-ray source began to give a higher energy level and
at the same time the particles move down towards the sunrsquos surface Yet the x-ray source
stays at the same placehellipThen when the x-rays reach their maximum the loop suddenly
changes direction But this time the x-ray source will move upwards too unexpectedly it
moves at the speed of light approximately three hundred thousands kilometres an hour awayfrom the sun This is the same speed as the coronal mass ejections
46 Coronal mass ejections
461 What is a coronal mass ejection58
Coronal mass ejections (CMErsquos) (appendix XVI) are huge amounts of gas some billions of
plasma from the sun that are ejected into space Their temperature can reach 25 million K59
A coronal mass ejection can last for several hours and it can at last enter the solar wind A
CME can reach a speed of 50kms- 2000kms which means more than 7 million kilometres
an hour60 The mass of a large CME varies from 5 x 10⁶ to 5 x 10¹³ kg61 During a solar
maximum there are more coronal mass ejections than during a minimum but they can occur
at any time of the solar cycle Coronal mass ejections are related both to solar flares and
prominences Very heavy coronal mass ejections can cause some geomagnetic storms on
earth
462 Reconnection
The reconnection of a solar flare can end up in a coronal mass ejection When magneticfield lines that are opposite are starting to reconnect and form new magnetic field lines half of
the magnetic field lines will point downwards and join some existing magnetic loops
However the other part of the magnetic field lines will move upwards at a very high speed
and will form some loops more upwards Between those loops that moved downwards and
those that moved upwards there is some mass that isnrsquot connected to the sun anymore It is
57GD HOLMAN lsquoThe mysterious origins of solar flaresrsquo Scientific America April 2006 p 29 volume 294
number 458
BRAEUNIG R A Glossary Internet (httpwwwbraeunigusspaceglossaryhtm) 200659 LILENSTEN J and BORNAREL J Sous les feux du soleil EDP Sciences Les Ulis Cedex A 2001 p 4460 Cuypers J and others lsquoLa rechercheacute en heacuteliophysique en Belgiquersquo Space connection October 2007 p 10-
1161GREEN SF and JONES M H An introduction to the Sun and Stars The Open University Cambridge
2004 p 68
832019 Ew Afgewerkte Final
httpslidepdfcomreaderfullew-afgewerkte-final 2559
25
known that for an amount of solar flares that this mass between the loops will end up in a
coronal mass ejection Yet this doesnrsquot count for all the solar flares The coronal mass
ejection only takes place if the magnetic field lines twist around each other while forming the
letter lsquoSrsquo (see figure 12)62
Figure 12 Here you can see the reconnection that takes place before the coronal mass ejection starts
httpwwwnasagovmission_pagessolar-bsolar_005html
Certainly we will be capable to answer all the questions about solar flares and coronal mass
ejections in the nearby future But there are also some very interesting questions left what is
at the basis of the acceleration of the atoms in solar flares How does magnetic reconnection
originate Hopefully we will find the answers in the near future
47 Solar wind
471 What is the solar wind
Every second of every day of the year the sunrsquos corona emits a continuous stream of mass
from the sun The temperature of the corona is so high that the sunrsquos magnetic field just
cannot control the outflow of particles We know that the particles are accelerated but
astronomers cannot explain all the details about the solar wind yet
472 What do we know about the solar wind
The speed of the solar wind can change it differs from 300kmh up to 800kmh This speed
depends on the outflow of gases If there is a corona hole pointing towards the earth the solar
wind will reach a speed of around 800kmh The different speeds can interact with each other
and form a new speed according to the rules of light emission When two emissions connect
with each other they can form a faster or slower solar wind just like waves can interact and
form new waves
62BOEN B Birth of a coronal mass ejection Internet (httpwwwnasagovmission_pagessolar-b
solar_005html) 290408
832019 Ew Afgewerkte Final
httpslidepdfcomreaderfullew-afgewerkte-final 2659
26
The ionized atoms with very high temperature coming from the sunrsquos corona are one of the
most important parts of the solar wind but the magnetic fields are important too The
magnetic field outside the sun gets wrapped into a spiral called the Parker-spiral named after
the scientist who described it as the first one (because the sun rotates) This influences the
magnetic field of the sun from the outside The solar wind is emitted in spiral too (see figure
13)
Figure 13 The course of the solar wind caused by the rotation of the sun
httpheliosgsfcnasagovsolarmaghtml
473 Heliosphere
We can describe the heliosphere as a gigantic magnetic bubble around the sun This is
everywhere in space till where the sunrsquos magnetic field reaches and still has an influence The
heliosphere is filled with solar wind although the solar wind has a very low density Yet it
is a very hot wind but because of the very low density it does not have such a great influence
on earth However it can cause some energetic storms on earth63
63 NASA The heliosphere Internet (httpheliosgsfcnasagovheliosphhtml) 20012009
832019 Ew Afgewerkte Final
httpslidepdfcomreaderfullew-afgewerkte-final 2759
27
Conclusion
The sunrsquos magnetic field is a complex system to understand Yet I hope you have learned a
lot from this paper and that you do understand the exiting phenomena described in the
previous chapters
We can discuss the sunrsquos magnetic field from two perspectives The first one is looking at the
magnetic field for global long-term changing dimensions The second way is based on
phenomena on lower scale
The global changes involve the solar cycle and the switch of the magnetic poles The solar
cycle is divided into a decrease of the solar activity until it reaches solar minimum and an
increase of the solar activity until it reaches solar maximum The frequency of the phenomena
that can be found in the outer layers of the sun are directly connected to the solar activity and
thus to the solar cycle Sunspots are the easiest to see they appear as black spots against the
much brighter surface of the sun Corona loops are connected to sunspots and can extend into
solar flares and solar prominences These flares and prominences can burst out into a coronalmass ejection All these phenomena influence the sun and its solar wind how small their part
may be The solar wind has a directly influence on the earth
There is still much to be discovered Astronomers hope to discover much more about the
magnetic field of the sun Today many astronomers and scientists are observing the sun and
every day they discover more and more aspects of the sun Recently a group of researchers
led by David Jess of Queens University Belfast has revealed why the sunrsquos atmosphere is
hotter than its surface64 As you can see astronomy is a very developing science
64
CORDIS Researchers reveal why Suns atmosphere is hotter than its surface Internet (httpcordiseuropaeusearchindexcfmfuseaction=newsdocumentampN_LANG=ENampN_RCN=30598amppid=0ampq=87F36474805A6BEC0B89404F72D0351Famptype=sim) 20032009
832019 Ew Afgewerkte Final
httpslidepdfcomreaderfullew-afgewerkte-final 2859
28
Glossary
Absorption lines A dark line superimposed on a continuous spectrum when a gas absorbs
light from a continuous source that is hotter than the absorbing gas
Aurora Light radiated by atoms and ions formed by the solar wind in the earthrsquos upper atmosphere seen most commonly in the polar regions
Chromosphere The layer in the solar atmosphere between the photosphere and the corona It
is the lowest layer of the atmosphere characterized by reddish hue and by an increase of the
temperature with altitude through all but its lower regions
Convection The transfer of heat from a region of high temperature to a region of lower
temperature by the displacement of the cooler molecules by the warmer molecules The hot
gas will be moved upwards the cool gas will be pushed downwards into the sun
Corona The sunrsquos outer atmosphere It is very extensive and has a very low density It isextremely hot
Coronal hole A dark region of the sunrsquos inner corona as seen at X-ray wavelengths
Coronal loop Closed loops of magnetic field lines extending from the sunrsquos photosphere into
the corona which contain plasma at high temperature They are typically observed through
ultraviolet or x-ray emission from the hot plasma
Coronal mass ejection Large volumes of high energy gas released from the sunrsquos corona
Differential rotation The rotation of a non rigid object in which parts at different latitudes or
different radial distances move at different speeds
Dynamo theory The generation of a magnetic field by circulating electric charges
Eclipse The blocking of a part or all of the light from the moon by the earth (lunar eclipse) or
from the sun by the moon (solar eclipse)
Emission lines Emission lines are used in physics chemistry and astronomy to determine
what kind of gas is doing the emission Every element has a different electronic structure and
will thus have a different emission line fingerprint Emission lines are produced whenelectrons in atoms jump from one energy level to lower energy level
Filament A dark curve seen above the sunrsquos photosphere that is the top view of a solar
prominence
Flux tube Is a generally tube-like (cylindrical) region of space containing a magnetic field
such that the field at the side surfaces is parallel to them Both the cross-sectional area of the
tube and the field contained may vary along the length of the tube but the magnetic flux is
always constant
832019 Ew Afgewerkte Final
httpslidepdfcomreaderfullew-afgewerkte-final 2959
29
Geomagnetic storm When unusually strong surges of solar wind (charged particles from the
Sun) hit the Earth This effect causes variations in the magnetic field which surrounds the
Earth The visible results are eg the aurora (Northern and Southern lights)
Granulation Granules are related to the convective zone The granulation that shows up in the
photosphere is a result of the rising and falling of hot gas that takes place in the convectivezone
Hα absorption line An absorption line due to an electronic transition in hydrogen atoms in
which the atom absorbs a photon so that the electron makes a transition from a state
corresponding to the electronic energy level with n=2 to the one above with n=3 The photon
wavelength in a vacuum is 6563 nm
Heliosphere The volume of space within which the sun through the solar wind influences its
environment in the interstellar medium
Magnetic dynamo A theory that explains phenomena of the solar cycle as a result of periodicwinding and unwinding of the sunrsquos magnetic field in the solar atmosphere
Magnetic reconnection A process taking place in a plasma in which neighbouring
oppositely directed magnetic field lines suddenly part and reconnect in a new configuration
The abrupt change in a magnetic field represented by this process can release large amounts
of energy and it is thought to be important in explaining solar flares and other phenomena
Penumbra The portion of a shadow in which only part of the light source is covered by the
shadow-making body
Photosphere The region in the solar atmosphere from which most of the visible light escapes
into space
Plasma A fourth state of matter (not found naturally on Earth) of very hot gases Plasma is a
fluid with the ability to carry electric currents with no local accumulations of electric charge
Prominence Flamelike protrusion seen near the limb of the sun and extending into the solar
corona The side view of a filament
Quantum theory A theory in physics based on the principle that matter and energy have the
properties of both particles and waves created to explain the radiation of energy from a blackbody the photoelectric effect and the Bohr theory and now used to account for a wide
range of physical phenomena including the existence of discrete packets of energy and
matter the uncertainty principle and the exclusion principle Itrsquos a theory of the interaction of
matter and radiation developed early in the twentieth century which is based on the
quantization of energy and applied to a wide variety of processes that involve an exchange of
energy at the atomic level
Reconnection See magnetic reconnection
Solar cycle A 22-year-cycle during which the sunrsquos magnetic field reverses its polarity twice
Solar flare A violent eruption on the sunrsquos surface
832019 Ew Afgewerkte Final
httpslidepdfcomreaderfullew-afgewerkte-final 3059
30
Solar wind An outward flow of particles (mostly electrons and protons) from the sun
Solstice Either of two points along the ecliptic at which the Sun reaches its maximum
distance north or south of the celestial equator
Spectroscopy Concerns the production and study of spectra
Spectrum The result of electromagnetic radiation passing through a prism or grating so that
different wavelengths are separated
Spicule Short-lived (lifetime from rising to falling is about 15 minutes) jets vertical to the
solar surface that are several thousand kilometres long and about 1 kilometre thick (see also
appendix IV) in the solar chromosphere
Sunspot A temporary cool region in the solar photosphere created by protruding magnetic
fields
Umbra The central completely dark portion of a shadow
Zeemaneffect A splitting of spectra lines in the presence of a magnetic field
Bibliography and webography of the glossary
COMINS NF and KAUFMANN III WJ Discovering the universe eighth edition WH
Freeman and Company New York 2008 535 p
GREEN SF and JONES M H An introduction to the Sun and Stars The Open University
Cambridge 2004 373 p
httpenmimihuastronomygranulationhtml
httpenmimihuastronomyplasmahtml
httpwwwspacecomspacewatchspace_weather_glossaryhtml
httpenmimihuastronomyemission_linehtml
httpenmimihuastronomyabsorption_linehtml
httpwwwpbsorgfaithandreasonphysglossqm-bodyhtml
httpwwwanswerscomtopicquantum-theory
httpenwikipediaorgwikiFlux_tube
832019 Ew Afgewerkte Final
httpslidepdfcomreaderfullew-afgewerkte-final 3159
31
Appendix I The sun in figures
Physical quantity Comment
Radius 695 510 km 109 x earths radius
Mass 1989 x1030 kg 332 946 earths mass
Mass sun in the solar
system
9986 Total mass sun total mass of
our solar system
Volume 1412 x10sup3sup3 cmsup3 13 million x earths volume
Age 455 milliard years
Luminosity 3854 x 10sup3sup3 ergss
Magnitude -2773
Density center 1513 gcmsup3
Density mean 1409 gcmsup3
Pressure center 2334 x1011 bars
Pressure photosphere 00001 bar
Temperature center 15 557 000deg K
Temperature photosphere 5 780deg K Various sources mention
different grades
Temperature corona 2 000 000 to 3 000 000deg K
Rotation time at North or
South pole
up to 35 days on earth
Rotation time at Equator 25 days on earth The difference in rotation
times is called differential
rotation
Rotation time general 2538 days on earth
Mean distance sun-earth
(AU)
14959787 x108 km 1 AU = 1 Astronomical Unit
= 149 598 000 km
Chemical composition of
the sun ( of total number
of atoms)
Hydrogen 921
Helium 78
All others 01
Various sources mention
slightly different percentages
832019 Ew Afgewerkte Final
httpslidepdfcomreaderfullew-afgewerkte-final 3259
32
Chemical composition of
the sun ( of total mass)
Hydrogen 7346
Helium 2485
All others 169
Various sources mention
slightly different percentages
Total transforming of
hydrogen into helium persecond
700 billions of kilograms of
hydrogen are transformedinto 6957 billions of
kilograms of helium each
second
Based on the following references
- BEATTY JK PETERSEN CC and CHAIKIN A The new solar system fourth edition
Cambridge University Press Cambridge 1999 p 421
- LILENSTEN J and BORNAREL J Sous les feux du soleil EDP Sciences Les Ulis
Cedex A 2001 p 247
- LANG KR Sun earth and sky Springer Germany 1995 p 282- DENTHIER T Het zonnestelsel Standaard Uitgeverij 1992 p 415
- JANSSENS J Zon en aarde een unieke relatie Garant Antwerpen 2003 p 254- VOLKSSTERRENWACHT URANIA VZW De zon Internet(httpwwwuraniabesterrenkundezonnestelselzonphp) (01012009)
832019 Ew Afgewerkte Final
httpslidepdfcomreaderfullew-afgewerkte-final 3359
33
Appendix II Anatomy of the sun
httpwwwcosmographicacomgalleryinfographicssolar_anatomyhtml
The middle the sun consists of a heavy core this consists of plasma just as the outer layers
of the sun but the pressure in the core is so high that it behaves much more like a solid bodyThe most outer layer is the corona it reaches far into space More to the inside there is the
chromosphere and then the photosphere The corona the chromosphere and the
photosphere are explained in chapter 1
832019 Ew Afgewerkte Final
httpslidepdfcomreaderfullew-afgewerkte-final 3459
34
Appendix III Granulation
httpwwwwindowsucaredutourlink=sunSolar_interiorsolar_furnacehtml
At the surface of the sun we can find granules These are created by convection the warmest
parts of the sunrsquos interior move upwards and the colder parts at the surface move downwardsThis causes currents of plasma The dark lines are the colder particles We see them darker
because they emit less light than their surrounding neighbourhood
832019 Ew Afgewerkte Final
httpslidepdfcomreaderfullew-afgewerkte-final 3559
35
Appendix IV Spicules
Picture httplpc1clpccdcccauslpcharpellastro20a20deinfo_s09htmInformation httpwwwdaviddarlinginfoencyclopediaSspiculehtml
On this picture you can see spicules Spicules only last for several minutes and can be foundin the chromosphere They are little jets of gas There also exist macrospicules that can be
approximately ten times larger than a normal spicule
832019 Ew Afgewerkte Final
httpslidepdfcomreaderfullew-afgewerkte-final 3659
36
Appendix V The most important satellites observing the sun
Here you can find the most important satellites observing the sun and their missions
Solar and Heliospheric Obseratory (SOHO)
httpsohowwwnascomnasagovaboutabouthtml
SOHO the Solar amp Heliospheric Observatory is a project of international collaboration
between ESA and NASA to study the Sun from its deep core to the outer corona and the solar
wind
SOHO was launched on December 2 1995 The SOHO spacecraft was built in Europe by an
industry team led by prime contractor Matra Marconi Space (now EADS Astrium) under
overall management by ESA The twelve instruments on board SOHO were provided by
European and American scientists Nine of the international instrument consortia are led by
European Principal Investigators (PIs) three by PIs from the US Large engineering teamsand more than 200 co-investigators from many institutions supported the PIs in the
development of the instruments and in the preparation of their operations and data analysis
NASA was responsible for the launch and is now responsible for mission operations Large
radio dishes around the world which form NASAs Deep Space Network are used for data
downlink and commanding Mission control is based at Goddard Space Flight Center in
Maryland
More information about SOHO can be found on
httpsohowwwnascomnasagovaboutdocsSOHO_Fact_Sheetpdf
832019 Ew Afgewerkte Final
httpslidepdfcomreaderfullew-afgewerkte-final 3759
37
Transition Region and Coronal Explorer (TRACE)
httptracelmsalcomProjectMissionmissionhtm
TRACE enables solar physicists to study the connections between fine-scale magnetic fields
and the associated plasma structures on the Sun in a quantitative way by observing the photosphere the transition region and the corona With TRACE these temperature domains
are observed nearly simultaneously (with as little delay as only a second between different
wavelengths) with a spatial resolution of one second of arc
This is accomplished by obtaining precisely coaligned image sequences of photosphere
transition region and corona with high spatial resolution and uninterrupted viewing of the
Sun for up to eight months
TRACE Mission
TRACE explores the magnetic field in the solar atmosphere by studyingbull The 3-dimensional field structure
bull Its temporal evolution in response to photospheric flows
bull The time-dependent coronal fine structure
bull The coronal and transition region thermal topology
TRACE was launched on a Pegasus launch vehicle from Vandenberg Air Force Base in April
1998 The launch was scheduled to allow joint observations with SOHO during the rising
phase of the solar cycle to sunspot maximum No transition region or coronal imager has
witnessed the onset and rise of a solar cycle
Pegasus in flight
The two satellites provide complementary observations TRACE produces the high spatial
and temporal resolution images while SoHO yields images and spectral data out to 30 solar
radii at much lower spatial and temporal resolution Jointly they provide the opportunity to
obtain simultaneous digital measurements of all the temperature regimes of the solar
atmosphere in both high-resolution imaging and spectroscopy
With these data we expect to shatter the current ignorance of coronal heating and impulsive
MHD phenomena with benefits not only to solar physics but also to studies ranging from
stellar activity to the MHD of accretion disks The magnetograms produced by MDI on SoHO
provide a complete record of the eruption and distribution of photosphere magnetic fields
which will be invaluable for understanding TRACE observations of coronal hole formation
and coronal mass ejections Both of these phenomena have profound effects on our space
environment and the Earth`s magnetic field
TRACE is the first US solar research satellite since the Solar Maximum Mission
Coordination with SOHO provides an unprecedented opportunity to follow the emergence of
magnetic flux from the base of the convection zone deep inside the Sun through the
photosphere chromosphere and transitional region to the low-beta outer corona while
observing the effects of this emergence such as coronal mass ejections with high spatial andtemporal resolution
832019 Ew Afgewerkte Final
httpslidepdfcomreaderfullew-afgewerkte-final 3859
38
The transition from the photosphere where magnetic fields and plasma are in rough
equipartition to the corona where magnetic fields dominate is extremely difficult to model
and until recently to observe at high temporal and spatial resolution Many of the physical
problems that arise here such as plasma confinement reconnection wave propagation and plasma heating arise throughout space physics and astrophysics The detailed study of these
processed in the solar outer atmosphere is invaluable to astrophysics in general and stellar
studies in particular
More information about TRACE observations can be found on
httptracelmsalcomOperationsGeneraloperatiohtm
832019 Ew Afgewerkte Final
httpslidepdfcomreaderfullew-afgewerkte-final 3959
39
Reuven Ramaty High Energy Solar Spectroscopic Imager (RHESSI)
httphesperiagsfcnasagovhessibrochurehtm
What Questions will HESSI Address
bull How is such a large amount of energy released so rapidly during a flare
bull How are so many electrons and protons accelerated so quickly to such high energies
bull Where are the electrons and protons accelerated in the solar atmosphere and where do
they deposit their energy
How will HESSI Address these Questions
HESSI shown below will concentrate on electrons and protons accelerated in solar flares
through observations of the X-rays and gamma rays that they produce
bull HESSI will obtain the first ever X-ray and gamma-ray images of flares from 100 keV
to 20 MeVbull HESSI will do the first ever nuclear gamma-ray line spectroscopy of solar flares
bull HESSI will obtain pictures of flares in X-rays with an angular resolution of 2
arcseconds a factor of three better than previously possible
bull HESSI will measure X-ray and gamma-ray spectra with less than 1 keV energy
resolution a factor of 20-40 better than previously possible with scintillation counters
More information about the RHESSIrsquos Mission can be found on
httphesperiagsfcnasagovhessiconcepthtm
832019 Ew Afgewerkte Final
httpslidepdfcomreaderfullew-afgewerkte-final 4059
40
Solar Radiation and Climate Experiment (SORCE)
httplaspcoloradoedusorcesciencebackgroundhtm
The Solar Radiation and Climate Experiment (SORCE) is a NASA-sponsored satellite
mission that is providing state-of-the-art measurements of incoming x-ray ultraviolet visiblenear-infrared and total solar radiation The measurements provided by SORCE specifically
address long-term climate change natural variability and enhanced climate prediction and
atmospheric ozone and UV-B radiation These measurements are critical to studies of the Sun
its effect on our Earth system and its influence on humankind
The SORCE spacecraft was launched on January 25 2003 on a Pegasus XL launch vehicle to
provide NASAs Earth Science Enterprise (ESE) with precise measurements of solar
radiation It launched into a 645 km 40 degree orbit and is operated by the Laboratory for
Atmospheric and Space Physics (LASP) at the University of Colorado (CU) in Boulder
Colorado USA It will continue the precise measurements of total solar irradiance (TSI) that
began with the ERB instrument in 1979 and has continued to the present with the ACRIM series of measurements SORCE will also provide the measurements of the solar spectral
irradiance from 1nm to 2000nm accounting for 95 of the spectral contribution to TSI
SORCE carries four instruments including the Spectral Irradiance Monitor (SIM) Solar
Stellar Irradiance Comparison Experiment (SOLSTICE) Total Irradiance Monitor (TIM) and
the XUV Photometer System (XPS)
The primary goal of the NASA Earth Observing Systems (EOS) SOlar Radiation and Climate
Experiment (SORCE) is to enable solar-terrestrial studies by providing precise daily
measurements of the total solar irradiance (TSI) and the solar spectral irradiance atwavelengths extending from the ultraviolet to the near infrared The following lists the
SORCE science objectives
1 Make accurate measurements with high precision of total solar irradiance connect
them to previous TSI measurements and continue this long-term climate record
Provide TSI with an accuracy of 001 (100 parts per million) based on SI units and
with a long-term repeatability of 0001yr
2 Make daily measurements of the solar ultraviolet irradiance from 120 to 300 nm with
a spectral resolution of 1 nm Achieve this spectral irradiance measurement with an
accuracy of better than 5 and with a long-term repeatability of 05yr Use the
solarstellar comparison technique to relate the solar irradiance to the ensembleaverage flux from a number of bright early-type stars (same stars used by the UARS
SOLSTICE program)
3 Make the first measurements of the visible and near IR solar irradiance with sufficient
precision for future climate studies Obtain daily measurements of solar spectral
irradiance between 03 and 2 microm with a spectral resolution of at least 130 an
accuracy of 003 and a long-term repeatability of better than 001yr
4 Improve the understanding of how and why solar irradiance varies estimate past and
future solar behavior and investigate climate responses
More information about SORCE can be found on
httplaspcoloradoedusorcesciencescience_opshtm
832019 Ew Afgewerkte Final
httpslidepdfcomreaderfullew-afgewerkte-final 4159
41
Appendix VI Wavelengths
httpeosweblarcnasagovEDDOCSWavelengths_for_Colorshtml
As you can see on the figure visible light situates in the centre of the wavelengths having not
the shortest nor the longest wavelengths Gamma rays have the shortest wavelength radioways the longest All sort of wavelengths are used for daily purpose like radio waves for
radio and TV and gamma rays for treatments
832019 Ew Afgewerkte Final
httpslidepdfcomreaderfullew-afgewerkte-final 4259
42
Appendix VII Absorption lines in the sunrsquos spectrum
Picture httpwwwsolarnavigatornetthe_sunhtmExplanation COMINS NF and KAUFMANN III WJ Discovering the universe eighth edition WHFreeman and Company New York 2008 p 109
This photo is called a spectrogram It contains the spectrum of the sun All the black lines are
absorption lines The amount of black lines is related to the amount of elements that the sun
is emitting From a spectrogram we can deduct a lot of things including their mass the
temperature of the surface the chemical composition of the sun rotation rates and much
more
832019 Ew Afgewerkte Final
httpslidepdfcomreaderfullew-afgewerkte-final 4359
832019 Ew Afgewerkte Final
httpslidepdfcomreaderfullew-afgewerkte-final 4459
44
Appendix IX Butterfly-diagram
httpspacesciencespacerefcomsslpadsolarimagesbflygif
A butterfly-diagram
In a butterfly-diagram we can find the sunspots with their latitude (y-axis) through the years(x-axis) As you can see the sunspots appear like lsquobutterfliesrsquo this was discovered in 1904 by
Edward Maunder (1851-1928 an English astronomer best remembered for his study of
sunspots and the solar magnetic cycle) Thatrsquos why this graph is also called Maunders
butterfly diagram
832019 Ew Afgewerkte Final
httpslidepdfcomreaderfullew-afgewerkte-final 4559
45
Appendix X The Wolf-numbers
httpsidcomabenews106sunspotnumberclarifiedpdf
The sunspot number clarified By Petra Vanlommel
Which kinds of daily International Sunspot Numbers (ISN) are currentlypublished by the SIDC
Three daily indices are currently published by the SIDCthe Estimated ISN (EISN)the Provisional ISN (PISN)the Definitive ISN (DISN)Although they are all based on the same type of observations ie visual sunspot counts as ameasure of solar activity they are obtained from different data sets by different processingmethods with different accuracies and they serve different purposes
In the ideal case the three numbers are equal but in practice it is inevitable that there aresmall differences Therefore It is useful to explain what each index actually means
What is the source of the Wolf number
Once per day observers worldwide communicate their measured Wolf number (= 10G + S)based on visual sunspot (S) and group (G) counts to the World Data Center for the SunspotIndex Presently this is done through a dedicated password-protected WEB form the Wolfinterface However some observers still use the old way of reporting their observations onpaper through regular mail This method slows down the final processing but for the sake ofcontinuity in the index it is important to keep these observers included as some of them
represent the longest individual datasetsThe observers give the exact observing time the observing conditions the total numbers(group count sunspot count and Wolf number) and optionally the NorthSouth and centralzone numbers The observers using the web interface can provide their results to the SIDCimmediately after each observation However some users prefer to insert their data as ablock creating some delay but this must be done at least once a month
The personal reduction coefficient K
A personal reduction coefficient K is calculated for each station It has values typically in therange 04 and 17 and leads to a normalized sunspot number K(10G+S) In other words theK factor rescales the raw sunspot counts of each observer to the ones of Rudolph Wolf the
astronomer who introduced the above Wolf formula thus simulating the same eyes sametelescope and same conditionsDuring the procedure for calculating the Provisional ISN the K factor of every station iscomputed for every observation that passes the elimination procedure Once a year apersonal K factor for every station and for every month of the previous year is calculated Ayearly mean K value per station is also computed
The estimated sunspot index
The Estimated ISN (EISN) is calculated and issued on a daily basis for the day of calculationand the day before Only the total EISN is calculated with no hemispheric index It is anautomated procedure and no manual intervention is done The EISN is meant as a quicktemporary and approximate index for real-time applications
832019 Ew Afgewerkte Final
httpslidepdfcomreaderfullew-afgewerkte-final 4659
46
We use the raw Wolf number from all observatories that have provided counts early in theday ie before 1230 UT Typically there is between 10 and 20 stations available Thecalculation of the EISN is based on a simple and straightforward statistical method The Wolfnumbers are multiplied with the yearly mean K factor (see paragraph about the personalreduction coefficient K) The EISN is a simple average of the K-scaled values after excludingany individual value that deviates abnormally from the other valuesOnce the Provisional ISN (PISN) is calculated after the end of a month the temporary EISNis dropped and replaced by the PISN
The provisional sunspot Index
The Provisional ISN (PISN) is calculated and issued on the first of every month Theoutcome is a daily total and hemispheric sunspot number for the entire elapsed month Anexample on the first of September we calculate the daily PISN for each day of August ThePISN is computed semi-automatically with as little manual intervention as possibleTo calculate the PISN values for the concerned month we use all Wolf numbers Typicallythere is data from around 65 stations available
The calculation of the PISN is based on an extensive statistical treatment This treatmentfilters out any abnormal daily observation or the complete data set from an erratic station(quality control) This prevents long-term drifts in the resulting index One of the key elementsderived from this processing is to update the K reduction coefficients for each station theevolution of each station is monitored for each day relative to the entire networkA subset of the contributing stations also provides hemispheric counts A similar process isapplied to the North and South counts to derive the hemispheric PISN There is an additionalconstraint the sum of the North and South ISN must match the total ISNThe PISN replaces the EISN And once the Definitive ISN (DISN) is calculated the DISNreplaces the PISN
The definitive sunspot index
The Definitive ISN is calculated and issued on a quarterly basis when we have collecteddata from all the contributing observatories This is the final index and it is appended to thehistorical sunspot index time series The same semi-automated treatment as for the PISN isnow applied to the full data set If the result agrees within 5 of the PISN value the PISN iskept and becomes definitive Otherwise the new calculated value replaces the PISN andbecomes the definitive ISNIt is only at this stage and only in peculiar situations that a manual verification by ourscientific staff is required For example this happens when the observed raw Wolf valuesfrom the whole network are clustered around two distinct values This special case can becaused by small short-lived isolated sunspots (lifetimes lt 24 hours) or by the appearance ordisappearance of a large group at the solar limb in the course of one UT dayThe DISN replaces the provisional and estimated International Sunspot Number
Handling very low activity levels
One of the situations requiring a human arbitration is associated with single small isolatedand short-lived sunspots This is most noticeable around the minimum of the solar activitycycle like the one occurring now in 2008 Due to the 24hour binning (observations aregrouped between 0hUT and 24hUT) and the variable ability of each observer to detect thesmallest sunspots we end up with some stations reporting one sunspot and others who didno see any sunspot Let us explain further No sunspot may mean that the sunspot waspresent but the observer was unable to see it because of poor observational conditions such
as weather a small telescope On the other hand it may also indicate that the sunspot hadactually vanished by that time while it was present earlier on the same day
832019 Ew Afgewerkte Final
httpslidepdfcomreaderfullew-afgewerkte-final 4759
47
Individual stations do not observe at exactly the same timeIn order to validate the existence of such a marginal reported sunspot a qualified SIDCscientist must then check the detailed chronology within that day and consider the overallobserver capability (value of K coefficient)In common practice the fact that a sunspot is reported by a significant group of observersleads to the inclusion of the sunspot on that date thus neglecting the no-sunspotobservationsThe rationale is multiple observations of a sunspot exclude the possibility that the reportedsunspot was an independent false detection So a sunspot was really present on that dayalthough it may have existed only for part of the day or it was small enough to be missed bypart of the observers with smaller instruments or imperfect atmospheric conditionsAlso keep in mind that the sunspot index is derived with a limited precision just like any otherindex If the monthly mean sunspot number is 0 or 05 you can definitely say that activitywas low
What index should be used
If you want to perform long-term investigations the definitive ISN series is definitely the mostsuitable However there is a delay of a few months So when investigating the last cycle andrecent evolution use the definitive numbers in combination with the provisional ISN to be upto date to the last month The provisional numbers are also used in models forecasting thesunspot number for the coming months Now if you need a proxy for solar activity in a modelthat runs in real-time then you may use the estimated ISNImprovements and rethinking of the processing method is an ongoing project We arecurrently developing an alternative program for calculating the PISN Of course long-termconsistency is vital Therefore a cross-analysis between the output from the old and newsoftware must be applied over an extended period
832019 Ew Afgewerkte Final
httpslidepdfcomreaderfullew-afgewerkte-final 4859
48
Above graphs show different kinds of the International Sunspot Number The left plot gives an overview from 1700 up to now from the yearly (black) and monthly smoothed Sunspot Number The graph in the right top corner shows the monthly and monthly smoothed sunspot number while the graph in the right bottom corner show the daily monthly smoothed monthly sunspot number For every the time range of investigation there is an appropriate sunspot number
832019 Ew Afgewerkte Final
httpslidepdfcomreaderfullew-afgewerkte-final 4959
49
Appendix XI Filaments and prominences
httpsohowwwnascomnasagovpickoftheweekold26feb2004
This is a picture taken by SOHO on 26 February 2004
832019 Ew Afgewerkte Final
httpslidepdfcomreaderfullew-afgewerkte-final 5059
50
Appendix XII The reconnection of magnetic loops
httpwwwioporgEJarticle0004-637X558287253575webpdfrequest-id=73e38daa-69ae-4e01-b9a6- b4bd0ba071dd
In (a) sunspot B and C have different polarity and move towards each other The twomagnetic loops will reconnect and form one big magnetic loop showed in (b) This will
happen to other magnetic loops too as can be seen in (c) When G en F are close enough they
will reconnect and so E en H will reconnect too It is possible that the magnetic field line is
trapped around another in this case AD The mass ejected from the sun will be trapped
between the magnetic field lines and form a solar prominence
832019 Ew Afgewerkte Final
httpslidepdfcomreaderfullew-afgewerkte-final 5159
832019 Ew Afgewerkte Final
httpslidepdfcomreaderfullew-afgewerkte-final 5259
52
httptheinvisibleagentwordpresscom20090117amazing-celestial-images
An group of active prominences
httpapodnasagovapodap051109html
httpwhassupinthemilkywayblogspotcom200903cloudy-planhtml
A picture taken by SOHO In the left corner you can see the prominence with twisted
magnetic field lines
832019 Ew Afgewerkte Final
httpslidepdfcomreaderfullew-afgewerkte-final 5359
53
Appendix XIV Polar crown
httpsciencenasagovheadlinesy200817sep_polarcrownhtm
Photograph of a polar crown taken on 13 June 1999 by the Meudon Observatory
832019 Ew Afgewerkte Final
httpslidepdfcomreaderfullew-afgewerkte-final 5459
54
Appendix XV Coronal holes
httpsunearthdaynasagov2007multimediagal_020php
The black segment is a huge coronal hole The bright parts are x-rays from sunspots
832019 Ew Afgewerkte Final
httpslidepdfcomreaderfullew-afgewerkte-final 5559
55
Appendix XVI Coronal mass ejection
httpzuserver2staruclacuk~idhapodap000309html
Picture of a CME taken by SOHO in February 2000
832019 Ew Afgewerkte Final
httpslidepdfcomreaderfullew-afgewerkte-final 5659
56
Bibliography
Books
BEATTY JK PETERSEN CC and CHAIKIN A The new solar system fourth edition
Cambridge University Press Cambridge 1999 421 p
COMINS NF and KAUFMANN III WJ Discovering the universe eighth edition WH
Freeman and Company New York 2008 535 p
DETHIER T Het zonnestelsel Standaard Uitgeverij 1992 415 p
GOLUB L and PASACHOFF JM Nearest star the surprising science of our sun Harvard
university press Harvard 2001 267 p
GREEN SF and JONES M H An introduction to the Sun and Stars The Open University
Cambridge 2004 373 p
HILL S and CARLOWITZ M The sun Abrams New York 2006 239 p
HOLMAN GD lsquoThe mysterious origins of solar flaresrsquo Scientific America April 2006 p
24-31 volume 294 number 4
JANSSENS J Zon en aarde een unieke relatie Garant Antwerpen 2003 254 p
KELLER H-U Van Supernovarsquos tot zwarte gaten Tirion Natuur AH Baarn 2003 169 p
LANG KR Sun earth and sky Springer Germany 1995 282 p
LILENSTEN J and BORNAREL J Sous les feux du soleil EDP Sciences Les Ulis Cedex
A 2001 247 p
832019 Ew Afgewerkte Final
httpslidepdfcomreaderfullew-afgewerkte-final 5759
57
Articles
CUYPERS J and others lsquoLa rechercheacute en heacuteliophysique en Belgiquersquo Space connection
October 2007 20 p
DE KEYSER J lsquoDe magnetopauzersquo Heelal maart 1998 p 66-73
JANSSENS J lsquoHet maximum van de 23ste zonnevlekkencyclus (I)rsquo Heelal Oktober 1998 p
256-263
JANSSENS J lsquohet maximum van de 23ste zonnenvlekkencyclus (II)rsquo Heelal November
1998 p 284-290
JANSSENS J lsquoZonnefakkelsrsquo Heelal Oktober 1994 p 256-261
SMITS F lsquoDe coronarsquo Heelal Februari 1999 p 40-42
SMITS F lsquoProtuberanzenrsquo Heelal Juli 1991 p 182-185
VAN DEN BERGHE S lsquoHet Zeemaneffectrsquo Heelal September 1998 p 228-231
832019 Ew Afgewerkte Final
httpslidepdfcomreaderfullew-afgewerkte-final 5859
58
Webography
BOEN B Birth of a coronal mass ejection Internet
(httpwwwnasagovmission_pagessolar-b solar_005html) 290408
BRAEUNIG R A Glossary Internet (httpwwwbraeunigusspaceglossaryhtm) 2006
CORDIS Researchers reveal why Suns atmosphere is hotter than its surface Internet
(httpcordiseuropaeusearchindexcfmfuseaction=newsdocumentampN_LANG=ENampN_R
CN=30598amppid=0ampq=87F36474805A6BEC0B89404F72D0351Famptype=sim) 20032009
DAY C Alfveacuten waves may heat the Sunrsquos corona Internet
(httpblogsphysicstodayorgupdate200903 alfven-waves-may-heat-the-sunshtml)
310309
ELLERMAN F Solar prominences Internet (httparticlesadsabsharvardedufull
1928ASPL173E 0000074000html) (03042009)
ENCYCLODPEDIA OF SCIENCE Corona hole Internet
(httpwwwdaviddarlinginfoencyclopediaC coronal_holehtml) (04042009)
HATHAWAY D H The sunspot cycle Internet
(httpspacesciencespacerefcomsslpadsolarsunspots htm) 04012000
JANSSENS J The case of the missing solar cycle (published in lsquoheelalrsquo January 2008)
Internet (httpuserstelenetbejjanssensMSCwebEngpdf)
KNISELY D Solar prominences Internet
(httpwwwicstarscomHTMLSolarSectionHAlphaOBSERVINGTHESUNHAlpha3html)
(03042009)
KOPANSKI J Atom Internet (httpknolgooglecomkjan-
kopanskiatom1amrwrct7rvi27) 060209
MARTENS PC and ZWAAN C Origin and evolution of filament-prominence systems
Internet (http wwwioporgEJarticle0004-637X558287253575webpdfrequest-
id=73e38daa-69ae-4e01-b9a6-b4bd0ba071dd) 092001
NASA The corona Internet (httpsolarsciencemsfcnasagovcoronashtml) 180107
NASA The heliosphere Internet (httpheliosgsfcnasagovheliosphhtml) 20012009
OFFICIAL SITE OF STONEHENGE About Stonehenge Internet
(httpwwwstonehengecouk) (03022009)
OTTERSDORF M Astronomy On the sunspot cycle Internet
(httpuserszoominternetnet~matto MCASsunspot_cyclehtmZeemaneffect) 031103
PARIAT E and SCHMIEDER B Magnetic flux emergence Internet(httpwwwscholarpediaorgarticleMagnetic_field_emergence) 18042008
832019 Ew Afgewerkte Final
httpslidepdfcomreaderfullew-afgewerkte-final 5959
59
PRIEST E R Dynamics and Structure of Quiescent Solar Prominences Internet
(httpbooksgooglebe booksid=h599q3jz1w4Campdq=quiescent+prominencesampprintsec=fro
ntcoverampsource=blampots=58b79Qeyabampsig=1eklQ-
WszOIebZZaq7fq7gm6bxAamphl=nlampei=urPtSe7ZCo61-
Qa166jHDwampsa=Xampoi=book_resultampct=result ampresnum=3PPA6M2) 1989
RUSSELL R Rotation of the sun Internet
(httpwwwwindowsucaredutourlink=sunSolar_interior
Sun_layersdifferential_rotationhtml) 16082005
RUSSELL R Sunspots and magnetic fields Internet
(httpwwwwindowsucaredutourlink=sunatmospheresunspot_magnetismhtmlampedu=hig
h) 060908
UNIVERSITY OF GLASGOW Bibliography of Peter Sweet Internet
(httpwwwuniversitystoryglaacuk biographyid=WH2144amptype=P) (10042009)
WIKIPEDIA Orbiting Solar Observatory Internet
(httpenwikipediaorgwikiOrbiting_Solar_Observatory) 24012009
WINDOWS TEAM Maunderrsquos Butterfly Diagram Internet
(httpwwwwindowsucaredutourlink=sun activitybutterflyhtml) 2000
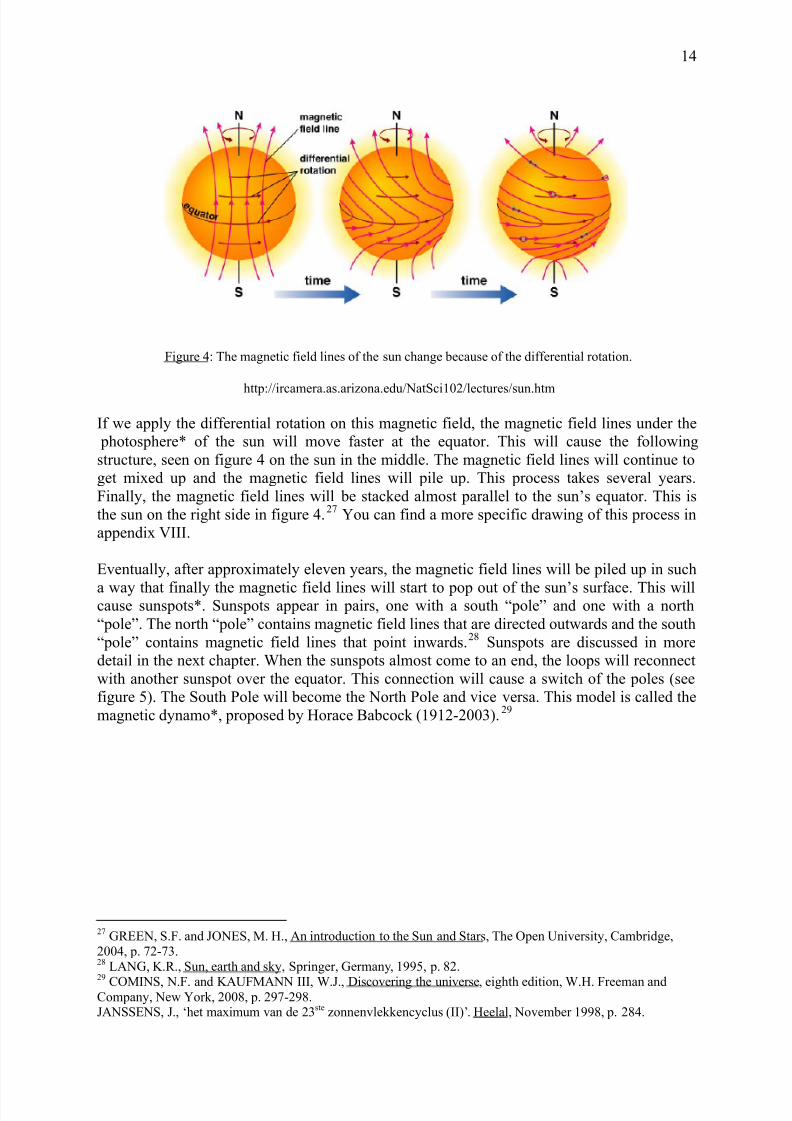
832019 Ew Afgewerkte Final
httpslidepdfcomreaderfullew-afgewerkte-final 1459
14
Figure 4 The magnetic field lines of the sun change because of the differential rotation
httpircameraasarizonaeduNatSci102lecturessunhtm
If we apply the differential rotation on this magnetic field the magnetic field lines under the
photosphere of the sun will move faster at the equator This will cause the following
structure seen on figure 4 on the sun in the middle The magnetic field lines will continue to
get mixed up and the magnetic field lines will pile up This process takes several years
Finally the magnetic field lines will be stacked almost parallel to the sunrsquos equator This is
the sun on the right side in figure 427 You can find a more specific drawing of this process in
appendix VIII
Eventually after approximately eleven years the magnetic field lines will be piled up in such
a way that finally the magnetic field lines will start to pop out of the sunrsquos surface This willcause sunspots Sunspots appear in pairs one with a south ldquopolerdquo and one with a north
ldquopolerdquo The north ldquopolerdquo contains magnetic field lines that are directed outwards and the south
ldquopolerdquo contains magnetic field lines that point inwards28 Sunspots are discussed in more
detail in the next chapter When the sunspots almost come to an end the loops will reconnect
with another sunspot over the equator This connection will cause a switch of the poles (see
figure 5) The South Pole will become the North Pole and vice versa This model is called the
magnetic dynamo proposed by Horace Babcock (1912-2003)29
27GREEN SF and JONES M H An introduction to the Sun and Stars The Open University Cambridge
2004 p 72-7328 LANG KR Sun earth and sky Springer Germany 1995 p 8229
COMINS NF and KAUFMANN III WJ Discovering the universe eighth edition WH Freeman andCompany New York 2008 p 297-298JANSSENS J lsquohet maximum van de 23ste zonnenvlekkencyclus (II)rsquo Heelal November 1998 p 284
832019 Ew Afgewerkte Final
httpslidepdfcomreaderfullew-afgewerkte-final 1559
15
Figure 5 The switching of the magnetic poles of the sun
GREEN SF and JONES M H An introduction to the Sun and Stars The Open University Cambridge 2004 p73
When finally the poles have switched and the magnetic field lines are disentangled the cycle
will just start over again for another eleven years Because the magnetic poles of the sun
switch every eleven years the cycle is called the 11-year-solar cycle
34 Other cycles
341 The 22-year-cycle
If we take the magnetic poles into account however the 11-year-cycle becomes a 22-year-
cycle because the magnetic poles switch If we want to consider the strict cycle which means
that we take the magnetic poles into account we have to call the solar cycle a 22-year-cycleIt takes eleven years to switch the magnetic North Pole into a South Pole and another eleven
years to switch them back This cycle is called the Hale-cycle named after George Ellery
Hale (1868-1938) who was an American solar astonomer and active in different
observatories30
342 The 27-day-cycle31
The 27-day-cycle taking the average of the sunrsquos rotation time is a cycle that is directly
connected to the rotation time of the sun The sunspots the coronal holes and other
phenomena that are related to the activity of the sun rotate too This means that the activity of the sun is connected to the rotation cycle For example the part of the sun that we can see will
be less active when the sunspots are not visible because the sunspots influence the solar
activity When the sunspots appear again the activity of the sun will rise This cycle is also
known because of the coronal holes that influence the solar wind
30JANSSENS J lsquohet maximum van de 23
stezonnenvlekkencyclus (II)rsquo Heelal November 1998 p 284-290
31 JANSSENS J Zon en aarde een unieke relatie Garant Antwerpen 2003 p 113
832019 Ew Afgewerkte Final
httpslidepdfcomreaderfullew-afgewerkte-final 1659
16
343 Other cycles
Astronomers believe that there must be some other cycles of an even longer basis Different
researchers have been looking for other solar cycles Some thought they found a 55-year
cycle However this cycle was very irregular Max Waldmeier (1912-2000 a very eminent
solar astronomer of the 20th
century) found a 90-year-cycle However lots of other cycleshave been ldquofoundrdquo There have been postulated a 2300-year-cycle too But the records of
solar cycles are too recent to prove this cycle 32
35 Solar maximum and minimum
The Royal Greenwich Observatory has been observing the sunspots since 1874 The
information of their observations includes the size the position and the number of sunspots
during all the recorded solar cycles If we put all this information into a graph we can see the
so-called butterfly-graph (appendix IX) With this information we can conclude that sunspots
do not appear at random33
At the beginning of a new solar cycle the first sunspots appear at latitude of 45 degrees Later
on sunspots will appear at the equator too When the sunspots begin to appear at 45 degrees a
new cycle has started again34 The solar minimum is the starting point of the solar cycle At
the beginning sunspots are very rare sometimes there are none If there are any sunspots they
will occur at higher latitudes The solar activity is the least on solar minimum Then it is a
good time for astronauts to go into space because there are less sunspots and less solar flares
and other phenomena that can influence the solar wind and so the space weather When the
solar activity is the highest the solar cycle reaches its maximum There will be a lot of
sunspots which now occur on lower latitudes too35 The time to go from a solar minimum to a
solar maximum is around four years During this time the solar activity will rise and when it
reaches its maximum it will slowly decline The decrease takes much more time than the
increase of the solar activity around 7 years The time between a solar minimum and
maximum and between a solar maximum and minimum can vary and is different for every
solar cycle36
36 Mysteries of the solar cycle
Astronomers have been able to find out a lot of details about the solar cycle However we are
still not able to predict the maximums and minimums of the solar cycles preciselyAstronomers havenrsquot been capable to draw up a model that allows us to predict the exact
number of sunspotshellip You can compare it to predictions for the weather to comehellip
32JANSSENS J Zon en aarde een unieke relatie Garant Antwerpen 2003 p 113-114
33HATHAWAY D H The sunspot cycle Internet (httpspacesciencespacerefcomsslpadsolarsunspots
htm) 0401200034 JANSSENS J Zon en aarde een unieke relatie Garant Antwerpen 2003 p 10335
WINDOWS TEAM Maunderrsquos Butterfly Diagram Internet (httpwwwwindowsucaredutourlink=sunactivitybutterflyhtml) 200036 JANSSENS J Zon en aarde een unieke relatie Garant Antwerpen 2003 p 99-100
832019 Ew Afgewerkte Final
httpslidepdfcomreaderfullew-afgewerkte-final 1759
17
Chapter 4 Phenomena caused by the magnetic field of the sun
41 Sunspots
411 What are sunspots
Sunspots appear on the sunrsquos surface when the magnetic field lines under the photosphere
are piled up too much and they finally pop out into the chromosphere Sunspots are normally
found in groups The number of sunspots is dependent on the solar activity when the solar
activity reaches its maximum there will be many more sunspots than at solar minimum
Measuring the magnetic field in sunspots with the Zeemaneffect makes clear that the
strength of the magnetic field is much stronger in sunspots than in the surrounding
photosphere Itrsquos more than thousand times stronger the magnetic field strength in magnetic
fields varies from 1000 to 4000 Gauss while the surrounding area circles around 1 Gauss
(comparison the earthrsquos magnetic field strength is about 05 Gauss)37
412 What do sunspots look like
When magnetic field lines pop out of the photosphere they will form magnetic loops (figure
6 on the right side) Between this magnetic loops there will be formed a flux tube The
magnetic field lines in the sunspot will distort the convection under the surface (see figure 6
on the left side) They will pull the plasma downwards and will prevent the warm plasma
from going upwards and reach the sunrsquos surface Eventually the temperature in the sunspot
will cool down38
Figure 6 Left side convection in sunspotsRight side magnetic field lines in sunspots
JANSSENS J Zon en aarde een unieke relatie Garant Antwerpen 2003 p41
37
RUSSELL R Sunspots and magnetic fields Internet (httpwwwwindowsucaredutourlink=sunatmospheresunspot_magnetismhtmlampedu=high) 06090838 JANSSENS J Zon en aarde een unieke relatie Garant Antwerpen 2003 p 40-41
832019 Ew Afgewerkte Final
httpslidepdfcomreaderfullew-afgewerkte-final 1859
18
We can distinguish 2 areas the black sunspot and the surrounding bright surface of the sun
The sunspot itself consists of the very dark centre called the umbra and the surrounding
orange-brown environment called the penumbra The penumbra consists of an amount of
small little striated f igures that come out of the umbra A sunspot can reach a diameter of
300 000 kilometres39 The temperature in the sunspots centre is much cooler than in the
photosphere because of the convection explained above It measures around 4 200 K whilethe photosphere has a temperature of 6000 K40
Figure 7 The composition of a sunspot
httpwwwjaxajparticlespecialastroshimizu02_ehtml
A sunspot appears black to our eyes However appearances are deceptive the dark sunspot
only seems dark because we see it against a much warmer environment If we h ad seen itagainst a black surface it would have been much brighter than the moonrsquos glowing41
The amount of sunspots varies from very few till over more than a hundred The amount of
sunspots can be predicted by the Wolf-numbers named after Johann R udolf Wolf (1816-
1893) a Swiss astronomer best known for his research on sunspots42 However I wonrsquot
explain this method in this paper You can find a briefly explanation in appendix X Yet this
method is only capable to predict the amount of sunspots approximately
42 Prominences
421 What is a prominence
The luminosity of the sun outshines lots of phenomena that take place on the surface of the
sun and even far away from the sun The sunrsquos corona is one example But luckily
prominences are quite visibly when we observe the sun A prominence is a huge cloud of gas
that is cooler than his environment It is trapped between two horizontal magnetic field lines
For human eyes it seems to spread out dark but this is only because a prominence has a much
39 LILENSTEN J and BORNAREL J Sous les feux du soleil EDP Sciences Les Ulis Cedex A 2001 p 3540 OTTERSDORF M Astronomy On the sunspot cycle Internet (httpuserszoominternetnet~matto
MCASsunspot_cyclehtmZeeman effect) 03110341JANSSENS J Zon en aarde een unieke relatie Garant Antwerpen 2003 p 41
42 JANSSENS J lsquoHet maximum van de 23ste zonnevlekkencyclus (I)rsquo Heelal October 1998 p 256-263
832019 Ew Afgewerkte Final
httpslidepdfcomreaderfullew-afgewerkte-final 1959
19
lower temperature then the sunrsquos chromosphere (similar to sunspots which spread out dark
too) The dark lines in appendix XI are also known as filaments A filament is a line between
to magnetic fields with opposite polarities (appendix XI)43
Figure 8 A solar prominence
httpcosmic-webcoukp=274more-274
422 What is a prominence made of
The gas from the prominence is coming from the chromosphere So the prominences have
approximately the same composition as the chromosphere A good way to observe
prominences is to use red Hα or blue Hβ spectrum lines Hα absorption lines indicate a
temperature lower than 10 000 Kelvin These spectrum lines justif y that the temperature of a prominence is remarkably lower than the temperature of the corona 44
423 How do prominences originate
A prominence is a result of the magnetic field Particles of the sun can transport warmth very
fast if they move alongside magnetic field lines If they want to move straight to a magnetic
field line the transport of warmth is negligible So prominences that are trapped between 2
magnetic fields only have one way to be heated This brings on a temperature that is notably
lower then the temperature in the corona45
The origin of prominences is similar to the origin of solar flares When two magnetic loops
of opposite polarity start to approach each other they will reconnect and form some new
loops This is shown in appendix XII Some mass from the sun will be trapped between the
new magnetic field lines and will form a solar prominence 46
43COMINS NF and KAUFMANN III WJ Discovering the universe eighth edition WH Freeman and
Company New York 2008 p 29944 SMITS F lsquoProtuberanzenrsquo Heelal Juli 1991 p 18345 LANG KR Sun earth and sky Springer Germany 1995 p 134-14046
MARTENS PC and ZWAAN C Origin and evolution of filament-prominence systems Internet ( httpwwwioporgEJarticle0004-637X558287253575webpdfrequest-id=73e38daa-69ae-4e01-b9a6- b4bd0ba071dd) 092001
832019 Ew Afgewerkte Final
httpslidepdfcomreaderfullew-afgewerkte-final 2059
20
424 What do prominences look like47
4241 Different groups of prominences
As you can see on the pictures in appendix XIII prominences can have different shapes and
forms Thatrsquos why astronomers classify them into different groups the quiescent prominences the active prominences and eruptive prominences
4242 Quiescent prominences
Quiescent prominences can appear everywhere on the sun and are not depending on latitude
They can reach into the corona over 2 500 till 40 000 kilometres Quiescent prominences last
the longest of all prominences Some of them even last several solar rotations long These
prominences are very long and not so wide During its lifetime a quiescent prominence moves
slowly to the poles When they are found at the poles of the sun they are called a lsquopolar
crownrsquo (appendix XIV)48
4243 Active prominences
Their name already suggests where they can be found active prominences are found in the
active regions of the sun moreover in the presence of sunspots These prominences
however only have a short lifespan only several hours But within this short lifespan they do
change form adjusting to the magnetic field lines within a short period of time Because
these prominences are located in active regions there are many more reconnections and so
the form will change more rapidly
4244 Eruptive prominences
These prominences only last a couple of minutes and are connected to active sunspots as well
It is possible that after one died out another immediately gives birth in the same region Other
eruptive prominences are known to be bubbles of gas that are issued from active sunspots
There have been some records of eruptive prominences that bump into other prominences and
push the other prominences back in the sunspot49
47 KNISELY D Solar prominences Internet (httpwwwicstarscomHTMLSolarSectionHAlpha OBSERVINGTHESUNHAlpha3html) (03042009)
SMITS F lsquoProtuberanzenrsquo Heelal Juli 1991 p 182-185
ELLERMAN F Solar prominences Internet (httparticlesadsabsharvardedufull 1928ASPL173E0000074000html) (03042009)48
KNISLEY D Solar prominences Internet (httpwwwicstarscomHTMLSolarSectionHAlphaOBSERVINGTHESUNHAlpha3html) (03042009)49 PRIEST E R Dynamics and Structure of Quiescent Solar Prominences Internet (httpbooksgooglebe
booksid=h599q3jz1w4Campdq=quiescent+prominencesampprintsec=frontcoverampsource=blampots=58b79Qeyabampsig=1eklQ-WszOIebZZaq7fq7gm6bxAamphl=nlampei=urPtSe7ZCo61-Qa166jHDwampsa=Xampoi=book_resultampct=resultampresnum=3PPA6M2) 1989
832019 Ew Afgewerkte Final
httpslidepdfcomreaderfullew-afgewerkte-final 2159
21
43 Coronal holes50
When looking at the sun with an x-ray telescope we can see dark regions across the sun
These dark regions are called coronal holes Coronal holes have an open magnetic field
structure This means that the magnetic fields lines do not angle downwards but they extend
into space indefinitely Due to this the particles of the sun are capable to reach out far intospace without any struggles against the magnetic field With this outflow of gases from the
sun coronal holes are one of the most important sources of the (high-speed) solar wind
(appendix XV)
44 Corona loops
441 What is a corona loop
If we look closer at a pair of sunspots we can see an emission of plasma alongside
magnetic field lines that originate in the sun spots A corona loop can extend into the coronaas the name suggests Those loops contain plasma that can reach a temperature higher than
106 Kelvin Corona loops can best be observed by ultra-violet and x-ray images because of
the high temperature The high temper ature brings on a high vibration of the atoms This
trembling causes the emission of x-rays51
Figure 9 A close up of corona loops
httpwwwdaviddarlinginfoencyclopediaCcoronal_loophtml
442 Where and when do corona loops originate
The magnetic field lines of sunspots move outwards from the sun into the corona and form
broad loops This makes it possible to trap hot gas with a temperature up to 40 million K
Those magnetic field loops trap hot plasma into the sunrsquos atmosphere The magnetic force
pushes particles around along the magnetic lines but at the same time the atoms circulate
around the magnetic field lines (see figure 10) The speed of their movements depends on the
50
ENCYCLODPEDIA OF SCIENCE Corona hole Internet (httpwwwdaviddarlinginfoencyclopediaC coronal_holehtml) (04042009)51 JANSSENS J Zon en aarde een unieke relatie Garant Antwerpen 2003 p 52-54
832019 Ew Afgewerkte Final
httpslidepdfcomreaderfullew-afgewerkte-final 2259
22
density of the magnetic field So if a particle moves from the top of a loop to the bottom it
will slow down just like in traffic jams Eventually it will reach the bottom but the bottom is
highly compressed (because the magnetic field lines converge at the bottom of the loops) so
that the particle will be shot back along the magnetic field line (see figure 10)
Figure 10 the movement of particles in corona loops
GD HOLMAN lsquoThe mysterious origins of solar flaresrsquo Scientific America April 2006 p24-29 volume 294number 4
Hence the particles will move up and down along the magnetic field lines Atoms that are
charged the same will cause electric currents (just like in a battery) These currents will
generate a new magnetic field and the old magnetic field in combination with the new one
will cause a high distortion in the magnetic field of the sun This is the moment when the
corona loop will transform into a solar flare
45 Solar flare52
451 What is a solar flare
A solar flare is a sudden powerful explosion in the solar atmosphere caused by a disruption
in the magnetic field of the sun Because of the disruption mass from the sun will be movedup and form a solar flare A solar flare can equal the energy of billions of atomic bombs
within a few minutes The strongest solar flares are measured during the solar maximums
because then the sunrsquos magnetic activity is the strongest53 Since the sunspots in the presence
of solar flare have a very high magnetic field it is likely that a solar flare would even have a
higher magnetic field But in reality the magnetic field of a solar flare is only half of the
magnetic field of a sunspot The intensity of the magnetic field is lsquoonlyrsquo 500 Gauss54
52 HOLMAN GD lsquoThe mysterious origins of solar flaresrsquo Scientific America April 2006 p 24-31 volume
294 number 453JANSSENS J Zon en aarde een unieke relatie Garant Antwerpen 2003 p 55-57
54 JANSSENS J lsquoZonnefakkelsrsquo Heelal Oktober 1994 p 256
832019 Ew Afgewerkte Final
httpslidepdfcomreaderfullew-afgewerkte-final 2359
23
Figure 11 You can see the magnetic fieldlines in the solar flare on the right side
Large solar flare recorded by SOHO EIT304 instrument 512x512 version Animation (980kMPEG) CourtesySOHO(ESAampNASA)
httpwwwteachersparadisecomencyenwikipediassusunhtml
452 Where and how do sun flares originate
Astronomers have long been speculating how solar flares exactly originate In 1992 Satoshi
Masuda (graduated at the University of Tokyo) discovered on pictures of the Japanese
Yohkoh Satellite that the far end of a solar flare emitted unusually short wavelengths very
short x-rays The source must be a concentration of gas with a temperature of about 100million K concluded Masuda But this discovery provoked some new questions why was the
high temperature at the top of the flare and not at the bottom where the gas is more compact
Why does the plasma stay confined instead of spreading out into the universe In order to
obtain more information to try to solve this problem astronomers started observing the sunrsquos
radiation of ultraviolet and x-rays frequently In 2002 NASA even launched the RHESSI
(Ramaty High Energy Solar Spectroscopic Imager) which was intended to bring solar flares
into pictures55
These observations provided evidence that sun flares surge up in regions where the magnetic
field is very strong ndashmost common in the presence of sun spots At this point we have to call
over the corona loops As mentioned before corona loops are electric currents of atoms
which move alongside magnetic field lines When the atoms are shot back alongside the
magnetic field line there seems to occur a distortion of the magnetic field This distortion will
end up in a solar flare All the mass of the corona loop will be shot into space and form a solar
flare
But how can such enormous mass of the solar flares be shot into s pace This has been a very
interesting question However Peter Alan Sweet (1921-2005)56 succeeded in finding an
55 GD HOLMAN lsquoThe mysterious origins of solar flaresrsquo Scientific America April 2006 p 27 volume 294
number 456UNIVERSITY OF GLASGOW Bibliography of Peter Sweet Internet (httpwwwuniversitystoryglaacuk
biographyid=WH2144amptype=P) (10042009)
832019 Ew Afgewerkte Final
httpslidepdfcomreaderfullew-afgewerkte-final 2459
24
answer already in 1956 If magnetic field lines break apart and then reconnect they bring
together two opposing fields that will cancel each other and cause a huge burst of energy The
reconnection will create new magnetic field lines This reconnection is called the Sweet-
Parker reconnection Yet this is a slow reconnection which cannot take place at the base of a
solar flare with a dazzling speed Fortunately Harry P Petschek published an article about
reconnection in 1964 and solved that problem under certain circumstances it is possible toreconnect much faster which explains solar flares This faster reconnection is also called the
Petschek reconnection But unfortunately with the current technology it is not yet possible to
take pictures of those reconnections57
If the energy comes from the reconnection then where does this reconnection take place
From pictures of solar flares astronomers discovered that at the top of the corona loop a
mysterious x-ray source was found The x-ray source began to give a higher energy level and
at the same time the particles move down towards the sunrsquos surface Yet the x-ray source
stays at the same placehellipThen when the x-rays reach their maximum the loop suddenly
changes direction But this time the x-ray source will move upwards too unexpectedly it
moves at the speed of light approximately three hundred thousands kilometres an hour awayfrom the sun This is the same speed as the coronal mass ejections
46 Coronal mass ejections
461 What is a coronal mass ejection58
Coronal mass ejections (CMErsquos) (appendix XVI) are huge amounts of gas some billions of
plasma from the sun that are ejected into space Their temperature can reach 25 million K59
A coronal mass ejection can last for several hours and it can at last enter the solar wind A
CME can reach a speed of 50kms- 2000kms which means more than 7 million kilometres
an hour60 The mass of a large CME varies from 5 x 10⁶ to 5 x 10¹³ kg61 During a solar
maximum there are more coronal mass ejections than during a minimum but they can occur
at any time of the solar cycle Coronal mass ejections are related both to solar flares and
prominences Very heavy coronal mass ejections can cause some geomagnetic storms on
earth
462 Reconnection
The reconnection of a solar flare can end up in a coronal mass ejection When magneticfield lines that are opposite are starting to reconnect and form new magnetic field lines half of
the magnetic field lines will point downwards and join some existing magnetic loops
However the other part of the magnetic field lines will move upwards at a very high speed
and will form some loops more upwards Between those loops that moved downwards and
those that moved upwards there is some mass that isnrsquot connected to the sun anymore It is
57GD HOLMAN lsquoThe mysterious origins of solar flaresrsquo Scientific America April 2006 p 29 volume 294
number 458
BRAEUNIG R A Glossary Internet (httpwwwbraeunigusspaceglossaryhtm) 200659 LILENSTEN J and BORNAREL J Sous les feux du soleil EDP Sciences Les Ulis Cedex A 2001 p 4460 Cuypers J and others lsquoLa rechercheacute en heacuteliophysique en Belgiquersquo Space connection October 2007 p 10-
1161GREEN SF and JONES M H An introduction to the Sun and Stars The Open University Cambridge
2004 p 68
832019 Ew Afgewerkte Final
httpslidepdfcomreaderfullew-afgewerkte-final 2559
25
known that for an amount of solar flares that this mass between the loops will end up in a
coronal mass ejection Yet this doesnrsquot count for all the solar flares The coronal mass
ejection only takes place if the magnetic field lines twist around each other while forming the
letter lsquoSrsquo (see figure 12)62
Figure 12 Here you can see the reconnection that takes place before the coronal mass ejection starts
httpwwwnasagovmission_pagessolar-bsolar_005html
Certainly we will be capable to answer all the questions about solar flares and coronal mass
ejections in the nearby future But there are also some very interesting questions left what is
at the basis of the acceleration of the atoms in solar flares How does magnetic reconnection
originate Hopefully we will find the answers in the near future
47 Solar wind
471 What is the solar wind
Every second of every day of the year the sunrsquos corona emits a continuous stream of mass
from the sun The temperature of the corona is so high that the sunrsquos magnetic field just
cannot control the outflow of particles We know that the particles are accelerated but
astronomers cannot explain all the details about the solar wind yet
472 What do we know about the solar wind
The speed of the solar wind can change it differs from 300kmh up to 800kmh This speed
depends on the outflow of gases If there is a corona hole pointing towards the earth the solar
wind will reach a speed of around 800kmh The different speeds can interact with each other
and form a new speed according to the rules of light emission When two emissions connect
with each other they can form a faster or slower solar wind just like waves can interact and
form new waves
62BOEN B Birth of a coronal mass ejection Internet (httpwwwnasagovmission_pagessolar-b
solar_005html) 290408
832019 Ew Afgewerkte Final
httpslidepdfcomreaderfullew-afgewerkte-final 2659
26
The ionized atoms with very high temperature coming from the sunrsquos corona are one of the
most important parts of the solar wind but the magnetic fields are important too The
magnetic field outside the sun gets wrapped into a spiral called the Parker-spiral named after
the scientist who described it as the first one (because the sun rotates) This influences the
magnetic field of the sun from the outside The solar wind is emitted in spiral too (see figure
13)
Figure 13 The course of the solar wind caused by the rotation of the sun
httpheliosgsfcnasagovsolarmaghtml
473 Heliosphere
We can describe the heliosphere as a gigantic magnetic bubble around the sun This is
everywhere in space till where the sunrsquos magnetic field reaches and still has an influence The
heliosphere is filled with solar wind although the solar wind has a very low density Yet it
is a very hot wind but because of the very low density it does not have such a great influence
on earth However it can cause some energetic storms on earth63
63 NASA The heliosphere Internet (httpheliosgsfcnasagovheliosphhtml) 20012009
832019 Ew Afgewerkte Final
httpslidepdfcomreaderfullew-afgewerkte-final 2759
27
Conclusion
The sunrsquos magnetic field is a complex system to understand Yet I hope you have learned a
lot from this paper and that you do understand the exiting phenomena described in the
previous chapters
We can discuss the sunrsquos magnetic field from two perspectives The first one is looking at the
magnetic field for global long-term changing dimensions The second way is based on
phenomena on lower scale
The global changes involve the solar cycle and the switch of the magnetic poles The solar
cycle is divided into a decrease of the solar activity until it reaches solar minimum and an
increase of the solar activity until it reaches solar maximum The frequency of the phenomena
that can be found in the outer layers of the sun are directly connected to the solar activity and
thus to the solar cycle Sunspots are the easiest to see they appear as black spots against the
much brighter surface of the sun Corona loops are connected to sunspots and can extend into
solar flares and solar prominences These flares and prominences can burst out into a coronalmass ejection All these phenomena influence the sun and its solar wind how small their part
may be The solar wind has a directly influence on the earth
There is still much to be discovered Astronomers hope to discover much more about the
magnetic field of the sun Today many astronomers and scientists are observing the sun and
every day they discover more and more aspects of the sun Recently a group of researchers
led by David Jess of Queens University Belfast has revealed why the sunrsquos atmosphere is
hotter than its surface64 As you can see astronomy is a very developing science
64
CORDIS Researchers reveal why Suns atmosphere is hotter than its surface Internet (httpcordiseuropaeusearchindexcfmfuseaction=newsdocumentampN_LANG=ENampN_RCN=30598amppid=0ampq=87F36474805A6BEC0B89404F72D0351Famptype=sim) 20032009
832019 Ew Afgewerkte Final
httpslidepdfcomreaderfullew-afgewerkte-final 2859
28
Glossary
Absorption lines A dark line superimposed on a continuous spectrum when a gas absorbs
light from a continuous source that is hotter than the absorbing gas
Aurora Light radiated by atoms and ions formed by the solar wind in the earthrsquos upper atmosphere seen most commonly in the polar regions
Chromosphere The layer in the solar atmosphere between the photosphere and the corona It
is the lowest layer of the atmosphere characterized by reddish hue and by an increase of the
temperature with altitude through all but its lower regions
Convection The transfer of heat from a region of high temperature to a region of lower
temperature by the displacement of the cooler molecules by the warmer molecules The hot
gas will be moved upwards the cool gas will be pushed downwards into the sun
Corona The sunrsquos outer atmosphere It is very extensive and has a very low density It isextremely hot
Coronal hole A dark region of the sunrsquos inner corona as seen at X-ray wavelengths
Coronal loop Closed loops of magnetic field lines extending from the sunrsquos photosphere into
the corona which contain plasma at high temperature They are typically observed through
ultraviolet or x-ray emission from the hot plasma
Coronal mass ejection Large volumes of high energy gas released from the sunrsquos corona
Differential rotation The rotation of a non rigid object in which parts at different latitudes or
different radial distances move at different speeds
Dynamo theory The generation of a magnetic field by circulating electric charges
Eclipse The blocking of a part or all of the light from the moon by the earth (lunar eclipse) or
from the sun by the moon (solar eclipse)
Emission lines Emission lines are used in physics chemistry and astronomy to determine
what kind of gas is doing the emission Every element has a different electronic structure and
will thus have a different emission line fingerprint Emission lines are produced whenelectrons in atoms jump from one energy level to lower energy level
Filament A dark curve seen above the sunrsquos photosphere that is the top view of a solar
prominence
Flux tube Is a generally tube-like (cylindrical) region of space containing a magnetic field
such that the field at the side surfaces is parallel to them Both the cross-sectional area of the
tube and the field contained may vary along the length of the tube but the magnetic flux is
always constant
832019 Ew Afgewerkte Final
httpslidepdfcomreaderfullew-afgewerkte-final 2959
29
Geomagnetic storm When unusually strong surges of solar wind (charged particles from the
Sun) hit the Earth This effect causes variations in the magnetic field which surrounds the
Earth The visible results are eg the aurora (Northern and Southern lights)
Granulation Granules are related to the convective zone The granulation that shows up in the
photosphere is a result of the rising and falling of hot gas that takes place in the convectivezone
Hα absorption line An absorption line due to an electronic transition in hydrogen atoms in
which the atom absorbs a photon so that the electron makes a transition from a state
corresponding to the electronic energy level with n=2 to the one above with n=3 The photon
wavelength in a vacuum is 6563 nm
Heliosphere The volume of space within which the sun through the solar wind influences its
environment in the interstellar medium
Magnetic dynamo A theory that explains phenomena of the solar cycle as a result of periodicwinding and unwinding of the sunrsquos magnetic field in the solar atmosphere
Magnetic reconnection A process taking place in a plasma in which neighbouring
oppositely directed magnetic field lines suddenly part and reconnect in a new configuration
The abrupt change in a magnetic field represented by this process can release large amounts
of energy and it is thought to be important in explaining solar flares and other phenomena
Penumbra The portion of a shadow in which only part of the light source is covered by the
shadow-making body
Photosphere The region in the solar atmosphere from which most of the visible light escapes
into space
Plasma A fourth state of matter (not found naturally on Earth) of very hot gases Plasma is a
fluid with the ability to carry electric currents with no local accumulations of electric charge
Prominence Flamelike protrusion seen near the limb of the sun and extending into the solar
corona The side view of a filament
Quantum theory A theory in physics based on the principle that matter and energy have the
properties of both particles and waves created to explain the radiation of energy from a blackbody the photoelectric effect and the Bohr theory and now used to account for a wide
range of physical phenomena including the existence of discrete packets of energy and
matter the uncertainty principle and the exclusion principle Itrsquos a theory of the interaction of
matter and radiation developed early in the twentieth century which is based on the
quantization of energy and applied to a wide variety of processes that involve an exchange of
energy at the atomic level
Reconnection See magnetic reconnection
Solar cycle A 22-year-cycle during which the sunrsquos magnetic field reverses its polarity twice
Solar flare A violent eruption on the sunrsquos surface
832019 Ew Afgewerkte Final
httpslidepdfcomreaderfullew-afgewerkte-final 3059
30
Solar wind An outward flow of particles (mostly electrons and protons) from the sun
Solstice Either of two points along the ecliptic at which the Sun reaches its maximum
distance north or south of the celestial equator
Spectroscopy Concerns the production and study of spectra
Spectrum The result of electromagnetic radiation passing through a prism or grating so that
different wavelengths are separated
Spicule Short-lived (lifetime from rising to falling is about 15 minutes) jets vertical to the
solar surface that are several thousand kilometres long and about 1 kilometre thick (see also
appendix IV) in the solar chromosphere
Sunspot A temporary cool region in the solar photosphere created by protruding magnetic
fields
Umbra The central completely dark portion of a shadow
Zeemaneffect A splitting of spectra lines in the presence of a magnetic field
Bibliography and webography of the glossary
COMINS NF and KAUFMANN III WJ Discovering the universe eighth edition WH
Freeman and Company New York 2008 535 p
GREEN SF and JONES M H An introduction to the Sun and Stars The Open University
Cambridge 2004 373 p
httpenmimihuastronomygranulationhtml
httpenmimihuastronomyplasmahtml
httpwwwspacecomspacewatchspace_weather_glossaryhtml
httpenmimihuastronomyemission_linehtml
httpenmimihuastronomyabsorption_linehtml
httpwwwpbsorgfaithandreasonphysglossqm-bodyhtml
httpwwwanswerscomtopicquantum-theory
httpenwikipediaorgwikiFlux_tube
832019 Ew Afgewerkte Final
httpslidepdfcomreaderfullew-afgewerkte-final 3159
31
Appendix I The sun in figures
Physical quantity Comment
Radius 695 510 km 109 x earths radius
Mass 1989 x1030 kg 332 946 earths mass
Mass sun in the solar
system
9986 Total mass sun total mass of
our solar system
Volume 1412 x10sup3sup3 cmsup3 13 million x earths volume
Age 455 milliard years
Luminosity 3854 x 10sup3sup3 ergss
Magnitude -2773
Density center 1513 gcmsup3
Density mean 1409 gcmsup3
Pressure center 2334 x1011 bars
Pressure photosphere 00001 bar
Temperature center 15 557 000deg K
Temperature photosphere 5 780deg K Various sources mention
different grades
Temperature corona 2 000 000 to 3 000 000deg K
Rotation time at North or
South pole
up to 35 days on earth
Rotation time at Equator 25 days on earth The difference in rotation
times is called differential
rotation
Rotation time general 2538 days on earth
Mean distance sun-earth
(AU)
14959787 x108 km 1 AU = 1 Astronomical Unit
= 149 598 000 km
Chemical composition of
the sun ( of total number
of atoms)
Hydrogen 921
Helium 78
All others 01
Various sources mention
slightly different percentages
832019 Ew Afgewerkte Final
httpslidepdfcomreaderfullew-afgewerkte-final 3259
32
Chemical composition of
the sun ( of total mass)
Hydrogen 7346
Helium 2485
All others 169
Various sources mention
slightly different percentages
Total transforming of
hydrogen into helium persecond
700 billions of kilograms of
hydrogen are transformedinto 6957 billions of
kilograms of helium each
second
Based on the following references
- BEATTY JK PETERSEN CC and CHAIKIN A The new solar system fourth edition
Cambridge University Press Cambridge 1999 p 421
- LILENSTEN J and BORNAREL J Sous les feux du soleil EDP Sciences Les Ulis
Cedex A 2001 p 247
- LANG KR Sun earth and sky Springer Germany 1995 p 282- DENTHIER T Het zonnestelsel Standaard Uitgeverij 1992 p 415
- JANSSENS J Zon en aarde een unieke relatie Garant Antwerpen 2003 p 254- VOLKSSTERRENWACHT URANIA VZW De zon Internet(httpwwwuraniabesterrenkundezonnestelselzonphp) (01012009)
832019 Ew Afgewerkte Final
httpslidepdfcomreaderfullew-afgewerkte-final 3359
33
Appendix II Anatomy of the sun
httpwwwcosmographicacomgalleryinfographicssolar_anatomyhtml
The middle the sun consists of a heavy core this consists of plasma just as the outer layers
of the sun but the pressure in the core is so high that it behaves much more like a solid bodyThe most outer layer is the corona it reaches far into space More to the inside there is the
chromosphere and then the photosphere The corona the chromosphere and the
photosphere are explained in chapter 1
832019 Ew Afgewerkte Final
httpslidepdfcomreaderfullew-afgewerkte-final 3459
34
Appendix III Granulation
httpwwwwindowsucaredutourlink=sunSolar_interiorsolar_furnacehtml
At the surface of the sun we can find granules These are created by convection the warmest
parts of the sunrsquos interior move upwards and the colder parts at the surface move downwardsThis causes currents of plasma The dark lines are the colder particles We see them darker
because they emit less light than their surrounding neighbourhood
832019 Ew Afgewerkte Final
httpslidepdfcomreaderfullew-afgewerkte-final 3559
35
Appendix IV Spicules
Picture httplpc1clpccdcccauslpcharpellastro20a20deinfo_s09htmInformation httpwwwdaviddarlinginfoencyclopediaSspiculehtml
On this picture you can see spicules Spicules only last for several minutes and can be foundin the chromosphere They are little jets of gas There also exist macrospicules that can be
approximately ten times larger than a normal spicule
832019 Ew Afgewerkte Final
httpslidepdfcomreaderfullew-afgewerkte-final 3659
36
Appendix V The most important satellites observing the sun
Here you can find the most important satellites observing the sun and their missions
Solar and Heliospheric Obseratory (SOHO)
httpsohowwwnascomnasagovaboutabouthtml
SOHO the Solar amp Heliospheric Observatory is a project of international collaboration
between ESA and NASA to study the Sun from its deep core to the outer corona and the solar
wind
SOHO was launched on December 2 1995 The SOHO spacecraft was built in Europe by an
industry team led by prime contractor Matra Marconi Space (now EADS Astrium) under
overall management by ESA The twelve instruments on board SOHO were provided by
European and American scientists Nine of the international instrument consortia are led by
European Principal Investigators (PIs) three by PIs from the US Large engineering teamsand more than 200 co-investigators from many institutions supported the PIs in the
development of the instruments and in the preparation of their operations and data analysis
NASA was responsible for the launch and is now responsible for mission operations Large
radio dishes around the world which form NASAs Deep Space Network are used for data
downlink and commanding Mission control is based at Goddard Space Flight Center in
Maryland
More information about SOHO can be found on
httpsohowwwnascomnasagovaboutdocsSOHO_Fact_Sheetpdf
832019 Ew Afgewerkte Final
httpslidepdfcomreaderfullew-afgewerkte-final 3759
37
Transition Region and Coronal Explorer (TRACE)
httptracelmsalcomProjectMissionmissionhtm
TRACE enables solar physicists to study the connections between fine-scale magnetic fields
and the associated plasma structures on the Sun in a quantitative way by observing the photosphere the transition region and the corona With TRACE these temperature domains
are observed nearly simultaneously (with as little delay as only a second between different
wavelengths) with a spatial resolution of one second of arc
This is accomplished by obtaining precisely coaligned image sequences of photosphere
transition region and corona with high spatial resolution and uninterrupted viewing of the
Sun for up to eight months
TRACE Mission
TRACE explores the magnetic field in the solar atmosphere by studyingbull The 3-dimensional field structure
bull Its temporal evolution in response to photospheric flows
bull The time-dependent coronal fine structure
bull The coronal and transition region thermal topology
TRACE was launched on a Pegasus launch vehicle from Vandenberg Air Force Base in April
1998 The launch was scheduled to allow joint observations with SOHO during the rising
phase of the solar cycle to sunspot maximum No transition region or coronal imager has
witnessed the onset and rise of a solar cycle
Pegasus in flight
The two satellites provide complementary observations TRACE produces the high spatial
and temporal resolution images while SoHO yields images and spectral data out to 30 solar
radii at much lower spatial and temporal resolution Jointly they provide the opportunity to
obtain simultaneous digital measurements of all the temperature regimes of the solar
atmosphere in both high-resolution imaging and spectroscopy
With these data we expect to shatter the current ignorance of coronal heating and impulsive
MHD phenomena with benefits not only to solar physics but also to studies ranging from
stellar activity to the MHD of accretion disks The magnetograms produced by MDI on SoHO
provide a complete record of the eruption and distribution of photosphere magnetic fields
which will be invaluable for understanding TRACE observations of coronal hole formation
and coronal mass ejections Both of these phenomena have profound effects on our space
environment and the Earth`s magnetic field
TRACE is the first US solar research satellite since the Solar Maximum Mission
Coordination with SOHO provides an unprecedented opportunity to follow the emergence of
magnetic flux from the base of the convection zone deep inside the Sun through the
photosphere chromosphere and transitional region to the low-beta outer corona while
observing the effects of this emergence such as coronal mass ejections with high spatial andtemporal resolution
832019 Ew Afgewerkte Final
httpslidepdfcomreaderfullew-afgewerkte-final 3859
38
The transition from the photosphere where magnetic fields and plasma are in rough
equipartition to the corona where magnetic fields dominate is extremely difficult to model
and until recently to observe at high temporal and spatial resolution Many of the physical
problems that arise here such as plasma confinement reconnection wave propagation and plasma heating arise throughout space physics and astrophysics The detailed study of these
processed in the solar outer atmosphere is invaluable to astrophysics in general and stellar
studies in particular
More information about TRACE observations can be found on
httptracelmsalcomOperationsGeneraloperatiohtm
832019 Ew Afgewerkte Final
httpslidepdfcomreaderfullew-afgewerkte-final 3959
39
Reuven Ramaty High Energy Solar Spectroscopic Imager (RHESSI)
httphesperiagsfcnasagovhessibrochurehtm
What Questions will HESSI Address
bull How is such a large amount of energy released so rapidly during a flare
bull How are so many electrons and protons accelerated so quickly to such high energies
bull Where are the electrons and protons accelerated in the solar atmosphere and where do
they deposit their energy
How will HESSI Address these Questions
HESSI shown below will concentrate on electrons and protons accelerated in solar flares
through observations of the X-rays and gamma rays that they produce
bull HESSI will obtain the first ever X-ray and gamma-ray images of flares from 100 keV
to 20 MeVbull HESSI will do the first ever nuclear gamma-ray line spectroscopy of solar flares
bull HESSI will obtain pictures of flares in X-rays with an angular resolution of 2
arcseconds a factor of three better than previously possible
bull HESSI will measure X-ray and gamma-ray spectra with less than 1 keV energy
resolution a factor of 20-40 better than previously possible with scintillation counters
More information about the RHESSIrsquos Mission can be found on
httphesperiagsfcnasagovhessiconcepthtm
832019 Ew Afgewerkte Final
httpslidepdfcomreaderfullew-afgewerkte-final 4059
40
Solar Radiation and Climate Experiment (SORCE)
httplaspcoloradoedusorcesciencebackgroundhtm
The Solar Radiation and Climate Experiment (SORCE) is a NASA-sponsored satellite
mission that is providing state-of-the-art measurements of incoming x-ray ultraviolet visiblenear-infrared and total solar radiation The measurements provided by SORCE specifically
address long-term climate change natural variability and enhanced climate prediction and
atmospheric ozone and UV-B radiation These measurements are critical to studies of the Sun
its effect on our Earth system and its influence on humankind
The SORCE spacecraft was launched on January 25 2003 on a Pegasus XL launch vehicle to
provide NASAs Earth Science Enterprise (ESE) with precise measurements of solar
radiation It launched into a 645 km 40 degree orbit and is operated by the Laboratory for
Atmospheric and Space Physics (LASP) at the University of Colorado (CU) in Boulder
Colorado USA It will continue the precise measurements of total solar irradiance (TSI) that
began with the ERB instrument in 1979 and has continued to the present with the ACRIM series of measurements SORCE will also provide the measurements of the solar spectral
irradiance from 1nm to 2000nm accounting for 95 of the spectral contribution to TSI
SORCE carries four instruments including the Spectral Irradiance Monitor (SIM) Solar
Stellar Irradiance Comparison Experiment (SOLSTICE) Total Irradiance Monitor (TIM) and
the XUV Photometer System (XPS)
The primary goal of the NASA Earth Observing Systems (EOS) SOlar Radiation and Climate
Experiment (SORCE) is to enable solar-terrestrial studies by providing precise daily
measurements of the total solar irradiance (TSI) and the solar spectral irradiance atwavelengths extending from the ultraviolet to the near infrared The following lists the
SORCE science objectives
1 Make accurate measurements with high precision of total solar irradiance connect
them to previous TSI measurements and continue this long-term climate record
Provide TSI with an accuracy of 001 (100 parts per million) based on SI units and
with a long-term repeatability of 0001yr
2 Make daily measurements of the solar ultraviolet irradiance from 120 to 300 nm with
a spectral resolution of 1 nm Achieve this spectral irradiance measurement with an
accuracy of better than 5 and with a long-term repeatability of 05yr Use the
solarstellar comparison technique to relate the solar irradiance to the ensembleaverage flux from a number of bright early-type stars (same stars used by the UARS
SOLSTICE program)
3 Make the first measurements of the visible and near IR solar irradiance with sufficient
precision for future climate studies Obtain daily measurements of solar spectral
irradiance between 03 and 2 microm with a spectral resolution of at least 130 an
accuracy of 003 and a long-term repeatability of better than 001yr
4 Improve the understanding of how and why solar irradiance varies estimate past and
future solar behavior and investigate climate responses
More information about SORCE can be found on
httplaspcoloradoedusorcesciencescience_opshtm
832019 Ew Afgewerkte Final
httpslidepdfcomreaderfullew-afgewerkte-final 4159
41
Appendix VI Wavelengths
httpeosweblarcnasagovEDDOCSWavelengths_for_Colorshtml
As you can see on the figure visible light situates in the centre of the wavelengths having not
the shortest nor the longest wavelengths Gamma rays have the shortest wavelength radioways the longest All sort of wavelengths are used for daily purpose like radio waves for
radio and TV and gamma rays for treatments
832019 Ew Afgewerkte Final
httpslidepdfcomreaderfullew-afgewerkte-final 4259
42
Appendix VII Absorption lines in the sunrsquos spectrum
Picture httpwwwsolarnavigatornetthe_sunhtmExplanation COMINS NF and KAUFMANN III WJ Discovering the universe eighth edition WHFreeman and Company New York 2008 p 109
This photo is called a spectrogram It contains the spectrum of the sun All the black lines are
absorption lines The amount of black lines is related to the amount of elements that the sun
is emitting From a spectrogram we can deduct a lot of things including their mass the
temperature of the surface the chemical composition of the sun rotation rates and much
more
832019 Ew Afgewerkte Final
httpslidepdfcomreaderfullew-afgewerkte-final 4359
832019 Ew Afgewerkte Final
httpslidepdfcomreaderfullew-afgewerkte-final 4459
44
Appendix IX Butterfly-diagram
httpspacesciencespacerefcomsslpadsolarimagesbflygif
A butterfly-diagram
In a butterfly-diagram we can find the sunspots with their latitude (y-axis) through the years(x-axis) As you can see the sunspots appear like lsquobutterfliesrsquo this was discovered in 1904 by
Edward Maunder (1851-1928 an English astronomer best remembered for his study of
sunspots and the solar magnetic cycle) Thatrsquos why this graph is also called Maunders
butterfly diagram
832019 Ew Afgewerkte Final
httpslidepdfcomreaderfullew-afgewerkte-final 4559
45
Appendix X The Wolf-numbers
httpsidcomabenews106sunspotnumberclarifiedpdf
The sunspot number clarified By Petra Vanlommel
Which kinds of daily International Sunspot Numbers (ISN) are currentlypublished by the SIDC
Three daily indices are currently published by the SIDCthe Estimated ISN (EISN)the Provisional ISN (PISN)the Definitive ISN (DISN)Although they are all based on the same type of observations ie visual sunspot counts as ameasure of solar activity they are obtained from different data sets by different processingmethods with different accuracies and they serve different purposes
In the ideal case the three numbers are equal but in practice it is inevitable that there aresmall differences Therefore It is useful to explain what each index actually means
What is the source of the Wolf number
Once per day observers worldwide communicate their measured Wolf number (= 10G + S)based on visual sunspot (S) and group (G) counts to the World Data Center for the SunspotIndex Presently this is done through a dedicated password-protected WEB form the Wolfinterface However some observers still use the old way of reporting their observations onpaper through regular mail This method slows down the final processing but for the sake ofcontinuity in the index it is important to keep these observers included as some of them
represent the longest individual datasetsThe observers give the exact observing time the observing conditions the total numbers(group count sunspot count and Wolf number) and optionally the NorthSouth and centralzone numbers The observers using the web interface can provide their results to the SIDCimmediately after each observation However some users prefer to insert their data as ablock creating some delay but this must be done at least once a month
The personal reduction coefficient K
A personal reduction coefficient K is calculated for each station It has values typically in therange 04 and 17 and leads to a normalized sunspot number K(10G+S) In other words theK factor rescales the raw sunspot counts of each observer to the ones of Rudolph Wolf the
astronomer who introduced the above Wolf formula thus simulating the same eyes sametelescope and same conditionsDuring the procedure for calculating the Provisional ISN the K factor of every station iscomputed for every observation that passes the elimination procedure Once a year apersonal K factor for every station and for every month of the previous year is calculated Ayearly mean K value per station is also computed
The estimated sunspot index
The Estimated ISN (EISN) is calculated and issued on a daily basis for the day of calculationand the day before Only the total EISN is calculated with no hemispheric index It is anautomated procedure and no manual intervention is done The EISN is meant as a quicktemporary and approximate index for real-time applications
832019 Ew Afgewerkte Final
httpslidepdfcomreaderfullew-afgewerkte-final 4659
46
We use the raw Wolf number from all observatories that have provided counts early in theday ie before 1230 UT Typically there is between 10 and 20 stations available Thecalculation of the EISN is based on a simple and straightforward statistical method The Wolfnumbers are multiplied with the yearly mean K factor (see paragraph about the personalreduction coefficient K) The EISN is a simple average of the K-scaled values after excludingany individual value that deviates abnormally from the other valuesOnce the Provisional ISN (PISN) is calculated after the end of a month the temporary EISNis dropped and replaced by the PISN
The provisional sunspot Index
The Provisional ISN (PISN) is calculated and issued on the first of every month Theoutcome is a daily total and hemispheric sunspot number for the entire elapsed month Anexample on the first of September we calculate the daily PISN for each day of August ThePISN is computed semi-automatically with as little manual intervention as possibleTo calculate the PISN values for the concerned month we use all Wolf numbers Typicallythere is data from around 65 stations available
The calculation of the PISN is based on an extensive statistical treatment This treatmentfilters out any abnormal daily observation or the complete data set from an erratic station(quality control) This prevents long-term drifts in the resulting index One of the key elementsderived from this processing is to update the K reduction coefficients for each station theevolution of each station is monitored for each day relative to the entire networkA subset of the contributing stations also provides hemispheric counts A similar process isapplied to the North and South counts to derive the hemispheric PISN There is an additionalconstraint the sum of the North and South ISN must match the total ISNThe PISN replaces the EISN And once the Definitive ISN (DISN) is calculated the DISNreplaces the PISN
The definitive sunspot index
The Definitive ISN is calculated and issued on a quarterly basis when we have collecteddata from all the contributing observatories This is the final index and it is appended to thehistorical sunspot index time series The same semi-automated treatment as for the PISN isnow applied to the full data set If the result agrees within 5 of the PISN value the PISN iskept and becomes definitive Otherwise the new calculated value replaces the PISN andbecomes the definitive ISNIt is only at this stage and only in peculiar situations that a manual verification by ourscientific staff is required For example this happens when the observed raw Wolf valuesfrom the whole network are clustered around two distinct values This special case can becaused by small short-lived isolated sunspots (lifetimes lt 24 hours) or by the appearance ordisappearance of a large group at the solar limb in the course of one UT dayThe DISN replaces the provisional and estimated International Sunspot Number
Handling very low activity levels
One of the situations requiring a human arbitration is associated with single small isolatedand short-lived sunspots This is most noticeable around the minimum of the solar activitycycle like the one occurring now in 2008 Due to the 24hour binning (observations aregrouped between 0hUT and 24hUT) and the variable ability of each observer to detect thesmallest sunspots we end up with some stations reporting one sunspot and others who didno see any sunspot Let us explain further No sunspot may mean that the sunspot waspresent but the observer was unable to see it because of poor observational conditions such
as weather a small telescope On the other hand it may also indicate that the sunspot hadactually vanished by that time while it was present earlier on the same day
832019 Ew Afgewerkte Final
httpslidepdfcomreaderfullew-afgewerkte-final 4759
47
Individual stations do not observe at exactly the same timeIn order to validate the existence of such a marginal reported sunspot a qualified SIDCscientist must then check the detailed chronology within that day and consider the overallobserver capability (value of K coefficient)In common practice the fact that a sunspot is reported by a significant group of observersleads to the inclusion of the sunspot on that date thus neglecting the no-sunspotobservationsThe rationale is multiple observations of a sunspot exclude the possibility that the reportedsunspot was an independent false detection So a sunspot was really present on that dayalthough it may have existed only for part of the day or it was small enough to be missed bypart of the observers with smaller instruments or imperfect atmospheric conditionsAlso keep in mind that the sunspot index is derived with a limited precision just like any otherindex If the monthly mean sunspot number is 0 or 05 you can definitely say that activitywas low
What index should be used
If you want to perform long-term investigations the definitive ISN series is definitely the mostsuitable However there is a delay of a few months So when investigating the last cycle andrecent evolution use the definitive numbers in combination with the provisional ISN to be upto date to the last month The provisional numbers are also used in models forecasting thesunspot number for the coming months Now if you need a proxy for solar activity in a modelthat runs in real-time then you may use the estimated ISNImprovements and rethinking of the processing method is an ongoing project We arecurrently developing an alternative program for calculating the PISN Of course long-termconsistency is vital Therefore a cross-analysis between the output from the old and newsoftware must be applied over an extended period
832019 Ew Afgewerkte Final
httpslidepdfcomreaderfullew-afgewerkte-final 4859
48
Above graphs show different kinds of the International Sunspot Number The left plot gives an overview from 1700 up to now from the yearly (black) and monthly smoothed Sunspot Number The graph in the right top corner shows the monthly and monthly smoothed sunspot number while the graph in the right bottom corner show the daily monthly smoothed monthly sunspot number For every the time range of investigation there is an appropriate sunspot number
832019 Ew Afgewerkte Final
httpslidepdfcomreaderfullew-afgewerkte-final 4959
49
Appendix XI Filaments and prominences
httpsohowwwnascomnasagovpickoftheweekold26feb2004
This is a picture taken by SOHO on 26 February 2004
832019 Ew Afgewerkte Final
httpslidepdfcomreaderfullew-afgewerkte-final 5059
50
Appendix XII The reconnection of magnetic loops
httpwwwioporgEJarticle0004-637X558287253575webpdfrequest-id=73e38daa-69ae-4e01-b9a6- b4bd0ba071dd
In (a) sunspot B and C have different polarity and move towards each other The twomagnetic loops will reconnect and form one big magnetic loop showed in (b) This will
happen to other magnetic loops too as can be seen in (c) When G en F are close enough they
will reconnect and so E en H will reconnect too It is possible that the magnetic field line is
trapped around another in this case AD The mass ejected from the sun will be trapped
between the magnetic field lines and form a solar prominence
832019 Ew Afgewerkte Final
httpslidepdfcomreaderfullew-afgewerkte-final 5159
832019 Ew Afgewerkte Final
httpslidepdfcomreaderfullew-afgewerkte-final 5259
52
httptheinvisibleagentwordpresscom20090117amazing-celestial-images
An group of active prominences
httpapodnasagovapodap051109html
httpwhassupinthemilkywayblogspotcom200903cloudy-planhtml
A picture taken by SOHO In the left corner you can see the prominence with twisted
magnetic field lines
832019 Ew Afgewerkte Final
httpslidepdfcomreaderfullew-afgewerkte-final 5359
53
Appendix XIV Polar crown
httpsciencenasagovheadlinesy200817sep_polarcrownhtm
Photograph of a polar crown taken on 13 June 1999 by the Meudon Observatory
832019 Ew Afgewerkte Final
httpslidepdfcomreaderfullew-afgewerkte-final 5459
54
Appendix XV Coronal holes
httpsunearthdaynasagov2007multimediagal_020php
The black segment is a huge coronal hole The bright parts are x-rays from sunspots
832019 Ew Afgewerkte Final
httpslidepdfcomreaderfullew-afgewerkte-final 5559
55
Appendix XVI Coronal mass ejection
httpzuserver2staruclacuk~idhapodap000309html
Picture of a CME taken by SOHO in February 2000
832019 Ew Afgewerkte Final
httpslidepdfcomreaderfullew-afgewerkte-final 5659
56
Bibliography
Books
BEATTY JK PETERSEN CC and CHAIKIN A The new solar system fourth edition
Cambridge University Press Cambridge 1999 421 p
COMINS NF and KAUFMANN III WJ Discovering the universe eighth edition WH
Freeman and Company New York 2008 535 p
DETHIER T Het zonnestelsel Standaard Uitgeverij 1992 415 p
GOLUB L and PASACHOFF JM Nearest star the surprising science of our sun Harvard
university press Harvard 2001 267 p
GREEN SF and JONES M H An introduction to the Sun and Stars The Open University
Cambridge 2004 373 p
HILL S and CARLOWITZ M The sun Abrams New York 2006 239 p
HOLMAN GD lsquoThe mysterious origins of solar flaresrsquo Scientific America April 2006 p
24-31 volume 294 number 4
JANSSENS J Zon en aarde een unieke relatie Garant Antwerpen 2003 254 p
KELLER H-U Van Supernovarsquos tot zwarte gaten Tirion Natuur AH Baarn 2003 169 p
LANG KR Sun earth and sky Springer Germany 1995 282 p
LILENSTEN J and BORNAREL J Sous les feux du soleil EDP Sciences Les Ulis Cedex
A 2001 247 p
832019 Ew Afgewerkte Final
httpslidepdfcomreaderfullew-afgewerkte-final 5759
57
Articles
CUYPERS J and others lsquoLa rechercheacute en heacuteliophysique en Belgiquersquo Space connection
October 2007 20 p
DE KEYSER J lsquoDe magnetopauzersquo Heelal maart 1998 p 66-73
JANSSENS J lsquoHet maximum van de 23ste zonnevlekkencyclus (I)rsquo Heelal Oktober 1998 p
256-263
JANSSENS J lsquohet maximum van de 23ste zonnenvlekkencyclus (II)rsquo Heelal November
1998 p 284-290
JANSSENS J lsquoZonnefakkelsrsquo Heelal Oktober 1994 p 256-261
SMITS F lsquoDe coronarsquo Heelal Februari 1999 p 40-42
SMITS F lsquoProtuberanzenrsquo Heelal Juli 1991 p 182-185
VAN DEN BERGHE S lsquoHet Zeemaneffectrsquo Heelal September 1998 p 228-231
832019 Ew Afgewerkte Final
httpslidepdfcomreaderfullew-afgewerkte-final 5859
58
Webography
BOEN B Birth of a coronal mass ejection Internet
(httpwwwnasagovmission_pagessolar-b solar_005html) 290408
BRAEUNIG R A Glossary Internet (httpwwwbraeunigusspaceglossaryhtm) 2006
CORDIS Researchers reveal why Suns atmosphere is hotter than its surface Internet
(httpcordiseuropaeusearchindexcfmfuseaction=newsdocumentampN_LANG=ENampN_R
CN=30598amppid=0ampq=87F36474805A6BEC0B89404F72D0351Famptype=sim) 20032009
DAY C Alfveacuten waves may heat the Sunrsquos corona Internet
(httpblogsphysicstodayorgupdate200903 alfven-waves-may-heat-the-sunshtml)
310309
ELLERMAN F Solar prominences Internet (httparticlesadsabsharvardedufull
1928ASPL173E 0000074000html) (03042009)
ENCYCLODPEDIA OF SCIENCE Corona hole Internet
(httpwwwdaviddarlinginfoencyclopediaC coronal_holehtml) (04042009)
HATHAWAY D H The sunspot cycle Internet
(httpspacesciencespacerefcomsslpadsolarsunspots htm) 04012000
JANSSENS J The case of the missing solar cycle (published in lsquoheelalrsquo January 2008)
Internet (httpuserstelenetbejjanssensMSCwebEngpdf)
KNISELY D Solar prominences Internet
(httpwwwicstarscomHTMLSolarSectionHAlphaOBSERVINGTHESUNHAlpha3html)
(03042009)
KOPANSKI J Atom Internet (httpknolgooglecomkjan-
kopanskiatom1amrwrct7rvi27) 060209
MARTENS PC and ZWAAN C Origin and evolution of filament-prominence systems
Internet (http wwwioporgEJarticle0004-637X558287253575webpdfrequest-
id=73e38daa-69ae-4e01-b9a6-b4bd0ba071dd) 092001
NASA The corona Internet (httpsolarsciencemsfcnasagovcoronashtml) 180107
NASA The heliosphere Internet (httpheliosgsfcnasagovheliosphhtml) 20012009
OFFICIAL SITE OF STONEHENGE About Stonehenge Internet
(httpwwwstonehengecouk) (03022009)
OTTERSDORF M Astronomy On the sunspot cycle Internet
(httpuserszoominternetnet~matto MCASsunspot_cyclehtmZeemaneffect) 031103
PARIAT E and SCHMIEDER B Magnetic flux emergence Internet(httpwwwscholarpediaorgarticleMagnetic_field_emergence) 18042008
832019 Ew Afgewerkte Final
httpslidepdfcomreaderfullew-afgewerkte-final 5959
59
PRIEST E R Dynamics and Structure of Quiescent Solar Prominences Internet
(httpbooksgooglebe booksid=h599q3jz1w4Campdq=quiescent+prominencesampprintsec=fro
ntcoverampsource=blampots=58b79Qeyabampsig=1eklQ-
WszOIebZZaq7fq7gm6bxAamphl=nlampei=urPtSe7ZCo61-
Qa166jHDwampsa=Xampoi=book_resultampct=result ampresnum=3PPA6M2) 1989
RUSSELL R Rotation of the sun Internet
(httpwwwwindowsucaredutourlink=sunSolar_interior
Sun_layersdifferential_rotationhtml) 16082005
RUSSELL R Sunspots and magnetic fields Internet
(httpwwwwindowsucaredutourlink=sunatmospheresunspot_magnetismhtmlampedu=hig
h) 060908
UNIVERSITY OF GLASGOW Bibliography of Peter Sweet Internet
(httpwwwuniversitystoryglaacuk biographyid=WH2144amptype=P) (10042009)
WIKIPEDIA Orbiting Solar Observatory Internet
(httpenwikipediaorgwikiOrbiting_Solar_Observatory) 24012009
WINDOWS TEAM Maunderrsquos Butterfly Diagram Internet
(httpwwwwindowsucaredutourlink=sun activitybutterflyhtml) 2000
832019 Ew Afgewerkte Final
httpslidepdfcomreaderfullew-afgewerkte-final 1559
15
Figure 5 The switching of the magnetic poles of the sun
GREEN SF and JONES M H An introduction to the Sun and Stars The Open University Cambridge 2004 p73
When finally the poles have switched and the magnetic field lines are disentangled the cycle
will just start over again for another eleven years Because the magnetic poles of the sun
switch every eleven years the cycle is called the 11-year-solar cycle
34 Other cycles
341 The 22-year-cycle
If we take the magnetic poles into account however the 11-year-cycle becomes a 22-year-
cycle because the magnetic poles switch If we want to consider the strict cycle which means
that we take the magnetic poles into account we have to call the solar cycle a 22-year-cycleIt takes eleven years to switch the magnetic North Pole into a South Pole and another eleven
years to switch them back This cycle is called the Hale-cycle named after George Ellery
Hale (1868-1938) who was an American solar astonomer and active in different
observatories30
342 The 27-day-cycle31
The 27-day-cycle taking the average of the sunrsquos rotation time is a cycle that is directly
connected to the rotation time of the sun The sunspots the coronal holes and other
phenomena that are related to the activity of the sun rotate too This means that the activity of the sun is connected to the rotation cycle For example the part of the sun that we can see will
be less active when the sunspots are not visible because the sunspots influence the solar
activity When the sunspots appear again the activity of the sun will rise This cycle is also
known because of the coronal holes that influence the solar wind
30JANSSENS J lsquohet maximum van de 23
stezonnenvlekkencyclus (II)rsquo Heelal November 1998 p 284-290
31 JANSSENS J Zon en aarde een unieke relatie Garant Antwerpen 2003 p 113
832019 Ew Afgewerkte Final
httpslidepdfcomreaderfullew-afgewerkte-final 1659
16
343 Other cycles
Astronomers believe that there must be some other cycles of an even longer basis Different
researchers have been looking for other solar cycles Some thought they found a 55-year
cycle However this cycle was very irregular Max Waldmeier (1912-2000 a very eminent
solar astronomer of the 20th
century) found a 90-year-cycle However lots of other cycleshave been ldquofoundrdquo There have been postulated a 2300-year-cycle too But the records of
solar cycles are too recent to prove this cycle 32
35 Solar maximum and minimum
The Royal Greenwich Observatory has been observing the sunspots since 1874 The
information of their observations includes the size the position and the number of sunspots
during all the recorded solar cycles If we put all this information into a graph we can see the
so-called butterfly-graph (appendix IX) With this information we can conclude that sunspots
do not appear at random33
At the beginning of a new solar cycle the first sunspots appear at latitude of 45 degrees Later
on sunspots will appear at the equator too When the sunspots begin to appear at 45 degrees a
new cycle has started again34 The solar minimum is the starting point of the solar cycle At
the beginning sunspots are very rare sometimes there are none If there are any sunspots they
will occur at higher latitudes The solar activity is the least on solar minimum Then it is a
good time for astronauts to go into space because there are less sunspots and less solar flares
and other phenomena that can influence the solar wind and so the space weather When the
solar activity is the highest the solar cycle reaches its maximum There will be a lot of
sunspots which now occur on lower latitudes too35 The time to go from a solar minimum to a
solar maximum is around four years During this time the solar activity will rise and when it
reaches its maximum it will slowly decline The decrease takes much more time than the
increase of the solar activity around 7 years The time between a solar minimum and
maximum and between a solar maximum and minimum can vary and is different for every
solar cycle36
36 Mysteries of the solar cycle
Astronomers have been able to find out a lot of details about the solar cycle However we are
still not able to predict the maximums and minimums of the solar cycles preciselyAstronomers havenrsquot been capable to draw up a model that allows us to predict the exact
number of sunspotshellip You can compare it to predictions for the weather to comehellip
32JANSSENS J Zon en aarde een unieke relatie Garant Antwerpen 2003 p 113-114
33HATHAWAY D H The sunspot cycle Internet (httpspacesciencespacerefcomsslpadsolarsunspots
htm) 0401200034 JANSSENS J Zon en aarde een unieke relatie Garant Antwerpen 2003 p 10335
WINDOWS TEAM Maunderrsquos Butterfly Diagram Internet (httpwwwwindowsucaredutourlink=sunactivitybutterflyhtml) 200036 JANSSENS J Zon en aarde een unieke relatie Garant Antwerpen 2003 p 99-100
832019 Ew Afgewerkte Final
httpslidepdfcomreaderfullew-afgewerkte-final 1759
17
Chapter 4 Phenomena caused by the magnetic field of the sun
41 Sunspots
411 What are sunspots
Sunspots appear on the sunrsquos surface when the magnetic field lines under the photosphere
are piled up too much and they finally pop out into the chromosphere Sunspots are normally
found in groups The number of sunspots is dependent on the solar activity when the solar
activity reaches its maximum there will be many more sunspots than at solar minimum
Measuring the magnetic field in sunspots with the Zeemaneffect makes clear that the
strength of the magnetic field is much stronger in sunspots than in the surrounding
photosphere Itrsquos more than thousand times stronger the magnetic field strength in magnetic
fields varies from 1000 to 4000 Gauss while the surrounding area circles around 1 Gauss
(comparison the earthrsquos magnetic field strength is about 05 Gauss)37
412 What do sunspots look like
When magnetic field lines pop out of the photosphere they will form magnetic loops (figure
6 on the right side) Between this magnetic loops there will be formed a flux tube The
magnetic field lines in the sunspot will distort the convection under the surface (see figure 6
on the left side) They will pull the plasma downwards and will prevent the warm plasma
from going upwards and reach the sunrsquos surface Eventually the temperature in the sunspot
will cool down38
Figure 6 Left side convection in sunspotsRight side magnetic field lines in sunspots
JANSSENS J Zon en aarde een unieke relatie Garant Antwerpen 2003 p41
37
RUSSELL R Sunspots and magnetic fields Internet (httpwwwwindowsucaredutourlink=sunatmospheresunspot_magnetismhtmlampedu=high) 06090838 JANSSENS J Zon en aarde een unieke relatie Garant Antwerpen 2003 p 40-41
832019 Ew Afgewerkte Final
httpslidepdfcomreaderfullew-afgewerkte-final 1859
18
We can distinguish 2 areas the black sunspot and the surrounding bright surface of the sun
The sunspot itself consists of the very dark centre called the umbra and the surrounding
orange-brown environment called the penumbra The penumbra consists of an amount of
small little striated f igures that come out of the umbra A sunspot can reach a diameter of
300 000 kilometres39 The temperature in the sunspots centre is much cooler than in the
photosphere because of the convection explained above It measures around 4 200 K whilethe photosphere has a temperature of 6000 K40
Figure 7 The composition of a sunspot
httpwwwjaxajparticlespecialastroshimizu02_ehtml
A sunspot appears black to our eyes However appearances are deceptive the dark sunspot
only seems dark because we see it against a much warmer environment If we h ad seen itagainst a black surface it would have been much brighter than the moonrsquos glowing41
The amount of sunspots varies from very few till over more than a hundred The amount of
sunspots can be predicted by the Wolf-numbers named after Johann R udolf Wolf (1816-
1893) a Swiss astronomer best known for his research on sunspots42 However I wonrsquot
explain this method in this paper You can find a briefly explanation in appendix X Yet this
method is only capable to predict the amount of sunspots approximately
42 Prominences
421 What is a prominence
The luminosity of the sun outshines lots of phenomena that take place on the surface of the
sun and even far away from the sun The sunrsquos corona is one example But luckily
prominences are quite visibly when we observe the sun A prominence is a huge cloud of gas
that is cooler than his environment It is trapped between two horizontal magnetic field lines
For human eyes it seems to spread out dark but this is only because a prominence has a much
39 LILENSTEN J and BORNAREL J Sous les feux du soleil EDP Sciences Les Ulis Cedex A 2001 p 3540 OTTERSDORF M Astronomy On the sunspot cycle Internet (httpuserszoominternetnet~matto
MCASsunspot_cyclehtmZeeman effect) 03110341JANSSENS J Zon en aarde een unieke relatie Garant Antwerpen 2003 p 41
42 JANSSENS J lsquoHet maximum van de 23ste zonnevlekkencyclus (I)rsquo Heelal October 1998 p 256-263
832019 Ew Afgewerkte Final
httpslidepdfcomreaderfullew-afgewerkte-final 1959
19
lower temperature then the sunrsquos chromosphere (similar to sunspots which spread out dark
too) The dark lines in appendix XI are also known as filaments A filament is a line between
to magnetic fields with opposite polarities (appendix XI)43
Figure 8 A solar prominence
httpcosmic-webcoukp=274more-274
422 What is a prominence made of
The gas from the prominence is coming from the chromosphere So the prominences have
approximately the same composition as the chromosphere A good way to observe
prominences is to use red Hα or blue Hβ spectrum lines Hα absorption lines indicate a
temperature lower than 10 000 Kelvin These spectrum lines justif y that the temperature of a prominence is remarkably lower than the temperature of the corona 44
423 How do prominences originate
A prominence is a result of the magnetic field Particles of the sun can transport warmth very
fast if they move alongside magnetic field lines If they want to move straight to a magnetic
field line the transport of warmth is negligible So prominences that are trapped between 2
magnetic fields only have one way to be heated This brings on a temperature that is notably
lower then the temperature in the corona45
The origin of prominences is similar to the origin of solar flares When two magnetic loops
of opposite polarity start to approach each other they will reconnect and form some new
loops This is shown in appendix XII Some mass from the sun will be trapped between the
new magnetic field lines and will form a solar prominence 46
43COMINS NF and KAUFMANN III WJ Discovering the universe eighth edition WH Freeman and
Company New York 2008 p 29944 SMITS F lsquoProtuberanzenrsquo Heelal Juli 1991 p 18345 LANG KR Sun earth and sky Springer Germany 1995 p 134-14046
MARTENS PC and ZWAAN C Origin and evolution of filament-prominence systems Internet ( httpwwwioporgEJarticle0004-637X558287253575webpdfrequest-id=73e38daa-69ae-4e01-b9a6- b4bd0ba071dd) 092001
832019 Ew Afgewerkte Final
httpslidepdfcomreaderfullew-afgewerkte-final 2059
20
424 What do prominences look like47
4241 Different groups of prominences
As you can see on the pictures in appendix XIII prominences can have different shapes and
forms Thatrsquos why astronomers classify them into different groups the quiescent prominences the active prominences and eruptive prominences
4242 Quiescent prominences
Quiescent prominences can appear everywhere on the sun and are not depending on latitude
They can reach into the corona over 2 500 till 40 000 kilometres Quiescent prominences last
the longest of all prominences Some of them even last several solar rotations long These
prominences are very long and not so wide During its lifetime a quiescent prominence moves
slowly to the poles When they are found at the poles of the sun they are called a lsquopolar
crownrsquo (appendix XIV)48
4243 Active prominences
Their name already suggests where they can be found active prominences are found in the
active regions of the sun moreover in the presence of sunspots These prominences
however only have a short lifespan only several hours But within this short lifespan they do
change form adjusting to the magnetic field lines within a short period of time Because
these prominences are located in active regions there are many more reconnections and so
the form will change more rapidly
4244 Eruptive prominences
These prominences only last a couple of minutes and are connected to active sunspots as well
It is possible that after one died out another immediately gives birth in the same region Other
eruptive prominences are known to be bubbles of gas that are issued from active sunspots
There have been some records of eruptive prominences that bump into other prominences and
push the other prominences back in the sunspot49
47 KNISELY D Solar prominences Internet (httpwwwicstarscomHTMLSolarSectionHAlpha OBSERVINGTHESUNHAlpha3html) (03042009)
SMITS F lsquoProtuberanzenrsquo Heelal Juli 1991 p 182-185
ELLERMAN F Solar prominences Internet (httparticlesadsabsharvardedufull 1928ASPL173E0000074000html) (03042009)48
KNISLEY D Solar prominences Internet (httpwwwicstarscomHTMLSolarSectionHAlphaOBSERVINGTHESUNHAlpha3html) (03042009)49 PRIEST E R Dynamics and Structure of Quiescent Solar Prominences Internet (httpbooksgooglebe
booksid=h599q3jz1w4Campdq=quiescent+prominencesampprintsec=frontcoverampsource=blampots=58b79Qeyabampsig=1eklQ-WszOIebZZaq7fq7gm6bxAamphl=nlampei=urPtSe7ZCo61-Qa166jHDwampsa=Xampoi=book_resultampct=resultampresnum=3PPA6M2) 1989
832019 Ew Afgewerkte Final
httpslidepdfcomreaderfullew-afgewerkte-final 2159
21
43 Coronal holes50
When looking at the sun with an x-ray telescope we can see dark regions across the sun
These dark regions are called coronal holes Coronal holes have an open magnetic field
structure This means that the magnetic fields lines do not angle downwards but they extend
into space indefinitely Due to this the particles of the sun are capable to reach out far intospace without any struggles against the magnetic field With this outflow of gases from the
sun coronal holes are one of the most important sources of the (high-speed) solar wind
(appendix XV)
44 Corona loops
441 What is a corona loop
If we look closer at a pair of sunspots we can see an emission of plasma alongside
magnetic field lines that originate in the sun spots A corona loop can extend into the coronaas the name suggests Those loops contain plasma that can reach a temperature higher than
106 Kelvin Corona loops can best be observed by ultra-violet and x-ray images because of
the high temperature The high temper ature brings on a high vibration of the atoms This
trembling causes the emission of x-rays51
Figure 9 A close up of corona loops
httpwwwdaviddarlinginfoencyclopediaCcoronal_loophtml
442 Where and when do corona loops originate
The magnetic field lines of sunspots move outwards from the sun into the corona and form
broad loops This makes it possible to trap hot gas with a temperature up to 40 million K
Those magnetic field loops trap hot plasma into the sunrsquos atmosphere The magnetic force
pushes particles around along the magnetic lines but at the same time the atoms circulate
around the magnetic field lines (see figure 10) The speed of their movements depends on the
50
ENCYCLODPEDIA OF SCIENCE Corona hole Internet (httpwwwdaviddarlinginfoencyclopediaC coronal_holehtml) (04042009)51 JANSSENS J Zon en aarde een unieke relatie Garant Antwerpen 2003 p 52-54
832019 Ew Afgewerkte Final
httpslidepdfcomreaderfullew-afgewerkte-final 2259
22
density of the magnetic field So if a particle moves from the top of a loop to the bottom it
will slow down just like in traffic jams Eventually it will reach the bottom but the bottom is
highly compressed (because the magnetic field lines converge at the bottom of the loops) so
that the particle will be shot back along the magnetic field line (see figure 10)
Figure 10 the movement of particles in corona loops
GD HOLMAN lsquoThe mysterious origins of solar flaresrsquo Scientific America April 2006 p24-29 volume 294number 4
Hence the particles will move up and down along the magnetic field lines Atoms that are
charged the same will cause electric currents (just like in a battery) These currents will
generate a new magnetic field and the old magnetic field in combination with the new one
will cause a high distortion in the magnetic field of the sun This is the moment when the
corona loop will transform into a solar flare
45 Solar flare52
451 What is a solar flare
A solar flare is a sudden powerful explosion in the solar atmosphere caused by a disruption
in the magnetic field of the sun Because of the disruption mass from the sun will be movedup and form a solar flare A solar flare can equal the energy of billions of atomic bombs
within a few minutes The strongest solar flares are measured during the solar maximums
because then the sunrsquos magnetic activity is the strongest53 Since the sunspots in the presence
of solar flare have a very high magnetic field it is likely that a solar flare would even have a
higher magnetic field But in reality the magnetic field of a solar flare is only half of the
magnetic field of a sunspot The intensity of the magnetic field is lsquoonlyrsquo 500 Gauss54
52 HOLMAN GD lsquoThe mysterious origins of solar flaresrsquo Scientific America April 2006 p 24-31 volume
294 number 453JANSSENS J Zon en aarde een unieke relatie Garant Antwerpen 2003 p 55-57
54 JANSSENS J lsquoZonnefakkelsrsquo Heelal Oktober 1994 p 256
832019 Ew Afgewerkte Final
httpslidepdfcomreaderfullew-afgewerkte-final 2359
23
Figure 11 You can see the magnetic fieldlines in the solar flare on the right side
Large solar flare recorded by SOHO EIT304 instrument 512x512 version Animation (980kMPEG) CourtesySOHO(ESAampNASA)
httpwwwteachersparadisecomencyenwikipediassusunhtml
452 Where and how do sun flares originate
Astronomers have long been speculating how solar flares exactly originate In 1992 Satoshi
Masuda (graduated at the University of Tokyo) discovered on pictures of the Japanese
Yohkoh Satellite that the far end of a solar flare emitted unusually short wavelengths very
short x-rays The source must be a concentration of gas with a temperature of about 100million K concluded Masuda But this discovery provoked some new questions why was the
high temperature at the top of the flare and not at the bottom where the gas is more compact
Why does the plasma stay confined instead of spreading out into the universe In order to
obtain more information to try to solve this problem astronomers started observing the sunrsquos
radiation of ultraviolet and x-rays frequently In 2002 NASA even launched the RHESSI
(Ramaty High Energy Solar Spectroscopic Imager) which was intended to bring solar flares
into pictures55
These observations provided evidence that sun flares surge up in regions where the magnetic
field is very strong ndashmost common in the presence of sun spots At this point we have to call
over the corona loops As mentioned before corona loops are electric currents of atoms
which move alongside magnetic field lines When the atoms are shot back alongside the
magnetic field line there seems to occur a distortion of the magnetic field This distortion will
end up in a solar flare All the mass of the corona loop will be shot into space and form a solar
flare
But how can such enormous mass of the solar flares be shot into s pace This has been a very
interesting question However Peter Alan Sweet (1921-2005)56 succeeded in finding an
55 GD HOLMAN lsquoThe mysterious origins of solar flaresrsquo Scientific America April 2006 p 27 volume 294
number 456UNIVERSITY OF GLASGOW Bibliography of Peter Sweet Internet (httpwwwuniversitystoryglaacuk
biographyid=WH2144amptype=P) (10042009)
832019 Ew Afgewerkte Final
httpslidepdfcomreaderfullew-afgewerkte-final 2459
24
answer already in 1956 If magnetic field lines break apart and then reconnect they bring
together two opposing fields that will cancel each other and cause a huge burst of energy The
reconnection will create new magnetic field lines This reconnection is called the Sweet-
Parker reconnection Yet this is a slow reconnection which cannot take place at the base of a
solar flare with a dazzling speed Fortunately Harry P Petschek published an article about
reconnection in 1964 and solved that problem under certain circumstances it is possible toreconnect much faster which explains solar flares This faster reconnection is also called the
Petschek reconnection But unfortunately with the current technology it is not yet possible to
take pictures of those reconnections57
If the energy comes from the reconnection then where does this reconnection take place
From pictures of solar flares astronomers discovered that at the top of the corona loop a
mysterious x-ray source was found The x-ray source began to give a higher energy level and
at the same time the particles move down towards the sunrsquos surface Yet the x-ray source
stays at the same placehellipThen when the x-rays reach their maximum the loop suddenly
changes direction But this time the x-ray source will move upwards too unexpectedly it
moves at the speed of light approximately three hundred thousands kilometres an hour awayfrom the sun This is the same speed as the coronal mass ejections
46 Coronal mass ejections
461 What is a coronal mass ejection58
Coronal mass ejections (CMErsquos) (appendix XVI) are huge amounts of gas some billions of
plasma from the sun that are ejected into space Their temperature can reach 25 million K59
A coronal mass ejection can last for several hours and it can at last enter the solar wind A
CME can reach a speed of 50kms- 2000kms which means more than 7 million kilometres
an hour60 The mass of a large CME varies from 5 x 10⁶ to 5 x 10¹³ kg61 During a solar
maximum there are more coronal mass ejections than during a minimum but they can occur
at any time of the solar cycle Coronal mass ejections are related both to solar flares and
prominences Very heavy coronal mass ejections can cause some geomagnetic storms on
earth
462 Reconnection
The reconnection of a solar flare can end up in a coronal mass ejection When magneticfield lines that are opposite are starting to reconnect and form new magnetic field lines half of
the magnetic field lines will point downwards and join some existing magnetic loops
However the other part of the magnetic field lines will move upwards at a very high speed
and will form some loops more upwards Between those loops that moved downwards and
those that moved upwards there is some mass that isnrsquot connected to the sun anymore It is
57GD HOLMAN lsquoThe mysterious origins of solar flaresrsquo Scientific America April 2006 p 29 volume 294
number 458
BRAEUNIG R A Glossary Internet (httpwwwbraeunigusspaceglossaryhtm) 200659 LILENSTEN J and BORNAREL J Sous les feux du soleil EDP Sciences Les Ulis Cedex A 2001 p 4460 Cuypers J and others lsquoLa rechercheacute en heacuteliophysique en Belgiquersquo Space connection October 2007 p 10-
1161GREEN SF and JONES M H An introduction to the Sun and Stars The Open University Cambridge
2004 p 68
832019 Ew Afgewerkte Final
httpslidepdfcomreaderfullew-afgewerkte-final 2559
25
known that for an amount of solar flares that this mass between the loops will end up in a
coronal mass ejection Yet this doesnrsquot count for all the solar flares The coronal mass
ejection only takes place if the magnetic field lines twist around each other while forming the
letter lsquoSrsquo (see figure 12)62
Figure 12 Here you can see the reconnection that takes place before the coronal mass ejection starts
httpwwwnasagovmission_pagessolar-bsolar_005html
Certainly we will be capable to answer all the questions about solar flares and coronal mass
ejections in the nearby future But there are also some very interesting questions left what is
at the basis of the acceleration of the atoms in solar flares How does magnetic reconnection
originate Hopefully we will find the answers in the near future
47 Solar wind
471 What is the solar wind
Every second of every day of the year the sunrsquos corona emits a continuous stream of mass
from the sun The temperature of the corona is so high that the sunrsquos magnetic field just
cannot control the outflow of particles We know that the particles are accelerated but
astronomers cannot explain all the details about the solar wind yet
472 What do we know about the solar wind
The speed of the solar wind can change it differs from 300kmh up to 800kmh This speed
depends on the outflow of gases If there is a corona hole pointing towards the earth the solar
wind will reach a speed of around 800kmh The different speeds can interact with each other
and form a new speed according to the rules of light emission When two emissions connect
with each other they can form a faster or slower solar wind just like waves can interact and
form new waves
62BOEN B Birth of a coronal mass ejection Internet (httpwwwnasagovmission_pagessolar-b
solar_005html) 290408
832019 Ew Afgewerkte Final
httpslidepdfcomreaderfullew-afgewerkte-final 2659
26
The ionized atoms with very high temperature coming from the sunrsquos corona are one of the
most important parts of the solar wind but the magnetic fields are important too The
magnetic field outside the sun gets wrapped into a spiral called the Parker-spiral named after
the scientist who described it as the first one (because the sun rotates) This influences the
magnetic field of the sun from the outside The solar wind is emitted in spiral too (see figure
13)
Figure 13 The course of the solar wind caused by the rotation of the sun
httpheliosgsfcnasagovsolarmaghtml
473 Heliosphere
We can describe the heliosphere as a gigantic magnetic bubble around the sun This is
everywhere in space till where the sunrsquos magnetic field reaches and still has an influence The
heliosphere is filled with solar wind although the solar wind has a very low density Yet it
is a very hot wind but because of the very low density it does not have such a great influence
on earth However it can cause some energetic storms on earth63
63 NASA The heliosphere Internet (httpheliosgsfcnasagovheliosphhtml) 20012009
832019 Ew Afgewerkte Final
httpslidepdfcomreaderfullew-afgewerkte-final 2759
27
Conclusion
The sunrsquos magnetic field is a complex system to understand Yet I hope you have learned a
lot from this paper and that you do understand the exiting phenomena described in the
previous chapters
We can discuss the sunrsquos magnetic field from two perspectives The first one is looking at the
magnetic field for global long-term changing dimensions The second way is based on
phenomena on lower scale
The global changes involve the solar cycle and the switch of the magnetic poles The solar
cycle is divided into a decrease of the solar activity until it reaches solar minimum and an
increase of the solar activity until it reaches solar maximum The frequency of the phenomena
that can be found in the outer layers of the sun are directly connected to the solar activity and
thus to the solar cycle Sunspots are the easiest to see they appear as black spots against the
much brighter surface of the sun Corona loops are connected to sunspots and can extend into
solar flares and solar prominences These flares and prominences can burst out into a coronalmass ejection All these phenomena influence the sun and its solar wind how small their part
may be The solar wind has a directly influence on the earth
There is still much to be discovered Astronomers hope to discover much more about the
magnetic field of the sun Today many astronomers and scientists are observing the sun and
every day they discover more and more aspects of the sun Recently a group of researchers
led by David Jess of Queens University Belfast has revealed why the sunrsquos atmosphere is
hotter than its surface64 As you can see astronomy is a very developing science
64
CORDIS Researchers reveal why Suns atmosphere is hotter than its surface Internet (httpcordiseuropaeusearchindexcfmfuseaction=newsdocumentampN_LANG=ENampN_RCN=30598amppid=0ampq=87F36474805A6BEC0B89404F72D0351Famptype=sim) 20032009
832019 Ew Afgewerkte Final
httpslidepdfcomreaderfullew-afgewerkte-final 2859
28
Glossary
Absorption lines A dark line superimposed on a continuous spectrum when a gas absorbs
light from a continuous source that is hotter than the absorbing gas
Aurora Light radiated by atoms and ions formed by the solar wind in the earthrsquos upper atmosphere seen most commonly in the polar regions
Chromosphere The layer in the solar atmosphere between the photosphere and the corona It
is the lowest layer of the atmosphere characterized by reddish hue and by an increase of the
temperature with altitude through all but its lower regions
Convection The transfer of heat from a region of high temperature to a region of lower
temperature by the displacement of the cooler molecules by the warmer molecules The hot
gas will be moved upwards the cool gas will be pushed downwards into the sun
Corona The sunrsquos outer atmosphere It is very extensive and has a very low density It isextremely hot
Coronal hole A dark region of the sunrsquos inner corona as seen at X-ray wavelengths
Coronal loop Closed loops of magnetic field lines extending from the sunrsquos photosphere into
the corona which contain plasma at high temperature They are typically observed through
ultraviolet or x-ray emission from the hot plasma
Coronal mass ejection Large volumes of high energy gas released from the sunrsquos corona
Differential rotation The rotation of a non rigid object in which parts at different latitudes or
different radial distances move at different speeds
Dynamo theory The generation of a magnetic field by circulating electric charges
Eclipse The blocking of a part or all of the light from the moon by the earth (lunar eclipse) or
from the sun by the moon (solar eclipse)
Emission lines Emission lines are used in physics chemistry and astronomy to determine
what kind of gas is doing the emission Every element has a different electronic structure and
will thus have a different emission line fingerprint Emission lines are produced whenelectrons in atoms jump from one energy level to lower energy level
Filament A dark curve seen above the sunrsquos photosphere that is the top view of a solar
prominence
Flux tube Is a generally tube-like (cylindrical) region of space containing a magnetic field
such that the field at the side surfaces is parallel to them Both the cross-sectional area of the
tube and the field contained may vary along the length of the tube but the magnetic flux is
always constant
832019 Ew Afgewerkte Final
httpslidepdfcomreaderfullew-afgewerkte-final 2959
29
Geomagnetic storm When unusually strong surges of solar wind (charged particles from the
Sun) hit the Earth This effect causes variations in the magnetic field which surrounds the
Earth The visible results are eg the aurora (Northern and Southern lights)
Granulation Granules are related to the convective zone The granulation that shows up in the
photosphere is a result of the rising and falling of hot gas that takes place in the convectivezone
Hα absorption line An absorption line due to an electronic transition in hydrogen atoms in
which the atom absorbs a photon so that the electron makes a transition from a state
corresponding to the electronic energy level with n=2 to the one above with n=3 The photon
wavelength in a vacuum is 6563 nm
Heliosphere The volume of space within which the sun through the solar wind influences its
environment in the interstellar medium
Magnetic dynamo A theory that explains phenomena of the solar cycle as a result of periodicwinding and unwinding of the sunrsquos magnetic field in the solar atmosphere
Magnetic reconnection A process taking place in a plasma in which neighbouring
oppositely directed magnetic field lines suddenly part and reconnect in a new configuration
The abrupt change in a magnetic field represented by this process can release large amounts
of energy and it is thought to be important in explaining solar flares and other phenomena
Penumbra The portion of a shadow in which only part of the light source is covered by the
shadow-making body
Photosphere The region in the solar atmosphere from which most of the visible light escapes
into space
Plasma A fourth state of matter (not found naturally on Earth) of very hot gases Plasma is a
fluid with the ability to carry electric currents with no local accumulations of electric charge
Prominence Flamelike protrusion seen near the limb of the sun and extending into the solar
corona The side view of a filament
Quantum theory A theory in physics based on the principle that matter and energy have the
properties of both particles and waves created to explain the radiation of energy from a blackbody the photoelectric effect and the Bohr theory and now used to account for a wide
range of physical phenomena including the existence of discrete packets of energy and
matter the uncertainty principle and the exclusion principle Itrsquos a theory of the interaction of
matter and radiation developed early in the twentieth century which is based on the
quantization of energy and applied to a wide variety of processes that involve an exchange of
energy at the atomic level
Reconnection See magnetic reconnection
Solar cycle A 22-year-cycle during which the sunrsquos magnetic field reverses its polarity twice
Solar flare A violent eruption on the sunrsquos surface
832019 Ew Afgewerkte Final
httpslidepdfcomreaderfullew-afgewerkte-final 3059
30
Solar wind An outward flow of particles (mostly electrons and protons) from the sun
Solstice Either of two points along the ecliptic at which the Sun reaches its maximum
distance north or south of the celestial equator
Spectroscopy Concerns the production and study of spectra
Spectrum The result of electromagnetic radiation passing through a prism or grating so that
different wavelengths are separated
Spicule Short-lived (lifetime from rising to falling is about 15 minutes) jets vertical to the
solar surface that are several thousand kilometres long and about 1 kilometre thick (see also
appendix IV) in the solar chromosphere
Sunspot A temporary cool region in the solar photosphere created by protruding magnetic
fields
Umbra The central completely dark portion of a shadow
Zeemaneffect A splitting of spectra lines in the presence of a magnetic field
Bibliography and webography of the glossary
COMINS NF and KAUFMANN III WJ Discovering the universe eighth edition WH
Freeman and Company New York 2008 535 p
GREEN SF and JONES M H An introduction to the Sun and Stars The Open University
Cambridge 2004 373 p
httpenmimihuastronomygranulationhtml
httpenmimihuastronomyplasmahtml
httpwwwspacecomspacewatchspace_weather_glossaryhtml
httpenmimihuastronomyemission_linehtml
httpenmimihuastronomyabsorption_linehtml
httpwwwpbsorgfaithandreasonphysglossqm-bodyhtml
httpwwwanswerscomtopicquantum-theory
httpenwikipediaorgwikiFlux_tube
832019 Ew Afgewerkte Final
httpslidepdfcomreaderfullew-afgewerkte-final 3159
31
Appendix I The sun in figures
Physical quantity Comment
Radius 695 510 km 109 x earths radius
Mass 1989 x1030 kg 332 946 earths mass
Mass sun in the solar
system
9986 Total mass sun total mass of
our solar system
Volume 1412 x10sup3sup3 cmsup3 13 million x earths volume
Age 455 milliard years
Luminosity 3854 x 10sup3sup3 ergss
Magnitude -2773
Density center 1513 gcmsup3
Density mean 1409 gcmsup3
Pressure center 2334 x1011 bars
Pressure photosphere 00001 bar
Temperature center 15 557 000deg K
Temperature photosphere 5 780deg K Various sources mention
different grades
Temperature corona 2 000 000 to 3 000 000deg K
Rotation time at North or
South pole
up to 35 days on earth
Rotation time at Equator 25 days on earth The difference in rotation
times is called differential
rotation
Rotation time general 2538 days on earth
Mean distance sun-earth
(AU)
14959787 x108 km 1 AU = 1 Astronomical Unit
= 149 598 000 km
Chemical composition of
the sun ( of total number
of atoms)
Hydrogen 921
Helium 78
All others 01
Various sources mention
slightly different percentages
832019 Ew Afgewerkte Final
httpslidepdfcomreaderfullew-afgewerkte-final 3259
32
Chemical composition of
the sun ( of total mass)
Hydrogen 7346
Helium 2485
All others 169
Various sources mention
slightly different percentages
Total transforming of
hydrogen into helium persecond
700 billions of kilograms of
hydrogen are transformedinto 6957 billions of
kilograms of helium each
second
Based on the following references
- BEATTY JK PETERSEN CC and CHAIKIN A The new solar system fourth edition
Cambridge University Press Cambridge 1999 p 421
- LILENSTEN J and BORNAREL J Sous les feux du soleil EDP Sciences Les Ulis
Cedex A 2001 p 247
- LANG KR Sun earth and sky Springer Germany 1995 p 282- DENTHIER T Het zonnestelsel Standaard Uitgeverij 1992 p 415
- JANSSENS J Zon en aarde een unieke relatie Garant Antwerpen 2003 p 254- VOLKSSTERRENWACHT URANIA VZW De zon Internet(httpwwwuraniabesterrenkundezonnestelselzonphp) (01012009)
832019 Ew Afgewerkte Final
httpslidepdfcomreaderfullew-afgewerkte-final 3359
33
Appendix II Anatomy of the sun
httpwwwcosmographicacomgalleryinfographicssolar_anatomyhtml
The middle the sun consists of a heavy core this consists of plasma just as the outer layers
of the sun but the pressure in the core is so high that it behaves much more like a solid bodyThe most outer layer is the corona it reaches far into space More to the inside there is the
chromosphere and then the photosphere The corona the chromosphere and the
photosphere are explained in chapter 1
832019 Ew Afgewerkte Final
httpslidepdfcomreaderfullew-afgewerkte-final 3459
34
Appendix III Granulation
httpwwwwindowsucaredutourlink=sunSolar_interiorsolar_furnacehtml
At the surface of the sun we can find granules These are created by convection the warmest
parts of the sunrsquos interior move upwards and the colder parts at the surface move downwardsThis causes currents of plasma The dark lines are the colder particles We see them darker
because they emit less light than their surrounding neighbourhood
832019 Ew Afgewerkte Final
httpslidepdfcomreaderfullew-afgewerkte-final 3559
35
Appendix IV Spicules
Picture httplpc1clpccdcccauslpcharpellastro20a20deinfo_s09htmInformation httpwwwdaviddarlinginfoencyclopediaSspiculehtml
On this picture you can see spicules Spicules only last for several minutes and can be foundin the chromosphere They are little jets of gas There also exist macrospicules that can be
approximately ten times larger than a normal spicule
832019 Ew Afgewerkte Final
httpslidepdfcomreaderfullew-afgewerkte-final 3659
36
Appendix V The most important satellites observing the sun
Here you can find the most important satellites observing the sun and their missions
Solar and Heliospheric Obseratory (SOHO)
httpsohowwwnascomnasagovaboutabouthtml
SOHO the Solar amp Heliospheric Observatory is a project of international collaboration
between ESA and NASA to study the Sun from its deep core to the outer corona and the solar
wind
SOHO was launched on December 2 1995 The SOHO spacecraft was built in Europe by an
industry team led by prime contractor Matra Marconi Space (now EADS Astrium) under
overall management by ESA The twelve instruments on board SOHO were provided by
European and American scientists Nine of the international instrument consortia are led by
European Principal Investigators (PIs) three by PIs from the US Large engineering teamsand more than 200 co-investigators from many institutions supported the PIs in the
development of the instruments and in the preparation of their operations and data analysis
NASA was responsible for the launch and is now responsible for mission operations Large
radio dishes around the world which form NASAs Deep Space Network are used for data
downlink and commanding Mission control is based at Goddard Space Flight Center in
Maryland
More information about SOHO can be found on
httpsohowwwnascomnasagovaboutdocsSOHO_Fact_Sheetpdf
832019 Ew Afgewerkte Final
httpslidepdfcomreaderfullew-afgewerkte-final 3759
37
Transition Region and Coronal Explorer (TRACE)
httptracelmsalcomProjectMissionmissionhtm
TRACE enables solar physicists to study the connections between fine-scale magnetic fields
and the associated plasma structures on the Sun in a quantitative way by observing the photosphere the transition region and the corona With TRACE these temperature domains
are observed nearly simultaneously (with as little delay as only a second between different
wavelengths) with a spatial resolution of one second of arc
This is accomplished by obtaining precisely coaligned image sequences of photosphere
transition region and corona with high spatial resolution and uninterrupted viewing of the
Sun for up to eight months
TRACE Mission
TRACE explores the magnetic field in the solar atmosphere by studyingbull The 3-dimensional field structure
bull Its temporal evolution in response to photospheric flows
bull The time-dependent coronal fine structure
bull The coronal and transition region thermal topology
TRACE was launched on a Pegasus launch vehicle from Vandenberg Air Force Base in April
1998 The launch was scheduled to allow joint observations with SOHO during the rising
phase of the solar cycle to sunspot maximum No transition region or coronal imager has
witnessed the onset and rise of a solar cycle
Pegasus in flight
The two satellites provide complementary observations TRACE produces the high spatial
and temporal resolution images while SoHO yields images and spectral data out to 30 solar
radii at much lower spatial and temporal resolution Jointly they provide the opportunity to
obtain simultaneous digital measurements of all the temperature regimes of the solar
atmosphere in both high-resolution imaging and spectroscopy
With these data we expect to shatter the current ignorance of coronal heating and impulsive
MHD phenomena with benefits not only to solar physics but also to studies ranging from
stellar activity to the MHD of accretion disks The magnetograms produced by MDI on SoHO
provide a complete record of the eruption and distribution of photosphere magnetic fields
which will be invaluable for understanding TRACE observations of coronal hole formation
and coronal mass ejections Both of these phenomena have profound effects on our space
environment and the Earth`s magnetic field
TRACE is the first US solar research satellite since the Solar Maximum Mission
Coordination with SOHO provides an unprecedented opportunity to follow the emergence of
magnetic flux from the base of the convection zone deep inside the Sun through the
photosphere chromosphere and transitional region to the low-beta outer corona while
observing the effects of this emergence such as coronal mass ejections with high spatial andtemporal resolution
832019 Ew Afgewerkte Final
httpslidepdfcomreaderfullew-afgewerkte-final 3859
38
The transition from the photosphere where magnetic fields and plasma are in rough
equipartition to the corona where magnetic fields dominate is extremely difficult to model
and until recently to observe at high temporal and spatial resolution Many of the physical
problems that arise here such as plasma confinement reconnection wave propagation and plasma heating arise throughout space physics and astrophysics The detailed study of these
processed in the solar outer atmosphere is invaluable to astrophysics in general and stellar
studies in particular
More information about TRACE observations can be found on
httptracelmsalcomOperationsGeneraloperatiohtm
832019 Ew Afgewerkte Final
httpslidepdfcomreaderfullew-afgewerkte-final 3959
39
Reuven Ramaty High Energy Solar Spectroscopic Imager (RHESSI)
httphesperiagsfcnasagovhessibrochurehtm
What Questions will HESSI Address
bull How is such a large amount of energy released so rapidly during a flare
bull How are so many electrons and protons accelerated so quickly to such high energies
bull Where are the electrons and protons accelerated in the solar atmosphere and where do
they deposit their energy
How will HESSI Address these Questions
HESSI shown below will concentrate on electrons and protons accelerated in solar flares
through observations of the X-rays and gamma rays that they produce
bull HESSI will obtain the first ever X-ray and gamma-ray images of flares from 100 keV
to 20 MeVbull HESSI will do the first ever nuclear gamma-ray line spectroscopy of solar flares
bull HESSI will obtain pictures of flares in X-rays with an angular resolution of 2
arcseconds a factor of three better than previously possible
bull HESSI will measure X-ray and gamma-ray spectra with less than 1 keV energy
resolution a factor of 20-40 better than previously possible with scintillation counters
More information about the RHESSIrsquos Mission can be found on
httphesperiagsfcnasagovhessiconcepthtm
832019 Ew Afgewerkte Final
httpslidepdfcomreaderfullew-afgewerkte-final 4059
40
Solar Radiation and Climate Experiment (SORCE)
httplaspcoloradoedusorcesciencebackgroundhtm
The Solar Radiation and Climate Experiment (SORCE) is a NASA-sponsored satellite
mission that is providing state-of-the-art measurements of incoming x-ray ultraviolet visiblenear-infrared and total solar radiation The measurements provided by SORCE specifically
address long-term climate change natural variability and enhanced climate prediction and
atmospheric ozone and UV-B radiation These measurements are critical to studies of the Sun
its effect on our Earth system and its influence on humankind
The SORCE spacecraft was launched on January 25 2003 on a Pegasus XL launch vehicle to
provide NASAs Earth Science Enterprise (ESE) with precise measurements of solar
radiation It launched into a 645 km 40 degree orbit and is operated by the Laboratory for
Atmospheric and Space Physics (LASP) at the University of Colorado (CU) in Boulder
Colorado USA It will continue the precise measurements of total solar irradiance (TSI) that
began with the ERB instrument in 1979 and has continued to the present with the ACRIM series of measurements SORCE will also provide the measurements of the solar spectral
irradiance from 1nm to 2000nm accounting for 95 of the spectral contribution to TSI
SORCE carries four instruments including the Spectral Irradiance Monitor (SIM) Solar
Stellar Irradiance Comparison Experiment (SOLSTICE) Total Irradiance Monitor (TIM) and
the XUV Photometer System (XPS)
The primary goal of the NASA Earth Observing Systems (EOS) SOlar Radiation and Climate
Experiment (SORCE) is to enable solar-terrestrial studies by providing precise daily
measurements of the total solar irradiance (TSI) and the solar spectral irradiance atwavelengths extending from the ultraviolet to the near infrared The following lists the
SORCE science objectives
1 Make accurate measurements with high precision of total solar irradiance connect
them to previous TSI measurements and continue this long-term climate record
Provide TSI with an accuracy of 001 (100 parts per million) based on SI units and
with a long-term repeatability of 0001yr
2 Make daily measurements of the solar ultraviolet irradiance from 120 to 300 nm with
a spectral resolution of 1 nm Achieve this spectral irradiance measurement with an
accuracy of better than 5 and with a long-term repeatability of 05yr Use the
solarstellar comparison technique to relate the solar irradiance to the ensembleaverage flux from a number of bright early-type stars (same stars used by the UARS
SOLSTICE program)
3 Make the first measurements of the visible and near IR solar irradiance with sufficient
precision for future climate studies Obtain daily measurements of solar spectral
irradiance between 03 and 2 microm with a spectral resolution of at least 130 an
accuracy of 003 and a long-term repeatability of better than 001yr
4 Improve the understanding of how and why solar irradiance varies estimate past and
future solar behavior and investigate climate responses
More information about SORCE can be found on
httplaspcoloradoedusorcesciencescience_opshtm
832019 Ew Afgewerkte Final
httpslidepdfcomreaderfullew-afgewerkte-final 4159
41
Appendix VI Wavelengths
httpeosweblarcnasagovEDDOCSWavelengths_for_Colorshtml
As you can see on the figure visible light situates in the centre of the wavelengths having not
the shortest nor the longest wavelengths Gamma rays have the shortest wavelength radioways the longest All sort of wavelengths are used for daily purpose like radio waves for
radio and TV and gamma rays for treatments
832019 Ew Afgewerkte Final
httpslidepdfcomreaderfullew-afgewerkte-final 4259
42
Appendix VII Absorption lines in the sunrsquos spectrum
Picture httpwwwsolarnavigatornetthe_sunhtmExplanation COMINS NF and KAUFMANN III WJ Discovering the universe eighth edition WHFreeman and Company New York 2008 p 109
This photo is called a spectrogram It contains the spectrum of the sun All the black lines are
absorption lines The amount of black lines is related to the amount of elements that the sun
is emitting From a spectrogram we can deduct a lot of things including their mass the
temperature of the surface the chemical composition of the sun rotation rates and much
more
832019 Ew Afgewerkte Final
httpslidepdfcomreaderfullew-afgewerkte-final 4359
832019 Ew Afgewerkte Final
httpslidepdfcomreaderfullew-afgewerkte-final 4459
44
Appendix IX Butterfly-diagram
httpspacesciencespacerefcomsslpadsolarimagesbflygif
A butterfly-diagram
In a butterfly-diagram we can find the sunspots with their latitude (y-axis) through the years(x-axis) As you can see the sunspots appear like lsquobutterfliesrsquo this was discovered in 1904 by
Edward Maunder (1851-1928 an English astronomer best remembered for his study of
sunspots and the solar magnetic cycle) Thatrsquos why this graph is also called Maunders
butterfly diagram
832019 Ew Afgewerkte Final
httpslidepdfcomreaderfullew-afgewerkte-final 4559
45
Appendix X The Wolf-numbers
httpsidcomabenews106sunspotnumberclarifiedpdf
The sunspot number clarified By Petra Vanlommel
Which kinds of daily International Sunspot Numbers (ISN) are currentlypublished by the SIDC
Three daily indices are currently published by the SIDCthe Estimated ISN (EISN)the Provisional ISN (PISN)the Definitive ISN (DISN)Although they are all based on the same type of observations ie visual sunspot counts as ameasure of solar activity they are obtained from different data sets by different processingmethods with different accuracies and they serve different purposes
In the ideal case the three numbers are equal but in practice it is inevitable that there aresmall differences Therefore It is useful to explain what each index actually means
What is the source of the Wolf number
Once per day observers worldwide communicate their measured Wolf number (= 10G + S)based on visual sunspot (S) and group (G) counts to the World Data Center for the SunspotIndex Presently this is done through a dedicated password-protected WEB form the Wolfinterface However some observers still use the old way of reporting their observations onpaper through regular mail This method slows down the final processing but for the sake ofcontinuity in the index it is important to keep these observers included as some of them
represent the longest individual datasetsThe observers give the exact observing time the observing conditions the total numbers(group count sunspot count and Wolf number) and optionally the NorthSouth and centralzone numbers The observers using the web interface can provide their results to the SIDCimmediately after each observation However some users prefer to insert their data as ablock creating some delay but this must be done at least once a month
The personal reduction coefficient K
A personal reduction coefficient K is calculated for each station It has values typically in therange 04 and 17 and leads to a normalized sunspot number K(10G+S) In other words theK factor rescales the raw sunspot counts of each observer to the ones of Rudolph Wolf the
astronomer who introduced the above Wolf formula thus simulating the same eyes sametelescope and same conditionsDuring the procedure for calculating the Provisional ISN the K factor of every station iscomputed for every observation that passes the elimination procedure Once a year apersonal K factor for every station and for every month of the previous year is calculated Ayearly mean K value per station is also computed
The estimated sunspot index
The Estimated ISN (EISN) is calculated and issued on a daily basis for the day of calculationand the day before Only the total EISN is calculated with no hemispheric index It is anautomated procedure and no manual intervention is done The EISN is meant as a quicktemporary and approximate index for real-time applications
832019 Ew Afgewerkte Final
httpslidepdfcomreaderfullew-afgewerkte-final 4659
46
We use the raw Wolf number from all observatories that have provided counts early in theday ie before 1230 UT Typically there is between 10 and 20 stations available Thecalculation of the EISN is based on a simple and straightforward statistical method The Wolfnumbers are multiplied with the yearly mean K factor (see paragraph about the personalreduction coefficient K) The EISN is a simple average of the K-scaled values after excludingany individual value that deviates abnormally from the other valuesOnce the Provisional ISN (PISN) is calculated after the end of a month the temporary EISNis dropped and replaced by the PISN
The provisional sunspot Index
The Provisional ISN (PISN) is calculated and issued on the first of every month Theoutcome is a daily total and hemispheric sunspot number for the entire elapsed month Anexample on the first of September we calculate the daily PISN for each day of August ThePISN is computed semi-automatically with as little manual intervention as possibleTo calculate the PISN values for the concerned month we use all Wolf numbers Typicallythere is data from around 65 stations available
The calculation of the PISN is based on an extensive statistical treatment This treatmentfilters out any abnormal daily observation or the complete data set from an erratic station(quality control) This prevents long-term drifts in the resulting index One of the key elementsderived from this processing is to update the K reduction coefficients for each station theevolution of each station is monitored for each day relative to the entire networkA subset of the contributing stations also provides hemispheric counts A similar process isapplied to the North and South counts to derive the hemispheric PISN There is an additionalconstraint the sum of the North and South ISN must match the total ISNThe PISN replaces the EISN And once the Definitive ISN (DISN) is calculated the DISNreplaces the PISN
The definitive sunspot index
The Definitive ISN is calculated and issued on a quarterly basis when we have collecteddata from all the contributing observatories This is the final index and it is appended to thehistorical sunspot index time series The same semi-automated treatment as for the PISN isnow applied to the full data set If the result agrees within 5 of the PISN value the PISN iskept and becomes definitive Otherwise the new calculated value replaces the PISN andbecomes the definitive ISNIt is only at this stage and only in peculiar situations that a manual verification by ourscientific staff is required For example this happens when the observed raw Wolf valuesfrom the whole network are clustered around two distinct values This special case can becaused by small short-lived isolated sunspots (lifetimes lt 24 hours) or by the appearance ordisappearance of a large group at the solar limb in the course of one UT dayThe DISN replaces the provisional and estimated International Sunspot Number
Handling very low activity levels
One of the situations requiring a human arbitration is associated with single small isolatedand short-lived sunspots This is most noticeable around the minimum of the solar activitycycle like the one occurring now in 2008 Due to the 24hour binning (observations aregrouped between 0hUT and 24hUT) and the variable ability of each observer to detect thesmallest sunspots we end up with some stations reporting one sunspot and others who didno see any sunspot Let us explain further No sunspot may mean that the sunspot waspresent but the observer was unable to see it because of poor observational conditions such
as weather a small telescope On the other hand it may also indicate that the sunspot hadactually vanished by that time while it was present earlier on the same day
832019 Ew Afgewerkte Final
httpslidepdfcomreaderfullew-afgewerkte-final 4759
47
Individual stations do not observe at exactly the same timeIn order to validate the existence of such a marginal reported sunspot a qualified SIDCscientist must then check the detailed chronology within that day and consider the overallobserver capability (value of K coefficient)In common practice the fact that a sunspot is reported by a significant group of observersleads to the inclusion of the sunspot on that date thus neglecting the no-sunspotobservationsThe rationale is multiple observations of a sunspot exclude the possibility that the reportedsunspot was an independent false detection So a sunspot was really present on that dayalthough it may have existed only for part of the day or it was small enough to be missed bypart of the observers with smaller instruments or imperfect atmospheric conditionsAlso keep in mind that the sunspot index is derived with a limited precision just like any otherindex If the monthly mean sunspot number is 0 or 05 you can definitely say that activitywas low
What index should be used
If you want to perform long-term investigations the definitive ISN series is definitely the mostsuitable However there is a delay of a few months So when investigating the last cycle andrecent evolution use the definitive numbers in combination with the provisional ISN to be upto date to the last month The provisional numbers are also used in models forecasting thesunspot number for the coming months Now if you need a proxy for solar activity in a modelthat runs in real-time then you may use the estimated ISNImprovements and rethinking of the processing method is an ongoing project We arecurrently developing an alternative program for calculating the PISN Of course long-termconsistency is vital Therefore a cross-analysis between the output from the old and newsoftware must be applied over an extended period
832019 Ew Afgewerkte Final
httpslidepdfcomreaderfullew-afgewerkte-final 4859
48
Above graphs show different kinds of the International Sunspot Number The left plot gives an overview from 1700 up to now from the yearly (black) and monthly smoothed Sunspot Number The graph in the right top corner shows the monthly and monthly smoothed sunspot number while the graph in the right bottom corner show the daily monthly smoothed monthly sunspot number For every the time range of investigation there is an appropriate sunspot number
832019 Ew Afgewerkte Final
httpslidepdfcomreaderfullew-afgewerkte-final 4959
49
Appendix XI Filaments and prominences
httpsohowwwnascomnasagovpickoftheweekold26feb2004
This is a picture taken by SOHO on 26 February 2004
832019 Ew Afgewerkte Final
httpslidepdfcomreaderfullew-afgewerkte-final 5059
50
Appendix XII The reconnection of magnetic loops
httpwwwioporgEJarticle0004-637X558287253575webpdfrequest-id=73e38daa-69ae-4e01-b9a6- b4bd0ba071dd
In (a) sunspot B and C have different polarity and move towards each other The twomagnetic loops will reconnect and form one big magnetic loop showed in (b) This will
happen to other magnetic loops too as can be seen in (c) When G en F are close enough they
will reconnect and so E en H will reconnect too It is possible that the magnetic field line is
trapped around another in this case AD The mass ejected from the sun will be trapped
between the magnetic field lines and form a solar prominence
832019 Ew Afgewerkte Final
httpslidepdfcomreaderfullew-afgewerkte-final 5159
832019 Ew Afgewerkte Final
httpslidepdfcomreaderfullew-afgewerkte-final 5259
52
httptheinvisibleagentwordpresscom20090117amazing-celestial-images
An group of active prominences
httpapodnasagovapodap051109html
httpwhassupinthemilkywayblogspotcom200903cloudy-planhtml
A picture taken by SOHO In the left corner you can see the prominence with twisted
magnetic field lines
832019 Ew Afgewerkte Final
httpslidepdfcomreaderfullew-afgewerkte-final 5359
53
Appendix XIV Polar crown
httpsciencenasagovheadlinesy200817sep_polarcrownhtm
Photograph of a polar crown taken on 13 June 1999 by the Meudon Observatory
832019 Ew Afgewerkte Final
httpslidepdfcomreaderfullew-afgewerkte-final 5459
54
Appendix XV Coronal holes
httpsunearthdaynasagov2007multimediagal_020php
The black segment is a huge coronal hole The bright parts are x-rays from sunspots
832019 Ew Afgewerkte Final
httpslidepdfcomreaderfullew-afgewerkte-final 5559
55
Appendix XVI Coronal mass ejection
httpzuserver2staruclacuk~idhapodap000309html
Picture of a CME taken by SOHO in February 2000
832019 Ew Afgewerkte Final
httpslidepdfcomreaderfullew-afgewerkte-final 5659
56
Bibliography
Books
BEATTY JK PETERSEN CC and CHAIKIN A The new solar system fourth edition
Cambridge University Press Cambridge 1999 421 p
COMINS NF and KAUFMANN III WJ Discovering the universe eighth edition WH
Freeman and Company New York 2008 535 p
DETHIER T Het zonnestelsel Standaard Uitgeverij 1992 415 p
GOLUB L and PASACHOFF JM Nearest star the surprising science of our sun Harvard
university press Harvard 2001 267 p
GREEN SF and JONES M H An introduction to the Sun and Stars The Open University
Cambridge 2004 373 p
HILL S and CARLOWITZ M The sun Abrams New York 2006 239 p
HOLMAN GD lsquoThe mysterious origins of solar flaresrsquo Scientific America April 2006 p
24-31 volume 294 number 4
JANSSENS J Zon en aarde een unieke relatie Garant Antwerpen 2003 254 p
KELLER H-U Van Supernovarsquos tot zwarte gaten Tirion Natuur AH Baarn 2003 169 p
LANG KR Sun earth and sky Springer Germany 1995 282 p
LILENSTEN J and BORNAREL J Sous les feux du soleil EDP Sciences Les Ulis Cedex
A 2001 247 p
832019 Ew Afgewerkte Final
httpslidepdfcomreaderfullew-afgewerkte-final 5759
57
Articles
CUYPERS J and others lsquoLa rechercheacute en heacuteliophysique en Belgiquersquo Space connection
October 2007 20 p
DE KEYSER J lsquoDe magnetopauzersquo Heelal maart 1998 p 66-73
JANSSENS J lsquoHet maximum van de 23ste zonnevlekkencyclus (I)rsquo Heelal Oktober 1998 p
256-263
JANSSENS J lsquohet maximum van de 23ste zonnenvlekkencyclus (II)rsquo Heelal November
1998 p 284-290
JANSSENS J lsquoZonnefakkelsrsquo Heelal Oktober 1994 p 256-261
SMITS F lsquoDe coronarsquo Heelal Februari 1999 p 40-42
SMITS F lsquoProtuberanzenrsquo Heelal Juli 1991 p 182-185
VAN DEN BERGHE S lsquoHet Zeemaneffectrsquo Heelal September 1998 p 228-231
832019 Ew Afgewerkte Final
httpslidepdfcomreaderfullew-afgewerkte-final 5859
58
Webography
BOEN B Birth of a coronal mass ejection Internet
(httpwwwnasagovmission_pagessolar-b solar_005html) 290408
BRAEUNIG R A Glossary Internet (httpwwwbraeunigusspaceglossaryhtm) 2006
CORDIS Researchers reveal why Suns atmosphere is hotter than its surface Internet
(httpcordiseuropaeusearchindexcfmfuseaction=newsdocumentampN_LANG=ENampN_R
CN=30598amppid=0ampq=87F36474805A6BEC0B89404F72D0351Famptype=sim) 20032009
DAY C Alfveacuten waves may heat the Sunrsquos corona Internet
(httpblogsphysicstodayorgupdate200903 alfven-waves-may-heat-the-sunshtml)
310309
ELLERMAN F Solar prominences Internet (httparticlesadsabsharvardedufull
1928ASPL173E 0000074000html) (03042009)
ENCYCLODPEDIA OF SCIENCE Corona hole Internet
(httpwwwdaviddarlinginfoencyclopediaC coronal_holehtml) (04042009)
HATHAWAY D H The sunspot cycle Internet
(httpspacesciencespacerefcomsslpadsolarsunspots htm) 04012000
JANSSENS J The case of the missing solar cycle (published in lsquoheelalrsquo January 2008)
Internet (httpuserstelenetbejjanssensMSCwebEngpdf)
KNISELY D Solar prominences Internet
(httpwwwicstarscomHTMLSolarSectionHAlphaOBSERVINGTHESUNHAlpha3html)
(03042009)
KOPANSKI J Atom Internet (httpknolgooglecomkjan-
kopanskiatom1amrwrct7rvi27) 060209
MARTENS PC and ZWAAN C Origin and evolution of filament-prominence systems
Internet (http wwwioporgEJarticle0004-637X558287253575webpdfrequest-
id=73e38daa-69ae-4e01-b9a6-b4bd0ba071dd) 092001
NASA The corona Internet (httpsolarsciencemsfcnasagovcoronashtml) 180107
NASA The heliosphere Internet (httpheliosgsfcnasagovheliosphhtml) 20012009
OFFICIAL SITE OF STONEHENGE About Stonehenge Internet
(httpwwwstonehengecouk) (03022009)
OTTERSDORF M Astronomy On the sunspot cycle Internet
(httpuserszoominternetnet~matto MCASsunspot_cyclehtmZeemaneffect) 031103
PARIAT E and SCHMIEDER B Magnetic flux emergence Internet(httpwwwscholarpediaorgarticleMagnetic_field_emergence) 18042008
832019 Ew Afgewerkte Final
httpslidepdfcomreaderfullew-afgewerkte-final 5959
59
PRIEST E R Dynamics and Structure of Quiescent Solar Prominences Internet
(httpbooksgooglebe booksid=h599q3jz1w4Campdq=quiescent+prominencesampprintsec=fro
ntcoverampsource=blampots=58b79Qeyabampsig=1eklQ-
WszOIebZZaq7fq7gm6bxAamphl=nlampei=urPtSe7ZCo61-
Qa166jHDwampsa=Xampoi=book_resultampct=result ampresnum=3PPA6M2) 1989
RUSSELL R Rotation of the sun Internet
(httpwwwwindowsucaredutourlink=sunSolar_interior
Sun_layersdifferential_rotationhtml) 16082005
RUSSELL R Sunspots and magnetic fields Internet
(httpwwwwindowsucaredutourlink=sunatmospheresunspot_magnetismhtmlampedu=hig
h) 060908
UNIVERSITY OF GLASGOW Bibliography of Peter Sweet Internet
(httpwwwuniversitystoryglaacuk biographyid=WH2144amptype=P) (10042009)
WIKIPEDIA Orbiting Solar Observatory Internet
(httpenwikipediaorgwikiOrbiting_Solar_Observatory) 24012009
WINDOWS TEAM Maunderrsquos Butterfly Diagram Internet
(httpwwwwindowsucaredutourlink=sun activitybutterflyhtml) 2000
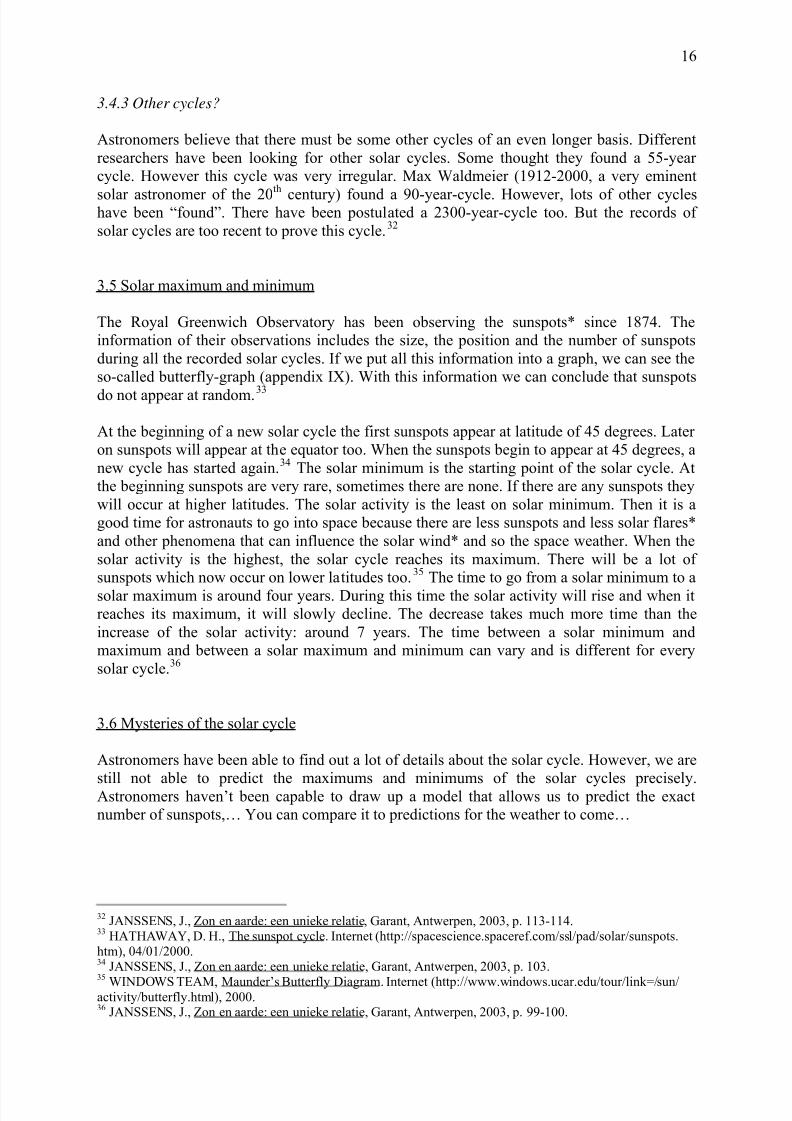
832019 Ew Afgewerkte Final
httpslidepdfcomreaderfullew-afgewerkte-final 1659
16
343 Other cycles
Astronomers believe that there must be some other cycles of an even longer basis Different
researchers have been looking for other solar cycles Some thought they found a 55-year
cycle However this cycle was very irregular Max Waldmeier (1912-2000 a very eminent
solar astronomer of the 20th
century) found a 90-year-cycle However lots of other cycleshave been ldquofoundrdquo There have been postulated a 2300-year-cycle too But the records of
solar cycles are too recent to prove this cycle 32
35 Solar maximum and minimum
The Royal Greenwich Observatory has been observing the sunspots since 1874 The
information of their observations includes the size the position and the number of sunspots
during all the recorded solar cycles If we put all this information into a graph we can see the
so-called butterfly-graph (appendix IX) With this information we can conclude that sunspots
do not appear at random33
At the beginning of a new solar cycle the first sunspots appear at latitude of 45 degrees Later
on sunspots will appear at the equator too When the sunspots begin to appear at 45 degrees a
new cycle has started again34 The solar minimum is the starting point of the solar cycle At
the beginning sunspots are very rare sometimes there are none If there are any sunspots they
will occur at higher latitudes The solar activity is the least on solar minimum Then it is a
good time for astronauts to go into space because there are less sunspots and less solar flares
and other phenomena that can influence the solar wind and so the space weather When the
solar activity is the highest the solar cycle reaches its maximum There will be a lot of
sunspots which now occur on lower latitudes too35 The time to go from a solar minimum to a
solar maximum is around four years During this time the solar activity will rise and when it
reaches its maximum it will slowly decline The decrease takes much more time than the
increase of the solar activity around 7 years The time between a solar minimum and
maximum and between a solar maximum and minimum can vary and is different for every
solar cycle36
36 Mysteries of the solar cycle
Astronomers have been able to find out a lot of details about the solar cycle However we are
still not able to predict the maximums and minimums of the solar cycles preciselyAstronomers havenrsquot been capable to draw up a model that allows us to predict the exact
number of sunspotshellip You can compare it to predictions for the weather to comehellip
32JANSSENS J Zon en aarde een unieke relatie Garant Antwerpen 2003 p 113-114
33HATHAWAY D H The sunspot cycle Internet (httpspacesciencespacerefcomsslpadsolarsunspots
htm) 0401200034 JANSSENS J Zon en aarde een unieke relatie Garant Antwerpen 2003 p 10335
WINDOWS TEAM Maunderrsquos Butterfly Diagram Internet (httpwwwwindowsucaredutourlink=sunactivitybutterflyhtml) 200036 JANSSENS J Zon en aarde een unieke relatie Garant Antwerpen 2003 p 99-100
832019 Ew Afgewerkte Final
httpslidepdfcomreaderfullew-afgewerkte-final 1759
17
Chapter 4 Phenomena caused by the magnetic field of the sun
41 Sunspots
411 What are sunspots
Sunspots appear on the sunrsquos surface when the magnetic field lines under the photosphere
are piled up too much and they finally pop out into the chromosphere Sunspots are normally
found in groups The number of sunspots is dependent on the solar activity when the solar
activity reaches its maximum there will be many more sunspots than at solar minimum
Measuring the magnetic field in sunspots with the Zeemaneffect makes clear that the
strength of the magnetic field is much stronger in sunspots than in the surrounding
photosphere Itrsquos more than thousand times stronger the magnetic field strength in magnetic
fields varies from 1000 to 4000 Gauss while the surrounding area circles around 1 Gauss
(comparison the earthrsquos magnetic field strength is about 05 Gauss)37
412 What do sunspots look like
When magnetic field lines pop out of the photosphere they will form magnetic loops (figure
6 on the right side) Between this magnetic loops there will be formed a flux tube The
magnetic field lines in the sunspot will distort the convection under the surface (see figure 6
on the left side) They will pull the plasma downwards and will prevent the warm plasma
from going upwards and reach the sunrsquos surface Eventually the temperature in the sunspot
will cool down38
Figure 6 Left side convection in sunspotsRight side magnetic field lines in sunspots
JANSSENS J Zon en aarde een unieke relatie Garant Antwerpen 2003 p41
37
RUSSELL R Sunspots and magnetic fields Internet (httpwwwwindowsucaredutourlink=sunatmospheresunspot_magnetismhtmlampedu=high) 06090838 JANSSENS J Zon en aarde een unieke relatie Garant Antwerpen 2003 p 40-41
832019 Ew Afgewerkte Final
httpslidepdfcomreaderfullew-afgewerkte-final 1859
18
We can distinguish 2 areas the black sunspot and the surrounding bright surface of the sun
The sunspot itself consists of the very dark centre called the umbra and the surrounding
orange-brown environment called the penumbra The penumbra consists of an amount of
small little striated f igures that come out of the umbra A sunspot can reach a diameter of
300 000 kilometres39 The temperature in the sunspots centre is much cooler than in the
photosphere because of the convection explained above It measures around 4 200 K whilethe photosphere has a temperature of 6000 K40
Figure 7 The composition of a sunspot
httpwwwjaxajparticlespecialastroshimizu02_ehtml
A sunspot appears black to our eyes However appearances are deceptive the dark sunspot
only seems dark because we see it against a much warmer environment If we h ad seen itagainst a black surface it would have been much brighter than the moonrsquos glowing41
The amount of sunspots varies from very few till over more than a hundred The amount of
sunspots can be predicted by the Wolf-numbers named after Johann R udolf Wolf (1816-
1893) a Swiss astronomer best known for his research on sunspots42 However I wonrsquot
explain this method in this paper You can find a briefly explanation in appendix X Yet this
method is only capable to predict the amount of sunspots approximately
42 Prominences
421 What is a prominence
The luminosity of the sun outshines lots of phenomena that take place on the surface of the
sun and even far away from the sun The sunrsquos corona is one example But luckily
prominences are quite visibly when we observe the sun A prominence is a huge cloud of gas
that is cooler than his environment It is trapped between two horizontal magnetic field lines
For human eyes it seems to spread out dark but this is only because a prominence has a much
39 LILENSTEN J and BORNAREL J Sous les feux du soleil EDP Sciences Les Ulis Cedex A 2001 p 3540 OTTERSDORF M Astronomy On the sunspot cycle Internet (httpuserszoominternetnet~matto
MCASsunspot_cyclehtmZeeman effect) 03110341JANSSENS J Zon en aarde een unieke relatie Garant Antwerpen 2003 p 41
42 JANSSENS J lsquoHet maximum van de 23ste zonnevlekkencyclus (I)rsquo Heelal October 1998 p 256-263
832019 Ew Afgewerkte Final
httpslidepdfcomreaderfullew-afgewerkte-final 1959
19
lower temperature then the sunrsquos chromosphere (similar to sunspots which spread out dark
too) The dark lines in appendix XI are also known as filaments A filament is a line between
to magnetic fields with opposite polarities (appendix XI)43
Figure 8 A solar prominence
httpcosmic-webcoukp=274more-274
422 What is a prominence made of
The gas from the prominence is coming from the chromosphere So the prominences have
approximately the same composition as the chromosphere A good way to observe
prominences is to use red Hα or blue Hβ spectrum lines Hα absorption lines indicate a
temperature lower than 10 000 Kelvin These spectrum lines justif y that the temperature of a prominence is remarkably lower than the temperature of the corona 44
423 How do prominences originate
A prominence is a result of the magnetic field Particles of the sun can transport warmth very
fast if they move alongside magnetic field lines If they want to move straight to a magnetic
field line the transport of warmth is negligible So prominences that are trapped between 2
magnetic fields only have one way to be heated This brings on a temperature that is notably
lower then the temperature in the corona45
The origin of prominences is similar to the origin of solar flares When two magnetic loops
of opposite polarity start to approach each other they will reconnect and form some new
loops This is shown in appendix XII Some mass from the sun will be trapped between the
new magnetic field lines and will form a solar prominence 46
43COMINS NF and KAUFMANN III WJ Discovering the universe eighth edition WH Freeman and
Company New York 2008 p 29944 SMITS F lsquoProtuberanzenrsquo Heelal Juli 1991 p 18345 LANG KR Sun earth and sky Springer Germany 1995 p 134-14046
MARTENS PC and ZWAAN C Origin and evolution of filament-prominence systems Internet ( httpwwwioporgEJarticle0004-637X558287253575webpdfrequest-id=73e38daa-69ae-4e01-b9a6- b4bd0ba071dd) 092001
832019 Ew Afgewerkte Final
httpslidepdfcomreaderfullew-afgewerkte-final 2059
20
424 What do prominences look like47
4241 Different groups of prominences
As you can see on the pictures in appendix XIII prominences can have different shapes and
forms Thatrsquos why astronomers classify them into different groups the quiescent prominences the active prominences and eruptive prominences
4242 Quiescent prominences
Quiescent prominences can appear everywhere on the sun and are not depending on latitude
They can reach into the corona over 2 500 till 40 000 kilometres Quiescent prominences last
the longest of all prominences Some of them even last several solar rotations long These
prominences are very long and not so wide During its lifetime a quiescent prominence moves
slowly to the poles When they are found at the poles of the sun they are called a lsquopolar
crownrsquo (appendix XIV)48
4243 Active prominences
Their name already suggests where they can be found active prominences are found in the
active regions of the sun moreover in the presence of sunspots These prominences
however only have a short lifespan only several hours But within this short lifespan they do
change form adjusting to the magnetic field lines within a short period of time Because
these prominences are located in active regions there are many more reconnections and so
the form will change more rapidly
4244 Eruptive prominences
These prominences only last a couple of minutes and are connected to active sunspots as well
It is possible that after one died out another immediately gives birth in the same region Other
eruptive prominences are known to be bubbles of gas that are issued from active sunspots
There have been some records of eruptive prominences that bump into other prominences and
push the other prominences back in the sunspot49
47 KNISELY D Solar prominences Internet (httpwwwicstarscomHTMLSolarSectionHAlpha OBSERVINGTHESUNHAlpha3html) (03042009)
SMITS F lsquoProtuberanzenrsquo Heelal Juli 1991 p 182-185
ELLERMAN F Solar prominences Internet (httparticlesadsabsharvardedufull 1928ASPL173E0000074000html) (03042009)48
KNISLEY D Solar prominences Internet (httpwwwicstarscomHTMLSolarSectionHAlphaOBSERVINGTHESUNHAlpha3html) (03042009)49 PRIEST E R Dynamics and Structure of Quiescent Solar Prominences Internet (httpbooksgooglebe
booksid=h599q3jz1w4Campdq=quiescent+prominencesampprintsec=frontcoverampsource=blampots=58b79Qeyabampsig=1eklQ-WszOIebZZaq7fq7gm6bxAamphl=nlampei=urPtSe7ZCo61-Qa166jHDwampsa=Xampoi=book_resultampct=resultampresnum=3PPA6M2) 1989
832019 Ew Afgewerkte Final
httpslidepdfcomreaderfullew-afgewerkte-final 2159
21
43 Coronal holes50
When looking at the sun with an x-ray telescope we can see dark regions across the sun
These dark regions are called coronal holes Coronal holes have an open magnetic field
structure This means that the magnetic fields lines do not angle downwards but they extend
into space indefinitely Due to this the particles of the sun are capable to reach out far intospace without any struggles against the magnetic field With this outflow of gases from the
sun coronal holes are one of the most important sources of the (high-speed) solar wind
(appendix XV)
44 Corona loops
441 What is a corona loop
If we look closer at a pair of sunspots we can see an emission of plasma alongside
magnetic field lines that originate in the sun spots A corona loop can extend into the coronaas the name suggests Those loops contain plasma that can reach a temperature higher than
106 Kelvin Corona loops can best be observed by ultra-violet and x-ray images because of
the high temperature The high temper ature brings on a high vibration of the atoms This
trembling causes the emission of x-rays51
Figure 9 A close up of corona loops
httpwwwdaviddarlinginfoencyclopediaCcoronal_loophtml
442 Where and when do corona loops originate
The magnetic field lines of sunspots move outwards from the sun into the corona and form
broad loops This makes it possible to trap hot gas with a temperature up to 40 million K
Those magnetic field loops trap hot plasma into the sunrsquos atmosphere The magnetic force
pushes particles around along the magnetic lines but at the same time the atoms circulate
around the magnetic field lines (see figure 10) The speed of their movements depends on the
50
ENCYCLODPEDIA OF SCIENCE Corona hole Internet (httpwwwdaviddarlinginfoencyclopediaC coronal_holehtml) (04042009)51 JANSSENS J Zon en aarde een unieke relatie Garant Antwerpen 2003 p 52-54
832019 Ew Afgewerkte Final
httpslidepdfcomreaderfullew-afgewerkte-final 2259
22
density of the magnetic field So if a particle moves from the top of a loop to the bottom it
will slow down just like in traffic jams Eventually it will reach the bottom but the bottom is
highly compressed (because the magnetic field lines converge at the bottom of the loops) so
that the particle will be shot back along the magnetic field line (see figure 10)
Figure 10 the movement of particles in corona loops
GD HOLMAN lsquoThe mysterious origins of solar flaresrsquo Scientific America April 2006 p24-29 volume 294number 4
Hence the particles will move up and down along the magnetic field lines Atoms that are
charged the same will cause electric currents (just like in a battery) These currents will
generate a new magnetic field and the old magnetic field in combination with the new one
will cause a high distortion in the magnetic field of the sun This is the moment when the
corona loop will transform into a solar flare
45 Solar flare52
451 What is a solar flare
A solar flare is a sudden powerful explosion in the solar atmosphere caused by a disruption
in the magnetic field of the sun Because of the disruption mass from the sun will be movedup and form a solar flare A solar flare can equal the energy of billions of atomic bombs
within a few minutes The strongest solar flares are measured during the solar maximums
because then the sunrsquos magnetic activity is the strongest53 Since the sunspots in the presence
of solar flare have a very high magnetic field it is likely that a solar flare would even have a
higher magnetic field But in reality the magnetic field of a solar flare is only half of the
magnetic field of a sunspot The intensity of the magnetic field is lsquoonlyrsquo 500 Gauss54
52 HOLMAN GD lsquoThe mysterious origins of solar flaresrsquo Scientific America April 2006 p 24-31 volume
294 number 453JANSSENS J Zon en aarde een unieke relatie Garant Antwerpen 2003 p 55-57
54 JANSSENS J lsquoZonnefakkelsrsquo Heelal Oktober 1994 p 256
832019 Ew Afgewerkte Final
httpslidepdfcomreaderfullew-afgewerkte-final 2359
23
Figure 11 You can see the magnetic fieldlines in the solar flare on the right side
Large solar flare recorded by SOHO EIT304 instrument 512x512 version Animation (980kMPEG) CourtesySOHO(ESAampNASA)
httpwwwteachersparadisecomencyenwikipediassusunhtml
452 Where and how do sun flares originate
Astronomers have long been speculating how solar flares exactly originate In 1992 Satoshi
Masuda (graduated at the University of Tokyo) discovered on pictures of the Japanese
Yohkoh Satellite that the far end of a solar flare emitted unusually short wavelengths very
short x-rays The source must be a concentration of gas with a temperature of about 100million K concluded Masuda But this discovery provoked some new questions why was the
high temperature at the top of the flare and not at the bottom where the gas is more compact
Why does the plasma stay confined instead of spreading out into the universe In order to
obtain more information to try to solve this problem astronomers started observing the sunrsquos
radiation of ultraviolet and x-rays frequently In 2002 NASA even launched the RHESSI
(Ramaty High Energy Solar Spectroscopic Imager) which was intended to bring solar flares
into pictures55
These observations provided evidence that sun flares surge up in regions where the magnetic
field is very strong ndashmost common in the presence of sun spots At this point we have to call
over the corona loops As mentioned before corona loops are electric currents of atoms
which move alongside magnetic field lines When the atoms are shot back alongside the
magnetic field line there seems to occur a distortion of the magnetic field This distortion will
end up in a solar flare All the mass of the corona loop will be shot into space and form a solar
flare
But how can such enormous mass of the solar flares be shot into s pace This has been a very
interesting question However Peter Alan Sweet (1921-2005)56 succeeded in finding an
55 GD HOLMAN lsquoThe mysterious origins of solar flaresrsquo Scientific America April 2006 p 27 volume 294
number 456UNIVERSITY OF GLASGOW Bibliography of Peter Sweet Internet (httpwwwuniversitystoryglaacuk
biographyid=WH2144amptype=P) (10042009)
832019 Ew Afgewerkte Final
httpslidepdfcomreaderfullew-afgewerkte-final 2459
24
answer already in 1956 If magnetic field lines break apart and then reconnect they bring
together two opposing fields that will cancel each other and cause a huge burst of energy The
reconnection will create new magnetic field lines This reconnection is called the Sweet-
Parker reconnection Yet this is a slow reconnection which cannot take place at the base of a
solar flare with a dazzling speed Fortunately Harry P Petschek published an article about
reconnection in 1964 and solved that problem under certain circumstances it is possible toreconnect much faster which explains solar flares This faster reconnection is also called the
Petschek reconnection But unfortunately with the current technology it is not yet possible to
take pictures of those reconnections57
If the energy comes from the reconnection then where does this reconnection take place
From pictures of solar flares astronomers discovered that at the top of the corona loop a
mysterious x-ray source was found The x-ray source began to give a higher energy level and
at the same time the particles move down towards the sunrsquos surface Yet the x-ray source
stays at the same placehellipThen when the x-rays reach their maximum the loop suddenly
changes direction But this time the x-ray source will move upwards too unexpectedly it
moves at the speed of light approximately three hundred thousands kilometres an hour awayfrom the sun This is the same speed as the coronal mass ejections
46 Coronal mass ejections
461 What is a coronal mass ejection58
Coronal mass ejections (CMErsquos) (appendix XVI) are huge amounts of gas some billions of
plasma from the sun that are ejected into space Their temperature can reach 25 million K59
A coronal mass ejection can last for several hours and it can at last enter the solar wind A
CME can reach a speed of 50kms- 2000kms which means more than 7 million kilometres
an hour60 The mass of a large CME varies from 5 x 10⁶ to 5 x 10¹³ kg61 During a solar
maximum there are more coronal mass ejections than during a minimum but they can occur
at any time of the solar cycle Coronal mass ejections are related both to solar flares and
prominences Very heavy coronal mass ejections can cause some geomagnetic storms on
earth
462 Reconnection
The reconnection of a solar flare can end up in a coronal mass ejection When magneticfield lines that are opposite are starting to reconnect and form new magnetic field lines half of
the magnetic field lines will point downwards and join some existing magnetic loops
However the other part of the magnetic field lines will move upwards at a very high speed
and will form some loops more upwards Between those loops that moved downwards and
those that moved upwards there is some mass that isnrsquot connected to the sun anymore It is
57GD HOLMAN lsquoThe mysterious origins of solar flaresrsquo Scientific America April 2006 p 29 volume 294
number 458
BRAEUNIG R A Glossary Internet (httpwwwbraeunigusspaceglossaryhtm) 200659 LILENSTEN J and BORNAREL J Sous les feux du soleil EDP Sciences Les Ulis Cedex A 2001 p 4460 Cuypers J and others lsquoLa rechercheacute en heacuteliophysique en Belgiquersquo Space connection October 2007 p 10-
1161GREEN SF and JONES M H An introduction to the Sun and Stars The Open University Cambridge
2004 p 68
832019 Ew Afgewerkte Final
httpslidepdfcomreaderfullew-afgewerkte-final 2559
25
known that for an amount of solar flares that this mass between the loops will end up in a
coronal mass ejection Yet this doesnrsquot count for all the solar flares The coronal mass
ejection only takes place if the magnetic field lines twist around each other while forming the
letter lsquoSrsquo (see figure 12)62
Figure 12 Here you can see the reconnection that takes place before the coronal mass ejection starts
httpwwwnasagovmission_pagessolar-bsolar_005html
Certainly we will be capable to answer all the questions about solar flares and coronal mass
ejections in the nearby future But there are also some very interesting questions left what is
at the basis of the acceleration of the atoms in solar flares How does magnetic reconnection
originate Hopefully we will find the answers in the near future
47 Solar wind
471 What is the solar wind
Every second of every day of the year the sunrsquos corona emits a continuous stream of mass
from the sun The temperature of the corona is so high that the sunrsquos magnetic field just
cannot control the outflow of particles We know that the particles are accelerated but
astronomers cannot explain all the details about the solar wind yet
472 What do we know about the solar wind
The speed of the solar wind can change it differs from 300kmh up to 800kmh This speed
depends on the outflow of gases If there is a corona hole pointing towards the earth the solar
wind will reach a speed of around 800kmh The different speeds can interact with each other
and form a new speed according to the rules of light emission When two emissions connect
with each other they can form a faster or slower solar wind just like waves can interact and
form new waves
62BOEN B Birth of a coronal mass ejection Internet (httpwwwnasagovmission_pagessolar-b
solar_005html) 290408
832019 Ew Afgewerkte Final
httpslidepdfcomreaderfullew-afgewerkte-final 2659
26
The ionized atoms with very high temperature coming from the sunrsquos corona are one of the
most important parts of the solar wind but the magnetic fields are important too The
magnetic field outside the sun gets wrapped into a spiral called the Parker-spiral named after
the scientist who described it as the first one (because the sun rotates) This influences the
magnetic field of the sun from the outside The solar wind is emitted in spiral too (see figure
13)
Figure 13 The course of the solar wind caused by the rotation of the sun
httpheliosgsfcnasagovsolarmaghtml
473 Heliosphere
We can describe the heliosphere as a gigantic magnetic bubble around the sun This is
everywhere in space till where the sunrsquos magnetic field reaches and still has an influence The
heliosphere is filled with solar wind although the solar wind has a very low density Yet it
is a very hot wind but because of the very low density it does not have such a great influence
on earth However it can cause some energetic storms on earth63
63 NASA The heliosphere Internet (httpheliosgsfcnasagovheliosphhtml) 20012009
832019 Ew Afgewerkte Final
httpslidepdfcomreaderfullew-afgewerkte-final 2759
27
Conclusion
The sunrsquos magnetic field is a complex system to understand Yet I hope you have learned a
lot from this paper and that you do understand the exiting phenomena described in the
previous chapters
We can discuss the sunrsquos magnetic field from two perspectives The first one is looking at the
magnetic field for global long-term changing dimensions The second way is based on
phenomena on lower scale
The global changes involve the solar cycle and the switch of the magnetic poles The solar
cycle is divided into a decrease of the solar activity until it reaches solar minimum and an
increase of the solar activity until it reaches solar maximum The frequency of the phenomena
that can be found in the outer layers of the sun are directly connected to the solar activity and
thus to the solar cycle Sunspots are the easiest to see they appear as black spots against the
much brighter surface of the sun Corona loops are connected to sunspots and can extend into
solar flares and solar prominences These flares and prominences can burst out into a coronalmass ejection All these phenomena influence the sun and its solar wind how small their part
may be The solar wind has a directly influence on the earth
There is still much to be discovered Astronomers hope to discover much more about the
magnetic field of the sun Today many astronomers and scientists are observing the sun and
every day they discover more and more aspects of the sun Recently a group of researchers
led by David Jess of Queens University Belfast has revealed why the sunrsquos atmosphere is
hotter than its surface64 As you can see astronomy is a very developing science
64
CORDIS Researchers reveal why Suns atmosphere is hotter than its surface Internet (httpcordiseuropaeusearchindexcfmfuseaction=newsdocumentampN_LANG=ENampN_RCN=30598amppid=0ampq=87F36474805A6BEC0B89404F72D0351Famptype=sim) 20032009
832019 Ew Afgewerkte Final
httpslidepdfcomreaderfullew-afgewerkte-final 2859
28
Glossary
Absorption lines A dark line superimposed on a continuous spectrum when a gas absorbs
light from a continuous source that is hotter than the absorbing gas
Aurora Light radiated by atoms and ions formed by the solar wind in the earthrsquos upper atmosphere seen most commonly in the polar regions
Chromosphere The layer in the solar atmosphere between the photosphere and the corona It
is the lowest layer of the atmosphere characterized by reddish hue and by an increase of the
temperature with altitude through all but its lower regions
Convection The transfer of heat from a region of high temperature to a region of lower
temperature by the displacement of the cooler molecules by the warmer molecules The hot
gas will be moved upwards the cool gas will be pushed downwards into the sun
Corona The sunrsquos outer atmosphere It is very extensive and has a very low density It isextremely hot
Coronal hole A dark region of the sunrsquos inner corona as seen at X-ray wavelengths
Coronal loop Closed loops of magnetic field lines extending from the sunrsquos photosphere into
the corona which contain plasma at high temperature They are typically observed through
ultraviolet or x-ray emission from the hot plasma
Coronal mass ejection Large volumes of high energy gas released from the sunrsquos corona
Differential rotation The rotation of a non rigid object in which parts at different latitudes or
different radial distances move at different speeds
Dynamo theory The generation of a magnetic field by circulating electric charges
Eclipse The blocking of a part or all of the light from the moon by the earth (lunar eclipse) or
from the sun by the moon (solar eclipse)
Emission lines Emission lines are used in physics chemistry and astronomy to determine
what kind of gas is doing the emission Every element has a different electronic structure and
will thus have a different emission line fingerprint Emission lines are produced whenelectrons in atoms jump from one energy level to lower energy level
Filament A dark curve seen above the sunrsquos photosphere that is the top view of a solar
prominence
Flux tube Is a generally tube-like (cylindrical) region of space containing a magnetic field
such that the field at the side surfaces is parallel to them Both the cross-sectional area of the
tube and the field contained may vary along the length of the tube but the magnetic flux is
always constant
832019 Ew Afgewerkte Final
httpslidepdfcomreaderfullew-afgewerkte-final 2959
29
Geomagnetic storm When unusually strong surges of solar wind (charged particles from the
Sun) hit the Earth This effect causes variations in the magnetic field which surrounds the
Earth The visible results are eg the aurora (Northern and Southern lights)
Granulation Granules are related to the convective zone The granulation that shows up in the
photosphere is a result of the rising and falling of hot gas that takes place in the convectivezone
Hα absorption line An absorption line due to an electronic transition in hydrogen atoms in
which the atom absorbs a photon so that the electron makes a transition from a state
corresponding to the electronic energy level with n=2 to the one above with n=3 The photon
wavelength in a vacuum is 6563 nm
Heliosphere The volume of space within which the sun through the solar wind influences its
environment in the interstellar medium
Magnetic dynamo A theory that explains phenomena of the solar cycle as a result of periodicwinding and unwinding of the sunrsquos magnetic field in the solar atmosphere
Magnetic reconnection A process taking place in a plasma in which neighbouring
oppositely directed magnetic field lines suddenly part and reconnect in a new configuration
The abrupt change in a magnetic field represented by this process can release large amounts
of energy and it is thought to be important in explaining solar flares and other phenomena
Penumbra The portion of a shadow in which only part of the light source is covered by the
shadow-making body
Photosphere The region in the solar atmosphere from which most of the visible light escapes
into space
Plasma A fourth state of matter (not found naturally on Earth) of very hot gases Plasma is a
fluid with the ability to carry electric currents with no local accumulations of electric charge
Prominence Flamelike protrusion seen near the limb of the sun and extending into the solar
corona The side view of a filament
Quantum theory A theory in physics based on the principle that matter and energy have the
properties of both particles and waves created to explain the radiation of energy from a blackbody the photoelectric effect and the Bohr theory and now used to account for a wide
range of physical phenomena including the existence of discrete packets of energy and
matter the uncertainty principle and the exclusion principle Itrsquos a theory of the interaction of
matter and radiation developed early in the twentieth century which is based on the
quantization of energy and applied to a wide variety of processes that involve an exchange of
energy at the atomic level
Reconnection See magnetic reconnection
Solar cycle A 22-year-cycle during which the sunrsquos magnetic field reverses its polarity twice
Solar flare A violent eruption on the sunrsquos surface
832019 Ew Afgewerkte Final
httpslidepdfcomreaderfullew-afgewerkte-final 3059
30
Solar wind An outward flow of particles (mostly electrons and protons) from the sun
Solstice Either of two points along the ecliptic at which the Sun reaches its maximum
distance north or south of the celestial equator
Spectroscopy Concerns the production and study of spectra
Spectrum The result of electromagnetic radiation passing through a prism or grating so that
different wavelengths are separated
Spicule Short-lived (lifetime from rising to falling is about 15 minutes) jets vertical to the
solar surface that are several thousand kilometres long and about 1 kilometre thick (see also
appendix IV) in the solar chromosphere
Sunspot A temporary cool region in the solar photosphere created by protruding magnetic
fields
Umbra The central completely dark portion of a shadow
Zeemaneffect A splitting of spectra lines in the presence of a magnetic field
Bibliography and webography of the glossary
COMINS NF and KAUFMANN III WJ Discovering the universe eighth edition WH
Freeman and Company New York 2008 535 p
GREEN SF and JONES M H An introduction to the Sun and Stars The Open University
Cambridge 2004 373 p
httpenmimihuastronomygranulationhtml
httpenmimihuastronomyplasmahtml
httpwwwspacecomspacewatchspace_weather_glossaryhtml
httpenmimihuastronomyemission_linehtml
httpenmimihuastronomyabsorption_linehtml
httpwwwpbsorgfaithandreasonphysglossqm-bodyhtml
httpwwwanswerscomtopicquantum-theory
httpenwikipediaorgwikiFlux_tube
832019 Ew Afgewerkte Final
httpslidepdfcomreaderfullew-afgewerkte-final 3159
31
Appendix I The sun in figures
Physical quantity Comment
Radius 695 510 km 109 x earths radius
Mass 1989 x1030 kg 332 946 earths mass
Mass sun in the solar
system
9986 Total mass sun total mass of
our solar system
Volume 1412 x10sup3sup3 cmsup3 13 million x earths volume
Age 455 milliard years
Luminosity 3854 x 10sup3sup3 ergss
Magnitude -2773
Density center 1513 gcmsup3
Density mean 1409 gcmsup3
Pressure center 2334 x1011 bars
Pressure photosphere 00001 bar
Temperature center 15 557 000deg K
Temperature photosphere 5 780deg K Various sources mention
different grades
Temperature corona 2 000 000 to 3 000 000deg K
Rotation time at North or
South pole
up to 35 days on earth
Rotation time at Equator 25 days on earth The difference in rotation
times is called differential
rotation
Rotation time general 2538 days on earth
Mean distance sun-earth
(AU)
14959787 x108 km 1 AU = 1 Astronomical Unit
= 149 598 000 km
Chemical composition of
the sun ( of total number
of atoms)
Hydrogen 921
Helium 78
All others 01
Various sources mention
slightly different percentages
832019 Ew Afgewerkte Final
httpslidepdfcomreaderfullew-afgewerkte-final 3259
32
Chemical composition of
the sun ( of total mass)
Hydrogen 7346
Helium 2485
All others 169
Various sources mention
slightly different percentages
Total transforming of
hydrogen into helium persecond
700 billions of kilograms of
hydrogen are transformedinto 6957 billions of
kilograms of helium each
second
Based on the following references
- BEATTY JK PETERSEN CC and CHAIKIN A The new solar system fourth edition
Cambridge University Press Cambridge 1999 p 421
- LILENSTEN J and BORNAREL J Sous les feux du soleil EDP Sciences Les Ulis
Cedex A 2001 p 247
- LANG KR Sun earth and sky Springer Germany 1995 p 282- DENTHIER T Het zonnestelsel Standaard Uitgeverij 1992 p 415
- JANSSENS J Zon en aarde een unieke relatie Garant Antwerpen 2003 p 254- VOLKSSTERRENWACHT URANIA VZW De zon Internet(httpwwwuraniabesterrenkundezonnestelselzonphp) (01012009)
832019 Ew Afgewerkte Final
httpslidepdfcomreaderfullew-afgewerkte-final 3359
33
Appendix II Anatomy of the sun
httpwwwcosmographicacomgalleryinfographicssolar_anatomyhtml
The middle the sun consists of a heavy core this consists of plasma just as the outer layers
of the sun but the pressure in the core is so high that it behaves much more like a solid bodyThe most outer layer is the corona it reaches far into space More to the inside there is the
chromosphere and then the photosphere The corona the chromosphere and the
photosphere are explained in chapter 1
832019 Ew Afgewerkte Final
httpslidepdfcomreaderfullew-afgewerkte-final 3459
34
Appendix III Granulation
httpwwwwindowsucaredutourlink=sunSolar_interiorsolar_furnacehtml
At the surface of the sun we can find granules These are created by convection the warmest
parts of the sunrsquos interior move upwards and the colder parts at the surface move downwardsThis causes currents of plasma The dark lines are the colder particles We see them darker
because they emit less light than their surrounding neighbourhood
832019 Ew Afgewerkte Final
httpslidepdfcomreaderfullew-afgewerkte-final 3559
35
Appendix IV Spicules
Picture httplpc1clpccdcccauslpcharpellastro20a20deinfo_s09htmInformation httpwwwdaviddarlinginfoencyclopediaSspiculehtml
On this picture you can see spicules Spicules only last for several minutes and can be foundin the chromosphere They are little jets of gas There also exist macrospicules that can be
approximately ten times larger than a normal spicule
832019 Ew Afgewerkte Final
httpslidepdfcomreaderfullew-afgewerkte-final 3659
36
Appendix V The most important satellites observing the sun
Here you can find the most important satellites observing the sun and their missions
Solar and Heliospheric Obseratory (SOHO)
httpsohowwwnascomnasagovaboutabouthtml
SOHO the Solar amp Heliospheric Observatory is a project of international collaboration
between ESA and NASA to study the Sun from its deep core to the outer corona and the solar
wind
SOHO was launched on December 2 1995 The SOHO spacecraft was built in Europe by an
industry team led by prime contractor Matra Marconi Space (now EADS Astrium) under
overall management by ESA The twelve instruments on board SOHO were provided by
European and American scientists Nine of the international instrument consortia are led by
European Principal Investigators (PIs) three by PIs from the US Large engineering teamsand more than 200 co-investigators from many institutions supported the PIs in the
development of the instruments and in the preparation of their operations and data analysis
NASA was responsible for the launch and is now responsible for mission operations Large
radio dishes around the world which form NASAs Deep Space Network are used for data
downlink and commanding Mission control is based at Goddard Space Flight Center in
Maryland
More information about SOHO can be found on
httpsohowwwnascomnasagovaboutdocsSOHO_Fact_Sheetpdf
832019 Ew Afgewerkte Final
httpslidepdfcomreaderfullew-afgewerkte-final 3759
37
Transition Region and Coronal Explorer (TRACE)
httptracelmsalcomProjectMissionmissionhtm
TRACE enables solar physicists to study the connections between fine-scale magnetic fields
and the associated plasma structures on the Sun in a quantitative way by observing the photosphere the transition region and the corona With TRACE these temperature domains
are observed nearly simultaneously (with as little delay as only a second between different
wavelengths) with a spatial resolution of one second of arc
This is accomplished by obtaining precisely coaligned image sequences of photosphere
transition region and corona with high spatial resolution and uninterrupted viewing of the
Sun for up to eight months
TRACE Mission
TRACE explores the magnetic field in the solar atmosphere by studyingbull The 3-dimensional field structure
bull Its temporal evolution in response to photospheric flows
bull The time-dependent coronal fine structure
bull The coronal and transition region thermal topology
TRACE was launched on a Pegasus launch vehicle from Vandenberg Air Force Base in April
1998 The launch was scheduled to allow joint observations with SOHO during the rising
phase of the solar cycle to sunspot maximum No transition region or coronal imager has
witnessed the onset and rise of a solar cycle
Pegasus in flight
The two satellites provide complementary observations TRACE produces the high spatial
and temporal resolution images while SoHO yields images and spectral data out to 30 solar
radii at much lower spatial and temporal resolution Jointly they provide the opportunity to
obtain simultaneous digital measurements of all the temperature regimes of the solar
atmosphere in both high-resolution imaging and spectroscopy
With these data we expect to shatter the current ignorance of coronal heating and impulsive
MHD phenomena with benefits not only to solar physics but also to studies ranging from
stellar activity to the MHD of accretion disks The magnetograms produced by MDI on SoHO
provide a complete record of the eruption and distribution of photosphere magnetic fields
which will be invaluable for understanding TRACE observations of coronal hole formation
and coronal mass ejections Both of these phenomena have profound effects on our space
environment and the Earth`s magnetic field
TRACE is the first US solar research satellite since the Solar Maximum Mission
Coordination with SOHO provides an unprecedented opportunity to follow the emergence of
magnetic flux from the base of the convection zone deep inside the Sun through the
photosphere chromosphere and transitional region to the low-beta outer corona while
observing the effects of this emergence such as coronal mass ejections with high spatial andtemporal resolution
832019 Ew Afgewerkte Final
httpslidepdfcomreaderfullew-afgewerkte-final 3859
38
The transition from the photosphere where magnetic fields and plasma are in rough
equipartition to the corona where magnetic fields dominate is extremely difficult to model
and until recently to observe at high temporal and spatial resolution Many of the physical
problems that arise here such as plasma confinement reconnection wave propagation and plasma heating arise throughout space physics and astrophysics The detailed study of these
processed in the solar outer atmosphere is invaluable to astrophysics in general and stellar
studies in particular
More information about TRACE observations can be found on
httptracelmsalcomOperationsGeneraloperatiohtm
832019 Ew Afgewerkte Final
httpslidepdfcomreaderfullew-afgewerkte-final 3959
39
Reuven Ramaty High Energy Solar Spectroscopic Imager (RHESSI)
httphesperiagsfcnasagovhessibrochurehtm
What Questions will HESSI Address
bull How is such a large amount of energy released so rapidly during a flare
bull How are so many electrons and protons accelerated so quickly to such high energies
bull Where are the electrons and protons accelerated in the solar atmosphere and where do
they deposit their energy
How will HESSI Address these Questions
HESSI shown below will concentrate on electrons and protons accelerated in solar flares
through observations of the X-rays and gamma rays that they produce
bull HESSI will obtain the first ever X-ray and gamma-ray images of flares from 100 keV
to 20 MeVbull HESSI will do the first ever nuclear gamma-ray line spectroscopy of solar flares
bull HESSI will obtain pictures of flares in X-rays with an angular resolution of 2
arcseconds a factor of three better than previously possible
bull HESSI will measure X-ray and gamma-ray spectra with less than 1 keV energy
resolution a factor of 20-40 better than previously possible with scintillation counters
More information about the RHESSIrsquos Mission can be found on
httphesperiagsfcnasagovhessiconcepthtm
832019 Ew Afgewerkte Final
httpslidepdfcomreaderfullew-afgewerkte-final 4059
40
Solar Radiation and Climate Experiment (SORCE)
httplaspcoloradoedusorcesciencebackgroundhtm
The Solar Radiation and Climate Experiment (SORCE) is a NASA-sponsored satellite
mission that is providing state-of-the-art measurements of incoming x-ray ultraviolet visiblenear-infrared and total solar radiation The measurements provided by SORCE specifically
address long-term climate change natural variability and enhanced climate prediction and
atmospheric ozone and UV-B radiation These measurements are critical to studies of the Sun
its effect on our Earth system and its influence on humankind
The SORCE spacecraft was launched on January 25 2003 on a Pegasus XL launch vehicle to
provide NASAs Earth Science Enterprise (ESE) with precise measurements of solar
radiation It launched into a 645 km 40 degree orbit and is operated by the Laboratory for
Atmospheric and Space Physics (LASP) at the University of Colorado (CU) in Boulder
Colorado USA It will continue the precise measurements of total solar irradiance (TSI) that
began with the ERB instrument in 1979 and has continued to the present with the ACRIM series of measurements SORCE will also provide the measurements of the solar spectral
irradiance from 1nm to 2000nm accounting for 95 of the spectral contribution to TSI
SORCE carries four instruments including the Spectral Irradiance Monitor (SIM) Solar
Stellar Irradiance Comparison Experiment (SOLSTICE) Total Irradiance Monitor (TIM) and
the XUV Photometer System (XPS)
The primary goal of the NASA Earth Observing Systems (EOS) SOlar Radiation and Climate
Experiment (SORCE) is to enable solar-terrestrial studies by providing precise daily
measurements of the total solar irradiance (TSI) and the solar spectral irradiance atwavelengths extending from the ultraviolet to the near infrared The following lists the
SORCE science objectives
1 Make accurate measurements with high precision of total solar irradiance connect
them to previous TSI measurements and continue this long-term climate record
Provide TSI with an accuracy of 001 (100 parts per million) based on SI units and
with a long-term repeatability of 0001yr
2 Make daily measurements of the solar ultraviolet irradiance from 120 to 300 nm with
a spectral resolution of 1 nm Achieve this spectral irradiance measurement with an
accuracy of better than 5 and with a long-term repeatability of 05yr Use the
solarstellar comparison technique to relate the solar irradiance to the ensembleaverage flux from a number of bright early-type stars (same stars used by the UARS
SOLSTICE program)
3 Make the first measurements of the visible and near IR solar irradiance with sufficient
precision for future climate studies Obtain daily measurements of solar spectral
irradiance between 03 and 2 microm with a spectral resolution of at least 130 an
accuracy of 003 and a long-term repeatability of better than 001yr
4 Improve the understanding of how and why solar irradiance varies estimate past and
future solar behavior and investigate climate responses
More information about SORCE can be found on
httplaspcoloradoedusorcesciencescience_opshtm
832019 Ew Afgewerkte Final
httpslidepdfcomreaderfullew-afgewerkte-final 4159
41
Appendix VI Wavelengths
httpeosweblarcnasagovEDDOCSWavelengths_for_Colorshtml
As you can see on the figure visible light situates in the centre of the wavelengths having not
the shortest nor the longest wavelengths Gamma rays have the shortest wavelength radioways the longest All sort of wavelengths are used for daily purpose like radio waves for
radio and TV and gamma rays for treatments
832019 Ew Afgewerkte Final
httpslidepdfcomreaderfullew-afgewerkte-final 4259
42
Appendix VII Absorption lines in the sunrsquos spectrum
Picture httpwwwsolarnavigatornetthe_sunhtmExplanation COMINS NF and KAUFMANN III WJ Discovering the universe eighth edition WHFreeman and Company New York 2008 p 109
This photo is called a spectrogram It contains the spectrum of the sun All the black lines are
absorption lines The amount of black lines is related to the amount of elements that the sun
is emitting From a spectrogram we can deduct a lot of things including their mass the
temperature of the surface the chemical composition of the sun rotation rates and much
more
832019 Ew Afgewerkte Final
httpslidepdfcomreaderfullew-afgewerkte-final 4359
832019 Ew Afgewerkte Final
httpslidepdfcomreaderfullew-afgewerkte-final 4459
44
Appendix IX Butterfly-diagram
httpspacesciencespacerefcomsslpadsolarimagesbflygif
A butterfly-diagram
In a butterfly-diagram we can find the sunspots with their latitude (y-axis) through the years(x-axis) As you can see the sunspots appear like lsquobutterfliesrsquo this was discovered in 1904 by
Edward Maunder (1851-1928 an English astronomer best remembered for his study of
sunspots and the solar magnetic cycle) Thatrsquos why this graph is also called Maunders
butterfly diagram
832019 Ew Afgewerkte Final
httpslidepdfcomreaderfullew-afgewerkte-final 4559
45
Appendix X The Wolf-numbers
httpsidcomabenews106sunspotnumberclarifiedpdf
The sunspot number clarified By Petra Vanlommel
Which kinds of daily International Sunspot Numbers (ISN) are currentlypublished by the SIDC
Three daily indices are currently published by the SIDCthe Estimated ISN (EISN)the Provisional ISN (PISN)the Definitive ISN (DISN)Although they are all based on the same type of observations ie visual sunspot counts as ameasure of solar activity they are obtained from different data sets by different processingmethods with different accuracies and they serve different purposes
In the ideal case the three numbers are equal but in practice it is inevitable that there aresmall differences Therefore It is useful to explain what each index actually means
What is the source of the Wolf number
Once per day observers worldwide communicate their measured Wolf number (= 10G + S)based on visual sunspot (S) and group (G) counts to the World Data Center for the SunspotIndex Presently this is done through a dedicated password-protected WEB form the Wolfinterface However some observers still use the old way of reporting their observations onpaper through regular mail This method slows down the final processing but for the sake ofcontinuity in the index it is important to keep these observers included as some of them
represent the longest individual datasetsThe observers give the exact observing time the observing conditions the total numbers(group count sunspot count and Wolf number) and optionally the NorthSouth and centralzone numbers The observers using the web interface can provide their results to the SIDCimmediately after each observation However some users prefer to insert their data as ablock creating some delay but this must be done at least once a month
The personal reduction coefficient K
A personal reduction coefficient K is calculated for each station It has values typically in therange 04 and 17 and leads to a normalized sunspot number K(10G+S) In other words theK factor rescales the raw sunspot counts of each observer to the ones of Rudolph Wolf the
astronomer who introduced the above Wolf formula thus simulating the same eyes sametelescope and same conditionsDuring the procedure for calculating the Provisional ISN the K factor of every station iscomputed for every observation that passes the elimination procedure Once a year apersonal K factor for every station and for every month of the previous year is calculated Ayearly mean K value per station is also computed
The estimated sunspot index
The Estimated ISN (EISN) is calculated and issued on a daily basis for the day of calculationand the day before Only the total EISN is calculated with no hemispheric index It is anautomated procedure and no manual intervention is done The EISN is meant as a quicktemporary and approximate index for real-time applications
832019 Ew Afgewerkte Final
httpslidepdfcomreaderfullew-afgewerkte-final 4659
46
We use the raw Wolf number from all observatories that have provided counts early in theday ie before 1230 UT Typically there is between 10 and 20 stations available Thecalculation of the EISN is based on a simple and straightforward statistical method The Wolfnumbers are multiplied with the yearly mean K factor (see paragraph about the personalreduction coefficient K) The EISN is a simple average of the K-scaled values after excludingany individual value that deviates abnormally from the other valuesOnce the Provisional ISN (PISN) is calculated after the end of a month the temporary EISNis dropped and replaced by the PISN
The provisional sunspot Index
The Provisional ISN (PISN) is calculated and issued on the first of every month Theoutcome is a daily total and hemispheric sunspot number for the entire elapsed month Anexample on the first of September we calculate the daily PISN for each day of August ThePISN is computed semi-automatically with as little manual intervention as possibleTo calculate the PISN values for the concerned month we use all Wolf numbers Typicallythere is data from around 65 stations available
The calculation of the PISN is based on an extensive statistical treatment This treatmentfilters out any abnormal daily observation or the complete data set from an erratic station(quality control) This prevents long-term drifts in the resulting index One of the key elementsderived from this processing is to update the K reduction coefficients for each station theevolution of each station is monitored for each day relative to the entire networkA subset of the contributing stations also provides hemispheric counts A similar process isapplied to the North and South counts to derive the hemispheric PISN There is an additionalconstraint the sum of the North and South ISN must match the total ISNThe PISN replaces the EISN And once the Definitive ISN (DISN) is calculated the DISNreplaces the PISN
The definitive sunspot index
The Definitive ISN is calculated and issued on a quarterly basis when we have collecteddata from all the contributing observatories This is the final index and it is appended to thehistorical sunspot index time series The same semi-automated treatment as for the PISN isnow applied to the full data set If the result agrees within 5 of the PISN value the PISN iskept and becomes definitive Otherwise the new calculated value replaces the PISN andbecomes the definitive ISNIt is only at this stage and only in peculiar situations that a manual verification by ourscientific staff is required For example this happens when the observed raw Wolf valuesfrom the whole network are clustered around two distinct values This special case can becaused by small short-lived isolated sunspots (lifetimes lt 24 hours) or by the appearance ordisappearance of a large group at the solar limb in the course of one UT dayThe DISN replaces the provisional and estimated International Sunspot Number
Handling very low activity levels
One of the situations requiring a human arbitration is associated with single small isolatedand short-lived sunspots This is most noticeable around the minimum of the solar activitycycle like the one occurring now in 2008 Due to the 24hour binning (observations aregrouped between 0hUT and 24hUT) and the variable ability of each observer to detect thesmallest sunspots we end up with some stations reporting one sunspot and others who didno see any sunspot Let us explain further No sunspot may mean that the sunspot waspresent but the observer was unable to see it because of poor observational conditions such
as weather a small telescope On the other hand it may also indicate that the sunspot hadactually vanished by that time while it was present earlier on the same day
832019 Ew Afgewerkte Final
httpslidepdfcomreaderfullew-afgewerkte-final 4759
47
Individual stations do not observe at exactly the same timeIn order to validate the existence of such a marginal reported sunspot a qualified SIDCscientist must then check the detailed chronology within that day and consider the overallobserver capability (value of K coefficient)In common practice the fact that a sunspot is reported by a significant group of observersleads to the inclusion of the sunspot on that date thus neglecting the no-sunspotobservationsThe rationale is multiple observations of a sunspot exclude the possibility that the reportedsunspot was an independent false detection So a sunspot was really present on that dayalthough it may have existed only for part of the day or it was small enough to be missed bypart of the observers with smaller instruments or imperfect atmospheric conditionsAlso keep in mind that the sunspot index is derived with a limited precision just like any otherindex If the monthly mean sunspot number is 0 or 05 you can definitely say that activitywas low
What index should be used
If you want to perform long-term investigations the definitive ISN series is definitely the mostsuitable However there is a delay of a few months So when investigating the last cycle andrecent evolution use the definitive numbers in combination with the provisional ISN to be upto date to the last month The provisional numbers are also used in models forecasting thesunspot number for the coming months Now if you need a proxy for solar activity in a modelthat runs in real-time then you may use the estimated ISNImprovements and rethinking of the processing method is an ongoing project We arecurrently developing an alternative program for calculating the PISN Of course long-termconsistency is vital Therefore a cross-analysis between the output from the old and newsoftware must be applied over an extended period
832019 Ew Afgewerkte Final
httpslidepdfcomreaderfullew-afgewerkte-final 4859
48
Above graphs show different kinds of the International Sunspot Number The left plot gives an overview from 1700 up to now from the yearly (black) and monthly smoothed Sunspot Number The graph in the right top corner shows the monthly and monthly smoothed sunspot number while the graph in the right bottom corner show the daily monthly smoothed monthly sunspot number For every the time range of investigation there is an appropriate sunspot number
832019 Ew Afgewerkte Final
httpslidepdfcomreaderfullew-afgewerkte-final 4959
49
Appendix XI Filaments and prominences
httpsohowwwnascomnasagovpickoftheweekold26feb2004
This is a picture taken by SOHO on 26 February 2004
832019 Ew Afgewerkte Final
httpslidepdfcomreaderfullew-afgewerkte-final 5059
50
Appendix XII The reconnection of magnetic loops
httpwwwioporgEJarticle0004-637X558287253575webpdfrequest-id=73e38daa-69ae-4e01-b9a6- b4bd0ba071dd
In (a) sunspot B and C have different polarity and move towards each other The twomagnetic loops will reconnect and form one big magnetic loop showed in (b) This will
happen to other magnetic loops too as can be seen in (c) When G en F are close enough they
will reconnect and so E en H will reconnect too It is possible that the magnetic field line is
trapped around another in this case AD The mass ejected from the sun will be trapped
between the magnetic field lines and form a solar prominence
832019 Ew Afgewerkte Final
httpslidepdfcomreaderfullew-afgewerkte-final 5159
832019 Ew Afgewerkte Final
httpslidepdfcomreaderfullew-afgewerkte-final 5259
52
httptheinvisibleagentwordpresscom20090117amazing-celestial-images
An group of active prominences
httpapodnasagovapodap051109html
httpwhassupinthemilkywayblogspotcom200903cloudy-planhtml
A picture taken by SOHO In the left corner you can see the prominence with twisted
magnetic field lines
832019 Ew Afgewerkte Final
httpslidepdfcomreaderfullew-afgewerkte-final 5359
53
Appendix XIV Polar crown
httpsciencenasagovheadlinesy200817sep_polarcrownhtm
Photograph of a polar crown taken on 13 June 1999 by the Meudon Observatory
832019 Ew Afgewerkte Final
httpslidepdfcomreaderfullew-afgewerkte-final 5459
54
Appendix XV Coronal holes
httpsunearthdaynasagov2007multimediagal_020php
The black segment is a huge coronal hole The bright parts are x-rays from sunspots
832019 Ew Afgewerkte Final
httpslidepdfcomreaderfullew-afgewerkte-final 5559
55
Appendix XVI Coronal mass ejection
httpzuserver2staruclacuk~idhapodap000309html
Picture of a CME taken by SOHO in February 2000
832019 Ew Afgewerkte Final
httpslidepdfcomreaderfullew-afgewerkte-final 5659
56
Bibliography
Books
BEATTY JK PETERSEN CC and CHAIKIN A The new solar system fourth edition
Cambridge University Press Cambridge 1999 421 p
COMINS NF and KAUFMANN III WJ Discovering the universe eighth edition WH
Freeman and Company New York 2008 535 p
DETHIER T Het zonnestelsel Standaard Uitgeverij 1992 415 p
GOLUB L and PASACHOFF JM Nearest star the surprising science of our sun Harvard
university press Harvard 2001 267 p
GREEN SF and JONES M H An introduction to the Sun and Stars The Open University
Cambridge 2004 373 p
HILL S and CARLOWITZ M The sun Abrams New York 2006 239 p
HOLMAN GD lsquoThe mysterious origins of solar flaresrsquo Scientific America April 2006 p
24-31 volume 294 number 4
JANSSENS J Zon en aarde een unieke relatie Garant Antwerpen 2003 254 p
KELLER H-U Van Supernovarsquos tot zwarte gaten Tirion Natuur AH Baarn 2003 169 p
LANG KR Sun earth and sky Springer Germany 1995 282 p
LILENSTEN J and BORNAREL J Sous les feux du soleil EDP Sciences Les Ulis Cedex
A 2001 247 p
832019 Ew Afgewerkte Final
httpslidepdfcomreaderfullew-afgewerkte-final 5759
57
Articles
CUYPERS J and others lsquoLa rechercheacute en heacuteliophysique en Belgiquersquo Space connection
October 2007 20 p
DE KEYSER J lsquoDe magnetopauzersquo Heelal maart 1998 p 66-73
JANSSENS J lsquoHet maximum van de 23ste zonnevlekkencyclus (I)rsquo Heelal Oktober 1998 p
256-263
JANSSENS J lsquohet maximum van de 23ste zonnenvlekkencyclus (II)rsquo Heelal November
1998 p 284-290
JANSSENS J lsquoZonnefakkelsrsquo Heelal Oktober 1994 p 256-261
SMITS F lsquoDe coronarsquo Heelal Februari 1999 p 40-42
SMITS F lsquoProtuberanzenrsquo Heelal Juli 1991 p 182-185
VAN DEN BERGHE S lsquoHet Zeemaneffectrsquo Heelal September 1998 p 228-231
832019 Ew Afgewerkte Final
httpslidepdfcomreaderfullew-afgewerkte-final 5859
58
Webography
BOEN B Birth of a coronal mass ejection Internet
(httpwwwnasagovmission_pagessolar-b solar_005html) 290408
BRAEUNIG R A Glossary Internet (httpwwwbraeunigusspaceglossaryhtm) 2006
CORDIS Researchers reveal why Suns atmosphere is hotter than its surface Internet
(httpcordiseuropaeusearchindexcfmfuseaction=newsdocumentampN_LANG=ENampN_R
CN=30598amppid=0ampq=87F36474805A6BEC0B89404F72D0351Famptype=sim) 20032009
DAY C Alfveacuten waves may heat the Sunrsquos corona Internet
(httpblogsphysicstodayorgupdate200903 alfven-waves-may-heat-the-sunshtml)
310309
ELLERMAN F Solar prominences Internet (httparticlesadsabsharvardedufull
1928ASPL173E 0000074000html) (03042009)
ENCYCLODPEDIA OF SCIENCE Corona hole Internet
(httpwwwdaviddarlinginfoencyclopediaC coronal_holehtml) (04042009)
HATHAWAY D H The sunspot cycle Internet
(httpspacesciencespacerefcomsslpadsolarsunspots htm) 04012000
JANSSENS J The case of the missing solar cycle (published in lsquoheelalrsquo January 2008)
Internet (httpuserstelenetbejjanssensMSCwebEngpdf)
KNISELY D Solar prominences Internet
(httpwwwicstarscomHTMLSolarSectionHAlphaOBSERVINGTHESUNHAlpha3html)
(03042009)
KOPANSKI J Atom Internet (httpknolgooglecomkjan-
kopanskiatom1amrwrct7rvi27) 060209
MARTENS PC and ZWAAN C Origin and evolution of filament-prominence systems
Internet (http wwwioporgEJarticle0004-637X558287253575webpdfrequest-
id=73e38daa-69ae-4e01-b9a6-b4bd0ba071dd) 092001
NASA The corona Internet (httpsolarsciencemsfcnasagovcoronashtml) 180107
NASA The heliosphere Internet (httpheliosgsfcnasagovheliosphhtml) 20012009
OFFICIAL SITE OF STONEHENGE About Stonehenge Internet
(httpwwwstonehengecouk) (03022009)
OTTERSDORF M Astronomy On the sunspot cycle Internet
(httpuserszoominternetnet~matto MCASsunspot_cyclehtmZeemaneffect) 031103
PARIAT E and SCHMIEDER B Magnetic flux emergence Internet(httpwwwscholarpediaorgarticleMagnetic_field_emergence) 18042008
832019 Ew Afgewerkte Final
httpslidepdfcomreaderfullew-afgewerkte-final 5959
59
PRIEST E R Dynamics and Structure of Quiescent Solar Prominences Internet
(httpbooksgooglebe booksid=h599q3jz1w4Campdq=quiescent+prominencesampprintsec=fro
ntcoverampsource=blampots=58b79Qeyabampsig=1eklQ-
WszOIebZZaq7fq7gm6bxAamphl=nlampei=urPtSe7ZCo61-
Qa166jHDwampsa=Xampoi=book_resultampct=result ampresnum=3PPA6M2) 1989
RUSSELL R Rotation of the sun Internet
(httpwwwwindowsucaredutourlink=sunSolar_interior
Sun_layersdifferential_rotationhtml) 16082005
RUSSELL R Sunspots and magnetic fields Internet
(httpwwwwindowsucaredutourlink=sunatmospheresunspot_magnetismhtmlampedu=hig
h) 060908
UNIVERSITY OF GLASGOW Bibliography of Peter Sweet Internet
(httpwwwuniversitystoryglaacuk biographyid=WH2144amptype=P) (10042009)
WIKIPEDIA Orbiting Solar Observatory Internet
(httpenwikipediaorgwikiOrbiting_Solar_Observatory) 24012009
WINDOWS TEAM Maunderrsquos Butterfly Diagram Internet
(httpwwwwindowsucaredutourlink=sun activitybutterflyhtml) 2000
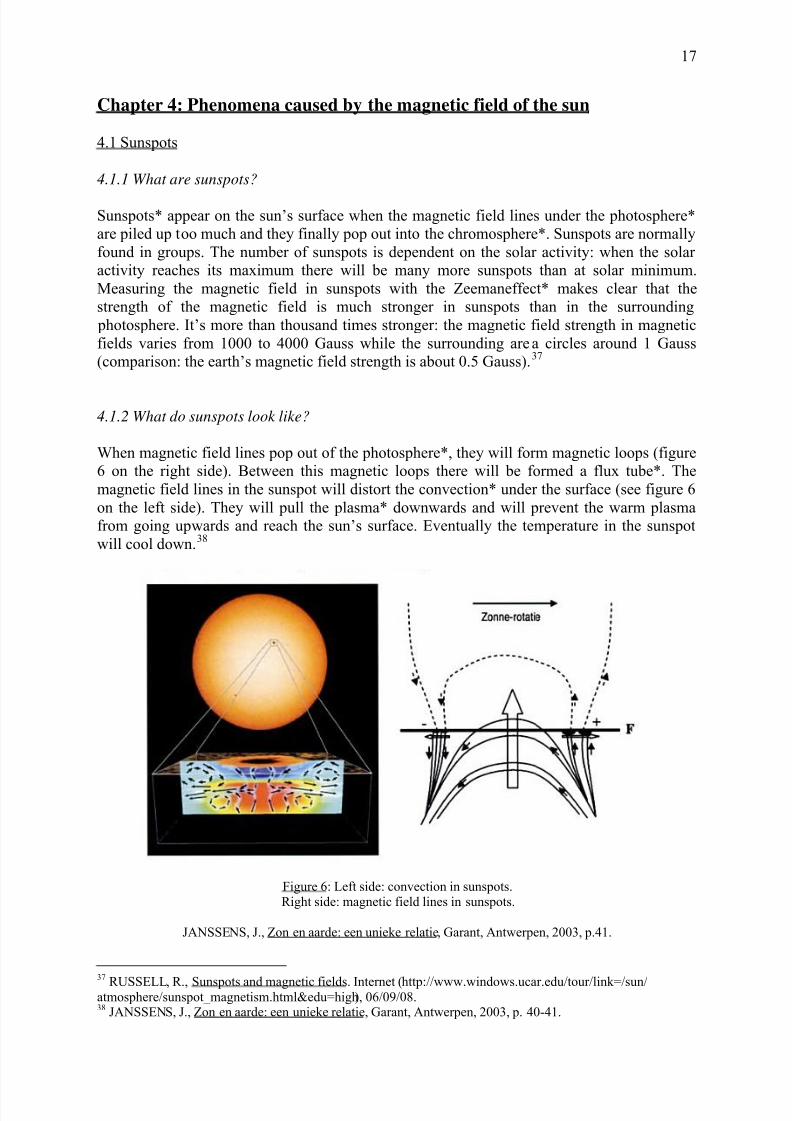
832019 Ew Afgewerkte Final
httpslidepdfcomreaderfullew-afgewerkte-final 1759
17
Chapter 4 Phenomena caused by the magnetic field of the sun
41 Sunspots
411 What are sunspots
Sunspots appear on the sunrsquos surface when the magnetic field lines under the photosphere
are piled up too much and they finally pop out into the chromosphere Sunspots are normally
found in groups The number of sunspots is dependent on the solar activity when the solar
activity reaches its maximum there will be many more sunspots than at solar minimum
Measuring the magnetic field in sunspots with the Zeemaneffect makes clear that the
strength of the magnetic field is much stronger in sunspots than in the surrounding
photosphere Itrsquos more than thousand times stronger the magnetic field strength in magnetic
fields varies from 1000 to 4000 Gauss while the surrounding area circles around 1 Gauss
(comparison the earthrsquos magnetic field strength is about 05 Gauss)37
412 What do sunspots look like
When magnetic field lines pop out of the photosphere they will form magnetic loops (figure
6 on the right side) Between this magnetic loops there will be formed a flux tube The
magnetic field lines in the sunspot will distort the convection under the surface (see figure 6
on the left side) They will pull the plasma downwards and will prevent the warm plasma
from going upwards and reach the sunrsquos surface Eventually the temperature in the sunspot
will cool down38
Figure 6 Left side convection in sunspotsRight side magnetic field lines in sunspots
JANSSENS J Zon en aarde een unieke relatie Garant Antwerpen 2003 p41
37
RUSSELL R Sunspots and magnetic fields Internet (httpwwwwindowsucaredutourlink=sunatmospheresunspot_magnetismhtmlampedu=high) 06090838 JANSSENS J Zon en aarde een unieke relatie Garant Antwerpen 2003 p 40-41
832019 Ew Afgewerkte Final
httpslidepdfcomreaderfullew-afgewerkte-final 1859
18
We can distinguish 2 areas the black sunspot and the surrounding bright surface of the sun
The sunspot itself consists of the very dark centre called the umbra and the surrounding
orange-brown environment called the penumbra The penumbra consists of an amount of
small little striated f igures that come out of the umbra A sunspot can reach a diameter of
300 000 kilometres39 The temperature in the sunspots centre is much cooler than in the
photosphere because of the convection explained above It measures around 4 200 K whilethe photosphere has a temperature of 6000 K40
Figure 7 The composition of a sunspot
httpwwwjaxajparticlespecialastroshimizu02_ehtml
A sunspot appears black to our eyes However appearances are deceptive the dark sunspot
only seems dark because we see it against a much warmer environment If we h ad seen itagainst a black surface it would have been much brighter than the moonrsquos glowing41
The amount of sunspots varies from very few till over more than a hundred The amount of
sunspots can be predicted by the Wolf-numbers named after Johann R udolf Wolf (1816-
1893) a Swiss astronomer best known for his research on sunspots42 However I wonrsquot
explain this method in this paper You can find a briefly explanation in appendix X Yet this
method is only capable to predict the amount of sunspots approximately
42 Prominences
421 What is a prominence
The luminosity of the sun outshines lots of phenomena that take place on the surface of the
sun and even far away from the sun The sunrsquos corona is one example But luckily
prominences are quite visibly when we observe the sun A prominence is a huge cloud of gas
that is cooler than his environment It is trapped between two horizontal magnetic field lines
For human eyes it seems to spread out dark but this is only because a prominence has a much
39 LILENSTEN J and BORNAREL J Sous les feux du soleil EDP Sciences Les Ulis Cedex A 2001 p 3540 OTTERSDORF M Astronomy On the sunspot cycle Internet (httpuserszoominternetnet~matto
MCASsunspot_cyclehtmZeeman effect) 03110341JANSSENS J Zon en aarde een unieke relatie Garant Antwerpen 2003 p 41
42 JANSSENS J lsquoHet maximum van de 23ste zonnevlekkencyclus (I)rsquo Heelal October 1998 p 256-263
832019 Ew Afgewerkte Final
httpslidepdfcomreaderfullew-afgewerkte-final 1959
19
lower temperature then the sunrsquos chromosphere (similar to sunspots which spread out dark
too) The dark lines in appendix XI are also known as filaments A filament is a line between
to magnetic fields with opposite polarities (appendix XI)43
Figure 8 A solar prominence
httpcosmic-webcoukp=274more-274
422 What is a prominence made of
The gas from the prominence is coming from the chromosphere So the prominences have
approximately the same composition as the chromosphere A good way to observe
prominences is to use red Hα or blue Hβ spectrum lines Hα absorption lines indicate a
temperature lower than 10 000 Kelvin These spectrum lines justif y that the temperature of a prominence is remarkably lower than the temperature of the corona 44
423 How do prominences originate
A prominence is a result of the magnetic field Particles of the sun can transport warmth very
fast if they move alongside magnetic field lines If they want to move straight to a magnetic
field line the transport of warmth is negligible So prominences that are trapped between 2
magnetic fields only have one way to be heated This brings on a temperature that is notably
lower then the temperature in the corona45
The origin of prominences is similar to the origin of solar flares When two magnetic loops
of opposite polarity start to approach each other they will reconnect and form some new
loops This is shown in appendix XII Some mass from the sun will be trapped between the
new magnetic field lines and will form a solar prominence 46
43COMINS NF and KAUFMANN III WJ Discovering the universe eighth edition WH Freeman and
Company New York 2008 p 29944 SMITS F lsquoProtuberanzenrsquo Heelal Juli 1991 p 18345 LANG KR Sun earth and sky Springer Germany 1995 p 134-14046
MARTENS PC and ZWAAN C Origin and evolution of filament-prominence systems Internet ( httpwwwioporgEJarticle0004-637X558287253575webpdfrequest-id=73e38daa-69ae-4e01-b9a6- b4bd0ba071dd) 092001
832019 Ew Afgewerkte Final
httpslidepdfcomreaderfullew-afgewerkte-final 2059
20
424 What do prominences look like47
4241 Different groups of prominences
As you can see on the pictures in appendix XIII prominences can have different shapes and
forms Thatrsquos why astronomers classify them into different groups the quiescent prominences the active prominences and eruptive prominences
4242 Quiescent prominences
Quiescent prominences can appear everywhere on the sun and are not depending on latitude
They can reach into the corona over 2 500 till 40 000 kilometres Quiescent prominences last
the longest of all prominences Some of them even last several solar rotations long These
prominences are very long and not so wide During its lifetime a quiescent prominence moves
slowly to the poles When they are found at the poles of the sun they are called a lsquopolar
crownrsquo (appendix XIV)48
4243 Active prominences
Their name already suggests where they can be found active prominences are found in the
active regions of the sun moreover in the presence of sunspots These prominences
however only have a short lifespan only several hours But within this short lifespan they do
change form adjusting to the magnetic field lines within a short period of time Because
these prominences are located in active regions there are many more reconnections and so
the form will change more rapidly
4244 Eruptive prominences
These prominences only last a couple of minutes and are connected to active sunspots as well
It is possible that after one died out another immediately gives birth in the same region Other
eruptive prominences are known to be bubbles of gas that are issued from active sunspots
There have been some records of eruptive prominences that bump into other prominences and
push the other prominences back in the sunspot49
47 KNISELY D Solar prominences Internet (httpwwwicstarscomHTMLSolarSectionHAlpha OBSERVINGTHESUNHAlpha3html) (03042009)
SMITS F lsquoProtuberanzenrsquo Heelal Juli 1991 p 182-185
ELLERMAN F Solar prominences Internet (httparticlesadsabsharvardedufull 1928ASPL173E0000074000html) (03042009)48
KNISLEY D Solar prominences Internet (httpwwwicstarscomHTMLSolarSectionHAlphaOBSERVINGTHESUNHAlpha3html) (03042009)49 PRIEST E R Dynamics and Structure of Quiescent Solar Prominences Internet (httpbooksgooglebe
booksid=h599q3jz1w4Campdq=quiescent+prominencesampprintsec=frontcoverampsource=blampots=58b79Qeyabampsig=1eklQ-WszOIebZZaq7fq7gm6bxAamphl=nlampei=urPtSe7ZCo61-Qa166jHDwampsa=Xampoi=book_resultampct=resultampresnum=3PPA6M2) 1989
832019 Ew Afgewerkte Final
httpslidepdfcomreaderfullew-afgewerkte-final 2159
21
43 Coronal holes50
When looking at the sun with an x-ray telescope we can see dark regions across the sun
These dark regions are called coronal holes Coronal holes have an open magnetic field
structure This means that the magnetic fields lines do not angle downwards but they extend
into space indefinitely Due to this the particles of the sun are capable to reach out far intospace without any struggles against the magnetic field With this outflow of gases from the
sun coronal holes are one of the most important sources of the (high-speed) solar wind
(appendix XV)
44 Corona loops
441 What is a corona loop
If we look closer at a pair of sunspots we can see an emission of plasma alongside
magnetic field lines that originate in the sun spots A corona loop can extend into the coronaas the name suggests Those loops contain plasma that can reach a temperature higher than
106 Kelvin Corona loops can best be observed by ultra-violet and x-ray images because of
the high temperature The high temper ature brings on a high vibration of the atoms This
trembling causes the emission of x-rays51
Figure 9 A close up of corona loops
httpwwwdaviddarlinginfoencyclopediaCcoronal_loophtml
442 Where and when do corona loops originate
The magnetic field lines of sunspots move outwards from the sun into the corona and form
broad loops This makes it possible to trap hot gas with a temperature up to 40 million K
Those magnetic field loops trap hot plasma into the sunrsquos atmosphere The magnetic force
pushes particles around along the magnetic lines but at the same time the atoms circulate
around the magnetic field lines (see figure 10) The speed of their movements depends on the
50
ENCYCLODPEDIA OF SCIENCE Corona hole Internet (httpwwwdaviddarlinginfoencyclopediaC coronal_holehtml) (04042009)51 JANSSENS J Zon en aarde een unieke relatie Garant Antwerpen 2003 p 52-54
832019 Ew Afgewerkte Final
httpslidepdfcomreaderfullew-afgewerkte-final 2259
22
density of the magnetic field So if a particle moves from the top of a loop to the bottom it
will slow down just like in traffic jams Eventually it will reach the bottom but the bottom is
highly compressed (because the magnetic field lines converge at the bottom of the loops) so
that the particle will be shot back along the magnetic field line (see figure 10)
Figure 10 the movement of particles in corona loops
GD HOLMAN lsquoThe mysterious origins of solar flaresrsquo Scientific America April 2006 p24-29 volume 294number 4
Hence the particles will move up and down along the magnetic field lines Atoms that are
charged the same will cause electric currents (just like in a battery) These currents will
generate a new magnetic field and the old magnetic field in combination with the new one
will cause a high distortion in the magnetic field of the sun This is the moment when the
corona loop will transform into a solar flare
45 Solar flare52
451 What is a solar flare
A solar flare is a sudden powerful explosion in the solar atmosphere caused by a disruption
in the magnetic field of the sun Because of the disruption mass from the sun will be movedup and form a solar flare A solar flare can equal the energy of billions of atomic bombs
within a few minutes The strongest solar flares are measured during the solar maximums
because then the sunrsquos magnetic activity is the strongest53 Since the sunspots in the presence
of solar flare have a very high magnetic field it is likely that a solar flare would even have a
higher magnetic field But in reality the magnetic field of a solar flare is only half of the
magnetic field of a sunspot The intensity of the magnetic field is lsquoonlyrsquo 500 Gauss54
52 HOLMAN GD lsquoThe mysterious origins of solar flaresrsquo Scientific America April 2006 p 24-31 volume
294 number 453JANSSENS J Zon en aarde een unieke relatie Garant Antwerpen 2003 p 55-57
54 JANSSENS J lsquoZonnefakkelsrsquo Heelal Oktober 1994 p 256
832019 Ew Afgewerkte Final
httpslidepdfcomreaderfullew-afgewerkte-final 2359
23
Figure 11 You can see the magnetic fieldlines in the solar flare on the right side
Large solar flare recorded by SOHO EIT304 instrument 512x512 version Animation (980kMPEG) CourtesySOHO(ESAampNASA)
httpwwwteachersparadisecomencyenwikipediassusunhtml
452 Where and how do sun flares originate
Astronomers have long been speculating how solar flares exactly originate In 1992 Satoshi
Masuda (graduated at the University of Tokyo) discovered on pictures of the Japanese
Yohkoh Satellite that the far end of a solar flare emitted unusually short wavelengths very
short x-rays The source must be a concentration of gas with a temperature of about 100million K concluded Masuda But this discovery provoked some new questions why was the
high temperature at the top of the flare and not at the bottom where the gas is more compact
Why does the plasma stay confined instead of spreading out into the universe In order to
obtain more information to try to solve this problem astronomers started observing the sunrsquos
radiation of ultraviolet and x-rays frequently In 2002 NASA even launched the RHESSI
(Ramaty High Energy Solar Spectroscopic Imager) which was intended to bring solar flares
into pictures55
These observations provided evidence that sun flares surge up in regions where the magnetic
field is very strong ndashmost common in the presence of sun spots At this point we have to call
over the corona loops As mentioned before corona loops are electric currents of atoms
which move alongside magnetic field lines When the atoms are shot back alongside the
magnetic field line there seems to occur a distortion of the magnetic field This distortion will
end up in a solar flare All the mass of the corona loop will be shot into space and form a solar
flare
But how can such enormous mass of the solar flares be shot into s pace This has been a very
interesting question However Peter Alan Sweet (1921-2005)56 succeeded in finding an
55 GD HOLMAN lsquoThe mysterious origins of solar flaresrsquo Scientific America April 2006 p 27 volume 294
number 456UNIVERSITY OF GLASGOW Bibliography of Peter Sweet Internet (httpwwwuniversitystoryglaacuk
biographyid=WH2144amptype=P) (10042009)
832019 Ew Afgewerkte Final
httpslidepdfcomreaderfullew-afgewerkte-final 2459
24
answer already in 1956 If magnetic field lines break apart and then reconnect they bring
together two opposing fields that will cancel each other and cause a huge burst of energy The
reconnection will create new magnetic field lines This reconnection is called the Sweet-
Parker reconnection Yet this is a slow reconnection which cannot take place at the base of a
solar flare with a dazzling speed Fortunately Harry P Petschek published an article about
reconnection in 1964 and solved that problem under certain circumstances it is possible toreconnect much faster which explains solar flares This faster reconnection is also called the
Petschek reconnection But unfortunately with the current technology it is not yet possible to
take pictures of those reconnections57
If the energy comes from the reconnection then where does this reconnection take place
From pictures of solar flares astronomers discovered that at the top of the corona loop a
mysterious x-ray source was found The x-ray source began to give a higher energy level and
at the same time the particles move down towards the sunrsquos surface Yet the x-ray source
stays at the same placehellipThen when the x-rays reach their maximum the loop suddenly
changes direction But this time the x-ray source will move upwards too unexpectedly it
moves at the speed of light approximately three hundred thousands kilometres an hour awayfrom the sun This is the same speed as the coronal mass ejections
46 Coronal mass ejections
461 What is a coronal mass ejection58
Coronal mass ejections (CMErsquos) (appendix XVI) are huge amounts of gas some billions of
plasma from the sun that are ejected into space Their temperature can reach 25 million K59
A coronal mass ejection can last for several hours and it can at last enter the solar wind A
CME can reach a speed of 50kms- 2000kms which means more than 7 million kilometres
an hour60 The mass of a large CME varies from 5 x 10⁶ to 5 x 10¹³ kg61 During a solar
maximum there are more coronal mass ejections than during a minimum but they can occur
at any time of the solar cycle Coronal mass ejections are related both to solar flares and
prominences Very heavy coronal mass ejections can cause some geomagnetic storms on
earth
462 Reconnection
The reconnection of a solar flare can end up in a coronal mass ejection When magneticfield lines that are opposite are starting to reconnect and form new magnetic field lines half of
the magnetic field lines will point downwards and join some existing magnetic loops
However the other part of the magnetic field lines will move upwards at a very high speed
and will form some loops more upwards Between those loops that moved downwards and
those that moved upwards there is some mass that isnrsquot connected to the sun anymore It is
57GD HOLMAN lsquoThe mysterious origins of solar flaresrsquo Scientific America April 2006 p 29 volume 294
number 458
BRAEUNIG R A Glossary Internet (httpwwwbraeunigusspaceglossaryhtm) 200659 LILENSTEN J and BORNAREL J Sous les feux du soleil EDP Sciences Les Ulis Cedex A 2001 p 4460 Cuypers J and others lsquoLa rechercheacute en heacuteliophysique en Belgiquersquo Space connection October 2007 p 10-
1161GREEN SF and JONES M H An introduction to the Sun and Stars The Open University Cambridge
2004 p 68
832019 Ew Afgewerkte Final
httpslidepdfcomreaderfullew-afgewerkte-final 2559
25
known that for an amount of solar flares that this mass between the loops will end up in a
coronal mass ejection Yet this doesnrsquot count for all the solar flares The coronal mass
ejection only takes place if the magnetic field lines twist around each other while forming the
letter lsquoSrsquo (see figure 12)62
Figure 12 Here you can see the reconnection that takes place before the coronal mass ejection starts
httpwwwnasagovmission_pagessolar-bsolar_005html
Certainly we will be capable to answer all the questions about solar flares and coronal mass
ejections in the nearby future But there are also some very interesting questions left what is
at the basis of the acceleration of the atoms in solar flares How does magnetic reconnection
originate Hopefully we will find the answers in the near future
47 Solar wind
471 What is the solar wind
Every second of every day of the year the sunrsquos corona emits a continuous stream of mass
from the sun The temperature of the corona is so high that the sunrsquos magnetic field just
cannot control the outflow of particles We know that the particles are accelerated but
astronomers cannot explain all the details about the solar wind yet
472 What do we know about the solar wind
The speed of the solar wind can change it differs from 300kmh up to 800kmh This speed
depends on the outflow of gases If there is a corona hole pointing towards the earth the solar
wind will reach a speed of around 800kmh The different speeds can interact with each other
and form a new speed according to the rules of light emission When two emissions connect
with each other they can form a faster or slower solar wind just like waves can interact and
form new waves
62BOEN B Birth of a coronal mass ejection Internet (httpwwwnasagovmission_pagessolar-b
solar_005html) 290408
832019 Ew Afgewerkte Final
httpslidepdfcomreaderfullew-afgewerkte-final 2659
26
The ionized atoms with very high temperature coming from the sunrsquos corona are one of the
most important parts of the solar wind but the magnetic fields are important too The
magnetic field outside the sun gets wrapped into a spiral called the Parker-spiral named after
the scientist who described it as the first one (because the sun rotates) This influences the
magnetic field of the sun from the outside The solar wind is emitted in spiral too (see figure
13)
Figure 13 The course of the solar wind caused by the rotation of the sun
httpheliosgsfcnasagovsolarmaghtml
473 Heliosphere
We can describe the heliosphere as a gigantic magnetic bubble around the sun This is
everywhere in space till where the sunrsquos magnetic field reaches and still has an influence The
heliosphere is filled with solar wind although the solar wind has a very low density Yet it
is a very hot wind but because of the very low density it does not have such a great influence
on earth However it can cause some energetic storms on earth63
63 NASA The heliosphere Internet (httpheliosgsfcnasagovheliosphhtml) 20012009
832019 Ew Afgewerkte Final
httpslidepdfcomreaderfullew-afgewerkte-final 2759
27
Conclusion
The sunrsquos magnetic field is a complex system to understand Yet I hope you have learned a
lot from this paper and that you do understand the exiting phenomena described in the
previous chapters
We can discuss the sunrsquos magnetic field from two perspectives The first one is looking at the
magnetic field for global long-term changing dimensions The second way is based on
phenomena on lower scale
The global changes involve the solar cycle and the switch of the magnetic poles The solar
cycle is divided into a decrease of the solar activity until it reaches solar minimum and an
increase of the solar activity until it reaches solar maximum The frequency of the phenomena
that can be found in the outer layers of the sun are directly connected to the solar activity and
thus to the solar cycle Sunspots are the easiest to see they appear as black spots against the
much brighter surface of the sun Corona loops are connected to sunspots and can extend into
solar flares and solar prominences These flares and prominences can burst out into a coronalmass ejection All these phenomena influence the sun and its solar wind how small their part
may be The solar wind has a directly influence on the earth
There is still much to be discovered Astronomers hope to discover much more about the
magnetic field of the sun Today many astronomers and scientists are observing the sun and
every day they discover more and more aspects of the sun Recently a group of researchers
led by David Jess of Queens University Belfast has revealed why the sunrsquos atmosphere is
hotter than its surface64 As you can see astronomy is a very developing science
64
CORDIS Researchers reveal why Suns atmosphere is hotter than its surface Internet (httpcordiseuropaeusearchindexcfmfuseaction=newsdocumentampN_LANG=ENampN_RCN=30598amppid=0ampq=87F36474805A6BEC0B89404F72D0351Famptype=sim) 20032009
832019 Ew Afgewerkte Final
httpslidepdfcomreaderfullew-afgewerkte-final 2859
28
Glossary
Absorption lines A dark line superimposed on a continuous spectrum when a gas absorbs
light from a continuous source that is hotter than the absorbing gas
Aurora Light radiated by atoms and ions formed by the solar wind in the earthrsquos upper atmosphere seen most commonly in the polar regions
Chromosphere The layer in the solar atmosphere between the photosphere and the corona It
is the lowest layer of the atmosphere characterized by reddish hue and by an increase of the
temperature with altitude through all but its lower regions
Convection The transfer of heat from a region of high temperature to a region of lower
temperature by the displacement of the cooler molecules by the warmer molecules The hot
gas will be moved upwards the cool gas will be pushed downwards into the sun
Corona The sunrsquos outer atmosphere It is very extensive and has a very low density It isextremely hot
Coronal hole A dark region of the sunrsquos inner corona as seen at X-ray wavelengths
Coronal loop Closed loops of magnetic field lines extending from the sunrsquos photosphere into
the corona which contain plasma at high temperature They are typically observed through
ultraviolet or x-ray emission from the hot plasma
Coronal mass ejection Large volumes of high energy gas released from the sunrsquos corona
Differential rotation The rotation of a non rigid object in which parts at different latitudes or
different radial distances move at different speeds
Dynamo theory The generation of a magnetic field by circulating electric charges
Eclipse The blocking of a part or all of the light from the moon by the earth (lunar eclipse) or
from the sun by the moon (solar eclipse)
Emission lines Emission lines are used in physics chemistry and astronomy to determine
what kind of gas is doing the emission Every element has a different electronic structure and
will thus have a different emission line fingerprint Emission lines are produced whenelectrons in atoms jump from one energy level to lower energy level
Filament A dark curve seen above the sunrsquos photosphere that is the top view of a solar
prominence
Flux tube Is a generally tube-like (cylindrical) region of space containing a magnetic field
such that the field at the side surfaces is parallel to them Both the cross-sectional area of the
tube and the field contained may vary along the length of the tube but the magnetic flux is
always constant
832019 Ew Afgewerkte Final
httpslidepdfcomreaderfullew-afgewerkte-final 2959
29
Geomagnetic storm When unusually strong surges of solar wind (charged particles from the
Sun) hit the Earth This effect causes variations in the magnetic field which surrounds the
Earth The visible results are eg the aurora (Northern and Southern lights)
Granulation Granules are related to the convective zone The granulation that shows up in the
photosphere is a result of the rising and falling of hot gas that takes place in the convectivezone
Hα absorption line An absorption line due to an electronic transition in hydrogen atoms in
which the atom absorbs a photon so that the electron makes a transition from a state
corresponding to the electronic energy level with n=2 to the one above with n=3 The photon
wavelength in a vacuum is 6563 nm
Heliosphere The volume of space within which the sun through the solar wind influences its
environment in the interstellar medium
Magnetic dynamo A theory that explains phenomena of the solar cycle as a result of periodicwinding and unwinding of the sunrsquos magnetic field in the solar atmosphere
Magnetic reconnection A process taking place in a plasma in which neighbouring
oppositely directed magnetic field lines suddenly part and reconnect in a new configuration
The abrupt change in a magnetic field represented by this process can release large amounts
of energy and it is thought to be important in explaining solar flares and other phenomena
Penumbra The portion of a shadow in which only part of the light source is covered by the
shadow-making body
Photosphere The region in the solar atmosphere from which most of the visible light escapes
into space
Plasma A fourth state of matter (not found naturally on Earth) of very hot gases Plasma is a
fluid with the ability to carry electric currents with no local accumulations of electric charge
Prominence Flamelike protrusion seen near the limb of the sun and extending into the solar
corona The side view of a filament
Quantum theory A theory in physics based on the principle that matter and energy have the
properties of both particles and waves created to explain the radiation of energy from a blackbody the photoelectric effect and the Bohr theory and now used to account for a wide
range of physical phenomena including the existence of discrete packets of energy and
matter the uncertainty principle and the exclusion principle Itrsquos a theory of the interaction of
matter and radiation developed early in the twentieth century which is based on the
quantization of energy and applied to a wide variety of processes that involve an exchange of
energy at the atomic level
Reconnection See magnetic reconnection
Solar cycle A 22-year-cycle during which the sunrsquos magnetic field reverses its polarity twice
Solar flare A violent eruption on the sunrsquos surface
832019 Ew Afgewerkte Final
httpslidepdfcomreaderfullew-afgewerkte-final 3059
30
Solar wind An outward flow of particles (mostly electrons and protons) from the sun
Solstice Either of two points along the ecliptic at which the Sun reaches its maximum
distance north or south of the celestial equator
Spectroscopy Concerns the production and study of spectra
Spectrum The result of electromagnetic radiation passing through a prism or grating so that
different wavelengths are separated
Spicule Short-lived (lifetime from rising to falling is about 15 minutes) jets vertical to the
solar surface that are several thousand kilometres long and about 1 kilometre thick (see also
appendix IV) in the solar chromosphere
Sunspot A temporary cool region in the solar photosphere created by protruding magnetic
fields
Umbra The central completely dark portion of a shadow
Zeemaneffect A splitting of spectra lines in the presence of a magnetic field
Bibliography and webography of the glossary
COMINS NF and KAUFMANN III WJ Discovering the universe eighth edition WH
Freeman and Company New York 2008 535 p
GREEN SF and JONES M H An introduction to the Sun and Stars The Open University
Cambridge 2004 373 p
httpenmimihuastronomygranulationhtml
httpenmimihuastronomyplasmahtml
httpwwwspacecomspacewatchspace_weather_glossaryhtml
httpenmimihuastronomyemission_linehtml
httpenmimihuastronomyabsorption_linehtml
httpwwwpbsorgfaithandreasonphysglossqm-bodyhtml
httpwwwanswerscomtopicquantum-theory
httpenwikipediaorgwikiFlux_tube
832019 Ew Afgewerkte Final
httpslidepdfcomreaderfullew-afgewerkte-final 3159
31
Appendix I The sun in figures
Physical quantity Comment
Radius 695 510 km 109 x earths radius
Mass 1989 x1030 kg 332 946 earths mass
Mass sun in the solar
system
9986 Total mass sun total mass of
our solar system
Volume 1412 x10sup3sup3 cmsup3 13 million x earths volume
Age 455 milliard years
Luminosity 3854 x 10sup3sup3 ergss
Magnitude -2773
Density center 1513 gcmsup3
Density mean 1409 gcmsup3
Pressure center 2334 x1011 bars
Pressure photosphere 00001 bar
Temperature center 15 557 000deg K
Temperature photosphere 5 780deg K Various sources mention
different grades
Temperature corona 2 000 000 to 3 000 000deg K
Rotation time at North or
South pole
up to 35 days on earth
Rotation time at Equator 25 days on earth The difference in rotation
times is called differential
rotation
Rotation time general 2538 days on earth
Mean distance sun-earth
(AU)
14959787 x108 km 1 AU = 1 Astronomical Unit
= 149 598 000 km
Chemical composition of
the sun ( of total number
of atoms)
Hydrogen 921
Helium 78
All others 01
Various sources mention
slightly different percentages
832019 Ew Afgewerkte Final
httpslidepdfcomreaderfullew-afgewerkte-final 3259
32
Chemical composition of
the sun ( of total mass)
Hydrogen 7346
Helium 2485
All others 169
Various sources mention
slightly different percentages
Total transforming of
hydrogen into helium persecond
700 billions of kilograms of
hydrogen are transformedinto 6957 billions of
kilograms of helium each
second
Based on the following references
- BEATTY JK PETERSEN CC and CHAIKIN A The new solar system fourth edition
Cambridge University Press Cambridge 1999 p 421
- LILENSTEN J and BORNAREL J Sous les feux du soleil EDP Sciences Les Ulis
Cedex A 2001 p 247
- LANG KR Sun earth and sky Springer Germany 1995 p 282- DENTHIER T Het zonnestelsel Standaard Uitgeverij 1992 p 415
- JANSSENS J Zon en aarde een unieke relatie Garant Antwerpen 2003 p 254- VOLKSSTERRENWACHT URANIA VZW De zon Internet(httpwwwuraniabesterrenkundezonnestelselzonphp) (01012009)
832019 Ew Afgewerkte Final
httpslidepdfcomreaderfullew-afgewerkte-final 3359
33
Appendix II Anatomy of the sun
httpwwwcosmographicacomgalleryinfographicssolar_anatomyhtml
The middle the sun consists of a heavy core this consists of plasma just as the outer layers
of the sun but the pressure in the core is so high that it behaves much more like a solid bodyThe most outer layer is the corona it reaches far into space More to the inside there is the
chromosphere and then the photosphere The corona the chromosphere and the
photosphere are explained in chapter 1
832019 Ew Afgewerkte Final
httpslidepdfcomreaderfullew-afgewerkte-final 3459
34
Appendix III Granulation
httpwwwwindowsucaredutourlink=sunSolar_interiorsolar_furnacehtml
At the surface of the sun we can find granules These are created by convection the warmest
parts of the sunrsquos interior move upwards and the colder parts at the surface move downwardsThis causes currents of plasma The dark lines are the colder particles We see them darker
because they emit less light than their surrounding neighbourhood
832019 Ew Afgewerkte Final
httpslidepdfcomreaderfullew-afgewerkte-final 3559
35
Appendix IV Spicules
Picture httplpc1clpccdcccauslpcharpellastro20a20deinfo_s09htmInformation httpwwwdaviddarlinginfoencyclopediaSspiculehtml
On this picture you can see spicules Spicules only last for several minutes and can be foundin the chromosphere They are little jets of gas There also exist macrospicules that can be
approximately ten times larger than a normal spicule
832019 Ew Afgewerkte Final
httpslidepdfcomreaderfullew-afgewerkte-final 3659
36
Appendix V The most important satellites observing the sun
Here you can find the most important satellites observing the sun and their missions
Solar and Heliospheric Obseratory (SOHO)
httpsohowwwnascomnasagovaboutabouthtml
SOHO the Solar amp Heliospheric Observatory is a project of international collaboration
between ESA and NASA to study the Sun from its deep core to the outer corona and the solar
wind
SOHO was launched on December 2 1995 The SOHO spacecraft was built in Europe by an
industry team led by prime contractor Matra Marconi Space (now EADS Astrium) under
overall management by ESA The twelve instruments on board SOHO were provided by
European and American scientists Nine of the international instrument consortia are led by
European Principal Investigators (PIs) three by PIs from the US Large engineering teamsand more than 200 co-investigators from many institutions supported the PIs in the
development of the instruments and in the preparation of their operations and data analysis
NASA was responsible for the launch and is now responsible for mission operations Large
radio dishes around the world which form NASAs Deep Space Network are used for data
downlink and commanding Mission control is based at Goddard Space Flight Center in
Maryland
More information about SOHO can be found on
httpsohowwwnascomnasagovaboutdocsSOHO_Fact_Sheetpdf
832019 Ew Afgewerkte Final
httpslidepdfcomreaderfullew-afgewerkte-final 3759
37
Transition Region and Coronal Explorer (TRACE)
httptracelmsalcomProjectMissionmissionhtm
TRACE enables solar physicists to study the connections between fine-scale magnetic fields
and the associated plasma structures on the Sun in a quantitative way by observing the photosphere the transition region and the corona With TRACE these temperature domains
are observed nearly simultaneously (with as little delay as only a second between different
wavelengths) with a spatial resolution of one second of arc
This is accomplished by obtaining precisely coaligned image sequences of photosphere
transition region and corona with high spatial resolution and uninterrupted viewing of the
Sun for up to eight months
TRACE Mission
TRACE explores the magnetic field in the solar atmosphere by studyingbull The 3-dimensional field structure
bull Its temporal evolution in response to photospheric flows
bull The time-dependent coronal fine structure
bull The coronal and transition region thermal topology
TRACE was launched on a Pegasus launch vehicle from Vandenberg Air Force Base in April
1998 The launch was scheduled to allow joint observations with SOHO during the rising
phase of the solar cycle to sunspot maximum No transition region or coronal imager has
witnessed the onset and rise of a solar cycle
Pegasus in flight
The two satellites provide complementary observations TRACE produces the high spatial
and temporal resolution images while SoHO yields images and spectral data out to 30 solar
radii at much lower spatial and temporal resolution Jointly they provide the opportunity to
obtain simultaneous digital measurements of all the temperature regimes of the solar
atmosphere in both high-resolution imaging and spectroscopy
With these data we expect to shatter the current ignorance of coronal heating and impulsive
MHD phenomena with benefits not only to solar physics but also to studies ranging from
stellar activity to the MHD of accretion disks The magnetograms produced by MDI on SoHO
provide a complete record of the eruption and distribution of photosphere magnetic fields
which will be invaluable for understanding TRACE observations of coronal hole formation
and coronal mass ejections Both of these phenomena have profound effects on our space
environment and the Earth`s magnetic field
TRACE is the first US solar research satellite since the Solar Maximum Mission
Coordination with SOHO provides an unprecedented opportunity to follow the emergence of
magnetic flux from the base of the convection zone deep inside the Sun through the
photosphere chromosphere and transitional region to the low-beta outer corona while
observing the effects of this emergence such as coronal mass ejections with high spatial andtemporal resolution
832019 Ew Afgewerkte Final
httpslidepdfcomreaderfullew-afgewerkte-final 3859
38
The transition from the photosphere where magnetic fields and plasma are in rough
equipartition to the corona where magnetic fields dominate is extremely difficult to model
and until recently to observe at high temporal and spatial resolution Many of the physical
problems that arise here such as plasma confinement reconnection wave propagation and plasma heating arise throughout space physics and astrophysics The detailed study of these
processed in the solar outer atmosphere is invaluable to astrophysics in general and stellar
studies in particular
More information about TRACE observations can be found on
httptracelmsalcomOperationsGeneraloperatiohtm
832019 Ew Afgewerkte Final
httpslidepdfcomreaderfullew-afgewerkte-final 3959
39
Reuven Ramaty High Energy Solar Spectroscopic Imager (RHESSI)
httphesperiagsfcnasagovhessibrochurehtm
What Questions will HESSI Address
bull How is such a large amount of energy released so rapidly during a flare
bull How are so many electrons and protons accelerated so quickly to such high energies
bull Where are the electrons and protons accelerated in the solar atmosphere and where do
they deposit their energy
How will HESSI Address these Questions
HESSI shown below will concentrate on electrons and protons accelerated in solar flares
through observations of the X-rays and gamma rays that they produce
bull HESSI will obtain the first ever X-ray and gamma-ray images of flares from 100 keV
to 20 MeVbull HESSI will do the first ever nuclear gamma-ray line spectroscopy of solar flares
bull HESSI will obtain pictures of flares in X-rays with an angular resolution of 2
arcseconds a factor of three better than previously possible
bull HESSI will measure X-ray and gamma-ray spectra with less than 1 keV energy
resolution a factor of 20-40 better than previously possible with scintillation counters
More information about the RHESSIrsquos Mission can be found on
httphesperiagsfcnasagovhessiconcepthtm
832019 Ew Afgewerkte Final
httpslidepdfcomreaderfullew-afgewerkte-final 4059
40
Solar Radiation and Climate Experiment (SORCE)
httplaspcoloradoedusorcesciencebackgroundhtm
The Solar Radiation and Climate Experiment (SORCE) is a NASA-sponsored satellite
mission that is providing state-of-the-art measurements of incoming x-ray ultraviolet visiblenear-infrared and total solar radiation The measurements provided by SORCE specifically
address long-term climate change natural variability and enhanced climate prediction and
atmospheric ozone and UV-B radiation These measurements are critical to studies of the Sun
its effect on our Earth system and its influence on humankind
The SORCE spacecraft was launched on January 25 2003 on a Pegasus XL launch vehicle to
provide NASAs Earth Science Enterprise (ESE) with precise measurements of solar
radiation It launched into a 645 km 40 degree orbit and is operated by the Laboratory for
Atmospheric and Space Physics (LASP) at the University of Colorado (CU) in Boulder
Colorado USA It will continue the precise measurements of total solar irradiance (TSI) that
began with the ERB instrument in 1979 and has continued to the present with the ACRIM series of measurements SORCE will also provide the measurements of the solar spectral
irradiance from 1nm to 2000nm accounting for 95 of the spectral contribution to TSI
SORCE carries four instruments including the Spectral Irradiance Monitor (SIM) Solar
Stellar Irradiance Comparison Experiment (SOLSTICE) Total Irradiance Monitor (TIM) and
the XUV Photometer System (XPS)
The primary goal of the NASA Earth Observing Systems (EOS) SOlar Radiation and Climate
Experiment (SORCE) is to enable solar-terrestrial studies by providing precise daily
measurements of the total solar irradiance (TSI) and the solar spectral irradiance atwavelengths extending from the ultraviolet to the near infrared The following lists the
SORCE science objectives
1 Make accurate measurements with high precision of total solar irradiance connect
them to previous TSI measurements and continue this long-term climate record
Provide TSI with an accuracy of 001 (100 parts per million) based on SI units and
with a long-term repeatability of 0001yr
2 Make daily measurements of the solar ultraviolet irradiance from 120 to 300 nm with
a spectral resolution of 1 nm Achieve this spectral irradiance measurement with an
accuracy of better than 5 and with a long-term repeatability of 05yr Use the
solarstellar comparison technique to relate the solar irradiance to the ensembleaverage flux from a number of bright early-type stars (same stars used by the UARS
SOLSTICE program)
3 Make the first measurements of the visible and near IR solar irradiance with sufficient
precision for future climate studies Obtain daily measurements of solar spectral
irradiance between 03 and 2 microm with a spectral resolution of at least 130 an
accuracy of 003 and a long-term repeatability of better than 001yr
4 Improve the understanding of how and why solar irradiance varies estimate past and
future solar behavior and investigate climate responses
More information about SORCE can be found on
httplaspcoloradoedusorcesciencescience_opshtm
832019 Ew Afgewerkte Final
httpslidepdfcomreaderfullew-afgewerkte-final 4159
41
Appendix VI Wavelengths
httpeosweblarcnasagovEDDOCSWavelengths_for_Colorshtml
As you can see on the figure visible light situates in the centre of the wavelengths having not
the shortest nor the longest wavelengths Gamma rays have the shortest wavelength radioways the longest All sort of wavelengths are used for daily purpose like radio waves for
radio and TV and gamma rays for treatments
832019 Ew Afgewerkte Final
httpslidepdfcomreaderfullew-afgewerkte-final 4259
42
Appendix VII Absorption lines in the sunrsquos spectrum
Picture httpwwwsolarnavigatornetthe_sunhtmExplanation COMINS NF and KAUFMANN III WJ Discovering the universe eighth edition WHFreeman and Company New York 2008 p 109
This photo is called a spectrogram It contains the spectrum of the sun All the black lines are
absorption lines The amount of black lines is related to the amount of elements that the sun
is emitting From a spectrogram we can deduct a lot of things including their mass the
temperature of the surface the chemical composition of the sun rotation rates and much
more
832019 Ew Afgewerkte Final
httpslidepdfcomreaderfullew-afgewerkte-final 4359
832019 Ew Afgewerkte Final
httpslidepdfcomreaderfullew-afgewerkte-final 4459
44
Appendix IX Butterfly-diagram
httpspacesciencespacerefcomsslpadsolarimagesbflygif
A butterfly-diagram
In a butterfly-diagram we can find the sunspots with their latitude (y-axis) through the years(x-axis) As you can see the sunspots appear like lsquobutterfliesrsquo this was discovered in 1904 by
Edward Maunder (1851-1928 an English astronomer best remembered for his study of
sunspots and the solar magnetic cycle) Thatrsquos why this graph is also called Maunders
butterfly diagram
832019 Ew Afgewerkte Final
httpslidepdfcomreaderfullew-afgewerkte-final 4559
45
Appendix X The Wolf-numbers
httpsidcomabenews106sunspotnumberclarifiedpdf
The sunspot number clarified By Petra Vanlommel
Which kinds of daily International Sunspot Numbers (ISN) are currentlypublished by the SIDC
Three daily indices are currently published by the SIDCthe Estimated ISN (EISN)the Provisional ISN (PISN)the Definitive ISN (DISN)Although they are all based on the same type of observations ie visual sunspot counts as ameasure of solar activity they are obtained from different data sets by different processingmethods with different accuracies and they serve different purposes
In the ideal case the three numbers are equal but in practice it is inevitable that there aresmall differences Therefore It is useful to explain what each index actually means
What is the source of the Wolf number
Once per day observers worldwide communicate their measured Wolf number (= 10G + S)based on visual sunspot (S) and group (G) counts to the World Data Center for the SunspotIndex Presently this is done through a dedicated password-protected WEB form the Wolfinterface However some observers still use the old way of reporting their observations onpaper through regular mail This method slows down the final processing but for the sake ofcontinuity in the index it is important to keep these observers included as some of them
represent the longest individual datasetsThe observers give the exact observing time the observing conditions the total numbers(group count sunspot count and Wolf number) and optionally the NorthSouth and centralzone numbers The observers using the web interface can provide their results to the SIDCimmediately after each observation However some users prefer to insert their data as ablock creating some delay but this must be done at least once a month
The personal reduction coefficient K
A personal reduction coefficient K is calculated for each station It has values typically in therange 04 and 17 and leads to a normalized sunspot number K(10G+S) In other words theK factor rescales the raw sunspot counts of each observer to the ones of Rudolph Wolf the
astronomer who introduced the above Wolf formula thus simulating the same eyes sametelescope and same conditionsDuring the procedure for calculating the Provisional ISN the K factor of every station iscomputed for every observation that passes the elimination procedure Once a year apersonal K factor for every station and for every month of the previous year is calculated Ayearly mean K value per station is also computed
The estimated sunspot index
The Estimated ISN (EISN) is calculated and issued on a daily basis for the day of calculationand the day before Only the total EISN is calculated with no hemispheric index It is anautomated procedure and no manual intervention is done The EISN is meant as a quicktemporary and approximate index for real-time applications
832019 Ew Afgewerkte Final
httpslidepdfcomreaderfullew-afgewerkte-final 4659
46
We use the raw Wolf number from all observatories that have provided counts early in theday ie before 1230 UT Typically there is between 10 and 20 stations available Thecalculation of the EISN is based on a simple and straightforward statistical method The Wolfnumbers are multiplied with the yearly mean K factor (see paragraph about the personalreduction coefficient K) The EISN is a simple average of the K-scaled values after excludingany individual value that deviates abnormally from the other valuesOnce the Provisional ISN (PISN) is calculated after the end of a month the temporary EISNis dropped and replaced by the PISN
The provisional sunspot Index
The Provisional ISN (PISN) is calculated and issued on the first of every month Theoutcome is a daily total and hemispheric sunspot number for the entire elapsed month Anexample on the first of September we calculate the daily PISN for each day of August ThePISN is computed semi-automatically with as little manual intervention as possibleTo calculate the PISN values for the concerned month we use all Wolf numbers Typicallythere is data from around 65 stations available
The calculation of the PISN is based on an extensive statistical treatment This treatmentfilters out any abnormal daily observation or the complete data set from an erratic station(quality control) This prevents long-term drifts in the resulting index One of the key elementsderived from this processing is to update the K reduction coefficients for each station theevolution of each station is monitored for each day relative to the entire networkA subset of the contributing stations also provides hemispheric counts A similar process isapplied to the North and South counts to derive the hemispheric PISN There is an additionalconstraint the sum of the North and South ISN must match the total ISNThe PISN replaces the EISN And once the Definitive ISN (DISN) is calculated the DISNreplaces the PISN
The definitive sunspot index
The Definitive ISN is calculated and issued on a quarterly basis when we have collecteddata from all the contributing observatories This is the final index and it is appended to thehistorical sunspot index time series The same semi-automated treatment as for the PISN isnow applied to the full data set If the result agrees within 5 of the PISN value the PISN iskept and becomes definitive Otherwise the new calculated value replaces the PISN andbecomes the definitive ISNIt is only at this stage and only in peculiar situations that a manual verification by ourscientific staff is required For example this happens when the observed raw Wolf valuesfrom the whole network are clustered around two distinct values This special case can becaused by small short-lived isolated sunspots (lifetimes lt 24 hours) or by the appearance ordisappearance of a large group at the solar limb in the course of one UT dayThe DISN replaces the provisional and estimated International Sunspot Number
Handling very low activity levels
One of the situations requiring a human arbitration is associated with single small isolatedand short-lived sunspots This is most noticeable around the minimum of the solar activitycycle like the one occurring now in 2008 Due to the 24hour binning (observations aregrouped between 0hUT and 24hUT) and the variable ability of each observer to detect thesmallest sunspots we end up with some stations reporting one sunspot and others who didno see any sunspot Let us explain further No sunspot may mean that the sunspot waspresent but the observer was unable to see it because of poor observational conditions such
as weather a small telescope On the other hand it may also indicate that the sunspot hadactually vanished by that time while it was present earlier on the same day
832019 Ew Afgewerkte Final
httpslidepdfcomreaderfullew-afgewerkte-final 4759
47
Individual stations do not observe at exactly the same timeIn order to validate the existence of such a marginal reported sunspot a qualified SIDCscientist must then check the detailed chronology within that day and consider the overallobserver capability (value of K coefficient)In common practice the fact that a sunspot is reported by a significant group of observersleads to the inclusion of the sunspot on that date thus neglecting the no-sunspotobservationsThe rationale is multiple observations of a sunspot exclude the possibility that the reportedsunspot was an independent false detection So a sunspot was really present on that dayalthough it may have existed only for part of the day or it was small enough to be missed bypart of the observers with smaller instruments or imperfect atmospheric conditionsAlso keep in mind that the sunspot index is derived with a limited precision just like any otherindex If the monthly mean sunspot number is 0 or 05 you can definitely say that activitywas low
What index should be used
If you want to perform long-term investigations the definitive ISN series is definitely the mostsuitable However there is a delay of a few months So when investigating the last cycle andrecent evolution use the definitive numbers in combination with the provisional ISN to be upto date to the last month The provisional numbers are also used in models forecasting thesunspot number for the coming months Now if you need a proxy for solar activity in a modelthat runs in real-time then you may use the estimated ISNImprovements and rethinking of the processing method is an ongoing project We arecurrently developing an alternative program for calculating the PISN Of course long-termconsistency is vital Therefore a cross-analysis between the output from the old and newsoftware must be applied over an extended period
832019 Ew Afgewerkte Final
httpslidepdfcomreaderfullew-afgewerkte-final 4859
48
Above graphs show different kinds of the International Sunspot Number The left plot gives an overview from 1700 up to now from the yearly (black) and monthly smoothed Sunspot Number The graph in the right top corner shows the monthly and monthly smoothed sunspot number while the graph in the right bottom corner show the daily monthly smoothed monthly sunspot number For every the time range of investigation there is an appropriate sunspot number
832019 Ew Afgewerkte Final
httpslidepdfcomreaderfullew-afgewerkte-final 4959
49
Appendix XI Filaments and prominences
httpsohowwwnascomnasagovpickoftheweekold26feb2004
This is a picture taken by SOHO on 26 February 2004
832019 Ew Afgewerkte Final
httpslidepdfcomreaderfullew-afgewerkte-final 5059
50
Appendix XII The reconnection of magnetic loops
httpwwwioporgEJarticle0004-637X558287253575webpdfrequest-id=73e38daa-69ae-4e01-b9a6- b4bd0ba071dd
In (a) sunspot B and C have different polarity and move towards each other The twomagnetic loops will reconnect and form one big magnetic loop showed in (b) This will
happen to other magnetic loops too as can be seen in (c) When G en F are close enough they
will reconnect and so E en H will reconnect too It is possible that the magnetic field line is
trapped around another in this case AD The mass ejected from the sun will be trapped
between the magnetic field lines and form a solar prominence
832019 Ew Afgewerkte Final
httpslidepdfcomreaderfullew-afgewerkte-final 5159
832019 Ew Afgewerkte Final
httpslidepdfcomreaderfullew-afgewerkte-final 5259
52
httptheinvisibleagentwordpresscom20090117amazing-celestial-images
An group of active prominences
httpapodnasagovapodap051109html
httpwhassupinthemilkywayblogspotcom200903cloudy-planhtml
A picture taken by SOHO In the left corner you can see the prominence with twisted
magnetic field lines
832019 Ew Afgewerkte Final
httpslidepdfcomreaderfullew-afgewerkte-final 5359
53
Appendix XIV Polar crown
httpsciencenasagovheadlinesy200817sep_polarcrownhtm
Photograph of a polar crown taken on 13 June 1999 by the Meudon Observatory
832019 Ew Afgewerkte Final
httpslidepdfcomreaderfullew-afgewerkte-final 5459
54
Appendix XV Coronal holes
httpsunearthdaynasagov2007multimediagal_020php
The black segment is a huge coronal hole The bright parts are x-rays from sunspots
832019 Ew Afgewerkte Final
httpslidepdfcomreaderfullew-afgewerkte-final 5559
55
Appendix XVI Coronal mass ejection
httpzuserver2staruclacuk~idhapodap000309html
Picture of a CME taken by SOHO in February 2000
832019 Ew Afgewerkte Final
httpslidepdfcomreaderfullew-afgewerkte-final 5659
56
Bibliography
Books
BEATTY JK PETERSEN CC and CHAIKIN A The new solar system fourth edition
Cambridge University Press Cambridge 1999 421 p
COMINS NF and KAUFMANN III WJ Discovering the universe eighth edition WH
Freeman and Company New York 2008 535 p
DETHIER T Het zonnestelsel Standaard Uitgeverij 1992 415 p
GOLUB L and PASACHOFF JM Nearest star the surprising science of our sun Harvard
university press Harvard 2001 267 p
GREEN SF and JONES M H An introduction to the Sun and Stars The Open University
Cambridge 2004 373 p
HILL S and CARLOWITZ M The sun Abrams New York 2006 239 p
HOLMAN GD lsquoThe mysterious origins of solar flaresrsquo Scientific America April 2006 p
24-31 volume 294 number 4
JANSSENS J Zon en aarde een unieke relatie Garant Antwerpen 2003 254 p
KELLER H-U Van Supernovarsquos tot zwarte gaten Tirion Natuur AH Baarn 2003 169 p
LANG KR Sun earth and sky Springer Germany 1995 282 p
LILENSTEN J and BORNAREL J Sous les feux du soleil EDP Sciences Les Ulis Cedex
A 2001 247 p
832019 Ew Afgewerkte Final
httpslidepdfcomreaderfullew-afgewerkte-final 5759
57
Articles
CUYPERS J and others lsquoLa rechercheacute en heacuteliophysique en Belgiquersquo Space connection
October 2007 20 p
DE KEYSER J lsquoDe magnetopauzersquo Heelal maart 1998 p 66-73
JANSSENS J lsquoHet maximum van de 23ste zonnevlekkencyclus (I)rsquo Heelal Oktober 1998 p
256-263
JANSSENS J lsquohet maximum van de 23ste zonnenvlekkencyclus (II)rsquo Heelal November
1998 p 284-290
JANSSENS J lsquoZonnefakkelsrsquo Heelal Oktober 1994 p 256-261
SMITS F lsquoDe coronarsquo Heelal Februari 1999 p 40-42
SMITS F lsquoProtuberanzenrsquo Heelal Juli 1991 p 182-185
VAN DEN BERGHE S lsquoHet Zeemaneffectrsquo Heelal September 1998 p 228-231
832019 Ew Afgewerkte Final
httpslidepdfcomreaderfullew-afgewerkte-final 5859
58
Webography
BOEN B Birth of a coronal mass ejection Internet
(httpwwwnasagovmission_pagessolar-b solar_005html) 290408
BRAEUNIG R A Glossary Internet (httpwwwbraeunigusspaceglossaryhtm) 2006
CORDIS Researchers reveal why Suns atmosphere is hotter than its surface Internet
(httpcordiseuropaeusearchindexcfmfuseaction=newsdocumentampN_LANG=ENampN_R
CN=30598amppid=0ampq=87F36474805A6BEC0B89404F72D0351Famptype=sim) 20032009
DAY C Alfveacuten waves may heat the Sunrsquos corona Internet
(httpblogsphysicstodayorgupdate200903 alfven-waves-may-heat-the-sunshtml)
310309
ELLERMAN F Solar prominences Internet (httparticlesadsabsharvardedufull
1928ASPL173E 0000074000html) (03042009)
ENCYCLODPEDIA OF SCIENCE Corona hole Internet
(httpwwwdaviddarlinginfoencyclopediaC coronal_holehtml) (04042009)
HATHAWAY D H The sunspot cycle Internet
(httpspacesciencespacerefcomsslpadsolarsunspots htm) 04012000
JANSSENS J The case of the missing solar cycle (published in lsquoheelalrsquo January 2008)
Internet (httpuserstelenetbejjanssensMSCwebEngpdf)
KNISELY D Solar prominences Internet
(httpwwwicstarscomHTMLSolarSectionHAlphaOBSERVINGTHESUNHAlpha3html)
(03042009)
KOPANSKI J Atom Internet (httpknolgooglecomkjan-
kopanskiatom1amrwrct7rvi27) 060209
MARTENS PC and ZWAAN C Origin and evolution of filament-prominence systems
Internet (http wwwioporgEJarticle0004-637X558287253575webpdfrequest-
id=73e38daa-69ae-4e01-b9a6-b4bd0ba071dd) 092001
NASA The corona Internet (httpsolarsciencemsfcnasagovcoronashtml) 180107
NASA The heliosphere Internet (httpheliosgsfcnasagovheliosphhtml) 20012009
OFFICIAL SITE OF STONEHENGE About Stonehenge Internet
(httpwwwstonehengecouk) (03022009)
OTTERSDORF M Astronomy On the sunspot cycle Internet
(httpuserszoominternetnet~matto MCASsunspot_cyclehtmZeemaneffect) 031103
PARIAT E and SCHMIEDER B Magnetic flux emergence Internet(httpwwwscholarpediaorgarticleMagnetic_field_emergence) 18042008
832019 Ew Afgewerkte Final
httpslidepdfcomreaderfullew-afgewerkte-final 5959
59
PRIEST E R Dynamics and Structure of Quiescent Solar Prominences Internet
(httpbooksgooglebe booksid=h599q3jz1w4Campdq=quiescent+prominencesampprintsec=fro
ntcoverampsource=blampots=58b79Qeyabampsig=1eklQ-
WszOIebZZaq7fq7gm6bxAamphl=nlampei=urPtSe7ZCo61-
Qa166jHDwampsa=Xampoi=book_resultampct=result ampresnum=3PPA6M2) 1989
RUSSELL R Rotation of the sun Internet
(httpwwwwindowsucaredutourlink=sunSolar_interior
Sun_layersdifferential_rotationhtml) 16082005
RUSSELL R Sunspots and magnetic fields Internet
(httpwwwwindowsucaredutourlink=sunatmospheresunspot_magnetismhtmlampedu=hig
h) 060908
UNIVERSITY OF GLASGOW Bibliography of Peter Sweet Internet
(httpwwwuniversitystoryglaacuk biographyid=WH2144amptype=P) (10042009)
WIKIPEDIA Orbiting Solar Observatory Internet
(httpenwikipediaorgwikiOrbiting_Solar_Observatory) 24012009
WINDOWS TEAM Maunderrsquos Butterfly Diagram Internet
(httpwwwwindowsucaredutourlink=sun activitybutterflyhtml) 2000
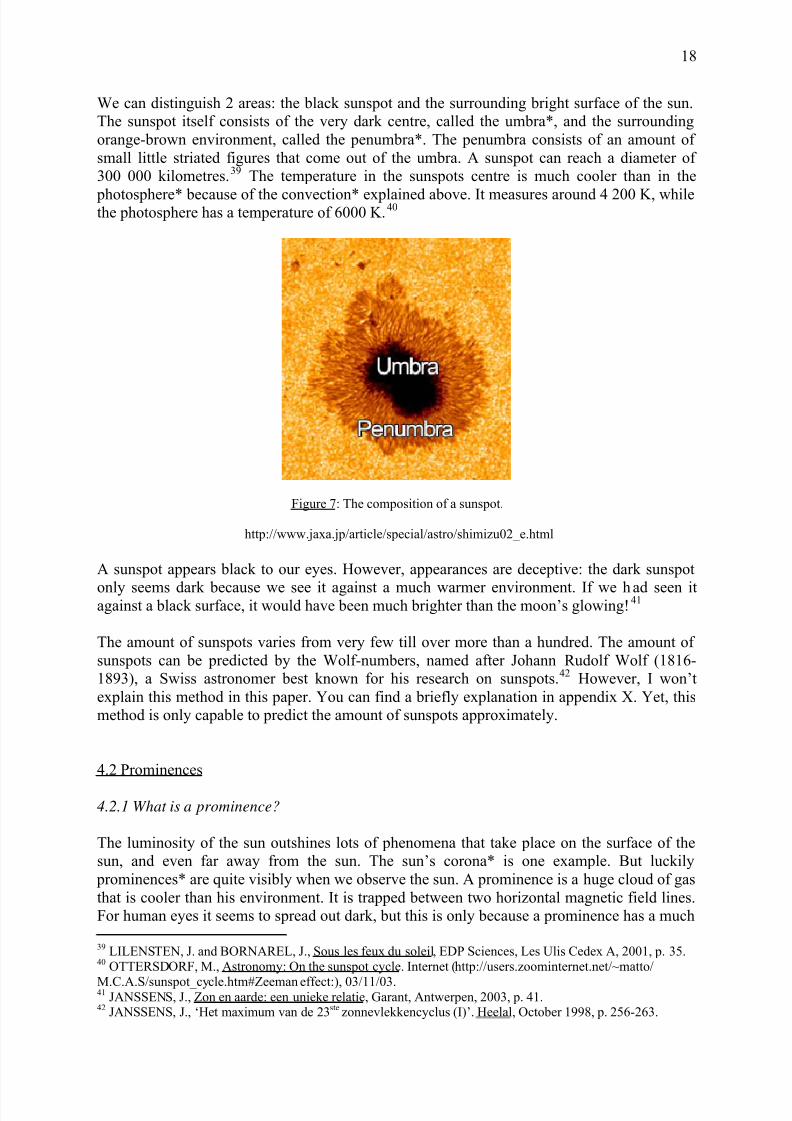
832019 Ew Afgewerkte Final
httpslidepdfcomreaderfullew-afgewerkte-final 1859
18
We can distinguish 2 areas the black sunspot and the surrounding bright surface of the sun
The sunspot itself consists of the very dark centre called the umbra and the surrounding
orange-brown environment called the penumbra The penumbra consists of an amount of
small little striated f igures that come out of the umbra A sunspot can reach a diameter of
300 000 kilometres39 The temperature in the sunspots centre is much cooler than in the
photosphere because of the convection explained above It measures around 4 200 K whilethe photosphere has a temperature of 6000 K40
Figure 7 The composition of a sunspot
httpwwwjaxajparticlespecialastroshimizu02_ehtml
A sunspot appears black to our eyes However appearances are deceptive the dark sunspot
only seems dark because we see it against a much warmer environment If we h ad seen itagainst a black surface it would have been much brighter than the moonrsquos glowing41
The amount of sunspots varies from very few till over more than a hundred The amount of
sunspots can be predicted by the Wolf-numbers named after Johann R udolf Wolf (1816-
1893) a Swiss astronomer best known for his research on sunspots42 However I wonrsquot
explain this method in this paper You can find a briefly explanation in appendix X Yet this
method is only capable to predict the amount of sunspots approximately
42 Prominences
421 What is a prominence
The luminosity of the sun outshines lots of phenomena that take place on the surface of the
sun and even far away from the sun The sunrsquos corona is one example But luckily
prominences are quite visibly when we observe the sun A prominence is a huge cloud of gas
that is cooler than his environment It is trapped between two horizontal magnetic field lines
For human eyes it seems to spread out dark but this is only because a prominence has a much
39 LILENSTEN J and BORNAREL J Sous les feux du soleil EDP Sciences Les Ulis Cedex A 2001 p 3540 OTTERSDORF M Astronomy On the sunspot cycle Internet (httpuserszoominternetnet~matto
MCASsunspot_cyclehtmZeeman effect) 03110341JANSSENS J Zon en aarde een unieke relatie Garant Antwerpen 2003 p 41
42 JANSSENS J lsquoHet maximum van de 23ste zonnevlekkencyclus (I)rsquo Heelal October 1998 p 256-263
832019 Ew Afgewerkte Final
httpslidepdfcomreaderfullew-afgewerkte-final 1959
19
lower temperature then the sunrsquos chromosphere (similar to sunspots which spread out dark
too) The dark lines in appendix XI are also known as filaments A filament is a line between
to magnetic fields with opposite polarities (appendix XI)43
Figure 8 A solar prominence
httpcosmic-webcoukp=274more-274
422 What is a prominence made of
The gas from the prominence is coming from the chromosphere So the prominences have
approximately the same composition as the chromosphere A good way to observe
prominences is to use red Hα or blue Hβ spectrum lines Hα absorption lines indicate a
temperature lower than 10 000 Kelvin These spectrum lines justif y that the temperature of a prominence is remarkably lower than the temperature of the corona 44
423 How do prominences originate
A prominence is a result of the magnetic field Particles of the sun can transport warmth very
fast if they move alongside magnetic field lines If they want to move straight to a magnetic
field line the transport of warmth is negligible So prominences that are trapped between 2
magnetic fields only have one way to be heated This brings on a temperature that is notably
lower then the temperature in the corona45
The origin of prominences is similar to the origin of solar flares When two magnetic loops
of opposite polarity start to approach each other they will reconnect and form some new
loops This is shown in appendix XII Some mass from the sun will be trapped between the
new magnetic field lines and will form a solar prominence 46
43COMINS NF and KAUFMANN III WJ Discovering the universe eighth edition WH Freeman and
Company New York 2008 p 29944 SMITS F lsquoProtuberanzenrsquo Heelal Juli 1991 p 18345 LANG KR Sun earth and sky Springer Germany 1995 p 134-14046
MARTENS PC and ZWAAN C Origin and evolution of filament-prominence systems Internet ( httpwwwioporgEJarticle0004-637X558287253575webpdfrequest-id=73e38daa-69ae-4e01-b9a6- b4bd0ba071dd) 092001
832019 Ew Afgewerkte Final
httpslidepdfcomreaderfullew-afgewerkte-final 2059
20
424 What do prominences look like47
4241 Different groups of prominences
As you can see on the pictures in appendix XIII prominences can have different shapes and
forms Thatrsquos why astronomers classify them into different groups the quiescent prominences the active prominences and eruptive prominences
4242 Quiescent prominences
Quiescent prominences can appear everywhere on the sun and are not depending on latitude
They can reach into the corona over 2 500 till 40 000 kilometres Quiescent prominences last
the longest of all prominences Some of them even last several solar rotations long These
prominences are very long and not so wide During its lifetime a quiescent prominence moves
slowly to the poles When they are found at the poles of the sun they are called a lsquopolar
crownrsquo (appendix XIV)48
4243 Active prominences
Their name already suggests where they can be found active prominences are found in the
active regions of the sun moreover in the presence of sunspots These prominences
however only have a short lifespan only several hours But within this short lifespan they do
change form adjusting to the magnetic field lines within a short period of time Because
these prominences are located in active regions there are many more reconnections and so
the form will change more rapidly
4244 Eruptive prominences
These prominences only last a couple of minutes and are connected to active sunspots as well
It is possible that after one died out another immediately gives birth in the same region Other
eruptive prominences are known to be bubbles of gas that are issued from active sunspots
There have been some records of eruptive prominences that bump into other prominences and
push the other prominences back in the sunspot49
47 KNISELY D Solar prominences Internet (httpwwwicstarscomHTMLSolarSectionHAlpha OBSERVINGTHESUNHAlpha3html) (03042009)
SMITS F lsquoProtuberanzenrsquo Heelal Juli 1991 p 182-185
ELLERMAN F Solar prominences Internet (httparticlesadsabsharvardedufull 1928ASPL173E0000074000html) (03042009)48
KNISLEY D Solar prominences Internet (httpwwwicstarscomHTMLSolarSectionHAlphaOBSERVINGTHESUNHAlpha3html) (03042009)49 PRIEST E R Dynamics and Structure of Quiescent Solar Prominences Internet (httpbooksgooglebe
booksid=h599q3jz1w4Campdq=quiescent+prominencesampprintsec=frontcoverampsource=blampots=58b79Qeyabampsig=1eklQ-WszOIebZZaq7fq7gm6bxAamphl=nlampei=urPtSe7ZCo61-Qa166jHDwampsa=Xampoi=book_resultampct=resultampresnum=3PPA6M2) 1989
832019 Ew Afgewerkte Final
httpslidepdfcomreaderfullew-afgewerkte-final 2159
21
43 Coronal holes50
When looking at the sun with an x-ray telescope we can see dark regions across the sun
These dark regions are called coronal holes Coronal holes have an open magnetic field
structure This means that the magnetic fields lines do not angle downwards but they extend
into space indefinitely Due to this the particles of the sun are capable to reach out far intospace without any struggles against the magnetic field With this outflow of gases from the
sun coronal holes are one of the most important sources of the (high-speed) solar wind
(appendix XV)
44 Corona loops
441 What is a corona loop
If we look closer at a pair of sunspots we can see an emission of plasma alongside
magnetic field lines that originate in the sun spots A corona loop can extend into the coronaas the name suggests Those loops contain plasma that can reach a temperature higher than
106 Kelvin Corona loops can best be observed by ultra-violet and x-ray images because of
the high temperature The high temper ature brings on a high vibration of the atoms This
trembling causes the emission of x-rays51
Figure 9 A close up of corona loops
httpwwwdaviddarlinginfoencyclopediaCcoronal_loophtml
442 Where and when do corona loops originate
The magnetic field lines of sunspots move outwards from the sun into the corona and form
broad loops This makes it possible to trap hot gas with a temperature up to 40 million K
Those magnetic field loops trap hot plasma into the sunrsquos atmosphere The magnetic force
pushes particles around along the magnetic lines but at the same time the atoms circulate
around the magnetic field lines (see figure 10) The speed of their movements depends on the
50
ENCYCLODPEDIA OF SCIENCE Corona hole Internet (httpwwwdaviddarlinginfoencyclopediaC coronal_holehtml) (04042009)51 JANSSENS J Zon en aarde een unieke relatie Garant Antwerpen 2003 p 52-54
832019 Ew Afgewerkte Final
httpslidepdfcomreaderfullew-afgewerkte-final 2259
22
density of the magnetic field So if a particle moves from the top of a loop to the bottom it
will slow down just like in traffic jams Eventually it will reach the bottom but the bottom is
highly compressed (because the magnetic field lines converge at the bottom of the loops) so
that the particle will be shot back along the magnetic field line (see figure 10)
Figure 10 the movement of particles in corona loops
GD HOLMAN lsquoThe mysterious origins of solar flaresrsquo Scientific America April 2006 p24-29 volume 294number 4
Hence the particles will move up and down along the magnetic field lines Atoms that are
charged the same will cause electric currents (just like in a battery) These currents will
generate a new magnetic field and the old magnetic field in combination with the new one
will cause a high distortion in the magnetic field of the sun This is the moment when the
corona loop will transform into a solar flare
45 Solar flare52
451 What is a solar flare
A solar flare is a sudden powerful explosion in the solar atmosphere caused by a disruption
in the magnetic field of the sun Because of the disruption mass from the sun will be movedup and form a solar flare A solar flare can equal the energy of billions of atomic bombs
within a few minutes The strongest solar flares are measured during the solar maximums
because then the sunrsquos magnetic activity is the strongest53 Since the sunspots in the presence
of solar flare have a very high magnetic field it is likely that a solar flare would even have a
higher magnetic field But in reality the magnetic field of a solar flare is only half of the
magnetic field of a sunspot The intensity of the magnetic field is lsquoonlyrsquo 500 Gauss54
52 HOLMAN GD lsquoThe mysterious origins of solar flaresrsquo Scientific America April 2006 p 24-31 volume
294 number 453JANSSENS J Zon en aarde een unieke relatie Garant Antwerpen 2003 p 55-57
54 JANSSENS J lsquoZonnefakkelsrsquo Heelal Oktober 1994 p 256
832019 Ew Afgewerkte Final
httpslidepdfcomreaderfullew-afgewerkte-final 2359
23
Figure 11 You can see the magnetic fieldlines in the solar flare on the right side
Large solar flare recorded by SOHO EIT304 instrument 512x512 version Animation (980kMPEG) CourtesySOHO(ESAampNASA)
httpwwwteachersparadisecomencyenwikipediassusunhtml
452 Where and how do sun flares originate
Astronomers have long been speculating how solar flares exactly originate In 1992 Satoshi
Masuda (graduated at the University of Tokyo) discovered on pictures of the Japanese
Yohkoh Satellite that the far end of a solar flare emitted unusually short wavelengths very
short x-rays The source must be a concentration of gas with a temperature of about 100million K concluded Masuda But this discovery provoked some new questions why was the
high temperature at the top of the flare and not at the bottom where the gas is more compact
Why does the plasma stay confined instead of spreading out into the universe In order to
obtain more information to try to solve this problem astronomers started observing the sunrsquos
radiation of ultraviolet and x-rays frequently In 2002 NASA even launched the RHESSI
(Ramaty High Energy Solar Spectroscopic Imager) which was intended to bring solar flares
into pictures55
These observations provided evidence that sun flares surge up in regions where the magnetic
field is very strong ndashmost common in the presence of sun spots At this point we have to call
over the corona loops As mentioned before corona loops are electric currents of atoms
which move alongside magnetic field lines When the atoms are shot back alongside the
magnetic field line there seems to occur a distortion of the magnetic field This distortion will
end up in a solar flare All the mass of the corona loop will be shot into space and form a solar
flare
But how can such enormous mass of the solar flares be shot into s pace This has been a very
interesting question However Peter Alan Sweet (1921-2005)56 succeeded in finding an
55 GD HOLMAN lsquoThe mysterious origins of solar flaresrsquo Scientific America April 2006 p 27 volume 294
number 456UNIVERSITY OF GLASGOW Bibliography of Peter Sweet Internet (httpwwwuniversitystoryglaacuk
biographyid=WH2144amptype=P) (10042009)
832019 Ew Afgewerkte Final
httpslidepdfcomreaderfullew-afgewerkte-final 2459
24
answer already in 1956 If magnetic field lines break apart and then reconnect they bring
together two opposing fields that will cancel each other and cause a huge burst of energy The
reconnection will create new magnetic field lines This reconnection is called the Sweet-
Parker reconnection Yet this is a slow reconnection which cannot take place at the base of a
solar flare with a dazzling speed Fortunately Harry P Petschek published an article about
reconnection in 1964 and solved that problem under certain circumstances it is possible toreconnect much faster which explains solar flares This faster reconnection is also called the
Petschek reconnection But unfortunately with the current technology it is not yet possible to
take pictures of those reconnections57
If the energy comes from the reconnection then where does this reconnection take place
From pictures of solar flares astronomers discovered that at the top of the corona loop a
mysterious x-ray source was found The x-ray source began to give a higher energy level and
at the same time the particles move down towards the sunrsquos surface Yet the x-ray source
stays at the same placehellipThen when the x-rays reach their maximum the loop suddenly
changes direction But this time the x-ray source will move upwards too unexpectedly it
moves at the speed of light approximately three hundred thousands kilometres an hour awayfrom the sun This is the same speed as the coronal mass ejections
46 Coronal mass ejections
461 What is a coronal mass ejection58
Coronal mass ejections (CMErsquos) (appendix XVI) are huge amounts of gas some billions of
plasma from the sun that are ejected into space Their temperature can reach 25 million K59
A coronal mass ejection can last for several hours and it can at last enter the solar wind A
CME can reach a speed of 50kms- 2000kms which means more than 7 million kilometres
an hour60 The mass of a large CME varies from 5 x 10⁶ to 5 x 10¹³ kg61 During a solar
maximum there are more coronal mass ejections than during a minimum but they can occur
at any time of the solar cycle Coronal mass ejections are related both to solar flares and
prominences Very heavy coronal mass ejections can cause some geomagnetic storms on
earth
462 Reconnection
The reconnection of a solar flare can end up in a coronal mass ejection When magneticfield lines that are opposite are starting to reconnect and form new magnetic field lines half of
the magnetic field lines will point downwards and join some existing magnetic loops
However the other part of the magnetic field lines will move upwards at a very high speed
and will form some loops more upwards Between those loops that moved downwards and
those that moved upwards there is some mass that isnrsquot connected to the sun anymore It is
57GD HOLMAN lsquoThe mysterious origins of solar flaresrsquo Scientific America April 2006 p 29 volume 294
number 458
BRAEUNIG R A Glossary Internet (httpwwwbraeunigusspaceglossaryhtm) 200659 LILENSTEN J and BORNAREL J Sous les feux du soleil EDP Sciences Les Ulis Cedex A 2001 p 4460 Cuypers J and others lsquoLa rechercheacute en heacuteliophysique en Belgiquersquo Space connection October 2007 p 10-
1161GREEN SF and JONES M H An introduction to the Sun and Stars The Open University Cambridge
2004 p 68
832019 Ew Afgewerkte Final
httpslidepdfcomreaderfullew-afgewerkte-final 2559
25
known that for an amount of solar flares that this mass between the loops will end up in a
coronal mass ejection Yet this doesnrsquot count for all the solar flares The coronal mass
ejection only takes place if the magnetic field lines twist around each other while forming the
letter lsquoSrsquo (see figure 12)62
Figure 12 Here you can see the reconnection that takes place before the coronal mass ejection starts
httpwwwnasagovmission_pagessolar-bsolar_005html
Certainly we will be capable to answer all the questions about solar flares and coronal mass
ejections in the nearby future But there are also some very interesting questions left what is
at the basis of the acceleration of the atoms in solar flares How does magnetic reconnection
originate Hopefully we will find the answers in the near future
47 Solar wind
471 What is the solar wind
Every second of every day of the year the sunrsquos corona emits a continuous stream of mass
from the sun The temperature of the corona is so high that the sunrsquos magnetic field just
cannot control the outflow of particles We know that the particles are accelerated but
astronomers cannot explain all the details about the solar wind yet
472 What do we know about the solar wind
The speed of the solar wind can change it differs from 300kmh up to 800kmh This speed
depends on the outflow of gases If there is a corona hole pointing towards the earth the solar
wind will reach a speed of around 800kmh The different speeds can interact with each other
and form a new speed according to the rules of light emission When two emissions connect
with each other they can form a faster or slower solar wind just like waves can interact and
form new waves
62BOEN B Birth of a coronal mass ejection Internet (httpwwwnasagovmission_pagessolar-b
solar_005html) 290408
832019 Ew Afgewerkte Final
httpslidepdfcomreaderfullew-afgewerkte-final 2659
26
The ionized atoms with very high temperature coming from the sunrsquos corona are one of the
most important parts of the solar wind but the magnetic fields are important too The
magnetic field outside the sun gets wrapped into a spiral called the Parker-spiral named after
the scientist who described it as the first one (because the sun rotates) This influences the
magnetic field of the sun from the outside The solar wind is emitted in spiral too (see figure
13)
Figure 13 The course of the solar wind caused by the rotation of the sun
httpheliosgsfcnasagovsolarmaghtml
473 Heliosphere
We can describe the heliosphere as a gigantic magnetic bubble around the sun This is
everywhere in space till where the sunrsquos magnetic field reaches and still has an influence The
heliosphere is filled with solar wind although the solar wind has a very low density Yet it
is a very hot wind but because of the very low density it does not have such a great influence
on earth However it can cause some energetic storms on earth63
63 NASA The heliosphere Internet (httpheliosgsfcnasagovheliosphhtml) 20012009
832019 Ew Afgewerkte Final
httpslidepdfcomreaderfullew-afgewerkte-final 2759
27
Conclusion
The sunrsquos magnetic field is a complex system to understand Yet I hope you have learned a
lot from this paper and that you do understand the exiting phenomena described in the
previous chapters
We can discuss the sunrsquos magnetic field from two perspectives The first one is looking at the
magnetic field for global long-term changing dimensions The second way is based on
phenomena on lower scale
The global changes involve the solar cycle and the switch of the magnetic poles The solar
cycle is divided into a decrease of the solar activity until it reaches solar minimum and an
increase of the solar activity until it reaches solar maximum The frequency of the phenomena
that can be found in the outer layers of the sun are directly connected to the solar activity and
thus to the solar cycle Sunspots are the easiest to see they appear as black spots against the
much brighter surface of the sun Corona loops are connected to sunspots and can extend into
solar flares and solar prominences These flares and prominences can burst out into a coronalmass ejection All these phenomena influence the sun and its solar wind how small their part
may be The solar wind has a directly influence on the earth
There is still much to be discovered Astronomers hope to discover much more about the
magnetic field of the sun Today many astronomers and scientists are observing the sun and
every day they discover more and more aspects of the sun Recently a group of researchers
led by David Jess of Queens University Belfast has revealed why the sunrsquos atmosphere is
hotter than its surface64 As you can see astronomy is a very developing science
64
CORDIS Researchers reveal why Suns atmosphere is hotter than its surface Internet (httpcordiseuropaeusearchindexcfmfuseaction=newsdocumentampN_LANG=ENampN_RCN=30598amppid=0ampq=87F36474805A6BEC0B89404F72D0351Famptype=sim) 20032009
832019 Ew Afgewerkte Final
httpslidepdfcomreaderfullew-afgewerkte-final 2859
28
Glossary
Absorption lines A dark line superimposed on a continuous spectrum when a gas absorbs
light from a continuous source that is hotter than the absorbing gas
Aurora Light radiated by atoms and ions formed by the solar wind in the earthrsquos upper atmosphere seen most commonly in the polar regions
Chromosphere The layer in the solar atmosphere between the photosphere and the corona It
is the lowest layer of the atmosphere characterized by reddish hue and by an increase of the
temperature with altitude through all but its lower regions
Convection The transfer of heat from a region of high temperature to a region of lower
temperature by the displacement of the cooler molecules by the warmer molecules The hot
gas will be moved upwards the cool gas will be pushed downwards into the sun
Corona The sunrsquos outer atmosphere It is very extensive and has a very low density It isextremely hot
Coronal hole A dark region of the sunrsquos inner corona as seen at X-ray wavelengths
Coronal loop Closed loops of magnetic field lines extending from the sunrsquos photosphere into
the corona which contain plasma at high temperature They are typically observed through
ultraviolet or x-ray emission from the hot plasma
Coronal mass ejection Large volumes of high energy gas released from the sunrsquos corona
Differential rotation The rotation of a non rigid object in which parts at different latitudes or
different radial distances move at different speeds
Dynamo theory The generation of a magnetic field by circulating electric charges
Eclipse The blocking of a part or all of the light from the moon by the earth (lunar eclipse) or
from the sun by the moon (solar eclipse)
Emission lines Emission lines are used in physics chemistry and astronomy to determine
what kind of gas is doing the emission Every element has a different electronic structure and
will thus have a different emission line fingerprint Emission lines are produced whenelectrons in atoms jump from one energy level to lower energy level
Filament A dark curve seen above the sunrsquos photosphere that is the top view of a solar
prominence
Flux tube Is a generally tube-like (cylindrical) region of space containing a magnetic field
such that the field at the side surfaces is parallel to them Both the cross-sectional area of the
tube and the field contained may vary along the length of the tube but the magnetic flux is
always constant
832019 Ew Afgewerkte Final
httpslidepdfcomreaderfullew-afgewerkte-final 2959
29
Geomagnetic storm When unusually strong surges of solar wind (charged particles from the
Sun) hit the Earth This effect causes variations in the magnetic field which surrounds the
Earth The visible results are eg the aurora (Northern and Southern lights)
Granulation Granules are related to the convective zone The granulation that shows up in the
photosphere is a result of the rising and falling of hot gas that takes place in the convectivezone
Hα absorption line An absorption line due to an electronic transition in hydrogen atoms in
which the atom absorbs a photon so that the electron makes a transition from a state
corresponding to the electronic energy level with n=2 to the one above with n=3 The photon
wavelength in a vacuum is 6563 nm
Heliosphere The volume of space within which the sun through the solar wind influences its
environment in the interstellar medium
Magnetic dynamo A theory that explains phenomena of the solar cycle as a result of periodicwinding and unwinding of the sunrsquos magnetic field in the solar atmosphere
Magnetic reconnection A process taking place in a plasma in which neighbouring
oppositely directed magnetic field lines suddenly part and reconnect in a new configuration
The abrupt change in a magnetic field represented by this process can release large amounts
of energy and it is thought to be important in explaining solar flares and other phenomena
Penumbra The portion of a shadow in which only part of the light source is covered by the
shadow-making body
Photosphere The region in the solar atmosphere from which most of the visible light escapes
into space
Plasma A fourth state of matter (not found naturally on Earth) of very hot gases Plasma is a
fluid with the ability to carry electric currents with no local accumulations of electric charge
Prominence Flamelike protrusion seen near the limb of the sun and extending into the solar
corona The side view of a filament
Quantum theory A theory in physics based on the principle that matter and energy have the
properties of both particles and waves created to explain the radiation of energy from a blackbody the photoelectric effect and the Bohr theory and now used to account for a wide
range of physical phenomena including the existence of discrete packets of energy and
matter the uncertainty principle and the exclusion principle Itrsquos a theory of the interaction of
matter and radiation developed early in the twentieth century which is based on the
quantization of energy and applied to a wide variety of processes that involve an exchange of
energy at the atomic level
Reconnection See magnetic reconnection
Solar cycle A 22-year-cycle during which the sunrsquos magnetic field reverses its polarity twice
Solar flare A violent eruption on the sunrsquos surface
832019 Ew Afgewerkte Final
httpslidepdfcomreaderfullew-afgewerkte-final 3059
30
Solar wind An outward flow of particles (mostly electrons and protons) from the sun
Solstice Either of two points along the ecliptic at which the Sun reaches its maximum
distance north or south of the celestial equator
Spectroscopy Concerns the production and study of spectra
Spectrum The result of electromagnetic radiation passing through a prism or grating so that
different wavelengths are separated
Spicule Short-lived (lifetime from rising to falling is about 15 minutes) jets vertical to the
solar surface that are several thousand kilometres long and about 1 kilometre thick (see also
appendix IV) in the solar chromosphere
Sunspot A temporary cool region in the solar photosphere created by protruding magnetic
fields
Umbra The central completely dark portion of a shadow
Zeemaneffect A splitting of spectra lines in the presence of a magnetic field
Bibliography and webography of the glossary
COMINS NF and KAUFMANN III WJ Discovering the universe eighth edition WH
Freeman and Company New York 2008 535 p
GREEN SF and JONES M H An introduction to the Sun and Stars The Open University
Cambridge 2004 373 p
httpenmimihuastronomygranulationhtml
httpenmimihuastronomyplasmahtml
httpwwwspacecomspacewatchspace_weather_glossaryhtml
httpenmimihuastronomyemission_linehtml
httpenmimihuastronomyabsorption_linehtml
httpwwwpbsorgfaithandreasonphysglossqm-bodyhtml
httpwwwanswerscomtopicquantum-theory
httpenwikipediaorgwikiFlux_tube
832019 Ew Afgewerkte Final
httpslidepdfcomreaderfullew-afgewerkte-final 3159
31
Appendix I The sun in figures
Physical quantity Comment
Radius 695 510 km 109 x earths radius
Mass 1989 x1030 kg 332 946 earths mass
Mass sun in the solar
system
9986 Total mass sun total mass of
our solar system
Volume 1412 x10sup3sup3 cmsup3 13 million x earths volume
Age 455 milliard years
Luminosity 3854 x 10sup3sup3 ergss
Magnitude -2773
Density center 1513 gcmsup3
Density mean 1409 gcmsup3
Pressure center 2334 x1011 bars
Pressure photosphere 00001 bar
Temperature center 15 557 000deg K
Temperature photosphere 5 780deg K Various sources mention
different grades
Temperature corona 2 000 000 to 3 000 000deg K
Rotation time at North or
South pole
up to 35 days on earth
Rotation time at Equator 25 days on earth The difference in rotation
times is called differential
rotation
Rotation time general 2538 days on earth
Mean distance sun-earth
(AU)
14959787 x108 km 1 AU = 1 Astronomical Unit
= 149 598 000 km
Chemical composition of
the sun ( of total number
of atoms)
Hydrogen 921
Helium 78
All others 01
Various sources mention
slightly different percentages
832019 Ew Afgewerkte Final
httpslidepdfcomreaderfullew-afgewerkte-final 3259
32
Chemical composition of
the sun ( of total mass)
Hydrogen 7346
Helium 2485
All others 169
Various sources mention
slightly different percentages
Total transforming of
hydrogen into helium persecond
700 billions of kilograms of
hydrogen are transformedinto 6957 billions of
kilograms of helium each
second
Based on the following references
- BEATTY JK PETERSEN CC and CHAIKIN A The new solar system fourth edition
Cambridge University Press Cambridge 1999 p 421
- LILENSTEN J and BORNAREL J Sous les feux du soleil EDP Sciences Les Ulis
Cedex A 2001 p 247
- LANG KR Sun earth and sky Springer Germany 1995 p 282- DENTHIER T Het zonnestelsel Standaard Uitgeverij 1992 p 415
- JANSSENS J Zon en aarde een unieke relatie Garant Antwerpen 2003 p 254- VOLKSSTERRENWACHT URANIA VZW De zon Internet(httpwwwuraniabesterrenkundezonnestelselzonphp) (01012009)
832019 Ew Afgewerkte Final
httpslidepdfcomreaderfullew-afgewerkte-final 3359
33
Appendix II Anatomy of the sun
httpwwwcosmographicacomgalleryinfographicssolar_anatomyhtml
The middle the sun consists of a heavy core this consists of plasma just as the outer layers
of the sun but the pressure in the core is so high that it behaves much more like a solid bodyThe most outer layer is the corona it reaches far into space More to the inside there is the
chromosphere and then the photosphere The corona the chromosphere and the
photosphere are explained in chapter 1
832019 Ew Afgewerkte Final
httpslidepdfcomreaderfullew-afgewerkte-final 3459
34
Appendix III Granulation
httpwwwwindowsucaredutourlink=sunSolar_interiorsolar_furnacehtml
At the surface of the sun we can find granules These are created by convection the warmest
parts of the sunrsquos interior move upwards and the colder parts at the surface move downwardsThis causes currents of plasma The dark lines are the colder particles We see them darker
because they emit less light than their surrounding neighbourhood
832019 Ew Afgewerkte Final
httpslidepdfcomreaderfullew-afgewerkte-final 3559
35
Appendix IV Spicules
Picture httplpc1clpccdcccauslpcharpellastro20a20deinfo_s09htmInformation httpwwwdaviddarlinginfoencyclopediaSspiculehtml
On this picture you can see spicules Spicules only last for several minutes and can be foundin the chromosphere They are little jets of gas There also exist macrospicules that can be
approximately ten times larger than a normal spicule
832019 Ew Afgewerkte Final
httpslidepdfcomreaderfullew-afgewerkte-final 3659
36
Appendix V The most important satellites observing the sun
Here you can find the most important satellites observing the sun and their missions
Solar and Heliospheric Obseratory (SOHO)
httpsohowwwnascomnasagovaboutabouthtml
SOHO the Solar amp Heliospheric Observatory is a project of international collaboration
between ESA and NASA to study the Sun from its deep core to the outer corona and the solar
wind
SOHO was launched on December 2 1995 The SOHO spacecraft was built in Europe by an
industry team led by prime contractor Matra Marconi Space (now EADS Astrium) under
overall management by ESA The twelve instruments on board SOHO were provided by
European and American scientists Nine of the international instrument consortia are led by
European Principal Investigators (PIs) three by PIs from the US Large engineering teamsand more than 200 co-investigators from many institutions supported the PIs in the
development of the instruments and in the preparation of their operations and data analysis
NASA was responsible for the launch and is now responsible for mission operations Large
radio dishes around the world which form NASAs Deep Space Network are used for data
downlink and commanding Mission control is based at Goddard Space Flight Center in
Maryland
More information about SOHO can be found on
httpsohowwwnascomnasagovaboutdocsSOHO_Fact_Sheetpdf
832019 Ew Afgewerkte Final
httpslidepdfcomreaderfullew-afgewerkte-final 3759
37
Transition Region and Coronal Explorer (TRACE)
httptracelmsalcomProjectMissionmissionhtm
TRACE enables solar physicists to study the connections between fine-scale magnetic fields
and the associated plasma structures on the Sun in a quantitative way by observing the photosphere the transition region and the corona With TRACE these temperature domains
are observed nearly simultaneously (with as little delay as only a second between different
wavelengths) with a spatial resolution of one second of arc
This is accomplished by obtaining precisely coaligned image sequences of photosphere
transition region and corona with high spatial resolution and uninterrupted viewing of the
Sun for up to eight months
TRACE Mission
TRACE explores the magnetic field in the solar atmosphere by studyingbull The 3-dimensional field structure
bull Its temporal evolution in response to photospheric flows
bull The time-dependent coronal fine structure
bull The coronal and transition region thermal topology
TRACE was launched on a Pegasus launch vehicle from Vandenberg Air Force Base in April
1998 The launch was scheduled to allow joint observations with SOHO during the rising
phase of the solar cycle to sunspot maximum No transition region or coronal imager has
witnessed the onset and rise of a solar cycle
Pegasus in flight
The two satellites provide complementary observations TRACE produces the high spatial
and temporal resolution images while SoHO yields images and spectral data out to 30 solar
radii at much lower spatial and temporal resolution Jointly they provide the opportunity to
obtain simultaneous digital measurements of all the temperature regimes of the solar
atmosphere in both high-resolution imaging and spectroscopy
With these data we expect to shatter the current ignorance of coronal heating and impulsive
MHD phenomena with benefits not only to solar physics but also to studies ranging from
stellar activity to the MHD of accretion disks The magnetograms produced by MDI on SoHO
provide a complete record of the eruption and distribution of photosphere magnetic fields
which will be invaluable for understanding TRACE observations of coronal hole formation
and coronal mass ejections Both of these phenomena have profound effects on our space
environment and the Earth`s magnetic field
TRACE is the first US solar research satellite since the Solar Maximum Mission
Coordination with SOHO provides an unprecedented opportunity to follow the emergence of
magnetic flux from the base of the convection zone deep inside the Sun through the
photosphere chromosphere and transitional region to the low-beta outer corona while
observing the effects of this emergence such as coronal mass ejections with high spatial andtemporal resolution
832019 Ew Afgewerkte Final
httpslidepdfcomreaderfullew-afgewerkte-final 3859
38
The transition from the photosphere where magnetic fields and plasma are in rough
equipartition to the corona where magnetic fields dominate is extremely difficult to model
and until recently to observe at high temporal and spatial resolution Many of the physical
problems that arise here such as plasma confinement reconnection wave propagation and plasma heating arise throughout space physics and astrophysics The detailed study of these
processed in the solar outer atmosphere is invaluable to astrophysics in general and stellar
studies in particular
More information about TRACE observations can be found on
httptracelmsalcomOperationsGeneraloperatiohtm
832019 Ew Afgewerkte Final
httpslidepdfcomreaderfullew-afgewerkte-final 3959
39
Reuven Ramaty High Energy Solar Spectroscopic Imager (RHESSI)
httphesperiagsfcnasagovhessibrochurehtm
What Questions will HESSI Address
bull How is such a large amount of energy released so rapidly during a flare
bull How are so many electrons and protons accelerated so quickly to such high energies
bull Where are the electrons and protons accelerated in the solar atmosphere and where do
they deposit their energy
How will HESSI Address these Questions
HESSI shown below will concentrate on electrons and protons accelerated in solar flares
through observations of the X-rays and gamma rays that they produce
bull HESSI will obtain the first ever X-ray and gamma-ray images of flares from 100 keV
to 20 MeVbull HESSI will do the first ever nuclear gamma-ray line spectroscopy of solar flares
bull HESSI will obtain pictures of flares in X-rays with an angular resolution of 2
arcseconds a factor of three better than previously possible
bull HESSI will measure X-ray and gamma-ray spectra with less than 1 keV energy
resolution a factor of 20-40 better than previously possible with scintillation counters
More information about the RHESSIrsquos Mission can be found on
httphesperiagsfcnasagovhessiconcepthtm
832019 Ew Afgewerkte Final
httpslidepdfcomreaderfullew-afgewerkte-final 4059
40
Solar Radiation and Climate Experiment (SORCE)
httplaspcoloradoedusorcesciencebackgroundhtm
The Solar Radiation and Climate Experiment (SORCE) is a NASA-sponsored satellite
mission that is providing state-of-the-art measurements of incoming x-ray ultraviolet visiblenear-infrared and total solar radiation The measurements provided by SORCE specifically
address long-term climate change natural variability and enhanced climate prediction and
atmospheric ozone and UV-B radiation These measurements are critical to studies of the Sun
its effect on our Earth system and its influence on humankind
The SORCE spacecraft was launched on January 25 2003 on a Pegasus XL launch vehicle to
provide NASAs Earth Science Enterprise (ESE) with precise measurements of solar
radiation It launched into a 645 km 40 degree orbit and is operated by the Laboratory for
Atmospheric and Space Physics (LASP) at the University of Colorado (CU) in Boulder
Colorado USA It will continue the precise measurements of total solar irradiance (TSI) that
began with the ERB instrument in 1979 and has continued to the present with the ACRIM series of measurements SORCE will also provide the measurements of the solar spectral
irradiance from 1nm to 2000nm accounting for 95 of the spectral contribution to TSI
SORCE carries four instruments including the Spectral Irradiance Monitor (SIM) Solar
Stellar Irradiance Comparison Experiment (SOLSTICE) Total Irradiance Monitor (TIM) and
the XUV Photometer System (XPS)
The primary goal of the NASA Earth Observing Systems (EOS) SOlar Radiation and Climate
Experiment (SORCE) is to enable solar-terrestrial studies by providing precise daily
measurements of the total solar irradiance (TSI) and the solar spectral irradiance atwavelengths extending from the ultraviolet to the near infrared The following lists the
SORCE science objectives
1 Make accurate measurements with high precision of total solar irradiance connect
them to previous TSI measurements and continue this long-term climate record
Provide TSI with an accuracy of 001 (100 parts per million) based on SI units and
with a long-term repeatability of 0001yr
2 Make daily measurements of the solar ultraviolet irradiance from 120 to 300 nm with
a spectral resolution of 1 nm Achieve this spectral irradiance measurement with an
accuracy of better than 5 and with a long-term repeatability of 05yr Use the
solarstellar comparison technique to relate the solar irradiance to the ensembleaverage flux from a number of bright early-type stars (same stars used by the UARS
SOLSTICE program)
3 Make the first measurements of the visible and near IR solar irradiance with sufficient
precision for future climate studies Obtain daily measurements of solar spectral
irradiance between 03 and 2 microm with a spectral resolution of at least 130 an
accuracy of 003 and a long-term repeatability of better than 001yr
4 Improve the understanding of how and why solar irradiance varies estimate past and
future solar behavior and investigate climate responses
More information about SORCE can be found on
httplaspcoloradoedusorcesciencescience_opshtm
832019 Ew Afgewerkte Final
httpslidepdfcomreaderfullew-afgewerkte-final 4159
41
Appendix VI Wavelengths
httpeosweblarcnasagovEDDOCSWavelengths_for_Colorshtml
As you can see on the figure visible light situates in the centre of the wavelengths having not
the shortest nor the longest wavelengths Gamma rays have the shortest wavelength radioways the longest All sort of wavelengths are used for daily purpose like radio waves for
radio and TV and gamma rays for treatments
832019 Ew Afgewerkte Final
httpslidepdfcomreaderfullew-afgewerkte-final 4259
42
Appendix VII Absorption lines in the sunrsquos spectrum
Picture httpwwwsolarnavigatornetthe_sunhtmExplanation COMINS NF and KAUFMANN III WJ Discovering the universe eighth edition WHFreeman and Company New York 2008 p 109
This photo is called a spectrogram It contains the spectrum of the sun All the black lines are
absorption lines The amount of black lines is related to the amount of elements that the sun
is emitting From a spectrogram we can deduct a lot of things including their mass the
temperature of the surface the chemical composition of the sun rotation rates and much
more
832019 Ew Afgewerkte Final
httpslidepdfcomreaderfullew-afgewerkte-final 4359
832019 Ew Afgewerkte Final
httpslidepdfcomreaderfullew-afgewerkte-final 4459
44
Appendix IX Butterfly-diagram
httpspacesciencespacerefcomsslpadsolarimagesbflygif
A butterfly-diagram
In a butterfly-diagram we can find the sunspots with their latitude (y-axis) through the years(x-axis) As you can see the sunspots appear like lsquobutterfliesrsquo this was discovered in 1904 by
Edward Maunder (1851-1928 an English astronomer best remembered for his study of
sunspots and the solar magnetic cycle) Thatrsquos why this graph is also called Maunders
butterfly diagram
832019 Ew Afgewerkte Final
httpslidepdfcomreaderfullew-afgewerkte-final 4559
45
Appendix X The Wolf-numbers
httpsidcomabenews106sunspotnumberclarifiedpdf
The sunspot number clarified By Petra Vanlommel
Which kinds of daily International Sunspot Numbers (ISN) are currentlypublished by the SIDC
Three daily indices are currently published by the SIDCthe Estimated ISN (EISN)the Provisional ISN (PISN)the Definitive ISN (DISN)Although they are all based on the same type of observations ie visual sunspot counts as ameasure of solar activity they are obtained from different data sets by different processingmethods with different accuracies and they serve different purposes
In the ideal case the three numbers are equal but in practice it is inevitable that there aresmall differences Therefore It is useful to explain what each index actually means
What is the source of the Wolf number
Once per day observers worldwide communicate their measured Wolf number (= 10G + S)based on visual sunspot (S) and group (G) counts to the World Data Center for the SunspotIndex Presently this is done through a dedicated password-protected WEB form the Wolfinterface However some observers still use the old way of reporting their observations onpaper through regular mail This method slows down the final processing but for the sake ofcontinuity in the index it is important to keep these observers included as some of them
represent the longest individual datasetsThe observers give the exact observing time the observing conditions the total numbers(group count sunspot count and Wolf number) and optionally the NorthSouth and centralzone numbers The observers using the web interface can provide their results to the SIDCimmediately after each observation However some users prefer to insert their data as ablock creating some delay but this must be done at least once a month
The personal reduction coefficient K
A personal reduction coefficient K is calculated for each station It has values typically in therange 04 and 17 and leads to a normalized sunspot number K(10G+S) In other words theK factor rescales the raw sunspot counts of each observer to the ones of Rudolph Wolf the
astronomer who introduced the above Wolf formula thus simulating the same eyes sametelescope and same conditionsDuring the procedure for calculating the Provisional ISN the K factor of every station iscomputed for every observation that passes the elimination procedure Once a year apersonal K factor for every station and for every month of the previous year is calculated Ayearly mean K value per station is also computed
The estimated sunspot index
The Estimated ISN (EISN) is calculated and issued on a daily basis for the day of calculationand the day before Only the total EISN is calculated with no hemispheric index It is anautomated procedure and no manual intervention is done The EISN is meant as a quicktemporary and approximate index for real-time applications
832019 Ew Afgewerkte Final
httpslidepdfcomreaderfullew-afgewerkte-final 4659
46
We use the raw Wolf number from all observatories that have provided counts early in theday ie before 1230 UT Typically there is between 10 and 20 stations available Thecalculation of the EISN is based on a simple and straightforward statistical method The Wolfnumbers are multiplied with the yearly mean K factor (see paragraph about the personalreduction coefficient K) The EISN is a simple average of the K-scaled values after excludingany individual value that deviates abnormally from the other valuesOnce the Provisional ISN (PISN) is calculated after the end of a month the temporary EISNis dropped and replaced by the PISN
The provisional sunspot Index
The Provisional ISN (PISN) is calculated and issued on the first of every month Theoutcome is a daily total and hemispheric sunspot number for the entire elapsed month Anexample on the first of September we calculate the daily PISN for each day of August ThePISN is computed semi-automatically with as little manual intervention as possibleTo calculate the PISN values for the concerned month we use all Wolf numbers Typicallythere is data from around 65 stations available
The calculation of the PISN is based on an extensive statistical treatment This treatmentfilters out any abnormal daily observation or the complete data set from an erratic station(quality control) This prevents long-term drifts in the resulting index One of the key elementsderived from this processing is to update the K reduction coefficients for each station theevolution of each station is monitored for each day relative to the entire networkA subset of the contributing stations also provides hemispheric counts A similar process isapplied to the North and South counts to derive the hemispheric PISN There is an additionalconstraint the sum of the North and South ISN must match the total ISNThe PISN replaces the EISN And once the Definitive ISN (DISN) is calculated the DISNreplaces the PISN
The definitive sunspot index
The Definitive ISN is calculated and issued on a quarterly basis when we have collecteddata from all the contributing observatories This is the final index and it is appended to thehistorical sunspot index time series The same semi-automated treatment as for the PISN isnow applied to the full data set If the result agrees within 5 of the PISN value the PISN iskept and becomes definitive Otherwise the new calculated value replaces the PISN andbecomes the definitive ISNIt is only at this stage and only in peculiar situations that a manual verification by ourscientific staff is required For example this happens when the observed raw Wolf valuesfrom the whole network are clustered around two distinct values This special case can becaused by small short-lived isolated sunspots (lifetimes lt 24 hours) or by the appearance ordisappearance of a large group at the solar limb in the course of one UT dayThe DISN replaces the provisional and estimated International Sunspot Number
Handling very low activity levels
One of the situations requiring a human arbitration is associated with single small isolatedand short-lived sunspots This is most noticeable around the minimum of the solar activitycycle like the one occurring now in 2008 Due to the 24hour binning (observations aregrouped between 0hUT and 24hUT) and the variable ability of each observer to detect thesmallest sunspots we end up with some stations reporting one sunspot and others who didno see any sunspot Let us explain further No sunspot may mean that the sunspot waspresent but the observer was unable to see it because of poor observational conditions such
as weather a small telescope On the other hand it may also indicate that the sunspot hadactually vanished by that time while it was present earlier on the same day
832019 Ew Afgewerkte Final
httpslidepdfcomreaderfullew-afgewerkte-final 4759
47
Individual stations do not observe at exactly the same timeIn order to validate the existence of such a marginal reported sunspot a qualified SIDCscientist must then check the detailed chronology within that day and consider the overallobserver capability (value of K coefficient)In common practice the fact that a sunspot is reported by a significant group of observersleads to the inclusion of the sunspot on that date thus neglecting the no-sunspotobservationsThe rationale is multiple observations of a sunspot exclude the possibility that the reportedsunspot was an independent false detection So a sunspot was really present on that dayalthough it may have existed only for part of the day or it was small enough to be missed bypart of the observers with smaller instruments or imperfect atmospheric conditionsAlso keep in mind that the sunspot index is derived with a limited precision just like any otherindex If the monthly mean sunspot number is 0 or 05 you can definitely say that activitywas low
What index should be used
If you want to perform long-term investigations the definitive ISN series is definitely the mostsuitable However there is a delay of a few months So when investigating the last cycle andrecent evolution use the definitive numbers in combination with the provisional ISN to be upto date to the last month The provisional numbers are also used in models forecasting thesunspot number for the coming months Now if you need a proxy for solar activity in a modelthat runs in real-time then you may use the estimated ISNImprovements and rethinking of the processing method is an ongoing project We arecurrently developing an alternative program for calculating the PISN Of course long-termconsistency is vital Therefore a cross-analysis between the output from the old and newsoftware must be applied over an extended period
832019 Ew Afgewerkte Final
httpslidepdfcomreaderfullew-afgewerkte-final 4859
48
Above graphs show different kinds of the International Sunspot Number The left plot gives an overview from 1700 up to now from the yearly (black) and monthly smoothed Sunspot Number The graph in the right top corner shows the monthly and monthly smoothed sunspot number while the graph in the right bottom corner show the daily monthly smoothed monthly sunspot number For every the time range of investigation there is an appropriate sunspot number
832019 Ew Afgewerkte Final
httpslidepdfcomreaderfullew-afgewerkte-final 4959
49
Appendix XI Filaments and prominences
httpsohowwwnascomnasagovpickoftheweekold26feb2004
This is a picture taken by SOHO on 26 February 2004
832019 Ew Afgewerkte Final
httpslidepdfcomreaderfullew-afgewerkte-final 5059
50
Appendix XII The reconnection of magnetic loops
httpwwwioporgEJarticle0004-637X558287253575webpdfrequest-id=73e38daa-69ae-4e01-b9a6- b4bd0ba071dd
In (a) sunspot B and C have different polarity and move towards each other The twomagnetic loops will reconnect and form one big magnetic loop showed in (b) This will
happen to other magnetic loops too as can be seen in (c) When G en F are close enough they
will reconnect and so E en H will reconnect too It is possible that the magnetic field line is
trapped around another in this case AD The mass ejected from the sun will be trapped
between the magnetic field lines and form a solar prominence
832019 Ew Afgewerkte Final
httpslidepdfcomreaderfullew-afgewerkte-final 5159
832019 Ew Afgewerkte Final
httpslidepdfcomreaderfullew-afgewerkte-final 5259
52
httptheinvisibleagentwordpresscom20090117amazing-celestial-images
An group of active prominences
httpapodnasagovapodap051109html
httpwhassupinthemilkywayblogspotcom200903cloudy-planhtml
A picture taken by SOHO In the left corner you can see the prominence with twisted
magnetic field lines
832019 Ew Afgewerkte Final
httpslidepdfcomreaderfullew-afgewerkte-final 5359
53
Appendix XIV Polar crown
httpsciencenasagovheadlinesy200817sep_polarcrownhtm
Photograph of a polar crown taken on 13 June 1999 by the Meudon Observatory
832019 Ew Afgewerkte Final
httpslidepdfcomreaderfullew-afgewerkte-final 5459
54
Appendix XV Coronal holes
httpsunearthdaynasagov2007multimediagal_020php
The black segment is a huge coronal hole The bright parts are x-rays from sunspots
832019 Ew Afgewerkte Final
httpslidepdfcomreaderfullew-afgewerkte-final 5559
55
Appendix XVI Coronal mass ejection
httpzuserver2staruclacuk~idhapodap000309html
Picture of a CME taken by SOHO in February 2000
832019 Ew Afgewerkte Final
httpslidepdfcomreaderfullew-afgewerkte-final 5659
56
Bibliography
Books
BEATTY JK PETERSEN CC and CHAIKIN A The new solar system fourth edition
Cambridge University Press Cambridge 1999 421 p
COMINS NF and KAUFMANN III WJ Discovering the universe eighth edition WH
Freeman and Company New York 2008 535 p
DETHIER T Het zonnestelsel Standaard Uitgeverij 1992 415 p
GOLUB L and PASACHOFF JM Nearest star the surprising science of our sun Harvard
university press Harvard 2001 267 p
GREEN SF and JONES M H An introduction to the Sun and Stars The Open University
Cambridge 2004 373 p
HILL S and CARLOWITZ M The sun Abrams New York 2006 239 p
HOLMAN GD lsquoThe mysterious origins of solar flaresrsquo Scientific America April 2006 p
24-31 volume 294 number 4
JANSSENS J Zon en aarde een unieke relatie Garant Antwerpen 2003 254 p
KELLER H-U Van Supernovarsquos tot zwarte gaten Tirion Natuur AH Baarn 2003 169 p
LANG KR Sun earth and sky Springer Germany 1995 282 p
LILENSTEN J and BORNAREL J Sous les feux du soleil EDP Sciences Les Ulis Cedex
A 2001 247 p
832019 Ew Afgewerkte Final
httpslidepdfcomreaderfullew-afgewerkte-final 5759
57
Articles
CUYPERS J and others lsquoLa rechercheacute en heacuteliophysique en Belgiquersquo Space connection
October 2007 20 p
DE KEYSER J lsquoDe magnetopauzersquo Heelal maart 1998 p 66-73
JANSSENS J lsquoHet maximum van de 23ste zonnevlekkencyclus (I)rsquo Heelal Oktober 1998 p
256-263
JANSSENS J lsquohet maximum van de 23ste zonnenvlekkencyclus (II)rsquo Heelal November
1998 p 284-290
JANSSENS J lsquoZonnefakkelsrsquo Heelal Oktober 1994 p 256-261
SMITS F lsquoDe coronarsquo Heelal Februari 1999 p 40-42
SMITS F lsquoProtuberanzenrsquo Heelal Juli 1991 p 182-185
VAN DEN BERGHE S lsquoHet Zeemaneffectrsquo Heelal September 1998 p 228-231
832019 Ew Afgewerkte Final
httpslidepdfcomreaderfullew-afgewerkte-final 5859
58
Webography
BOEN B Birth of a coronal mass ejection Internet
(httpwwwnasagovmission_pagessolar-b solar_005html) 290408
BRAEUNIG R A Glossary Internet (httpwwwbraeunigusspaceglossaryhtm) 2006
CORDIS Researchers reveal why Suns atmosphere is hotter than its surface Internet
(httpcordiseuropaeusearchindexcfmfuseaction=newsdocumentampN_LANG=ENampN_R
CN=30598amppid=0ampq=87F36474805A6BEC0B89404F72D0351Famptype=sim) 20032009
DAY C Alfveacuten waves may heat the Sunrsquos corona Internet
(httpblogsphysicstodayorgupdate200903 alfven-waves-may-heat-the-sunshtml)
310309
ELLERMAN F Solar prominences Internet (httparticlesadsabsharvardedufull
1928ASPL173E 0000074000html) (03042009)
ENCYCLODPEDIA OF SCIENCE Corona hole Internet
(httpwwwdaviddarlinginfoencyclopediaC coronal_holehtml) (04042009)
HATHAWAY D H The sunspot cycle Internet
(httpspacesciencespacerefcomsslpadsolarsunspots htm) 04012000
JANSSENS J The case of the missing solar cycle (published in lsquoheelalrsquo January 2008)
Internet (httpuserstelenetbejjanssensMSCwebEngpdf)
KNISELY D Solar prominences Internet
(httpwwwicstarscomHTMLSolarSectionHAlphaOBSERVINGTHESUNHAlpha3html)
(03042009)
KOPANSKI J Atom Internet (httpknolgooglecomkjan-
kopanskiatom1amrwrct7rvi27) 060209
MARTENS PC and ZWAAN C Origin and evolution of filament-prominence systems
Internet (http wwwioporgEJarticle0004-637X558287253575webpdfrequest-
id=73e38daa-69ae-4e01-b9a6-b4bd0ba071dd) 092001
NASA The corona Internet (httpsolarsciencemsfcnasagovcoronashtml) 180107
NASA The heliosphere Internet (httpheliosgsfcnasagovheliosphhtml) 20012009
OFFICIAL SITE OF STONEHENGE About Stonehenge Internet
(httpwwwstonehengecouk) (03022009)
OTTERSDORF M Astronomy On the sunspot cycle Internet
(httpuserszoominternetnet~matto MCASsunspot_cyclehtmZeemaneffect) 031103
PARIAT E and SCHMIEDER B Magnetic flux emergence Internet(httpwwwscholarpediaorgarticleMagnetic_field_emergence) 18042008
832019 Ew Afgewerkte Final
httpslidepdfcomreaderfullew-afgewerkte-final 5959
59
PRIEST E R Dynamics and Structure of Quiescent Solar Prominences Internet
(httpbooksgooglebe booksid=h599q3jz1w4Campdq=quiescent+prominencesampprintsec=fro
ntcoverampsource=blampots=58b79Qeyabampsig=1eklQ-
WszOIebZZaq7fq7gm6bxAamphl=nlampei=urPtSe7ZCo61-
Qa166jHDwampsa=Xampoi=book_resultampct=result ampresnum=3PPA6M2) 1989
RUSSELL R Rotation of the sun Internet
(httpwwwwindowsucaredutourlink=sunSolar_interior
Sun_layersdifferential_rotationhtml) 16082005
RUSSELL R Sunspots and magnetic fields Internet
(httpwwwwindowsucaredutourlink=sunatmospheresunspot_magnetismhtmlampedu=hig
h) 060908
UNIVERSITY OF GLASGOW Bibliography of Peter Sweet Internet
(httpwwwuniversitystoryglaacuk biographyid=WH2144amptype=P) (10042009)
WIKIPEDIA Orbiting Solar Observatory Internet
(httpenwikipediaorgwikiOrbiting_Solar_Observatory) 24012009
WINDOWS TEAM Maunderrsquos Butterfly Diagram Internet
(httpwwwwindowsucaredutourlink=sun activitybutterflyhtml) 2000
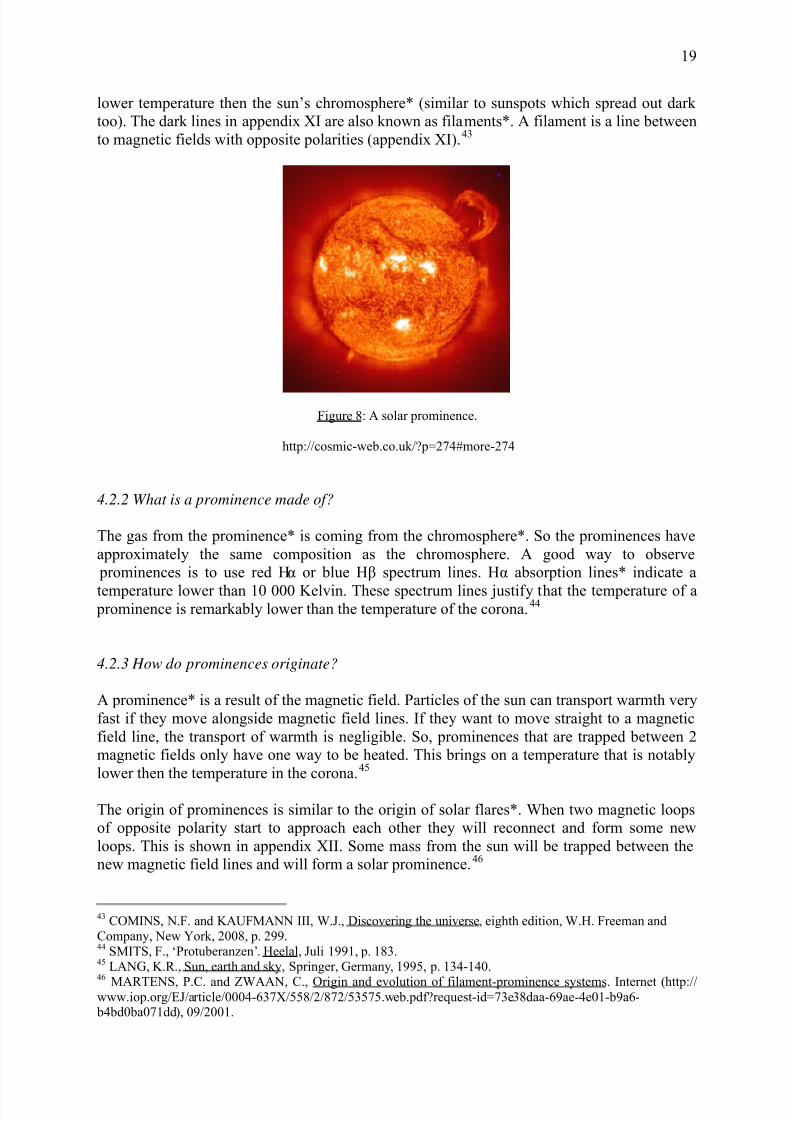
832019 Ew Afgewerkte Final
httpslidepdfcomreaderfullew-afgewerkte-final 2059
20
424 What do prominences look like47
4241 Different groups of prominences
As you can see on the pictures in appendix XIII prominences can have different shapes and
forms Thatrsquos why astronomers classify them into different groups the quiescent prominences the active prominences and eruptive prominences
4242 Quiescent prominences
Quiescent prominences can appear everywhere on the sun and are not depending on latitude
They can reach into the corona over 2 500 till 40 000 kilometres Quiescent prominences last
the longest of all prominences Some of them even last several solar rotations long These
prominences are very long and not so wide During its lifetime a quiescent prominence moves
slowly to the poles When they are found at the poles of the sun they are called a lsquopolar
crownrsquo (appendix XIV)48
4243 Active prominences
Their name already suggests where they can be found active prominences are found in the
active regions of the sun moreover in the presence of sunspots These prominences
however only have a short lifespan only several hours But within this short lifespan they do
change form adjusting to the magnetic field lines within a short period of time Because
these prominences are located in active regions there are many more reconnections and so
the form will change more rapidly
4244 Eruptive prominences
These prominences only last a couple of minutes and are connected to active sunspots as well
It is possible that after one died out another immediately gives birth in the same region Other
eruptive prominences are known to be bubbles of gas that are issued from active sunspots
There have been some records of eruptive prominences that bump into other prominences and
push the other prominences back in the sunspot49
47 KNISELY D Solar prominences Internet (httpwwwicstarscomHTMLSolarSectionHAlpha OBSERVINGTHESUNHAlpha3html) (03042009)
SMITS F lsquoProtuberanzenrsquo Heelal Juli 1991 p 182-185
ELLERMAN F Solar prominences Internet (httparticlesadsabsharvardedufull 1928ASPL173E0000074000html) (03042009)48
KNISLEY D Solar prominences Internet (httpwwwicstarscomHTMLSolarSectionHAlphaOBSERVINGTHESUNHAlpha3html) (03042009)49 PRIEST E R Dynamics and Structure of Quiescent Solar Prominences Internet (httpbooksgooglebe
booksid=h599q3jz1w4Campdq=quiescent+prominencesampprintsec=frontcoverampsource=blampots=58b79Qeyabampsig=1eklQ-WszOIebZZaq7fq7gm6bxAamphl=nlampei=urPtSe7ZCo61-Qa166jHDwampsa=Xampoi=book_resultampct=resultampresnum=3PPA6M2) 1989
832019 Ew Afgewerkte Final
httpslidepdfcomreaderfullew-afgewerkte-final 2159
21
43 Coronal holes50
When looking at the sun with an x-ray telescope we can see dark regions across the sun
These dark regions are called coronal holes Coronal holes have an open magnetic field
structure This means that the magnetic fields lines do not angle downwards but they extend
into space indefinitely Due to this the particles of the sun are capable to reach out far intospace without any struggles against the magnetic field With this outflow of gases from the
sun coronal holes are one of the most important sources of the (high-speed) solar wind
(appendix XV)
44 Corona loops
441 What is a corona loop
If we look closer at a pair of sunspots we can see an emission of plasma alongside
magnetic field lines that originate in the sun spots A corona loop can extend into the coronaas the name suggests Those loops contain plasma that can reach a temperature higher than
106 Kelvin Corona loops can best be observed by ultra-violet and x-ray images because of
the high temperature The high temper ature brings on a high vibration of the atoms This
trembling causes the emission of x-rays51
Figure 9 A close up of corona loops
httpwwwdaviddarlinginfoencyclopediaCcoronal_loophtml
442 Where and when do corona loops originate
The magnetic field lines of sunspots move outwards from the sun into the corona and form
broad loops This makes it possible to trap hot gas with a temperature up to 40 million K
Those magnetic field loops trap hot plasma into the sunrsquos atmosphere The magnetic force
pushes particles around along the magnetic lines but at the same time the atoms circulate
around the magnetic field lines (see figure 10) The speed of their movements depends on the
50
ENCYCLODPEDIA OF SCIENCE Corona hole Internet (httpwwwdaviddarlinginfoencyclopediaC coronal_holehtml) (04042009)51 JANSSENS J Zon en aarde een unieke relatie Garant Antwerpen 2003 p 52-54
832019 Ew Afgewerkte Final
httpslidepdfcomreaderfullew-afgewerkte-final 2259
22
density of the magnetic field So if a particle moves from the top of a loop to the bottom it
will slow down just like in traffic jams Eventually it will reach the bottom but the bottom is
highly compressed (because the magnetic field lines converge at the bottom of the loops) so
that the particle will be shot back along the magnetic field line (see figure 10)
Figure 10 the movement of particles in corona loops
GD HOLMAN lsquoThe mysterious origins of solar flaresrsquo Scientific America April 2006 p24-29 volume 294number 4
Hence the particles will move up and down along the magnetic field lines Atoms that are
charged the same will cause electric currents (just like in a battery) These currents will
generate a new magnetic field and the old magnetic field in combination with the new one
will cause a high distortion in the magnetic field of the sun This is the moment when the
corona loop will transform into a solar flare
45 Solar flare52
451 What is a solar flare
A solar flare is a sudden powerful explosion in the solar atmosphere caused by a disruption
in the magnetic field of the sun Because of the disruption mass from the sun will be movedup and form a solar flare A solar flare can equal the energy of billions of atomic bombs
within a few minutes The strongest solar flares are measured during the solar maximums
because then the sunrsquos magnetic activity is the strongest53 Since the sunspots in the presence
of solar flare have a very high magnetic field it is likely that a solar flare would even have a
higher magnetic field But in reality the magnetic field of a solar flare is only half of the
magnetic field of a sunspot The intensity of the magnetic field is lsquoonlyrsquo 500 Gauss54
52 HOLMAN GD lsquoThe mysterious origins of solar flaresrsquo Scientific America April 2006 p 24-31 volume
294 number 453JANSSENS J Zon en aarde een unieke relatie Garant Antwerpen 2003 p 55-57
54 JANSSENS J lsquoZonnefakkelsrsquo Heelal Oktober 1994 p 256
832019 Ew Afgewerkte Final
httpslidepdfcomreaderfullew-afgewerkte-final 2359
23
Figure 11 You can see the magnetic fieldlines in the solar flare on the right side
Large solar flare recorded by SOHO EIT304 instrument 512x512 version Animation (980kMPEG) CourtesySOHO(ESAampNASA)
httpwwwteachersparadisecomencyenwikipediassusunhtml
452 Where and how do sun flares originate
Astronomers have long been speculating how solar flares exactly originate In 1992 Satoshi
Masuda (graduated at the University of Tokyo) discovered on pictures of the Japanese
Yohkoh Satellite that the far end of a solar flare emitted unusually short wavelengths very
short x-rays The source must be a concentration of gas with a temperature of about 100million K concluded Masuda But this discovery provoked some new questions why was the
high temperature at the top of the flare and not at the bottom where the gas is more compact
Why does the plasma stay confined instead of spreading out into the universe In order to
obtain more information to try to solve this problem astronomers started observing the sunrsquos
radiation of ultraviolet and x-rays frequently In 2002 NASA even launched the RHESSI
(Ramaty High Energy Solar Spectroscopic Imager) which was intended to bring solar flares
into pictures55
These observations provided evidence that sun flares surge up in regions where the magnetic
field is very strong ndashmost common in the presence of sun spots At this point we have to call
over the corona loops As mentioned before corona loops are electric currents of atoms
which move alongside magnetic field lines When the atoms are shot back alongside the
magnetic field line there seems to occur a distortion of the magnetic field This distortion will
end up in a solar flare All the mass of the corona loop will be shot into space and form a solar
flare
But how can such enormous mass of the solar flares be shot into s pace This has been a very
interesting question However Peter Alan Sweet (1921-2005)56 succeeded in finding an
55 GD HOLMAN lsquoThe mysterious origins of solar flaresrsquo Scientific America April 2006 p 27 volume 294
number 456UNIVERSITY OF GLASGOW Bibliography of Peter Sweet Internet (httpwwwuniversitystoryglaacuk
biographyid=WH2144amptype=P) (10042009)
832019 Ew Afgewerkte Final
httpslidepdfcomreaderfullew-afgewerkte-final 2459
24
answer already in 1956 If magnetic field lines break apart and then reconnect they bring
together two opposing fields that will cancel each other and cause a huge burst of energy The
reconnection will create new magnetic field lines This reconnection is called the Sweet-
Parker reconnection Yet this is a slow reconnection which cannot take place at the base of a
solar flare with a dazzling speed Fortunately Harry P Petschek published an article about
reconnection in 1964 and solved that problem under certain circumstances it is possible toreconnect much faster which explains solar flares This faster reconnection is also called the
Petschek reconnection But unfortunately with the current technology it is not yet possible to
take pictures of those reconnections57
If the energy comes from the reconnection then where does this reconnection take place
From pictures of solar flares astronomers discovered that at the top of the corona loop a
mysterious x-ray source was found The x-ray source began to give a higher energy level and
at the same time the particles move down towards the sunrsquos surface Yet the x-ray source
stays at the same placehellipThen when the x-rays reach their maximum the loop suddenly
changes direction But this time the x-ray source will move upwards too unexpectedly it
moves at the speed of light approximately three hundred thousands kilometres an hour awayfrom the sun This is the same speed as the coronal mass ejections
46 Coronal mass ejections
461 What is a coronal mass ejection58
Coronal mass ejections (CMErsquos) (appendix XVI) are huge amounts of gas some billions of
plasma from the sun that are ejected into space Their temperature can reach 25 million K59
A coronal mass ejection can last for several hours and it can at last enter the solar wind A
CME can reach a speed of 50kms- 2000kms which means more than 7 million kilometres
an hour60 The mass of a large CME varies from 5 x 10⁶ to 5 x 10¹³ kg61 During a solar
maximum there are more coronal mass ejections than during a minimum but they can occur
at any time of the solar cycle Coronal mass ejections are related both to solar flares and
prominences Very heavy coronal mass ejections can cause some geomagnetic storms on
earth
462 Reconnection
The reconnection of a solar flare can end up in a coronal mass ejection When magneticfield lines that are opposite are starting to reconnect and form new magnetic field lines half of
the magnetic field lines will point downwards and join some existing magnetic loops
However the other part of the magnetic field lines will move upwards at a very high speed
and will form some loops more upwards Between those loops that moved downwards and
those that moved upwards there is some mass that isnrsquot connected to the sun anymore It is
57GD HOLMAN lsquoThe mysterious origins of solar flaresrsquo Scientific America April 2006 p 29 volume 294
number 458
BRAEUNIG R A Glossary Internet (httpwwwbraeunigusspaceglossaryhtm) 200659 LILENSTEN J and BORNAREL J Sous les feux du soleil EDP Sciences Les Ulis Cedex A 2001 p 4460 Cuypers J and others lsquoLa rechercheacute en heacuteliophysique en Belgiquersquo Space connection October 2007 p 10-
1161GREEN SF and JONES M H An introduction to the Sun and Stars The Open University Cambridge
2004 p 68
832019 Ew Afgewerkte Final
httpslidepdfcomreaderfullew-afgewerkte-final 2559
25
known that for an amount of solar flares that this mass between the loops will end up in a
coronal mass ejection Yet this doesnrsquot count for all the solar flares The coronal mass
ejection only takes place if the magnetic field lines twist around each other while forming the
letter lsquoSrsquo (see figure 12)62
Figure 12 Here you can see the reconnection that takes place before the coronal mass ejection starts
httpwwwnasagovmission_pagessolar-bsolar_005html
Certainly we will be capable to answer all the questions about solar flares and coronal mass
ejections in the nearby future But there are also some very interesting questions left what is
at the basis of the acceleration of the atoms in solar flares How does magnetic reconnection
originate Hopefully we will find the answers in the near future
47 Solar wind
471 What is the solar wind
Every second of every day of the year the sunrsquos corona emits a continuous stream of mass
from the sun The temperature of the corona is so high that the sunrsquos magnetic field just
cannot control the outflow of particles We know that the particles are accelerated but
astronomers cannot explain all the details about the solar wind yet
472 What do we know about the solar wind
The speed of the solar wind can change it differs from 300kmh up to 800kmh This speed
depends on the outflow of gases If there is a corona hole pointing towards the earth the solar
wind will reach a speed of around 800kmh The different speeds can interact with each other
and form a new speed according to the rules of light emission When two emissions connect
with each other they can form a faster or slower solar wind just like waves can interact and
form new waves
62BOEN B Birth of a coronal mass ejection Internet (httpwwwnasagovmission_pagessolar-b
solar_005html) 290408
832019 Ew Afgewerkte Final
httpslidepdfcomreaderfullew-afgewerkte-final 2659
26
The ionized atoms with very high temperature coming from the sunrsquos corona are one of the
most important parts of the solar wind but the magnetic fields are important too The
magnetic field outside the sun gets wrapped into a spiral called the Parker-spiral named after
the scientist who described it as the first one (because the sun rotates) This influences the
magnetic field of the sun from the outside The solar wind is emitted in spiral too (see figure
13)
Figure 13 The course of the solar wind caused by the rotation of the sun
httpheliosgsfcnasagovsolarmaghtml
473 Heliosphere
We can describe the heliosphere as a gigantic magnetic bubble around the sun This is
everywhere in space till where the sunrsquos magnetic field reaches and still has an influence The
heliosphere is filled with solar wind although the solar wind has a very low density Yet it
is a very hot wind but because of the very low density it does not have such a great influence
on earth However it can cause some energetic storms on earth63
63 NASA The heliosphere Internet (httpheliosgsfcnasagovheliosphhtml) 20012009
832019 Ew Afgewerkte Final
httpslidepdfcomreaderfullew-afgewerkte-final 2759
27
Conclusion
The sunrsquos magnetic field is a complex system to understand Yet I hope you have learned a
lot from this paper and that you do understand the exiting phenomena described in the
previous chapters
We can discuss the sunrsquos magnetic field from two perspectives The first one is looking at the
magnetic field for global long-term changing dimensions The second way is based on
phenomena on lower scale
The global changes involve the solar cycle and the switch of the magnetic poles The solar
cycle is divided into a decrease of the solar activity until it reaches solar minimum and an
increase of the solar activity until it reaches solar maximum The frequency of the phenomena
that can be found in the outer layers of the sun are directly connected to the solar activity and
thus to the solar cycle Sunspots are the easiest to see they appear as black spots against the
much brighter surface of the sun Corona loops are connected to sunspots and can extend into
solar flares and solar prominences These flares and prominences can burst out into a coronalmass ejection All these phenomena influence the sun and its solar wind how small their part
may be The solar wind has a directly influence on the earth
There is still much to be discovered Astronomers hope to discover much more about the
magnetic field of the sun Today many astronomers and scientists are observing the sun and
every day they discover more and more aspects of the sun Recently a group of researchers
led by David Jess of Queens University Belfast has revealed why the sunrsquos atmosphere is
hotter than its surface64 As you can see astronomy is a very developing science
64
CORDIS Researchers reveal why Suns atmosphere is hotter than its surface Internet (httpcordiseuropaeusearchindexcfmfuseaction=newsdocumentampN_LANG=ENampN_RCN=30598amppid=0ampq=87F36474805A6BEC0B89404F72D0351Famptype=sim) 20032009
832019 Ew Afgewerkte Final
httpslidepdfcomreaderfullew-afgewerkte-final 2859
28
Glossary
Absorption lines A dark line superimposed on a continuous spectrum when a gas absorbs
light from a continuous source that is hotter than the absorbing gas
Aurora Light radiated by atoms and ions formed by the solar wind in the earthrsquos upper atmosphere seen most commonly in the polar regions
Chromosphere The layer in the solar atmosphere between the photosphere and the corona It
is the lowest layer of the atmosphere characterized by reddish hue and by an increase of the
temperature with altitude through all but its lower regions
Convection The transfer of heat from a region of high temperature to a region of lower
temperature by the displacement of the cooler molecules by the warmer molecules The hot
gas will be moved upwards the cool gas will be pushed downwards into the sun
Corona The sunrsquos outer atmosphere It is very extensive and has a very low density It isextremely hot
Coronal hole A dark region of the sunrsquos inner corona as seen at X-ray wavelengths
Coronal loop Closed loops of magnetic field lines extending from the sunrsquos photosphere into
the corona which contain plasma at high temperature They are typically observed through
ultraviolet or x-ray emission from the hot plasma
Coronal mass ejection Large volumes of high energy gas released from the sunrsquos corona
Differential rotation The rotation of a non rigid object in which parts at different latitudes or
different radial distances move at different speeds
Dynamo theory The generation of a magnetic field by circulating electric charges
Eclipse The blocking of a part or all of the light from the moon by the earth (lunar eclipse) or
from the sun by the moon (solar eclipse)
Emission lines Emission lines are used in physics chemistry and astronomy to determine
what kind of gas is doing the emission Every element has a different electronic structure and
will thus have a different emission line fingerprint Emission lines are produced whenelectrons in atoms jump from one energy level to lower energy level
Filament A dark curve seen above the sunrsquos photosphere that is the top view of a solar
prominence
Flux tube Is a generally tube-like (cylindrical) region of space containing a magnetic field
such that the field at the side surfaces is parallel to them Both the cross-sectional area of the
tube and the field contained may vary along the length of the tube but the magnetic flux is
always constant
832019 Ew Afgewerkte Final
httpslidepdfcomreaderfullew-afgewerkte-final 2959
29
Geomagnetic storm When unusually strong surges of solar wind (charged particles from the
Sun) hit the Earth This effect causes variations in the magnetic field which surrounds the
Earth The visible results are eg the aurora (Northern and Southern lights)
Granulation Granules are related to the convective zone The granulation that shows up in the
photosphere is a result of the rising and falling of hot gas that takes place in the convectivezone
Hα absorption line An absorption line due to an electronic transition in hydrogen atoms in
which the atom absorbs a photon so that the electron makes a transition from a state
corresponding to the electronic energy level with n=2 to the one above with n=3 The photon
wavelength in a vacuum is 6563 nm
Heliosphere The volume of space within which the sun through the solar wind influences its
environment in the interstellar medium
Magnetic dynamo A theory that explains phenomena of the solar cycle as a result of periodicwinding and unwinding of the sunrsquos magnetic field in the solar atmosphere
Magnetic reconnection A process taking place in a plasma in which neighbouring
oppositely directed magnetic field lines suddenly part and reconnect in a new configuration
The abrupt change in a magnetic field represented by this process can release large amounts
of energy and it is thought to be important in explaining solar flares and other phenomena
Penumbra The portion of a shadow in which only part of the light source is covered by the
shadow-making body
Photosphere The region in the solar atmosphere from which most of the visible light escapes
into space
Plasma A fourth state of matter (not found naturally on Earth) of very hot gases Plasma is a
fluid with the ability to carry electric currents with no local accumulations of electric charge
Prominence Flamelike protrusion seen near the limb of the sun and extending into the solar
corona The side view of a filament
Quantum theory A theory in physics based on the principle that matter and energy have the
properties of both particles and waves created to explain the radiation of energy from a blackbody the photoelectric effect and the Bohr theory and now used to account for a wide
range of physical phenomena including the existence of discrete packets of energy and
matter the uncertainty principle and the exclusion principle Itrsquos a theory of the interaction of
matter and radiation developed early in the twentieth century which is based on the
quantization of energy and applied to a wide variety of processes that involve an exchange of
energy at the atomic level
Reconnection See magnetic reconnection
Solar cycle A 22-year-cycle during which the sunrsquos magnetic field reverses its polarity twice
Solar flare A violent eruption on the sunrsquos surface
832019 Ew Afgewerkte Final
httpslidepdfcomreaderfullew-afgewerkte-final 3059
30
Solar wind An outward flow of particles (mostly electrons and protons) from the sun
Solstice Either of two points along the ecliptic at which the Sun reaches its maximum
distance north or south of the celestial equator
Spectroscopy Concerns the production and study of spectra
Spectrum The result of electromagnetic radiation passing through a prism or grating so that
different wavelengths are separated
Spicule Short-lived (lifetime from rising to falling is about 15 minutes) jets vertical to the
solar surface that are several thousand kilometres long and about 1 kilometre thick (see also
appendix IV) in the solar chromosphere
Sunspot A temporary cool region in the solar photosphere created by protruding magnetic
fields
Umbra The central completely dark portion of a shadow
Zeemaneffect A splitting of spectra lines in the presence of a magnetic field
Bibliography and webography of the glossary
COMINS NF and KAUFMANN III WJ Discovering the universe eighth edition WH
Freeman and Company New York 2008 535 p
GREEN SF and JONES M H An introduction to the Sun and Stars The Open University
Cambridge 2004 373 p
httpenmimihuastronomygranulationhtml
httpenmimihuastronomyplasmahtml
httpwwwspacecomspacewatchspace_weather_glossaryhtml
httpenmimihuastronomyemission_linehtml
httpenmimihuastronomyabsorption_linehtml
httpwwwpbsorgfaithandreasonphysglossqm-bodyhtml
httpwwwanswerscomtopicquantum-theory
httpenwikipediaorgwikiFlux_tube
832019 Ew Afgewerkte Final
httpslidepdfcomreaderfullew-afgewerkte-final 3159
31
Appendix I The sun in figures
Physical quantity Comment
Radius 695 510 km 109 x earths radius
Mass 1989 x1030 kg 332 946 earths mass
Mass sun in the solar
system
9986 Total mass sun total mass of
our solar system
Volume 1412 x10sup3sup3 cmsup3 13 million x earths volume
Age 455 milliard years
Luminosity 3854 x 10sup3sup3 ergss
Magnitude -2773
Density center 1513 gcmsup3
Density mean 1409 gcmsup3
Pressure center 2334 x1011 bars
Pressure photosphere 00001 bar
Temperature center 15 557 000deg K
Temperature photosphere 5 780deg K Various sources mention
different grades
Temperature corona 2 000 000 to 3 000 000deg K
Rotation time at North or
South pole
up to 35 days on earth
Rotation time at Equator 25 days on earth The difference in rotation
times is called differential
rotation
Rotation time general 2538 days on earth
Mean distance sun-earth
(AU)
14959787 x108 km 1 AU = 1 Astronomical Unit
= 149 598 000 km
Chemical composition of
the sun ( of total number
of atoms)
Hydrogen 921
Helium 78
All others 01
Various sources mention
slightly different percentages
832019 Ew Afgewerkte Final
httpslidepdfcomreaderfullew-afgewerkte-final 3259
32
Chemical composition of
the sun ( of total mass)
Hydrogen 7346
Helium 2485
All others 169
Various sources mention
slightly different percentages
Total transforming of
hydrogen into helium persecond
700 billions of kilograms of
hydrogen are transformedinto 6957 billions of
kilograms of helium each
second
Based on the following references
- BEATTY JK PETERSEN CC and CHAIKIN A The new solar system fourth edition
Cambridge University Press Cambridge 1999 p 421
- LILENSTEN J and BORNAREL J Sous les feux du soleil EDP Sciences Les Ulis
Cedex A 2001 p 247
- LANG KR Sun earth and sky Springer Germany 1995 p 282- DENTHIER T Het zonnestelsel Standaard Uitgeverij 1992 p 415
- JANSSENS J Zon en aarde een unieke relatie Garant Antwerpen 2003 p 254- VOLKSSTERRENWACHT URANIA VZW De zon Internet(httpwwwuraniabesterrenkundezonnestelselzonphp) (01012009)
832019 Ew Afgewerkte Final
httpslidepdfcomreaderfullew-afgewerkte-final 3359
33
Appendix II Anatomy of the sun
httpwwwcosmographicacomgalleryinfographicssolar_anatomyhtml
The middle the sun consists of a heavy core this consists of plasma just as the outer layers
of the sun but the pressure in the core is so high that it behaves much more like a solid bodyThe most outer layer is the corona it reaches far into space More to the inside there is the
chromosphere and then the photosphere The corona the chromosphere and the
photosphere are explained in chapter 1
832019 Ew Afgewerkte Final
httpslidepdfcomreaderfullew-afgewerkte-final 3459
34
Appendix III Granulation
httpwwwwindowsucaredutourlink=sunSolar_interiorsolar_furnacehtml
At the surface of the sun we can find granules These are created by convection the warmest
parts of the sunrsquos interior move upwards and the colder parts at the surface move downwardsThis causes currents of plasma The dark lines are the colder particles We see them darker
because they emit less light than their surrounding neighbourhood
832019 Ew Afgewerkte Final
httpslidepdfcomreaderfullew-afgewerkte-final 3559
35
Appendix IV Spicules
Picture httplpc1clpccdcccauslpcharpellastro20a20deinfo_s09htmInformation httpwwwdaviddarlinginfoencyclopediaSspiculehtml
On this picture you can see spicules Spicules only last for several minutes and can be foundin the chromosphere They are little jets of gas There also exist macrospicules that can be
approximately ten times larger than a normal spicule
832019 Ew Afgewerkte Final
httpslidepdfcomreaderfullew-afgewerkte-final 3659
36
Appendix V The most important satellites observing the sun
Here you can find the most important satellites observing the sun and their missions
Solar and Heliospheric Obseratory (SOHO)
httpsohowwwnascomnasagovaboutabouthtml
SOHO the Solar amp Heliospheric Observatory is a project of international collaboration
between ESA and NASA to study the Sun from its deep core to the outer corona and the solar
wind
SOHO was launched on December 2 1995 The SOHO spacecraft was built in Europe by an
industry team led by prime contractor Matra Marconi Space (now EADS Astrium) under
overall management by ESA The twelve instruments on board SOHO were provided by
European and American scientists Nine of the international instrument consortia are led by
European Principal Investigators (PIs) three by PIs from the US Large engineering teamsand more than 200 co-investigators from many institutions supported the PIs in the
development of the instruments and in the preparation of their operations and data analysis
NASA was responsible for the launch and is now responsible for mission operations Large
radio dishes around the world which form NASAs Deep Space Network are used for data
downlink and commanding Mission control is based at Goddard Space Flight Center in
Maryland
More information about SOHO can be found on
httpsohowwwnascomnasagovaboutdocsSOHO_Fact_Sheetpdf
832019 Ew Afgewerkte Final
httpslidepdfcomreaderfullew-afgewerkte-final 3759
37
Transition Region and Coronal Explorer (TRACE)
httptracelmsalcomProjectMissionmissionhtm
TRACE enables solar physicists to study the connections between fine-scale magnetic fields
and the associated plasma structures on the Sun in a quantitative way by observing the photosphere the transition region and the corona With TRACE these temperature domains
are observed nearly simultaneously (with as little delay as only a second between different
wavelengths) with a spatial resolution of one second of arc
This is accomplished by obtaining precisely coaligned image sequences of photosphere
transition region and corona with high spatial resolution and uninterrupted viewing of the
Sun for up to eight months
TRACE Mission
TRACE explores the magnetic field in the solar atmosphere by studyingbull The 3-dimensional field structure
bull Its temporal evolution in response to photospheric flows
bull The time-dependent coronal fine structure
bull The coronal and transition region thermal topology
TRACE was launched on a Pegasus launch vehicle from Vandenberg Air Force Base in April
1998 The launch was scheduled to allow joint observations with SOHO during the rising
phase of the solar cycle to sunspot maximum No transition region or coronal imager has
witnessed the onset and rise of a solar cycle
Pegasus in flight
The two satellites provide complementary observations TRACE produces the high spatial
and temporal resolution images while SoHO yields images and spectral data out to 30 solar
radii at much lower spatial and temporal resolution Jointly they provide the opportunity to
obtain simultaneous digital measurements of all the temperature regimes of the solar
atmosphere in both high-resolution imaging and spectroscopy
With these data we expect to shatter the current ignorance of coronal heating and impulsive
MHD phenomena with benefits not only to solar physics but also to studies ranging from
stellar activity to the MHD of accretion disks The magnetograms produced by MDI on SoHO
provide a complete record of the eruption and distribution of photosphere magnetic fields
which will be invaluable for understanding TRACE observations of coronal hole formation
and coronal mass ejections Both of these phenomena have profound effects on our space
environment and the Earth`s magnetic field
TRACE is the first US solar research satellite since the Solar Maximum Mission
Coordination with SOHO provides an unprecedented opportunity to follow the emergence of
magnetic flux from the base of the convection zone deep inside the Sun through the
photosphere chromosphere and transitional region to the low-beta outer corona while
observing the effects of this emergence such as coronal mass ejections with high spatial andtemporal resolution
832019 Ew Afgewerkte Final
httpslidepdfcomreaderfullew-afgewerkte-final 3859
38
The transition from the photosphere where magnetic fields and plasma are in rough
equipartition to the corona where magnetic fields dominate is extremely difficult to model
and until recently to observe at high temporal and spatial resolution Many of the physical
problems that arise here such as plasma confinement reconnection wave propagation and plasma heating arise throughout space physics and astrophysics The detailed study of these
processed in the solar outer atmosphere is invaluable to astrophysics in general and stellar
studies in particular
More information about TRACE observations can be found on
httptracelmsalcomOperationsGeneraloperatiohtm
832019 Ew Afgewerkte Final
httpslidepdfcomreaderfullew-afgewerkte-final 3959
39
Reuven Ramaty High Energy Solar Spectroscopic Imager (RHESSI)
httphesperiagsfcnasagovhessibrochurehtm
What Questions will HESSI Address
bull How is such a large amount of energy released so rapidly during a flare
bull How are so many electrons and protons accelerated so quickly to such high energies
bull Where are the electrons and protons accelerated in the solar atmosphere and where do
they deposit their energy
How will HESSI Address these Questions
HESSI shown below will concentrate on electrons and protons accelerated in solar flares
through observations of the X-rays and gamma rays that they produce
bull HESSI will obtain the first ever X-ray and gamma-ray images of flares from 100 keV
to 20 MeVbull HESSI will do the first ever nuclear gamma-ray line spectroscopy of solar flares
bull HESSI will obtain pictures of flares in X-rays with an angular resolution of 2
arcseconds a factor of three better than previously possible
bull HESSI will measure X-ray and gamma-ray spectra with less than 1 keV energy
resolution a factor of 20-40 better than previously possible with scintillation counters
More information about the RHESSIrsquos Mission can be found on
httphesperiagsfcnasagovhessiconcepthtm
832019 Ew Afgewerkte Final
httpslidepdfcomreaderfullew-afgewerkte-final 4059
40
Solar Radiation and Climate Experiment (SORCE)
httplaspcoloradoedusorcesciencebackgroundhtm
The Solar Radiation and Climate Experiment (SORCE) is a NASA-sponsored satellite
mission that is providing state-of-the-art measurements of incoming x-ray ultraviolet visiblenear-infrared and total solar radiation The measurements provided by SORCE specifically
address long-term climate change natural variability and enhanced climate prediction and
atmospheric ozone and UV-B radiation These measurements are critical to studies of the Sun
its effect on our Earth system and its influence on humankind
The SORCE spacecraft was launched on January 25 2003 on a Pegasus XL launch vehicle to
provide NASAs Earth Science Enterprise (ESE) with precise measurements of solar
radiation It launched into a 645 km 40 degree orbit and is operated by the Laboratory for
Atmospheric and Space Physics (LASP) at the University of Colorado (CU) in Boulder
Colorado USA It will continue the precise measurements of total solar irradiance (TSI) that
began with the ERB instrument in 1979 and has continued to the present with the ACRIM series of measurements SORCE will also provide the measurements of the solar spectral
irradiance from 1nm to 2000nm accounting for 95 of the spectral contribution to TSI
SORCE carries four instruments including the Spectral Irradiance Monitor (SIM) Solar
Stellar Irradiance Comparison Experiment (SOLSTICE) Total Irradiance Monitor (TIM) and
the XUV Photometer System (XPS)
The primary goal of the NASA Earth Observing Systems (EOS) SOlar Radiation and Climate
Experiment (SORCE) is to enable solar-terrestrial studies by providing precise daily
measurements of the total solar irradiance (TSI) and the solar spectral irradiance atwavelengths extending from the ultraviolet to the near infrared The following lists the
SORCE science objectives
1 Make accurate measurements with high precision of total solar irradiance connect
them to previous TSI measurements and continue this long-term climate record
Provide TSI with an accuracy of 001 (100 parts per million) based on SI units and
with a long-term repeatability of 0001yr
2 Make daily measurements of the solar ultraviolet irradiance from 120 to 300 nm with
a spectral resolution of 1 nm Achieve this spectral irradiance measurement with an
accuracy of better than 5 and with a long-term repeatability of 05yr Use the
solarstellar comparison technique to relate the solar irradiance to the ensembleaverage flux from a number of bright early-type stars (same stars used by the UARS
SOLSTICE program)
3 Make the first measurements of the visible and near IR solar irradiance with sufficient
precision for future climate studies Obtain daily measurements of solar spectral
irradiance between 03 and 2 microm with a spectral resolution of at least 130 an
accuracy of 003 and a long-term repeatability of better than 001yr
4 Improve the understanding of how and why solar irradiance varies estimate past and
future solar behavior and investigate climate responses
More information about SORCE can be found on
httplaspcoloradoedusorcesciencescience_opshtm
832019 Ew Afgewerkte Final
httpslidepdfcomreaderfullew-afgewerkte-final 4159
41
Appendix VI Wavelengths
httpeosweblarcnasagovEDDOCSWavelengths_for_Colorshtml
As you can see on the figure visible light situates in the centre of the wavelengths having not
the shortest nor the longest wavelengths Gamma rays have the shortest wavelength radioways the longest All sort of wavelengths are used for daily purpose like radio waves for
radio and TV and gamma rays for treatments
832019 Ew Afgewerkte Final
httpslidepdfcomreaderfullew-afgewerkte-final 4259
42
Appendix VII Absorption lines in the sunrsquos spectrum
Picture httpwwwsolarnavigatornetthe_sunhtmExplanation COMINS NF and KAUFMANN III WJ Discovering the universe eighth edition WHFreeman and Company New York 2008 p 109
This photo is called a spectrogram It contains the spectrum of the sun All the black lines are
absorption lines The amount of black lines is related to the amount of elements that the sun
is emitting From a spectrogram we can deduct a lot of things including their mass the
temperature of the surface the chemical composition of the sun rotation rates and much
more
832019 Ew Afgewerkte Final
httpslidepdfcomreaderfullew-afgewerkte-final 4359
832019 Ew Afgewerkte Final
httpslidepdfcomreaderfullew-afgewerkte-final 4459
44
Appendix IX Butterfly-diagram
httpspacesciencespacerefcomsslpadsolarimagesbflygif
A butterfly-diagram
In a butterfly-diagram we can find the sunspots with their latitude (y-axis) through the years(x-axis) As you can see the sunspots appear like lsquobutterfliesrsquo this was discovered in 1904 by
Edward Maunder (1851-1928 an English astronomer best remembered for his study of
sunspots and the solar magnetic cycle) Thatrsquos why this graph is also called Maunders
butterfly diagram
832019 Ew Afgewerkte Final
httpslidepdfcomreaderfullew-afgewerkte-final 4559
45
Appendix X The Wolf-numbers
httpsidcomabenews106sunspotnumberclarifiedpdf
The sunspot number clarified By Petra Vanlommel
Which kinds of daily International Sunspot Numbers (ISN) are currentlypublished by the SIDC
Three daily indices are currently published by the SIDCthe Estimated ISN (EISN)the Provisional ISN (PISN)the Definitive ISN (DISN)Although they are all based on the same type of observations ie visual sunspot counts as ameasure of solar activity they are obtained from different data sets by different processingmethods with different accuracies and they serve different purposes
In the ideal case the three numbers are equal but in practice it is inevitable that there aresmall differences Therefore It is useful to explain what each index actually means
What is the source of the Wolf number
Once per day observers worldwide communicate their measured Wolf number (= 10G + S)based on visual sunspot (S) and group (G) counts to the World Data Center for the SunspotIndex Presently this is done through a dedicated password-protected WEB form the Wolfinterface However some observers still use the old way of reporting their observations onpaper through regular mail This method slows down the final processing but for the sake ofcontinuity in the index it is important to keep these observers included as some of them
represent the longest individual datasetsThe observers give the exact observing time the observing conditions the total numbers(group count sunspot count and Wolf number) and optionally the NorthSouth and centralzone numbers The observers using the web interface can provide their results to the SIDCimmediately after each observation However some users prefer to insert their data as ablock creating some delay but this must be done at least once a month
The personal reduction coefficient K
A personal reduction coefficient K is calculated for each station It has values typically in therange 04 and 17 and leads to a normalized sunspot number K(10G+S) In other words theK factor rescales the raw sunspot counts of each observer to the ones of Rudolph Wolf the
astronomer who introduced the above Wolf formula thus simulating the same eyes sametelescope and same conditionsDuring the procedure for calculating the Provisional ISN the K factor of every station iscomputed for every observation that passes the elimination procedure Once a year apersonal K factor for every station and for every month of the previous year is calculated Ayearly mean K value per station is also computed
The estimated sunspot index
The Estimated ISN (EISN) is calculated and issued on a daily basis for the day of calculationand the day before Only the total EISN is calculated with no hemispheric index It is anautomated procedure and no manual intervention is done The EISN is meant as a quicktemporary and approximate index for real-time applications
832019 Ew Afgewerkte Final
httpslidepdfcomreaderfullew-afgewerkte-final 4659
46
We use the raw Wolf number from all observatories that have provided counts early in theday ie before 1230 UT Typically there is between 10 and 20 stations available Thecalculation of the EISN is based on a simple and straightforward statistical method The Wolfnumbers are multiplied with the yearly mean K factor (see paragraph about the personalreduction coefficient K) The EISN is a simple average of the K-scaled values after excludingany individual value that deviates abnormally from the other valuesOnce the Provisional ISN (PISN) is calculated after the end of a month the temporary EISNis dropped and replaced by the PISN
The provisional sunspot Index
The Provisional ISN (PISN) is calculated and issued on the first of every month Theoutcome is a daily total and hemispheric sunspot number for the entire elapsed month Anexample on the first of September we calculate the daily PISN for each day of August ThePISN is computed semi-automatically with as little manual intervention as possibleTo calculate the PISN values for the concerned month we use all Wolf numbers Typicallythere is data from around 65 stations available
The calculation of the PISN is based on an extensive statistical treatment This treatmentfilters out any abnormal daily observation or the complete data set from an erratic station(quality control) This prevents long-term drifts in the resulting index One of the key elementsderived from this processing is to update the K reduction coefficients for each station theevolution of each station is monitored for each day relative to the entire networkA subset of the contributing stations also provides hemispheric counts A similar process isapplied to the North and South counts to derive the hemispheric PISN There is an additionalconstraint the sum of the North and South ISN must match the total ISNThe PISN replaces the EISN And once the Definitive ISN (DISN) is calculated the DISNreplaces the PISN
The definitive sunspot index
The Definitive ISN is calculated and issued on a quarterly basis when we have collecteddata from all the contributing observatories This is the final index and it is appended to thehistorical sunspot index time series The same semi-automated treatment as for the PISN isnow applied to the full data set If the result agrees within 5 of the PISN value the PISN iskept and becomes definitive Otherwise the new calculated value replaces the PISN andbecomes the definitive ISNIt is only at this stage and only in peculiar situations that a manual verification by ourscientific staff is required For example this happens when the observed raw Wolf valuesfrom the whole network are clustered around two distinct values This special case can becaused by small short-lived isolated sunspots (lifetimes lt 24 hours) or by the appearance ordisappearance of a large group at the solar limb in the course of one UT dayThe DISN replaces the provisional and estimated International Sunspot Number
Handling very low activity levels
One of the situations requiring a human arbitration is associated with single small isolatedand short-lived sunspots This is most noticeable around the minimum of the solar activitycycle like the one occurring now in 2008 Due to the 24hour binning (observations aregrouped between 0hUT and 24hUT) and the variable ability of each observer to detect thesmallest sunspots we end up with some stations reporting one sunspot and others who didno see any sunspot Let us explain further No sunspot may mean that the sunspot waspresent but the observer was unable to see it because of poor observational conditions such
as weather a small telescope On the other hand it may also indicate that the sunspot hadactually vanished by that time while it was present earlier on the same day
832019 Ew Afgewerkte Final
httpslidepdfcomreaderfullew-afgewerkte-final 4759
47
Individual stations do not observe at exactly the same timeIn order to validate the existence of such a marginal reported sunspot a qualified SIDCscientist must then check the detailed chronology within that day and consider the overallobserver capability (value of K coefficient)In common practice the fact that a sunspot is reported by a significant group of observersleads to the inclusion of the sunspot on that date thus neglecting the no-sunspotobservationsThe rationale is multiple observations of a sunspot exclude the possibility that the reportedsunspot was an independent false detection So a sunspot was really present on that dayalthough it may have existed only for part of the day or it was small enough to be missed bypart of the observers with smaller instruments or imperfect atmospheric conditionsAlso keep in mind that the sunspot index is derived with a limited precision just like any otherindex If the monthly mean sunspot number is 0 or 05 you can definitely say that activitywas low
What index should be used
If you want to perform long-term investigations the definitive ISN series is definitely the mostsuitable However there is a delay of a few months So when investigating the last cycle andrecent evolution use the definitive numbers in combination with the provisional ISN to be upto date to the last month The provisional numbers are also used in models forecasting thesunspot number for the coming months Now if you need a proxy for solar activity in a modelthat runs in real-time then you may use the estimated ISNImprovements and rethinking of the processing method is an ongoing project We arecurrently developing an alternative program for calculating the PISN Of course long-termconsistency is vital Therefore a cross-analysis between the output from the old and newsoftware must be applied over an extended period
832019 Ew Afgewerkte Final
httpslidepdfcomreaderfullew-afgewerkte-final 4859
48
Above graphs show different kinds of the International Sunspot Number The left plot gives an overview from 1700 up to now from the yearly (black) and monthly smoothed Sunspot Number The graph in the right top corner shows the monthly and monthly smoothed sunspot number while the graph in the right bottom corner show the daily monthly smoothed monthly sunspot number For every the time range of investigation there is an appropriate sunspot number
832019 Ew Afgewerkte Final
httpslidepdfcomreaderfullew-afgewerkte-final 4959
49
Appendix XI Filaments and prominences
httpsohowwwnascomnasagovpickoftheweekold26feb2004
This is a picture taken by SOHO on 26 February 2004
832019 Ew Afgewerkte Final
httpslidepdfcomreaderfullew-afgewerkte-final 5059
50
Appendix XII The reconnection of magnetic loops
httpwwwioporgEJarticle0004-637X558287253575webpdfrequest-id=73e38daa-69ae-4e01-b9a6- b4bd0ba071dd
In (a) sunspot B and C have different polarity and move towards each other The twomagnetic loops will reconnect and form one big magnetic loop showed in (b) This will
happen to other magnetic loops too as can be seen in (c) When G en F are close enough they
will reconnect and so E en H will reconnect too It is possible that the magnetic field line is
trapped around another in this case AD The mass ejected from the sun will be trapped
between the magnetic field lines and form a solar prominence
832019 Ew Afgewerkte Final
httpslidepdfcomreaderfullew-afgewerkte-final 5159
832019 Ew Afgewerkte Final
httpslidepdfcomreaderfullew-afgewerkte-final 5259
52
httptheinvisibleagentwordpresscom20090117amazing-celestial-images
An group of active prominences
httpapodnasagovapodap051109html
httpwhassupinthemilkywayblogspotcom200903cloudy-planhtml
A picture taken by SOHO In the left corner you can see the prominence with twisted
magnetic field lines
832019 Ew Afgewerkte Final
httpslidepdfcomreaderfullew-afgewerkte-final 5359
53
Appendix XIV Polar crown
httpsciencenasagovheadlinesy200817sep_polarcrownhtm
Photograph of a polar crown taken on 13 June 1999 by the Meudon Observatory
832019 Ew Afgewerkte Final
httpslidepdfcomreaderfullew-afgewerkte-final 5459
54
Appendix XV Coronal holes
httpsunearthdaynasagov2007multimediagal_020php
The black segment is a huge coronal hole The bright parts are x-rays from sunspots
832019 Ew Afgewerkte Final
httpslidepdfcomreaderfullew-afgewerkte-final 5559
55
Appendix XVI Coronal mass ejection
httpzuserver2staruclacuk~idhapodap000309html
Picture of a CME taken by SOHO in February 2000
832019 Ew Afgewerkte Final
httpslidepdfcomreaderfullew-afgewerkte-final 5659
56
Bibliography
Books
BEATTY JK PETERSEN CC and CHAIKIN A The new solar system fourth edition
Cambridge University Press Cambridge 1999 421 p
COMINS NF and KAUFMANN III WJ Discovering the universe eighth edition WH
Freeman and Company New York 2008 535 p
DETHIER T Het zonnestelsel Standaard Uitgeverij 1992 415 p
GOLUB L and PASACHOFF JM Nearest star the surprising science of our sun Harvard
university press Harvard 2001 267 p
GREEN SF and JONES M H An introduction to the Sun and Stars The Open University
Cambridge 2004 373 p
HILL S and CARLOWITZ M The sun Abrams New York 2006 239 p
HOLMAN GD lsquoThe mysterious origins of solar flaresrsquo Scientific America April 2006 p
24-31 volume 294 number 4
JANSSENS J Zon en aarde een unieke relatie Garant Antwerpen 2003 254 p
KELLER H-U Van Supernovarsquos tot zwarte gaten Tirion Natuur AH Baarn 2003 169 p
LANG KR Sun earth and sky Springer Germany 1995 282 p
LILENSTEN J and BORNAREL J Sous les feux du soleil EDP Sciences Les Ulis Cedex
A 2001 247 p
832019 Ew Afgewerkte Final
httpslidepdfcomreaderfullew-afgewerkte-final 5759
57
Articles
CUYPERS J and others lsquoLa rechercheacute en heacuteliophysique en Belgiquersquo Space connection
October 2007 20 p
DE KEYSER J lsquoDe magnetopauzersquo Heelal maart 1998 p 66-73
JANSSENS J lsquoHet maximum van de 23ste zonnevlekkencyclus (I)rsquo Heelal Oktober 1998 p
256-263
JANSSENS J lsquohet maximum van de 23ste zonnenvlekkencyclus (II)rsquo Heelal November
1998 p 284-290
JANSSENS J lsquoZonnefakkelsrsquo Heelal Oktober 1994 p 256-261
SMITS F lsquoDe coronarsquo Heelal Februari 1999 p 40-42
SMITS F lsquoProtuberanzenrsquo Heelal Juli 1991 p 182-185
VAN DEN BERGHE S lsquoHet Zeemaneffectrsquo Heelal September 1998 p 228-231
832019 Ew Afgewerkte Final
httpslidepdfcomreaderfullew-afgewerkte-final 5859
58
Webography
BOEN B Birth of a coronal mass ejection Internet
(httpwwwnasagovmission_pagessolar-b solar_005html) 290408
BRAEUNIG R A Glossary Internet (httpwwwbraeunigusspaceglossaryhtm) 2006
CORDIS Researchers reveal why Suns atmosphere is hotter than its surface Internet
(httpcordiseuropaeusearchindexcfmfuseaction=newsdocumentampN_LANG=ENampN_R
CN=30598amppid=0ampq=87F36474805A6BEC0B89404F72D0351Famptype=sim) 20032009
DAY C Alfveacuten waves may heat the Sunrsquos corona Internet
(httpblogsphysicstodayorgupdate200903 alfven-waves-may-heat-the-sunshtml)
310309
ELLERMAN F Solar prominences Internet (httparticlesadsabsharvardedufull
1928ASPL173E 0000074000html) (03042009)
ENCYCLODPEDIA OF SCIENCE Corona hole Internet
(httpwwwdaviddarlinginfoencyclopediaC coronal_holehtml) (04042009)
HATHAWAY D H The sunspot cycle Internet
(httpspacesciencespacerefcomsslpadsolarsunspots htm) 04012000
JANSSENS J The case of the missing solar cycle (published in lsquoheelalrsquo January 2008)
Internet (httpuserstelenetbejjanssensMSCwebEngpdf)
KNISELY D Solar prominences Internet
(httpwwwicstarscomHTMLSolarSectionHAlphaOBSERVINGTHESUNHAlpha3html)
(03042009)
KOPANSKI J Atom Internet (httpknolgooglecomkjan-
kopanskiatom1amrwrct7rvi27) 060209
MARTENS PC and ZWAAN C Origin and evolution of filament-prominence systems
Internet (http wwwioporgEJarticle0004-637X558287253575webpdfrequest-
id=73e38daa-69ae-4e01-b9a6-b4bd0ba071dd) 092001
NASA The corona Internet (httpsolarsciencemsfcnasagovcoronashtml) 180107
NASA The heliosphere Internet (httpheliosgsfcnasagovheliosphhtml) 20012009
OFFICIAL SITE OF STONEHENGE About Stonehenge Internet
(httpwwwstonehengecouk) (03022009)
OTTERSDORF M Astronomy On the sunspot cycle Internet
(httpuserszoominternetnet~matto MCASsunspot_cyclehtmZeemaneffect) 031103
PARIAT E and SCHMIEDER B Magnetic flux emergence Internet(httpwwwscholarpediaorgarticleMagnetic_field_emergence) 18042008
832019 Ew Afgewerkte Final
httpslidepdfcomreaderfullew-afgewerkte-final 5959
59
PRIEST E R Dynamics and Structure of Quiescent Solar Prominences Internet
(httpbooksgooglebe booksid=h599q3jz1w4Campdq=quiescent+prominencesampprintsec=fro
ntcoverampsource=blampots=58b79Qeyabampsig=1eklQ-
WszOIebZZaq7fq7gm6bxAamphl=nlampei=urPtSe7ZCo61-
Qa166jHDwampsa=Xampoi=book_resultampct=result ampresnum=3PPA6M2) 1989
RUSSELL R Rotation of the sun Internet
(httpwwwwindowsucaredutourlink=sunSolar_interior
Sun_layersdifferential_rotationhtml) 16082005
RUSSELL R Sunspots and magnetic fields Internet
(httpwwwwindowsucaredutourlink=sunatmospheresunspot_magnetismhtmlampedu=hig
h) 060908
UNIVERSITY OF GLASGOW Bibliography of Peter Sweet Internet
(httpwwwuniversitystoryglaacuk biographyid=WH2144amptype=P) (10042009)
WIKIPEDIA Orbiting Solar Observatory Internet
(httpenwikipediaorgwikiOrbiting_Solar_Observatory) 24012009
WINDOWS TEAM Maunderrsquos Butterfly Diagram Internet
(httpwwwwindowsucaredutourlink=sun activitybutterflyhtml) 2000
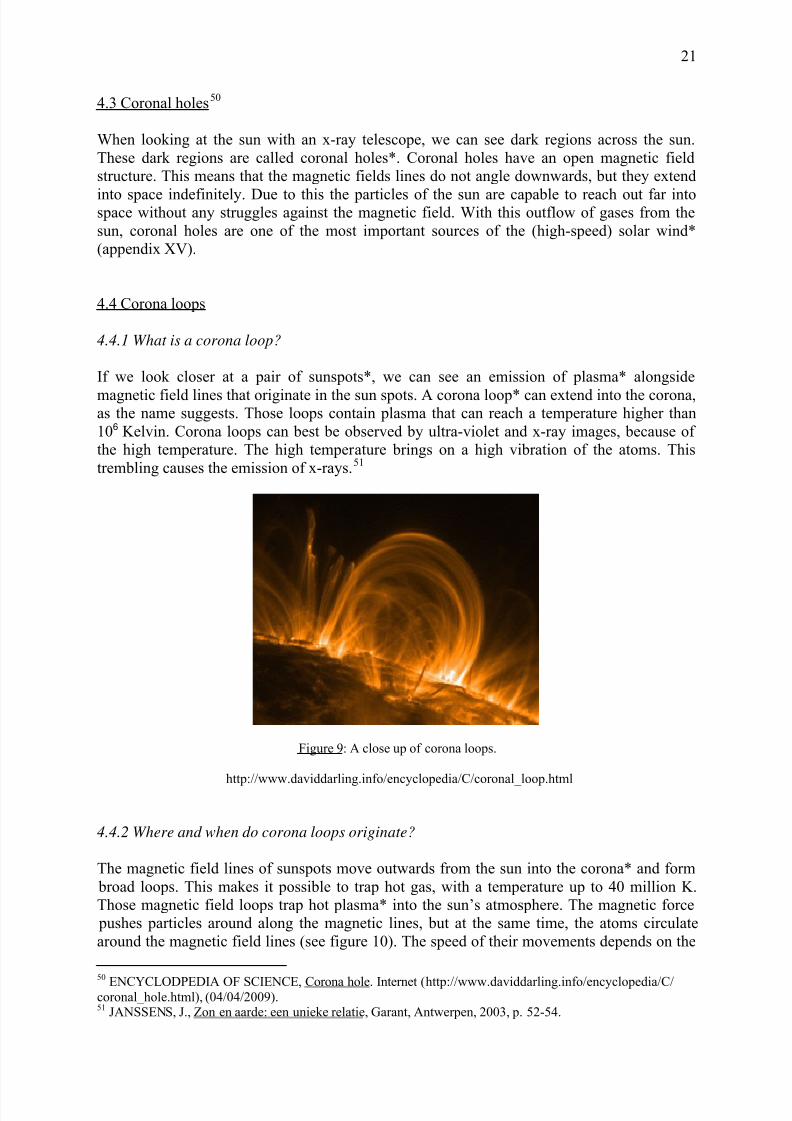
832019 Ew Afgewerkte Final
httpslidepdfcomreaderfullew-afgewerkte-final 2159
21
43 Coronal holes50
When looking at the sun with an x-ray telescope we can see dark regions across the sun
These dark regions are called coronal holes Coronal holes have an open magnetic field
structure This means that the magnetic fields lines do not angle downwards but they extend
into space indefinitely Due to this the particles of the sun are capable to reach out far intospace without any struggles against the magnetic field With this outflow of gases from the
sun coronal holes are one of the most important sources of the (high-speed) solar wind
(appendix XV)
44 Corona loops
441 What is a corona loop
If we look closer at a pair of sunspots we can see an emission of plasma alongside
magnetic field lines that originate in the sun spots A corona loop can extend into the coronaas the name suggests Those loops contain plasma that can reach a temperature higher than
106 Kelvin Corona loops can best be observed by ultra-violet and x-ray images because of
the high temperature The high temper ature brings on a high vibration of the atoms This
trembling causes the emission of x-rays51
Figure 9 A close up of corona loops
httpwwwdaviddarlinginfoencyclopediaCcoronal_loophtml
442 Where and when do corona loops originate
The magnetic field lines of sunspots move outwards from the sun into the corona and form
broad loops This makes it possible to trap hot gas with a temperature up to 40 million K
Those magnetic field loops trap hot plasma into the sunrsquos atmosphere The magnetic force
pushes particles around along the magnetic lines but at the same time the atoms circulate
around the magnetic field lines (see figure 10) The speed of their movements depends on the
50
ENCYCLODPEDIA OF SCIENCE Corona hole Internet (httpwwwdaviddarlinginfoencyclopediaC coronal_holehtml) (04042009)51 JANSSENS J Zon en aarde een unieke relatie Garant Antwerpen 2003 p 52-54
832019 Ew Afgewerkte Final
httpslidepdfcomreaderfullew-afgewerkte-final 2259
22
density of the magnetic field So if a particle moves from the top of a loop to the bottom it
will slow down just like in traffic jams Eventually it will reach the bottom but the bottom is
highly compressed (because the magnetic field lines converge at the bottom of the loops) so
that the particle will be shot back along the magnetic field line (see figure 10)
Figure 10 the movement of particles in corona loops
GD HOLMAN lsquoThe mysterious origins of solar flaresrsquo Scientific America April 2006 p24-29 volume 294number 4
Hence the particles will move up and down along the magnetic field lines Atoms that are
charged the same will cause electric currents (just like in a battery) These currents will
generate a new magnetic field and the old magnetic field in combination with the new one
will cause a high distortion in the magnetic field of the sun This is the moment when the
corona loop will transform into a solar flare
45 Solar flare52
451 What is a solar flare
A solar flare is a sudden powerful explosion in the solar atmosphere caused by a disruption
in the magnetic field of the sun Because of the disruption mass from the sun will be movedup and form a solar flare A solar flare can equal the energy of billions of atomic bombs
within a few minutes The strongest solar flares are measured during the solar maximums
because then the sunrsquos magnetic activity is the strongest53 Since the sunspots in the presence
of solar flare have a very high magnetic field it is likely that a solar flare would even have a
higher magnetic field But in reality the magnetic field of a solar flare is only half of the
magnetic field of a sunspot The intensity of the magnetic field is lsquoonlyrsquo 500 Gauss54
52 HOLMAN GD lsquoThe mysterious origins of solar flaresrsquo Scientific America April 2006 p 24-31 volume
294 number 453JANSSENS J Zon en aarde een unieke relatie Garant Antwerpen 2003 p 55-57
54 JANSSENS J lsquoZonnefakkelsrsquo Heelal Oktober 1994 p 256
832019 Ew Afgewerkte Final
httpslidepdfcomreaderfullew-afgewerkte-final 2359
23
Figure 11 You can see the magnetic fieldlines in the solar flare on the right side
Large solar flare recorded by SOHO EIT304 instrument 512x512 version Animation (980kMPEG) CourtesySOHO(ESAampNASA)
httpwwwteachersparadisecomencyenwikipediassusunhtml
452 Where and how do sun flares originate
Astronomers have long been speculating how solar flares exactly originate In 1992 Satoshi
Masuda (graduated at the University of Tokyo) discovered on pictures of the Japanese
Yohkoh Satellite that the far end of a solar flare emitted unusually short wavelengths very
short x-rays The source must be a concentration of gas with a temperature of about 100million K concluded Masuda But this discovery provoked some new questions why was the
high temperature at the top of the flare and not at the bottom where the gas is more compact
Why does the plasma stay confined instead of spreading out into the universe In order to
obtain more information to try to solve this problem astronomers started observing the sunrsquos
radiation of ultraviolet and x-rays frequently In 2002 NASA even launched the RHESSI
(Ramaty High Energy Solar Spectroscopic Imager) which was intended to bring solar flares
into pictures55
These observations provided evidence that sun flares surge up in regions where the magnetic
field is very strong ndashmost common in the presence of sun spots At this point we have to call
over the corona loops As mentioned before corona loops are electric currents of atoms
which move alongside magnetic field lines When the atoms are shot back alongside the
magnetic field line there seems to occur a distortion of the magnetic field This distortion will
end up in a solar flare All the mass of the corona loop will be shot into space and form a solar
flare
But how can such enormous mass of the solar flares be shot into s pace This has been a very
interesting question However Peter Alan Sweet (1921-2005)56 succeeded in finding an
55 GD HOLMAN lsquoThe mysterious origins of solar flaresrsquo Scientific America April 2006 p 27 volume 294
number 456UNIVERSITY OF GLASGOW Bibliography of Peter Sweet Internet (httpwwwuniversitystoryglaacuk
biographyid=WH2144amptype=P) (10042009)
832019 Ew Afgewerkte Final
httpslidepdfcomreaderfullew-afgewerkte-final 2459
24
answer already in 1956 If magnetic field lines break apart and then reconnect they bring
together two opposing fields that will cancel each other and cause a huge burst of energy The
reconnection will create new magnetic field lines This reconnection is called the Sweet-
Parker reconnection Yet this is a slow reconnection which cannot take place at the base of a
solar flare with a dazzling speed Fortunately Harry P Petschek published an article about
reconnection in 1964 and solved that problem under certain circumstances it is possible toreconnect much faster which explains solar flares This faster reconnection is also called the
Petschek reconnection But unfortunately with the current technology it is not yet possible to
take pictures of those reconnections57
If the energy comes from the reconnection then where does this reconnection take place
From pictures of solar flares astronomers discovered that at the top of the corona loop a
mysterious x-ray source was found The x-ray source began to give a higher energy level and
at the same time the particles move down towards the sunrsquos surface Yet the x-ray source
stays at the same placehellipThen when the x-rays reach their maximum the loop suddenly
changes direction But this time the x-ray source will move upwards too unexpectedly it
moves at the speed of light approximately three hundred thousands kilometres an hour awayfrom the sun This is the same speed as the coronal mass ejections
46 Coronal mass ejections
461 What is a coronal mass ejection58
Coronal mass ejections (CMErsquos) (appendix XVI) are huge amounts of gas some billions of
plasma from the sun that are ejected into space Their temperature can reach 25 million K59
A coronal mass ejection can last for several hours and it can at last enter the solar wind A
CME can reach a speed of 50kms- 2000kms which means more than 7 million kilometres
an hour60 The mass of a large CME varies from 5 x 10⁶ to 5 x 10¹³ kg61 During a solar
maximum there are more coronal mass ejections than during a minimum but they can occur
at any time of the solar cycle Coronal mass ejections are related both to solar flares and
prominences Very heavy coronal mass ejections can cause some geomagnetic storms on
earth
462 Reconnection
The reconnection of a solar flare can end up in a coronal mass ejection When magneticfield lines that are opposite are starting to reconnect and form new magnetic field lines half of
the magnetic field lines will point downwards and join some existing magnetic loops
However the other part of the magnetic field lines will move upwards at a very high speed
and will form some loops more upwards Between those loops that moved downwards and
those that moved upwards there is some mass that isnrsquot connected to the sun anymore It is
57GD HOLMAN lsquoThe mysterious origins of solar flaresrsquo Scientific America April 2006 p 29 volume 294
number 458
BRAEUNIG R A Glossary Internet (httpwwwbraeunigusspaceglossaryhtm) 200659 LILENSTEN J and BORNAREL J Sous les feux du soleil EDP Sciences Les Ulis Cedex A 2001 p 4460 Cuypers J and others lsquoLa rechercheacute en heacuteliophysique en Belgiquersquo Space connection October 2007 p 10-
1161GREEN SF and JONES M H An introduction to the Sun and Stars The Open University Cambridge
2004 p 68
832019 Ew Afgewerkte Final
httpslidepdfcomreaderfullew-afgewerkte-final 2559
25
known that for an amount of solar flares that this mass between the loops will end up in a
coronal mass ejection Yet this doesnrsquot count for all the solar flares The coronal mass
ejection only takes place if the magnetic field lines twist around each other while forming the
letter lsquoSrsquo (see figure 12)62
Figure 12 Here you can see the reconnection that takes place before the coronal mass ejection starts
httpwwwnasagovmission_pagessolar-bsolar_005html
Certainly we will be capable to answer all the questions about solar flares and coronal mass
ejections in the nearby future But there are also some very interesting questions left what is
at the basis of the acceleration of the atoms in solar flares How does magnetic reconnection
originate Hopefully we will find the answers in the near future
47 Solar wind
471 What is the solar wind
Every second of every day of the year the sunrsquos corona emits a continuous stream of mass
from the sun The temperature of the corona is so high that the sunrsquos magnetic field just
cannot control the outflow of particles We know that the particles are accelerated but
astronomers cannot explain all the details about the solar wind yet
472 What do we know about the solar wind
The speed of the solar wind can change it differs from 300kmh up to 800kmh This speed
depends on the outflow of gases If there is a corona hole pointing towards the earth the solar
wind will reach a speed of around 800kmh The different speeds can interact with each other
and form a new speed according to the rules of light emission When two emissions connect
with each other they can form a faster or slower solar wind just like waves can interact and
form new waves
62BOEN B Birth of a coronal mass ejection Internet (httpwwwnasagovmission_pagessolar-b
solar_005html) 290408
832019 Ew Afgewerkte Final
httpslidepdfcomreaderfullew-afgewerkte-final 2659
26
The ionized atoms with very high temperature coming from the sunrsquos corona are one of the
most important parts of the solar wind but the magnetic fields are important too The
magnetic field outside the sun gets wrapped into a spiral called the Parker-spiral named after
the scientist who described it as the first one (because the sun rotates) This influences the
magnetic field of the sun from the outside The solar wind is emitted in spiral too (see figure
13)
Figure 13 The course of the solar wind caused by the rotation of the sun
httpheliosgsfcnasagovsolarmaghtml
473 Heliosphere
We can describe the heliosphere as a gigantic magnetic bubble around the sun This is
everywhere in space till where the sunrsquos magnetic field reaches and still has an influence The
heliosphere is filled with solar wind although the solar wind has a very low density Yet it
is a very hot wind but because of the very low density it does not have such a great influence
on earth However it can cause some energetic storms on earth63
63 NASA The heliosphere Internet (httpheliosgsfcnasagovheliosphhtml) 20012009
832019 Ew Afgewerkte Final
httpslidepdfcomreaderfullew-afgewerkte-final 2759
27
Conclusion
The sunrsquos magnetic field is a complex system to understand Yet I hope you have learned a
lot from this paper and that you do understand the exiting phenomena described in the
previous chapters
We can discuss the sunrsquos magnetic field from two perspectives The first one is looking at the
magnetic field for global long-term changing dimensions The second way is based on
phenomena on lower scale
The global changes involve the solar cycle and the switch of the magnetic poles The solar
cycle is divided into a decrease of the solar activity until it reaches solar minimum and an
increase of the solar activity until it reaches solar maximum The frequency of the phenomena
that can be found in the outer layers of the sun are directly connected to the solar activity and
thus to the solar cycle Sunspots are the easiest to see they appear as black spots against the
much brighter surface of the sun Corona loops are connected to sunspots and can extend into
solar flares and solar prominences These flares and prominences can burst out into a coronalmass ejection All these phenomena influence the sun and its solar wind how small their part
may be The solar wind has a directly influence on the earth
There is still much to be discovered Astronomers hope to discover much more about the
magnetic field of the sun Today many astronomers and scientists are observing the sun and
every day they discover more and more aspects of the sun Recently a group of researchers
led by David Jess of Queens University Belfast has revealed why the sunrsquos atmosphere is
hotter than its surface64 As you can see astronomy is a very developing science
64
CORDIS Researchers reveal why Suns atmosphere is hotter than its surface Internet (httpcordiseuropaeusearchindexcfmfuseaction=newsdocumentampN_LANG=ENampN_RCN=30598amppid=0ampq=87F36474805A6BEC0B89404F72D0351Famptype=sim) 20032009
832019 Ew Afgewerkte Final
httpslidepdfcomreaderfullew-afgewerkte-final 2859
28
Glossary
Absorption lines A dark line superimposed on a continuous spectrum when a gas absorbs
light from a continuous source that is hotter than the absorbing gas
Aurora Light radiated by atoms and ions formed by the solar wind in the earthrsquos upper atmosphere seen most commonly in the polar regions
Chromosphere The layer in the solar atmosphere between the photosphere and the corona It
is the lowest layer of the atmosphere characterized by reddish hue and by an increase of the
temperature with altitude through all but its lower regions
Convection The transfer of heat from a region of high temperature to a region of lower
temperature by the displacement of the cooler molecules by the warmer molecules The hot
gas will be moved upwards the cool gas will be pushed downwards into the sun
Corona The sunrsquos outer atmosphere It is very extensive and has a very low density It isextremely hot
Coronal hole A dark region of the sunrsquos inner corona as seen at X-ray wavelengths
Coronal loop Closed loops of magnetic field lines extending from the sunrsquos photosphere into
the corona which contain plasma at high temperature They are typically observed through
ultraviolet or x-ray emission from the hot plasma
Coronal mass ejection Large volumes of high energy gas released from the sunrsquos corona
Differential rotation The rotation of a non rigid object in which parts at different latitudes or
different radial distances move at different speeds
Dynamo theory The generation of a magnetic field by circulating electric charges
Eclipse The blocking of a part or all of the light from the moon by the earth (lunar eclipse) or
from the sun by the moon (solar eclipse)
Emission lines Emission lines are used in physics chemistry and astronomy to determine
what kind of gas is doing the emission Every element has a different electronic structure and
will thus have a different emission line fingerprint Emission lines are produced whenelectrons in atoms jump from one energy level to lower energy level
Filament A dark curve seen above the sunrsquos photosphere that is the top view of a solar
prominence
Flux tube Is a generally tube-like (cylindrical) region of space containing a magnetic field
such that the field at the side surfaces is parallel to them Both the cross-sectional area of the
tube and the field contained may vary along the length of the tube but the magnetic flux is
always constant
832019 Ew Afgewerkte Final
httpslidepdfcomreaderfullew-afgewerkte-final 2959
29
Geomagnetic storm When unusually strong surges of solar wind (charged particles from the
Sun) hit the Earth This effect causes variations in the magnetic field which surrounds the
Earth The visible results are eg the aurora (Northern and Southern lights)
Granulation Granules are related to the convective zone The granulation that shows up in the
photosphere is a result of the rising and falling of hot gas that takes place in the convectivezone
Hα absorption line An absorption line due to an electronic transition in hydrogen atoms in
which the atom absorbs a photon so that the electron makes a transition from a state
corresponding to the electronic energy level with n=2 to the one above with n=3 The photon
wavelength in a vacuum is 6563 nm
Heliosphere The volume of space within which the sun through the solar wind influences its
environment in the interstellar medium
Magnetic dynamo A theory that explains phenomena of the solar cycle as a result of periodicwinding and unwinding of the sunrsquos magnetic field in the solar atmosphere
Magnetic reconnection A process taking place in a plasma in which neighbouring
oppositely directed magnetic field lines suddenly part and reconnect in a new configuration
The abrupt change in a magnetic field represented by this process can release large amounts
of energy and it is thought to be important in explaining solar flares and other phenomena
Penumbra The portion of a shadow in which only part of the light source is covered by the
shadow-making body
Photosphere The region in the solar atmosphere from which most of the visible light escapes
into space
Plasma A fourth state of matter (not found naturally on Earth) of very hot gases Plasma is a
fluid with the ability to carry electric currents with no local accumulations of electric charge
Prominence Flamelike protrusion seen near the limb of the sun and extending into the solar
corona The side view of a filament
Quantum theory A theory in physics based on the principle that matter and energy have the
properties of both particles and waves created to explain the radiation of energy from a blackbody the photoelectric effect and the Bohr theory and now used to account for a wide
range of physical phenomena including the existence of discrete packets of energy and
matter the uncertainty principle and the exclusion principle Itrsquos a theory of the interaction of
matter and radiation developed early in the twentieth century which is based on the
quantization of energy and applied to a wide variety of processes that involve an exchange of
energy at the atomic level
Reconnection See magnetic reconnection
Solar cycle A 22-year-cycle during which the sunrsquos magnetic field reverses its polarity twice
Solar flare A violent eruption on the sunrsquos surface
832019 Ew Afgewerkte Final
httpslidepdfcomreaderfullew-afgewerkte-final 3059
30
Solar wind An outward flow of particles (mostly electrons and protons) from the sun
Solstice Either of two points along the ecliptic at which the Sun reaches its maximum
distance north or south of the celestial equator
Spectroscopy Concerns the production and study of spectra
Spectrum The result of electromagnetic radiation passing through a prism or grating so that
different wavelengths are separated
Spicule Short-lived (lifetime from rising to falling is about 15 minutes) jets vertical to the
solar surface that are several thousand kilometres long and about 1 kilometre thick (see also
appendix IV) in the solar chromosphere
Sunspot A temporary cool region in the solar photosphere created by protruding magnetic
fields
Umbra The central completely dark portion of a shadow
Zeemaneffect A splitting of spectra lines in the presence of a magnetic field
Bibliography and webography of the glossary
COMINS NF and KAUFMANN III WJ Discovering the universe eighth edition WH
Freeman and Company New York 2008 535 p
GREEN SF and JONES M H An introduction to the Sun and Stars The Open University
Cambridge 2004 373 p
httpenmimihuastronomygranulationhtml
httpenmimihuastronomyplasmahtml
httpwwwspacecomspacewatchspace_weather_glossaryhtml
httpenmimihuastronomyemission_linehtml
httpenmimihuastronomyabsorption_linehtml
httpwwwpbsorgfaithandreasonphysglossqm-bodyhtml
httpwwwanswerscomtopicquantum-theory
httpenwikipediaorgwikiFlux_tube
832019 Ew Afgewerkte Final
httpslidepdfcomreaderfullew-afgewerkte-final 3159
31
Appendix I The sun in figures
Physical quantity Comment
Radius 695 510 km 109 x earths radius
Mass 1989 x1030 kg 332 946 earths mass
Mass sun in the solar
system
9986 Total mass sun total mass of
our solar system
Volume 1412 x10sup3sup3 cmsup3 13 million x earths volume
Age 455 milliard years
Luminosity 3854 x 10sup3sup3 ergss
Magnitude -2773
Density center 1513 gcmsup3
Density mean 1409 gcmsup3
Pressure center 2334 x1011 bars
Pressure photosphere 00001 bar
Temperature center 15 557 000deg K
Temperature photosphere 5 780deg K Various sources mention
different grades
Temperature corona 2 000 000 to 3 000 000deg K
Rotation time at North or
South pole
up to 35 days on earth
Rotation time at Equator 25 days on earth The difference in rotation
times is called differential
rotation
Rotation time general 2538 days on earth
Mean distance sun-earth
(AU)
14959787 x108 km 1 AU = 1 Astronomical Unit
= 149 598 000 km
Chemical composition of
the sun ( of total number
of atoms)
Hydrogen 921
Helium 78
All others 01
Various sources mention
slightly different percentages
832019 Ew Afgewerkte Final
httpslidepdfcomreaderfullew-afgewerkte-final 3259
32
Chemical composition of
the sun ( of total mass)
Hydrogen 7346
Helium 2485
All others 169
Various sources mention
slightly different percentages
Total transforming of
hydrogen into helium persecond
700 billions of kilograms of
hydrogen are transformedinto 6957 billions of
kilograms of helium each
second
Based on the following references
- BEATTY JK PETERSEN CC and CHAIKIN A The new solar system fourth edition
Cambridge University Press Cambridge 1999 p 421
- LILENSTEN J and BORNAREL J Sous les feux du soleil EDP Sciences Les Ulis
Cedex A 2001 p 247
- LANG KR Sun earth and sky Springer Germany 1995 p 282- DENTHIER T Het zonnestelsel Standaard Uitgeverij 1992 p 415
- JANSSENS J Zon en aarde een unieke relatie Garant Antwerpen 2003 p 254- VOLKSSTERRENWACHT URANIA VZW De zon Internet(httpwwwuraniabesterrenkundezonnestelselzonphp) (01012009)
832019 Ew Afgewerkte Final
httpslidepdfcomreaderfullew-afgewerkte-final 3359
33
Appendix II Anatomy of the sun
httpwwwcosmographicacomgalleryinfographicssolar_anatomyhtml
The middle the sun consists of a heavy core this consists of plasma just as the outer layers
of the sun but the pressure in the core is so high that it behaves much more like a solid bodyThe most outer layer is the corona it reaches far into space More to the inside there is the
chromosphere and then the photosphere The corona the chromosphere and the
photosphere are explained in chapter 1
832019 Ew Afgewerkte Final
httpslidepdfcomreaderfullew-afgewerkte-final 3459
34
Appendix III Granulation
httpwwwwindowsucaredutourlink=sunSolar_interiorsolar_furnacehtml
At the surface of the sun we can find granules These are created by convection the warmest
parts of the sunrsquos interior move upwards and the colder parts at the surface move downwardsThis causes currents of plasma The dark lines are the colder particles We see them darker
because they emit less light than their surrounding neighbourhood
832019 Ew Afgewerkte Final
httpslidepdfcomreaderfullew-afgewerkte-final 3559
35
Appendix IV Spicules
Picture httplpc1clpccdcccauslpcharpellastro20a20deinfo_s09htmInformation httpwwwdaviddarlinginfoencyclopediaSspiculehtml
On this picture you can see spicules Spicules only last for several minutes and can be foundin the chromosphere They are little jets of gas There also exist macrospicules that can be
approximately ten times larger than a normal spicule
832019 Ew Afgewerkte Final
httpslidepdfcomreaderfullew-afgewerkte-final 3659
36
Appendix V The most important satellites observing the sun
Here you can find the most important satellites observing the sun and their missions
Solar and Heliospheric Obseratory (SOHO)
httpsohowwwnascomnasagovaboutabouthtml
SOHO the Solar amp Heliospheric Observatory is a project of international collaboration
between ESA and NASA to study the Sun from its deep core to the outer corona and the solar
wind
SOHO was launched on December 2 1995 The SOHO spacecraft was built in Europe by an
industry team led by prime contractor Matra Marconi Space (now EADS Astrium) under
overall management by ESA The twelve instruments on board SOHO were provided by
European and American scientists Nine of the international instrument consortia are led by
European Principal Investigators (PIs) three by PIs from the US Large engineering teamsand more than 200 co-investigators from many institutions supported the PIs in the
development of the instruments and in the preparation of their operations and data analysis
NASA was responsible for the launch and is now responsible for mission operations Large
radio dishes around the world which form NASAs Deep Space Network are used for data
downlink and commanding Mission control is based at Goddard Space Flight Center in
Maryland
More information about SOHO can be found on
httpsohowwwnascomnasagovaboutdocsSOHO_Fact_Sheetpdf
832019 Ew Afgewerkte Final
httpslidepdfcomreaderfullew-afgewerkte-final 3759
37
Transition Region and Coronal Explorer (TRACE)
httptracelmsalcomProjectMissionmissionhtm
TRACE enables solar physicists to study the connections between fine-scale magnetic fields
and the associated plasma structures on the Sun in a quantitative way by observing the photosphere the transition region and the corona With TRACE these temperature domains
are observed nearly simultaneously (with as little delay as only a second between different
wavelengths) with a spatial resolution of one second of arc
This is accomplished by obtaining precisely coaligned image sequences of photosphere
transition region and corona with high spatial resolution and uninterrupted viewing of the
Sun for up to eight months
TRACE Mission
TRACE explores the magnetic field in the solar atmosphere by studyingbull The 3-dimensional field structure
bull Its temporal evolution in response to photospheric flows
bull The time-dependent coronal fine structure
bull The coronal and transition region thermal topology
TRACE was launched on a Pegasus launch vehicle from Vandenberg Air Force Base in April
1998 The launch was scheduled to allow joint observations with SOHO during the rising
phase of the solar cycle to sunspot maximum No transition region or coronal imager has
witnessed the onset and rise of a solar cycle
Pegasus in flight
The two satellites provide complementary observations TRACE produces the high spatial
and temporal resolution images while SoHO yields images and spectral data out to 30 solar
radii at much lower spatial and temporal resolution Jointly they provide the opportunity to
obtain simultaneous digital measurements of all the temperature regimes of the solar
atmosphere in both high-resolution imaging and spectroscopy
With these data we expect to shatter the current ignorance of coronal heating and impulsive
MHD phenomena with benefits not only to solar physics but also to studies ranging from
stellar activity to the MHD of accretion disks The magnetograms produced by MDI on SoHO
provide a complete record of the eruption and distribution of photosphere magnetic fields
which will be invaluable for understanding TRACE observations of coronal hole formation
and coronal mass ejections Both of these phenomena have profound effects on our space
environment and the Earth`s magnetic field
TRACE is the first US solar research satellite since the Solar Maximum Mission
Coordination with SOHO provides an unprecedented opportunity to follow the emergence of
magnetic flux from the base of the convection zone deep inside the Sun through the
photosphere chromosphere and transitional region to the low-beta outer corona while
observing the effects of this emergence such as coronal mass ejections with high spatial andtemporal resolution
832019 Ew Afgewerkte Final
httpslidepdfcomreaderfullew-afgewerkte-final 3859
38
The transition from the photosphere where magnetic fields and plasma are in rough
equipartition to the corona where magnetic fields dominate is extremely difficult to model
and until recently to observe at high temporal and spatial resolution Many of the physical
problems that arise here such as plasma confinement reconnection wave propagation and plasma heating arise throughout space physics and astrophysics The detailed study of these
processed in the solar outer atmosphere is invaluable to astrophysics in general and stellar
studies in particular
More information about TRACE observations can be found on
httptracelmsalcomOperationsGeneraloperatiohtm
832019 Ew Afgewerkte Final
httpslidepdfcomreaderfullew-afgewerkte-final 3959
39
Reuven Ramaty High Energy Solar Spectroscopic Imager (RHESSI)
httphesperiagsfcnasagovhessibrochurehtm
What Questions will HESSI Address
bull How is such a large amount of energy released so rapidly during a flare
bull How are so many electrons and protons accelerated so quickly to such high energies
bull Where are the electrons and protons accelerated in the solar atmosphere and where do
they deposit their energy
How will HESSI Address these Questions
HESSI shown below will concentrate on electrons and protons accelerated in solar flares
through observations of the X-rays and gamma rays that they produce
bull HESSI will obtain the first ever X-ray and gamma-ray images of flares from 100 keV
to 20 MeVbull HESSI will do the first ever nuclear gamma-ray line spectroscopy of solar flares
bull HESSI will obtain pictures of flares in X-rays with an angular resolution of 2
arcseconds a factor of three better than previously possible
bull HESSI will measure X-ray and gamma-ray spectra with less than 1 keV energy
resolution a factor of 20-40 better than previously possible with scintillation counters
More information about the RHESSIrsquos Mission can be found on
httphesperiagsfcnasagovhessiconcepthtm
832019 Ew Afgewerkte Final
httpslidepdfcomreaderfullew-afgewerkte-final 4059
40
Solar Radiation and Climate Experiment (SORCE)
httplaspcoloradoedusorcesciencebackgroundhtm
The Solar Radiation and Climate Experiment (SORCE) is a NASA-sponsored satellite
mission that is providing state-of-the-art measurements of incoming x-ray ultraviolet visiblenear-infrared and total solar radiation The measurements provided by SORCE specifically
address long-term climate change natural variability and enhanced climate prediction and
atmospheric ozone and UV-B radiation These measurements are critical to studies of the Sun
its effect on our Earth system and its influence on humankind
The SORCE spacecraft was launched on January 25 2003 on a Pegasus XL launch vehicle to
provide NASAs Earth Science Enterprise (ESE) with precise measurements of solar
radiation It launched into a 645 km 40 degree orbit and is operated by the Laboratory for
Atmospheric and Space Physics (LASP) at the University of Colorado (CU) in Boulder
Colorado USA It will continue the precise measurements of total solar irradiance (TSI) that
began with the ERB instrument in 1979 and has continued to the present with the ACRIM series of measurements SORCE will also provide the measurements of the solar spectral
irradiance from 1nm to 2000nm accounting for 95 of the spectral contribution to TSI
SORCE carries four instruments including the Spectral Irradiance Monitor (SIM) Solar
Stellar Irradiance Comparison Experiment (SOLSTICE) Total Irradiance Monitor (TIM) and
the XUV Photometer System (XPS)
The primary goal of the NASA Earth Observing Systems (EOS) SOlar Radiation and Climate
Experiment (SORCE) is to enable solar-terrestrial studies by providing precise daily
measurements of the total solar irradiance (TSI) and the solar spectral irradiance atwavelengths extending from the ultraviolet to the near infrared The following lists the
SORCE science objectives
1 Make accurate measurements with high precision of total solar irradiance connect
them to previous TSI measurements and continue this long-term climate record
Provide TSI with an accuracy of 001 (100 parts per million) based on SI units and
with a long-term repeatability of 0001yr
2 Make daily measurements of the solar ultraviolet irradiance from 120 to 300 nm with
a spectral resolution of 1 nm Achieve this spectral irradiance measurement with an
accuracy of better than 5 and with a long-term repeatability of 05yr Use the
solarstellar comparison technique to relate the solar irradiance to the ensembleaverage flux from a number of bright early-type stars (same stars used by the UARS
SOLSTICE program)
3 Make the first measurements of the visible and near IR solar irradiance with sufficient
precision for future climate studies Obtain daily measurements of solar spectral
irradiance between 03 and 2 microm with a spectral resolution of at least 130 an
accuracy of 003 and a long-term repeatability of better than 001yr
4 Improve the understanding of how and why solar irradiance varies estimate past and
future solar behavior and investigate climate responses
More information about SORCE can be found on
httplaspcoloradoedusorcesciencescience_opshtm
832019 Ew Afgewerkte Final
httpslidepdfcomreaderfullew-afgewerkte-final 4159
41
Appendix VI Wavelengths
httpeosweblarcnasagovEDDOCSWavelengths_for_Colorshtml
As you can see on the figure visible light situates in the centre of the wavelengths having not
the shortest nor the longest wavelengths Gamma rays have the shortest wavelength radioways the longest All sort of wavelengths are used for daily purpose like radio waves for
radio and TV and gamma rays for treatments
832019 Ew Afgewerkte Final
httpslidepdfcomreaderfullew-afgewerkte-final 4259
42
Appendix VII Absorption lines in the sunrsquos spectrum
Picture httpwwwsolarnavigatornetthe_sunhtmExplanation COMINS NF and KAUFMANN III WJ Discovering the universe eighth edition WHFreeman and Company New York 2008 p 109
This photo is called a spectrogram It contains the spectrum of the sun All the black lines are
absorption lines The amount of black lines is related to the amount of elements that the sun
is emitting From a spectrogram we can deduct a lot of things including their mass the
temperature of the surface the chemical composition of the sun rotation rates and much
more
832019 Ew Afgewerkte Final
httpslidepdfcomreaderfullew-afgewerkte-final 4359
832019 Ew Afgewerkte Final
httpslidepdfcomreaderfullew-afgewerkte-final 4459
44
Appendix IX Butterfly-diagram
httpspacesciencespacerefcomsslpadsolarimagesbflygif
A butterfly-diagram
In a butterfly-diagram we can find the sunspots with their latitude (y-axis) through the years(x-axis) As you can see the sunspots appear like lsquobutterfliesrsquo this was discovered in 1904 by
Edward Maunder (1851-1928 an English astronomer best remembered for his study of
sunspots and the solar magnetic cycle) Thatrsquos why this graph is also called Maunders
butterfly diagram
832019 Ew Afgewerkte Final
httpslidepdfcomreaderfullew-afgewerkte-final 4559
45
Appendix X The Wolf-numbers
httpsidcomabenews106sunspotnumberclarifiedpdf
The sunspot number clarified By Petra Vanlommel
Which kinds of daily International Sunspot Numbers (ISN) are currentlypublished by the SIDC
Three daily indices are currently published by the SIDCthe Estimated ISN (EISN)the Provisional ISN (PISN)the Definitive ISN (DISN)Although they are all based on the same type of observations ie visual sunspot counts as ameasure of solar activity they are obtained from different data sets by different processingmethods with different accuracies and they serve different purposes
In the ideal case the three numbers are equal but in practice it is inevitable that there aresmall differences Therefore It is useful to explain what each index actually means
What is the source of the Wolf number
Once per day observers worldwide communicate their measured Wolf number (= 10G + S)based on visual sunspot (S) and group (G) counts to the World Data Center for the SunspotIndex Presently this is done through a dedicated password-protected WEB form the Wolfinterface However some observers still use the old way of reporting their observations onpaper through regular mail This method slows down the final processing but for the sake ofcontinuity in the index it is important to keep these observers included as some of them
represent the longest individual datasetsThe observers give the exact observing time the observing conditions the total numbers(group count sunspot count and Wolf number) and optionally the NorthSouth and centralzone numbers The observers using the web interface can provide their results to the SIDCimmediately after each observation However some users prefer to insert their data as ablock creating some delay but this must be done at least once a month
The personal reduction coefficient K
A personal reduction coefficient K is calculated for each station It has values typically in therange 04 and 17 and leads to a normalized sunspot number K(10G+S) In other words theK factor rescales the raw sunspot counts of each observer to the ones of Rudolph Wolf the
astronomer who introduced the above Wolf formula thus simulating the same eyes sametelescope and same conditionsDuring the procedure for calculating the Provisional ISN the K factor of every station iscomputed for every observation that passes the elimination procedure Once a year apersonal K factor for every station and for every month of the previous year is calculated Ayearly mean K value per station is also computed
The estimated sunspot index
The Estimated ISN (EISN) is calculated and issued on a daily basis for the day of calculationand the day before Only the total EISN is calculated with no hemispheric index It is anautomated procedure and no manual intervention is done The EISN is meant as a quicktemporary and approximate index for real-time applications
832019 Ew Afgewerkte Final
httpslidepdfcomreaderfullew-afgewerkte-final 4659
46
We use the raw Wolf number from all observatories that have provided counts early in theday ie before 1230 UT Typically there is between 10 and 20 stations available Thecalculation of the EISN is based on a simple and straightforward statistical method The Wolfnumbers are multiplied with the yearly mean K factor (see paragraph about the personalreduction coefficient K) The EISN is a simple average of the K-scaled values after excludingany individual value that deviates abnormally from the other valuesOnce the Provisional ISN (PISN) is calculated after the end of a month the temporary EISNis dropped and replaced by the PISN
The provisional sunspot Index
The Provisional ISN (PISN) is calculated and issued on the first of every month Theoutcome is a daily total and hemispheric sunspot number for the entire elapsed month Anexample on the first of September we calculate the daily PISN for each day of August ThePISN is computed semi-automatically with as little manual intervention as possibleTo calculate the PISN values for the concerned month we use all Wolf numbers Typicallythere is data from around 65 stations available
The calculation of the PISN is based on an extensive statistical treatment This treatmentfilters out any abnormal daily observation or the complete data set from an erratic station(quality control) This prevents long-term drifts in the resulting index One of the key elementsderived from this processing is to update the K reduction coefficients for each station theevolution of each station is monitored for each day relative to the entire networkA subset of the contributing stations also provides hemispheric counts A similar process isapplied to the North and South counts to derive the hemispheric PISN There is an additionalconstraint the sum of the North and South ISN must match the total ISNThe PISN replaces the EISN And once the Definitive ISN (DISN) is calculated the DISNreplaces the PISN
The definitive sunspot index
The Definitive ISN is calculated and issued on a quarterly basis when we have collecteddata from all the contributing observatories This is the final index and it is appended to thehistorical sunspot index time series The same semi-automated treatment as for the PISN isnow applied to the full data set If the result agrees within 5 of the PISN value the PISN iskept and becomes definitive Otherwise the new calculated value replaces the PISN andbecomes the definitive ISNIt is only at this stage and only in peculiar situations that a manual verification by ourscientific staff is required For example this happens when the observed raw Wolf valuesfrom the whole network are clustered around two distinct values This special case can becaused by small short-lived isolated sunspots (lifetimes lt 24 hours) or by the appearance ordisappearance of a large group at the solar limb in the course of one UT dayThe DISN replaces the provisional and estimated International Sunspot Number
Handling very low activity levels
One of the situations requiring a human arbitration is associated with single small isolatedand short-lived sunspots This is most noticeable around the minimum of the solar activitycycle like the one occurring now in 2008 Due to the 24hour binning (observations aregrouped between 0hUT and 24hUT) and the variable ability of each observer to detect thesmallest sunspots we end up with some stations reporting one sunspot and others who didno see any sunspot Let us explain further No sunspot may mean that the sunspot waspresent but the observer was unable to see it because of poor observational conditions such
as weather a small telescope On the other hand it may also indicate that the sunspot hadactually vanished by that time while it was present earlier on the same day
832019 Ew Afgewerkte Final
httpslidepdfcomreaderfullew-afgewerkte-final 4759
47
Individual stations do not observe at exactly the same timeIn order to validate the existence of such a marginal reported sunspot a qualified SIDCscientist must then check the detailed chronology within that day and consider the overallobserver capability (value of K coefficient)In common practice the fact that a sunspot is reported by a significant group of observersleads to the inclusion of the sunspot on that date thus neglecting the no-sunspotobservationsThe rationale is multiple observations of a sunspot exclude the possibility that the reportedsunspot was an independent false detection So a sunspot was really present on that dayalthough it may have existed only for part of the day or it was small enough to be missed bypart of the observers with smaller instruments or imperfect atmospheric conditionsAlso keep in mind that the sunspot index is derived with a limited precision just like any otherindex If the monthly mean sunspot number is 0 or 05 you can definitely say that activitywas low
What index should be used
If you want to perform long-term investigations the definitive ISN series is definitely the mostsuitable However there is a delay of a few months So when investigating the last cycle andrecent evolution use the definitive numbers in combination with the provisional ISN to be upto date to the last month The provisional numbers are also used in models forecasting thesunspot number for the coming months Now if you need a proxy for solar activity in a modelthat runs in real-time then you may use the estimated ISNImprovements and rethinking of the processing method is an ongoing project We arecurrently developing an alternative program for calculating the PISN Of course long-termconsistency is vital Therefore a cross-analysis between the output from the old and newsoftware must be applied over an extended period
832019 Ew Afgewerkte Final
httpslidepdfcomreaderfullew-afgewerkte-final 4859
48
Above graphs show different kinds of the International Sunspot Number The left plot gives an overview from 1700 up to now from the yearly (black) and monthly smoothed Sunspot Number The graph in the right top corner shows the monthly and monthly smoothed sunspot number while the graph in the right bottom corner show the daily monthly smoothed monthly sunspot number For every the time range of investigation there is an appropriate sunspot number
832019 Ew Afgewerkte Final
httpslidepdfcomreaderfullew-afgewerkte-final 4959
49
Appendix XI Filaments and prominences
httpsohowwwnascomnasagovpickoftheweekold26feb2004
This is a picture taken by SOHO on 26 February 2004
832019 Ew Afgewerkte Final
httpslidepdfcomreaderfullew-afgewerkte-final 5059
50
Appendix XII The reconnection of magnetic loops
httpwwwioporgEJarticle0004-637X558287253575webpdfrequest-id=73e38daa-69ae-4e01-b9a6- b4bd0ba071dd
In (a) sunspot B and C have different polarity and move towards each other The twomagnetic loops will reconnect and form one big magnetic loop showed in (b) This will
happen to other magnetic loops too as can be seen in (c) When G en F are close enough they
will reconnect and so E en H will reconnect too It is possible that the magnetic field line is
trapped around another in this case AD The mass ejected from the sun will be trapped
between the magnetic field lines and form a solar prominence
832019 Ew Afgewerkte Final
httpslidepdfcomreaderfullew-afgewerkte-final 5159
832019 Ew Afgewerkte Final
httpslidepdfcomreaderfullew-afgewerkte-final 5259
52
httptheinvisibleagentwordpresscom20090117amazing-celestial-images
An group of active prominences
httpapodnasagovapodap051109html
httpwhassupinthemilkywayblogspotcom200903cloudy-planhtml
A picture taken by SOHO In the left corner you can see the prominence with twisted
magnetic field lines
832019 Ew Afgewerkte Final
httpslidepdfcomreaderfullew-afgewerkte-final 5359
53
Appendix XIV Polar crown
httpsciencenasagovheadlinesy200817sep_polarcrownhtm
Photograph of a polar crown taken on 13 June 1999 by the Meudon Observatory
832019 Ew Afgewerkte Final
httpslidepdfcomreaderfullew-afgewerkte-final 5459
54
Appendix XV Coronal holes
httpsunearthdaynasagov2007multimediagal_020php
The black segment is a huge coronal hole The bright parts are x-rays from sunspots
832019 Ew Afgewerkte Final
httpslidepdfcomreaderfullew-afgewerkte-final 5559
55
Appendix XVI Coronal mass ejection
httpzuserver2staruclacuk~idhapodap000309html
Picture of a CME taken by SOHO in February 2000
832019 Ew Afgewerkte Final
httpslidepdfcomreaderfullew-afgewerkte-final 5659
56
Bibliography
Books
BEATTY JK PETERSEN CC and CHAIKIN A The new solar system fourth edition
Cambridge University Press Cambridge 1999 421 p
COMINS NF and KAUFMANN III WJ Discovering the universe eighth edition WH
Freeman and Company New York 2008 535 p
DETHIER T Het zonnestelsel Standaard Uitgeverij 1992 415 p
GOLUB L and PASACHOFF JM Nearest star the surprising science of our sun Harvard
university press Harvard 2001 267 p
GREEN SF and JONES M H An introduction to the Sun and Stars The Open University
Cambridge 2004 373 p
HILL S and CARLOWITZ M The sun Abrams New York 2006 239 p
HOLMAN GD lsquoThe mysterious origins of solar flaresrsquo Scientific America April 2006 p
24-31 volume 294 number 4
JANSSENS J Zon en aarde een unieke relatie Garant Antwerpen 2003 254 p
KELLER H-U Van Supernovarsquos tot zwarte gaten Tirion Natuur AH Baarn 2003 169 p
LANG KR Sun earth and sky Springer Germany 1995 282 p
LILENSTEN J and BORNAREL J Sous les feux du soleil EDP Sciences Les Ulis Cedex
A 2001 247 p
832019 Ew Afgewerkte Final
httpslidepdfcomreaderfullew-afgewerkte-final 5759
57
Articles
CUYPERS J and others lsquoLa rechercheacute en heacuteliophysique en Belgiquersquo Space connection
October 2007 20 p
DE KEYSER J lsquoDe magnetopauzersquo Heelal maart 1998 p 66-73
JANSSENS J lsquoHet maximum van de 23ste zonnevlekkencyclus (I)rsquo Heelal Oktober 1998 p
256-263
JANSSENS J lsquohet maximum van de 23ste zonnenvlekkencyclus (II)rsquo Heelal November
1998 p 284-290
JANSSENS J lsquoZonnefakkelsrsquo Heelal Oktober 1994 p 256-261
SMITS F lsquoDe coronarsquo Heelal Februari 1999 p 40-42
SMITS F lsquoProtuberanzenrsquo Heelal Juli 1991 p 182-185
VAN DEN BERGHE S lsquoHet Zeemaneffectrsquo Heelal September 1998 p 228-231
832019 Ew Afgewerkte Final
httpslidepdfcomreaderfullew-afgewerkte-final 5859
58
Webography
BOEN B Birth of a coronal mass ejection Internet
(httpwwwnasagovmission_pagessolar-b solar_005html) 290408
BRAEUNIG R A Glossary Internet (httpwwwbraeunigusspaceglossaryhtm) 2006
CORDIS Researchers reveal why Suns atmosphere is hotter than its surface Internet
(httpcordiseuropaeusearchindexcfmfuseaction=newsdocumentampN_LANG=ENampN_R
CN=30598amppid=0ampq=87F36474805A6BEC0B89404F72D0351Famptype=sim) 20032009
DAY C Alfveacuten waves may heat the Sunrsquos corona Internet
(httpblogsphysicstodayorgupdate200903 alfven-waves-may-heat-the-sunshtml)
310309
ELLERMAN F Solar prominences Internet (httparticlesadsabsharvardedufull
1928ASPL173E 0000074000html) (03042009)
ENCYCLODPEDIA OF SCIENCE Corona hole Internet
(httpwwwdaviddarlinginfoencyclopediaC coronal_holehtml) (04042009)
HATHAWAY D H The sunspot cycle Internet
(httpspacesciencespacerefcomsslpadsolarsunspots htm) 04012000
JANSSENS J The case of the missing solar cycle (published in lsquoheelalrsquo January 2008)
Internet (httpuserstelenetbejjanssensMSCwebEngpdf)
KNISELY D Solar prominences Internet
(httpwwwicstarscomHTMLSolarSectionHAlphaOBSERVINGTHESUNHAlpha3html)
(03042009)
KOPANSKI J Atom Internet (httpknolgooglecomkjan-
kopanskiatom1amrwrct7rvi27) 060209
MARTENS PC and ZWAAN C Origin and evolution of filament-prominence systems
Internet (http wwwioporgEJarticle0004-637X558287253575webpdfrequest-
id=73e38daa-69ae-4e01-b9a6-b4bd0ba071dd) 092001
NASA The corona Internet (httpsolarsciencemsfcnasagovcoronashtml) 180107
NASA The heliosphere Internet (httpheliosgsfcnasagovheliosphhtml) 20012009
OFFICIAL SITE OF STONEHENGE About Stonehenge Internet
(httpwwwstonehengecouk) (03022009)
OTTERSDORF M Astronomy On the sunspot cycle Internet
(httpuserszoominternetnet~matto MCASsunspot_cyclehtmZeemaneffect) 031103
PARIAT E and SCHMIEDER B Magnetic flux emergence Internet(httpwwwscholarpediaorgarticleMagnetic_field_emergence) 18042008
832019 Ew Afgewerkte Final
httpslidepdfcomreaderfullew-afgewerkte-final 5959
59
PRIEST E R Dynamics and Structure of Quiescent Solar Prominences Internet
(httpbooksgooglebe booksid=h599q3jz1w4Campdq=quiescent+prominencesampprintsec=fro
ntcoverampsource=blampots=58b79Qeyabampsig=1eklQ-
WszOIebZZaq7fq7gm6bxAamphl=nlampei=urPtSe7ZCo61-
Qa166jHDwampsa=Xampoi=book_resultampct=result ampresnum=3PPA6M2) 1989
RUSSELL R Rotation of the sun Internet
(httpwwwwindowsucaredutourlink=sunSolar_interior
Sun_layersdifferential_rotationhtml) 16082005
RUSSELL R Sunspots and magnetic fields Internet
(httpwwwwindowsucaredutourlink=sunatmospheresunspot_magnetismhtmlampedu=hig
h) 060908
UNIVERSITY OF GLASGOW Bibliography of Peter Sweet Internet
(httpwwwuniversitystoryglaacuk biographyid=WH2144amptype=P) (10042009)
WIKIPEDIA Orbiting Solar Observatory Internet
(httpenwikipediaorgwikiOrbiting_Solar_Observatory) 24012009
WINDOWS TEAM Maunderrsquos Butterfly Diagram Internet
(httpwwwwindowsucaredutourlink=sun activitybutterflyhtml) 2000
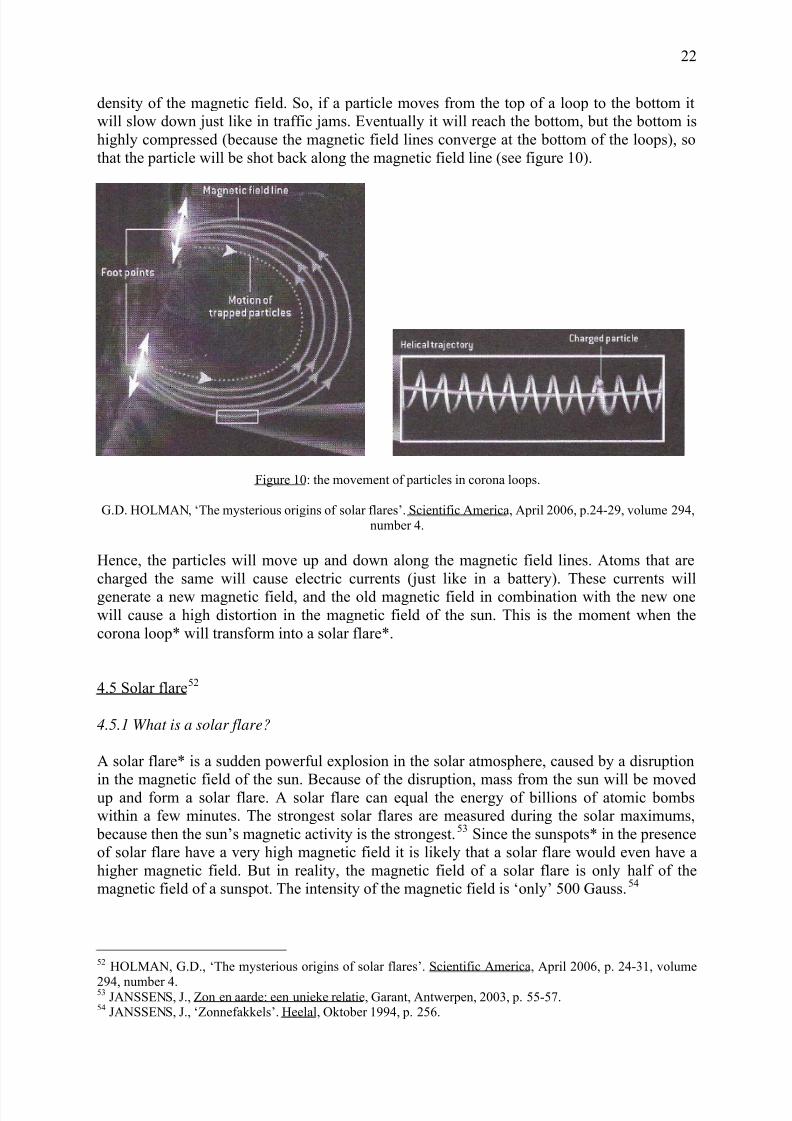
832019 Ew Afgewerkte Final
httpslidepdfcomreaderfullew-afgewerkte-final 2259
22
density of the magnetic field So if a particle moves from the top of a loop to the bottom it
will slow down just like in traffic jams Eventually it will reach the bottom but the bottom is
highly compressed (because the magnetic field lines converge at the bottom of the loops) so
that the particle will be shot back along the magnetic field line (see figure 10)
Figure 10 the movement of particles in corona loops
GD HOLMAN lsquoThe mysterious origins of solar flaresrsquo Scientific America April 2006 p24-29 volume 294number 4
Hence the particles will move up and down along the magnetic field lines Atoms that are
charged the same will cause electric currents (just like in a battery) These currents will
generate a new magnetic field and the old magnetic field in combination with the new one
will cause a high distortion in the magnetic field of the sun This is the moment when the
corona loop will transform into a solar flare
45 Solar flare52
451 What is a solar flare
A solar flare is a sudden powerful explosion in the solar atmosphere caused by a disruption
in the magnetic field of the sun Because of the disruption mass from the sun will be movedup and form a solar flare A solar flare can equal the energy of billions of atomic bombs
within a few minutes The strongest solar flares are measured during the solar maximums
because then the sunrsquos magnetic activity is the strongest53 Since the sunspots in the presence
of solar flare have a very high magnetic field it is likely that a solar flare would even have a
higher magnetic field But in reality the magnetic field of a solar flare is only half of the
magnetic field of a sunspot The intensity of the magnetic field is lsquoonlyrsquo 500 Gauss54
52 HOLMAN GD lsquoThe mysterious origins of solar flaresrsquo Scientific America April 2006 p 24-31 volume
294 number 453JANSSENS J Zon en aarde een unieke relatie Garant Antwerpen 2003 p 55-57
54 JANSSENS J lsquoZonnefakkelsrsquo Heelal Oktober 1994 p 256
832019 Ew Afgewerkte Final
httpslidepdfcomreaderfullew-afgewerkte-final 2359
23
Figure 11 You can see the magnetic fieldlines in the solar flare on the right side
Large solar flare recorded by SOHO EIT304 instrument 512x512 version Animation (980kMPEG) CourtesySOHO(ESAampNASA)
httpwwwteachersparadisecomencyenwikipediassusunhtml
452 Where and how do sun flares originate
Astronomers have long been speculating how solar flares exactly originate In 1992 Satoshi
Masuda (graduated at the University of Tokyo) discovered on pictures of the Japanese
Yohkoh Satellite that the far end of a solar flare emitted unusually short wavelengths very
short x-rays The source must be a concentration of gas with a temperature of about 100million K concluded Masuda But this discovery provoked some new questions why was the
high temperature at the top of the flare and not at the bottom where the gas is more compact
Why does the plasma stay confined instead of spreading out into the universe In order to
obtain more information to try to solve this problem astronomers started observing the sunrsquos
radiation of ultraviolet and x-rays frequently In 2002 NASA even launched the RHESSI
(Ramaty High Energy Solar Spectroscopic Imager) which was intended to bring solar flares
into pictures55
These observations provided evidence that sun flares surge up in regions where the magnetic
field is very strong ndashmost common in the presence of sun spots At this point we have to call
over the corona loops As mentioned before corona loops are electric currents of atoms
which move alongside magnetic field lines When the atoms are shot back alongside the
magnetic field line there seems to occur a distortion of the magnetic field This distortion will
end up in a solar flare All the mass of the corona loop will be shot into space and form a solar
flare
But how can such enormous mass of the solar flares be shot into s pace This has been a very
interesting question However Peter Alan Sweet (1921-2005)56 succeeded in finding an
55 GD HOLMAN lsquoThe mysterious origins of solar flaresrsquo Scientific America April 2006 p 27 volume 294
number 456UNIVERSITY OF GLASGOW Bibliography of Peter Sweet Internet (httpwwwuniversitystoryglaacuk
biographyid=WH2144amptype=P) (10042009)
832019 Ew Afgewerkte Final
httpslidepdfcomreaderfullew-afgewerkte-final 2459
24
answer already in 1956 If magnetic field lines break apart and then reconnect they bring
together two opposing fields that will cancel each other and cause a huge burst of energy The
reconnection will create new magnetic field lines This reconnection is called the Sweet-
Parker reconnection Yet this is a slow reconnection which cannot take place at the base of a
solar flare with a dazzling speed Fortunately Harry P Petschek published an article about
reconnection in 1964 and solved that problem under certain circumstances it is possible toreconnect much faster which explains solar flares This faster reconnection is also called the
Petschek reconnection But unfortunately with the current technology it is not yet possible to
take pictures of those reconnections57
If the energy comes from the reconnection then where does this reconnection take place
From pictures of solar flares astronomers discovered that at the top of the corona loop a
mysterious x-ray source was found The x-ray source began to give a higher energy level and
at the same time the particles move down towards the sunrsquos surface Yet the x-ray source
stays at the same placehellipThen when the x-rays reach their maximum the loop suddenly
changes direction But this time the x-ray source will move upwards too unexpectedly it
moves at the speed of light approximately three hundred thousands kilometres an hour awayfrom the sun This is the same speed as the coronal mass ejections
46 Coronal mass ejections
461 What is a coronal mass ejection58
Coronal mass ejections (CMErsquos) (appendix XVI) are huge amounts of gas some billions of
plasma from the sun that are ejected into space Their temperature can reach 25 million K59
A coronal mass ejection can last for several hours and it can at last enter the solar wind A
CME can reach a speed of 50kms- 2000kms which means more than 7 million kilometres
an hour60 The mass of a large CME varies from 5 x 10⁶ to 5 x 10¹³ kg61 During a solar
maximum there are more coronal mass ejections than during a minimum but they can occur
at any time of the solar cycle Coronal mass ejections are related both to solar flares and
prominences Very heavy coronal mass ejections can cause some geomagnetic storms on
earth
462 Reconnection
The reconnection of a solar flare can end up in a coronal mass ejection When magneticfield lines that are opposite are starting to reconnect and form new magnetic field lines half of
the magnetic field lines will point downwards and join some existing magnetic loops
However the other part of the magnetic field lines will move upwards at a very high speed
and will form some loops more upwards Between those loops that moved downwards and
those that moved upwards there is some mass that isnrsquot connected to the sun anymore It is
57GD HOLMAN lsquoThe mysterious origins of solar flaresrsquo Scientific America April 2006 p 29 volume 294
number 458
BRAEUNIG R A Glossary Internet (httpwwwbraeunigusspaceglossaryhtm) 200659 LILENSTEN J and BORNAREL J Sous les feux du soleil EDP Sciences Les Ulis Cedex A 2001 p 4460 Cuypers J and others lsquoLa rechercheacute en heacuteliophysique en Belgiquersquo Space connection October 2007 p 10-
1161GREEN SF and JONES M H An introduction to the Sun and Stars The Open University Cambridge
2004 p 68
832019 Ew Afgewerkte Final
httpslidepdfcomreaderfullew-afgewerkte-final 2559
25
known that for an amount of solar flares that this mass between the loops will end up in a
coronal mass ejection Yet this doesnrsquot count for all the solar flares The coronal mass
ejection only takes place if the magnetic field lines twist around each other while forming the
letter lsquoSrsquo (see figure 12)62
Figure 12 Here you can see the reconnection that takes place before the coronal mass ejection starts
httpwwwnasagovmission_pagessolar-bsolar_005html
Certainly we will be capable to answer all the questions about solar flares and coronal mass
ejections in the nearby future But there are also some very interesting questions left what is
at the basis of the acceleration of the atoms in solar flares How does magnetic reconnection
originate Hopefully we will find the answers in the near future
47 Solar wind
471 What is the solar wind
Every second of every day of the year the sunrsquos corona emits a continuous stream of mass
from the sun The temperature of the corona is so high that the sunrsquos magnetic field just
cannot control the outflow of particles We know that the particles are accelerated but
astronomers cannot explain all the details about the solar wind yet
472 What do we know about the solar wind
The speed of the solar wind can change it differs from 300kmh up to 800kmh This speed
depends on the outflow of gases If there is a corona hole pointing towards the earth the solar
wind will reach a speed of around 800kmh The different speeds can interact with each other
and form a new speed according to the rules of light emission When two emissions connect
with each other they can form a faster or slower solar wind just like waves can interact and
form new waves
62BOEN B Birth of a coronal mass ejection Internet (httpwwwnasagovmission_pagessolar-b
solar_005html) 290408
832019 Ew Afgewerkte Final
httpslidepdfcomreaderfullew-afgewerkte-final 2659
26
The ionized atoms with very high temperature coming from the sunrsquos corona are one of the
most important parts of the solar wind but the magnetic fields are important too The
magnetic field outside the sun gets wrapped into a spiral called the Parker-spiral named after
the scientist who described it as the first one (because the sun rotates) This influences the
magnetic field of the sun from the outside The solar wind is emitted in spiral too (see figure
13)
Figure 13 The course of the solar wind caused by the rotation of the sun
httpheliosgsfcnasagovsolarmaghtml
473 Heliosphere
We can describe the heliosphere as a gigantic magnetic bubble around the sun This is
everywhere in space till where the sunrsquos magnetic field reaches and still has an influence The
heliosphere is filled with solar wind although the solar wind has a very low density Yet it
is a very hot wind but because of the very low density it does not have such a great influence
on earth However it can cause some energetic storms on earth63
63 NASA The heliosphere Internet (httpheliosgsfcnasagovheliosphhtml) 20012009
832019 Ew Afgewerkte Final
httpslidepdfcomreaderfullew-afgewerkte-final 2759
27
Conclusion
The sunrsquos magnetic field is a complex system to understand Yet I hope you have learned a
lot from this paper and that you do understand the exiting phenomena described in the
previous chapters
We can discuss the sunrsquos magnetic field from two perspectives The first one is looking at the
magnetic field for global long-term changing dimensions The second way is based on
phenomena on lower scale
The global changes involve the solar cycle and the switch of the magnetic poles The solar
cycle is divided into a decrease of the solar activity until it reaches solar minimum and an
increase of the solar activity until it reaches solar maximum The frequency of the phenomena
that can be found in the outer layers of the sun are directly connected to the solar activity and
thus to the solar cycle Sunspots are the easiest to see they appear as black spots against the
much brighter surface of the sun Corona loops are connected to sunspots and can extend into
solar flares and solar prominences These flares and prominences can burst out into a coronalmass ejection All these phenomena influence the sun and its solar wind how small their part
may be The solar wind has a directly influence on the earth
There is still much to be discovered Astronomers hope to discover much more about the
magnetic field of the sun Today many astronomers and scientists are observing the sun and
every day they discover more and more aspects of the sun Recently a group of researchers
led by David Jess of Queens University Belfast has revealed why the sunrsquos atmosphere is
hotter than its surface64 As you can see astronomy is a very developing science
64
CORDIS Researchers reveal why Suns atmosphere is hotter than its surface Internet (httpcordiseuropaeusearchindexcfmfuseaction=newsdocumentampN_LANG=ENampN_RCN=30598amppid=0ampq=87F36474805A6BEC0B89404F72D0351Famptype=sim) 20032009
832019 Ew Afgewerkte Final
httpslidepdfcomreaderfullew-afgewerkte-final 2859
28
Glossary
Absorption lines A dark line superimposed on a continuous spectrum when a gas absorbs
light from a continuous source that is hotter than the absorbing gas
Aurora Light radiated by atoms and ions formed by the solar wind in the earthrsquos upper atmosphere seen most commonly in the polar regions
Chromosphere The layer in the solar atmosphere between the photosphere and the corona It
is the lowest layer of the atmosphere characterized by reddish hue and by an increase of the
temperature with altitude through all but its lower regions
Convection The transfer of heat from a region of high temperature to a region of lower
temperature by the displacement of the cooler molecules by the warmer molecules The hot
gas will be moved upwards the cool gas will be pushed downwards into the sun
Corona The sunrsquos outer atmosphere It is very extensive and has a very low density It isextremely hot
Coronal hole A dark region of the sunrsquos inner corona as seen at X-ray wavelengths
Coronal loop Closed loops of magnetic field lines extending from the sunrsquos photosphere into
the corona which contain plasma at high temperature They are typically observed through
ultraviolet or x-ray emission from the hot plasma
Coronal mass ejection Large volumes of high energy gas released from the sunrsquos corona
Differential rotation The rotation of a non rigid object in which parts at different latitudes or
different radial distances move at different speeds
Dynamo theory The generation of a magnetic field by circulating electric charges
Eclipse The blocking of a part or all of the light from the moon by the earth (lunar eclipse) or
from the sun by the moon (solar eclipse)
Emission lines Emission lines are used in physics chemistry and astronomy to determine
what kind of gas is doing the emission Every element has a different electronic structure and
will thus have a different emission line fingerprint Emission lines are produced whenelectrons in atoms jump from one energy level to lower energy level
Filament A dark curve seen above the sunrsquos photosphere that is the top view of a solar
prominence
Flux tube Is a generally tube-like (cylindrical) region of space containing a magnetic field
such that the field at the side surfaces is parallel to them Both the cross-sectional area of the
tube and the field contained may vary along the length of the tube but the magnetic flux is
always constant
832019 Ew Afgewerkte Final
httpslidepdfcomreaderfullew-afgewerkte-final 2959
29
Geomagnetic storm When unusually strong surges of solar wind (charged particles from the
Sun) hit the Earth This effect causes variations in the magnetic field which surrounds the
Earth The visible results are eg the aurora (Northern and Southern lights)
Granulation Granules are related to the convective zone The granulation that shows up in the
photosphere is a result of the rising and falling of hot gas that takes place in the convectivezone
Hα absorption line An absorption line due to an electronic transition in hydrogen atoms in
which the atom absorbs a photon so that the electron makes a transition from a state
corresponding to the electronic energy level with n=2 to the one above with n=3 The photon
wavelength in a vacuum is 6563 nm
Heliosphere The volume of space within which the sun through the solar wind influences its
environment in the interstellar medium
Magnetic dynamo A theory that explains phenomena of the solar cycle as a result of periodicwinding and unwinding of the sunrsquos magnetic field in the solar atmosphere
Magnetic reconnection A process taking place in a plasma in which neighbouring
oppositely directed magnetic field lines suddenly part and reconnect in a new configuration
The abrupt change in a magnetic field represented by this process can release large amounts
of energy and it is thought to be important in explaining solar flares and other phenomena
Penumbra The portion of a shadow in which only part of the light source is covered by the
shadow-making body
Photosphere The region in the solar atmosphere from which most of the visible light escapes
into space
Plasma A fourth state of matter (not found naturally on Earth) of very hot gases Plasma is a
fluid with the ability to carry electric currents with no local accumulations of electric charge
Prominence Flamelike protrusion seen near the limb of the sun and extending into the solar
corona The side view of a filament
Quantum theory A theory in physics based on the principle that matter and energy have the
properties of both particles and waves created to explain the radiation of energy from a blackbody the photoelectric effect and the Bohr theory and now used to account for a wide
range of physical phenomena including the existence of discrete packets of energy and
matter the uncertainty principle and the exclusion principle Itrsquos a theory of the interaction of
matter and radiation developed early in the twentieth century which is based on the
quantization of energy and applied to a wide variety of processes that involve an exchange of
energy at the atomic level
Reconnection See magnetic reconnection
Solar cycle A 22-year-cycle during which the sunrsquos magnetic field reverses its polarity twice
Solar flare A violent eruption on the sunrsquos surface
832019 Ew Afgewerkte Final
httpslidepdfcomreaderfullew-afgewerkte-final 3059
30
Solar wind An outward flow of particles (mostly electrons and protons) from the sun
Solstice Either of two points along the ecliptic at which the Sun reaches its maximum
distance north or south of the celestial equator
Spectroscopy Concerns the production and study of spectra
Spectrum The result of electromagnetic radiation passing through a prism or grating so that
different wavelengths are separated
Spicule Short-lived (lifetime from rising to falling is about 15 minutes) jets vertical to the
solar surface that are several thousand kilometres long and about 1 kilometre thick (see also
appendix IV) in the solar chromosphere
Sunspot A temporary cool region in the solar photosphere created by protruding magnetic
fields
Umbra The central completely dark portion of a shadow
Zeemaneffect A splitting of spectra lines in the presence of a magnetic field
Bibliography and webography of the glossary
COMINS NF and KAUFMANN III WJ Discovering the universe eighth edition WH
Freeman and Company New York 2008 535 p
GREEN SF and JONES M H An introduction to the Sun and Stars The Open University
Cambridge 2004 373 p
httpenmimihuastronomygranulationhtml
httpenmimihuastronomyplasmahtml
httpwwwspacecomspacewatchspace_weather_glossaryhtml
httpenmimihuastronomyemission_linehtml
httpenmimihuastronomyabsorption_linehtml
httpwwwpbsorgfaithandreasonphysglossqm-bodyhtml
httpwwwanswerscomtopicquantum-theory
httpenwikipediaorgwikiFlux_tube
832019 Ew Afgewerkte Final
httpslidepdfcomreaderfullew-afgewerkte-final 3159
31
Appendix I The sun in figures
Physical quantity Comment
Radius 695 510 km 109 x earths radius
Mass 1989 x1030 kg 332 946 earths mass
Mass sun in the solar
system
9986 Total mass sun total mass of
our solar system
Volume 1412 x10sup3sup3 cmsup3 13 million x earths volume
Age 455 milliard years
Luminosity 3854 x 10sup3sup3 ergss
Magnitude -2773
Density center 1513 gcmsup3
Density mean 1409 gcmsup3
Pressure center 2334 x1011 bars
Pressure photosphere 00001 bar
Temperature center 15 557 000deg K
Temperature photosphere 5 780deg K Various sources mention
different grades
Temperature corona 2 000 000 to 3 000 000deg K
Rotation time at North or
South pole
up to 35 days on earth
Rotation time at Equator 25 days on earth The difference in rotation
times is called differential
rotation
Rotation time general 2538 days on earth
Mean distance sun-earth
(AU)
14959787 x108 km 1 AU = 1 Astronomical Unit
= 149 598 000 km
Chemical composition of
the sun ( of total number
of atoms)
Hydrogen 921
Helium 78
All others 01
Various sources mention
slightly different percentages
832019 Ew Afgewerkte Final
httpslidepdfcomreaderfullew-afgewerkte-final 3259
32
Chemical composition of
the sun ( of total mass)
Hydrogen 7346
Helium 2485
All others 169
Various sources mention
slightly different percentages
Total transforming of
hydrogen into helium persecond
700 billions of kilograms of
hydrogen are transformedinto 6957 billions of
kilograms of helium each
second
Based on the following references
- BEATTY JK PETERSEN CC and CHAIKIN A The new solar system fourth edition
Cambridge University Press Cambridge 1999 p 421
- LILENSTEN J and BORNAREL J Sous les feux du soleil EDP Sciences Les Ulis
Cedex A 2001 p 247
- LANG KR Sun earth and sky Springer Germany 1995 p 282- DENTHIER T Het zonnestelsel Standaard Uitgeverij 1992 p 415
- JANSSENS J Zon en aarde een unieke relatie Garant Antwerpen 2003 p 254- VOLKSSTERRENWACHT URANIA VZW De zon Internet(httpwwwuraniabesterrenkundezonnestelselzonphp) (01012009)
832019 Ew Afgewerkte Final
httpslidepdfcomreaderfullew-afgewerkte-final 3359
33
Appendix II Anatomy of the sun
httpwwwcosmographicacomgalleryinfographicssolar_anatomyhtml
The middle the sun consists of a heavy core this consists of plasma just as the outer layers
of the sun but the pressure in the core is so high that it behaves much more like a solid bodyThe most outer layer is the corona it reaches far into space More to the inside there is the
chromosphere and then the photosphere The corona the chromosphere and the
photosphere are explained in chapter 1
832019 Ew Afgewerkte Final
httpslidepdfcomreaderfullew-afgewerkte-final 3459
34
Appendix III Granulation
httpwwwwindowsucaredutourlink=sunSolar_interiorsolar_furnacehtml
At the surface of the sun we can find granules These are created by convection the warmest
parts of the sunrsquos interior move upwards and the colder parts at the surface move downwardsThis causes currents of plasma The dark lines are the colder particles We see them darker
because they emit less light than their surrounding neighbourhood
832019 Ew Afgewerkte Final
httpslidepdfcomreaderfullew-afgewerkte-final 3559
35
Appendix IV Spicules
Picture httplpc1clpccdcccauslpcharpellastro20a20deinfo_s09htmInformation httpwwwdaviddarlinginfoencyclopediaSspiculehtml
On this picture you can see spicules Spicules only last for several minutes and can be foundin the chromosphere They are little jets of gas There also exist macrospicules that can be
approximately ten times larger than a normal spicule
832019 Ew Afgewerkte Final
httpslidepdfcomreaderfullew-afgewerkte-final 3659
36
Appendix V The most important satellites observing the sun
Here you can find the most important satellites observing the sun and their missions
Solar and Heliospheric Obseratory (SOHO)
httpsohowwwnascomnasagovaboutabouthtml
SOHO the Solar amp Heliospheric Observatory is a project of international collaboration
between ESA and NASA to study the Sun from its deep core to the outer corona and the solar
wind
SOHO was launched on December 2 1995 The SOHO spacecraft was built in Europe by an
industry team led by prime contractor Matra Marconi Space (now EADS Astrium) under
overall management by ESA The twelve instruments on board SOHO were provided by
European and American scientists Nine of the international instrument consortia are led by
European Principal Investigators (PIs) three by PIs from the US Large engineering teamsand more than 200 co-investigators from many institutions supported the PIs in the
development of the instruments and in the preparation of their operations and data analysis
NASA was responsible for the launch and is now responsible for mission operations Large
radio dishes around the world which form NASAs Deep Space Network are used for data
downlink and commanding Mission control is based at Goddard Space Flight Center in
Maryland
More information about SOHO can be found on
httpsohowwwnascomnasagovaboutdocsSOHO_Fact_Sheetpdf
832019 Ew Afgewerkte Final
httpslidepdfcomreaderfullew-afgewerkte-final 3759
37
Transition Region and Coronal Explorer (TRACE)
httptracelmsalcomProjectMissionmissionhtm
TRACE enables solar physicists to study the connections between fine-scale magnetic fields
and the associated plasma structures on the Sun in a quantitative way by observing the photosphere the transition region and the corona With TRACE these temperature domains
are observed nearly simultaneously (with as little delay as only a second between different
wavelengths) with a spatial resolution of one second of arc
This is accomplished by obtaining precisely coaligned image sequences of photosphere
transition region and corona with high spatial resolution and uninterrupted viewing of the
Sun for up to eight months
TRACE Mission
TRACE explores the magnetic field in the solar atmosphere by studyingbull The 3-dimensional field structure
bull Its temporal evolution in response to photospheric flows
bull The time-dependent coronal fine structure
bull The coronal and transition region thermal topology
TRACE was launched on a Pegasus launch vehicle from Vandenberg Air Force Base in April
1998 The launch was scheduled to allow joint observations with SOHO during the rising
phase of the solar cycle to sunspot maximum No transition region or coronal imager has
witnessed the onset and rise of a solar cycle
Pegasus in flight
The two satellites provide complementary observations TRACE produces the high spatial
and temporal resolution images while SoHO yields images and spectral data out to 30 solar
radii at much lower spatial and temporal resolution Jointly they provide the opportunity to
obtain simultaneous digital measurements of all the temperature regimes of the solar
atmosphere in both high-resolution imaging and spectroscopy
With these data we expect to shatter the current ignorance of coronal heating and impulsive
MHD phenomena with benefits not only to solar physics but also to studies ranging from
stellar activity to the MHD of accretion disks The magnetograms produced by MDI on SoHO
provide a complete record of the eruption and distribution of photosphere magnetic fields
which will be invaluable for understanding TRACE observations of coronal hole formation
and coronal mass ejections Both of these phenomena have profound effects on our space
environment and the Earth`s magnetic field
TRACE is the first US solar research satellite since the Solar Maximum Mission
Coordination with SOHO provides an unprecedented opportunity to follow the emergence of
magnetic flux from the base of the convection zone deep inside the Sun through the
photosphere chromosphere and transitional region to the low-beta outer corona while
observing the effects of this emergence such as coronal mass ejections with high spatial andtemporal resolution
832019 Ew Afgewerkte Final
httpslidepdfcomreaderfullew-afgewerkte-final 3859
38
The transition from the photosphere where magnetic fields and plasma are in rough
equipartition to the corona where magnetic fields dominate is extremely difficult to model
and until recently to observe at high temporal and spatial resolution Many of the physical
problems that arise here such as plasma confinement reconnection wave propagation and plasma heating arise throughout space physics and astrophysics The detailed study of these
processed in the solar outer atmosphere is invaluable to astrophysics in general and stellar
studies in particular
More information about TRACE observations can be found on
httptracelmsalcomOperationsGeneraloperatiohtm
832019 Ew Afgewerkte Final
httpslidepdfcomreaderfullew-afgewerkte-final 3959
39
Reuven Ramaty High Energy Solar Spectroscopic Imager (RHESSI)
httphesperiagsfcnasagovhessibrochurehtm
What Questions will HESSI Address
bull How is such a large amount of energy released so rapidly during a flare
bull How are so many electrons and protons accelerated so quickly to such high energies
bull Where are the electrons and protons accelerated in the solar atmosphere and where do
they deposit their energy
How will HESSI Address these Questions
HESSI shown below will concentrate on electrons and protons accelerated in solar flares
through observations of the X-rays and gamma rays that they produce
bull HESSI will obtain the first ever X-ray and gamma-ray images of flares from 100 keV
to 20 MeVbull HESSI will do the first ever nuclear gamma-ray line spectroscopy of solar flares
bull HESSI will obtain pictures of flares in X-rays with an angular resolution of 2
arcseconds a factor of three better than previously possible
bull HESSI will measure X-ray and gamma-ray spectra with less than 1 keV energy
resolution a factor of 20-40 better than previously possible with scintillation counters
More information about the RHESSIrsquos Mission can be found on
httphesperiagsfcnasagovhessiconcepthtm
832019 Ew Afgewerkte Final
httpslidepdfcomreaderfullew-afgewerkte-final 4059
40
Solar Radiation and Climate Experiment (SORCE)
httplaspcoloradoedusorcesciencebackgroundhtm
The Solar Radiation and Climate Experiment (SORCE) is a NASA-sponsored satellite
mission that is providing state-of-the-art measurements of incoming x-ray ultraviolet visiblenear-infrared and total solar radiation The measurements provided by SORCE specifically
address long-term climate change natural variability and enhanced climate prediction and
atmospheric ozone and UV-B radiation These measurements are critical to studies of the Sun
its effect on our Earth system and its influence on humankind
The SORCE spacecraft was launched on January 25 2003 on a Pegasus XL launch vehicle to
provide NASAs Earth Science Enterprise (ESE) with precise measurements of solar
radiation It launched into a 645 km 40 degree orbit and is operated by the Laboratory for
Atmospheric and Space Physics (LASP) at the University of Colorado (CU) in Boulder
Colorado USA It will continue the precise measurements of total solar irradiance (TSI) that
began with the ERB instrument in 1979 and has continued to the present with the ACRIM series of measurements SORCE will also provide the measurements of the solar spectral
irradiance from 1nm to 2000nm accounting for 95 of the spectral contribution to TSI
SORCE carries four instruments including the Spectral Irradiance Monitor (SIM) Solar
Stellar Irradiance Comparison Experiment (SOLSTICE) Total Irradiance Monitor (TIM) and
the XUV Photometer System (XPS)
The primary goal of the NASA Earth Observing Systems (EOS) SOlar Radiation and Climate
Experiment (SORCE) is to enable solar-terrestrial studies by providing precise daily
measurements of the total solar irradiance (TSI) and the solar spectral irradiance atwavelengths extending from the ultraviolet to the near infrared The following lists the
SORCE science objectives
1 Make accurate measurements with high precision of total solar irradiance connect
them to previous TSI measurements and continue this long-term climate record
Provide TSI with an accuracy of 001 (100 parts per million) based on SI units and
with a long-term repeatability of 0001yr
2 Make daily measurements of the solar ultraviolet irradiance from 120 to 300 nm with
a spectral resolution of 1 nm Achieve this spectral irradiance measurement with an
accuracy of better than 5 and with a long-term repeatability of 05yr Use the
solarstellar comparison technique to relate the solar irradiance to the ensembleaverage flux from a number of bright early-type stars (same stars used by the UARS
SOLSTICE program)
3 Make the first measurements of the visible and near IR solar irradiance with sufficient
precision for future climate studies Obtain daily measurements of solar spectral
irradiance between 03 and 2 microm with a spectral resolution of at least 130 an
accuracy of 003 and a long-term repeatability of better than 001yr
4 Improve the understanding of how and why solar irradiance varies estimate past and
future solar behavior and investigate climate responses
More information about SORCE can be found on
httplaspcoloradoedusorcesciencescience_opshtm
832019 Ew Afgewerkte Final
httpslidepdfcomreaderfullew-afgewerkte-final 4159
41
Appendix VI Wavelengths
httpeosweblarcnasagovEDDOCSWavelengths_for_Colorshtml
As you can see on the figure visible light situates in the centre of the wavelengths having not
the shortest nor the longest wavelengths Gamma rays have the shortest wavelength radioways the longest All sort of wavelengths are used for daily purpose like radio waves for
radio and TV and gamma rays for treatments
832019 Ew Afgewerkte Final
httpslidepdfcomreaderfullew-afgewerkte-final 4259
42
Appendix VII Absorption lines in the sunrsquos spectrum
Picture httpwwwsolarnavigatornetthe_sunhtmExplanation COMINS NF and KAUFMANN III WJ Discovering the universe eighth edition WHFreeman and Company New York 2008 p 109
This photo is called a spectrogram It contains the spectrum of the sun All the black lines are
absorption lines The amount of black lines is related to the amount of elements that the sun
is emitting From a spectrogram we can deduct a lot of things including their mass the
temperature of the surface the chemical composition of the sun rotation rates and much
more
832019 Ew Afgewerkte Final
httpslidepdfcomreaderfullew-afgewerkte-final 4359
832019 Ew Afgewerkte Final
httpslidepdfcomreaderfullew-afgewerkte-final 4459
44
Appendix IX Butterfly-diagram
httpspacesciencespacerefcomsslpadsolarimagesbflygif
A butterfly-diagram
In a butterfly-diagram we can find the sunspots with their latitude (y-axis) through the years(x-axis) As you can see the sunspots appear like lsquobutterfliesrsquo this was discovered in 1904 by
Edward Maunder (1851-1928 an English astronomer best remembered for his study of
sunspots and the solar magnetic cycle) Thatrsquos why this graph is also called Maunders
butterfly diagram
832019 Ew Afgewerkte Final
httpslidepdfcomreaderfullew-afgewerkte-final 4559
45
Appendix X The Wolf-numbers
httpsidcomabenews106sunspotnumberclarifiedpdf
The sunspot number clarified By Petra Vanlommel
Which kinds of daily International Sunspot Numbers (ISN) are currentlypublished by the SIDC
Three daily indices are currently published by the SIDCthe Estimated ISN (EISN)the Provisional ISN (PISN)the Definitive ISN (DISN)Although they are all based on the same type of observations ie visual sunspot counts as ameasure of solar activity they are obtained from different data sets by different processingmethods with different accuracies and they serve different purposes
In the ideal case the three numbers are equal but in practice it is inevitable that there aresmall differences Therefore It is useful to explain what each index actually means
What is the source of the Wolf number
Once per day observers worldwide communicate their measured Wolf number (= 10G + S)based on visual sunspot (S) and group (G) counts to the World Data Center for the SunspotIndex Presently this is done through a dedicated password-protected WEB form the Wolfinterface However some observers still use the old way of reporting their observations onpaper through regular mail This method slows down the final processing but for the sake ofcontinuity in the index it is important to keep these observers included as some of them
represent the longest individual datasetsThe observers give the exact observing time the observing conditions the total numbers(group count sunspot count and Wolf number) and optionally the NorthSouth and centralzone numbers The observers using the web interface can provide their results to the SIDCimmediately after each observation However some users prefer to insert their data as ablock creating some delay but this must be done at least once a month
The personal reduction coefficient K
A personal reduction coefficient K is calculated for each station It has values typically in therange 04 and 17 and leads to a normalized sunspot number K(10G+S) In other words theK factor rescales the raw sunspot counts of each observer to the ones of Rudolph Wolf the
astronomer who introduced the above Wolf formula thus simulating the same eyes sametelescope and same conditionsDuring the procedure for calculating the Provisional ISN the K factor of every station iscomputed for every observation that passes the elimination procedure Once a year apersonal K factor for every station and for every month of the previous year is calculated Ayearly mean K value per station is also computed
The estimated sunspot index
The Estimated ISN (EISN) is calculated and issued on a daily basis for the day of calculationand the day before Only the total EISN is calculated with no hemispheric index It is anautomated procedure and no manual intervention is done The EISN is meant as a quicktemporary and approximate index for real-time applications
832019 Ew Afgewerkte Final
httpslidepdfcomreaderfullew-afgewerkte-final 4659
46
We use the raw Wolf number from all observatories that have provided counts early in theday ie before 1230 UT Typically there is between 10 and 20 stations available Thecalculation of the EISN is based on a simple and straightforward statistical method The Wolfnumbers are multiplied with the yearly mean K factor (see paragraph about the personalreduction coefficient K) The EISN is a simple average of the K-scaled values after excludingany individual value that deviates abnormally from the other valuesOnce the Provisional ISN (PISN) is calculated after the end of a month the temporary EISNis dropped and replaced by the PISN
The provisional sunspot Index
The Provisional ISN (PISN) is calculated and issued on the first of every month Theoutcome is a daily total and hemispheric sunspot number for the entire elapsed month Anexample on the first of September we calculate the daily PISN for each day of August ThePISN is computed semi-automatically with as little manual intervention as possibleTo calculate the PISN values for the concerned month we use all Wolf numbers Typicallythere is data from around 65 stations available
The calculation of the PISN is based on an extensive statistical treatment This treatmentfilters out any abnormal daily observation or the complete data set from an erratic station(quality control) This prevents long-term drifts in the resulting index One of the key elementsderived from this processing is to update the K reduction coefficients for each station theevolution of each station is monitored for each day relative to the entire networkA subset of the contributing stations also provides hemispheric counts A similar process isapplied to the North and South counts to derive the hemispheric PISN There is an additionalconstraint the sum of the North and South ISN must match the total ISNThe PISN replaces the EISN And once the Definitive ISN (DISN) is calculated the DISNreplaces the PISN
The definitive sunspot index
The Definitive ISN is calculated and issued on a quarterly basis when we have collecteddata from all the contributing observatories This is the final index and it is appended to thehistorical sunspot index time series The same semi-automated treatment as for the PISN isnow applied to the full data set If the result agrees within 5 of the PISN value the PISN iskept and becomes definitive Otherwise the new calculated value replaces the PISN andbecomes the definitive ISNIt is only at this stage and only in peculiar situations that a manual verification by ourscientific staff is required For example this happens when the observed raw Wolf valuesfrom the whole network are clustered around two distinct values This special case can becaused by small short-lived isolated sunspots (lifetimes lt 24 hours) or by the appearance ordisappearance of a large group at the solar limb in the course of one UT dayThe DISN replaces the provisional and estimated International Sunspot Number
Handling very low activity levels
One of the situations requiring a human arbitration is associated with single small isolatedand short-lived sunspots This is most noticeable around the minimum of the solar activitycycle like the one occurring now in 2008 Due to the 24hour binning (observations aregrouped between 0hUT and 24hUT) and the variable ability of each observer to detect thesmallest sunspots we end up with some stations reporting one sunspot and others who didno see any sunspot Let us explain further No sunspot may mean that the sunspot waspresent but the observer was unable to see it because of poor observational conditions such
as weather a small telescope On the other hand it may also indicate that the sunspot hadactually vanished by that time while it was present earlier on the same day
832019 Ew Afgewerkte Final
httpslidepdfcomreaderfullew-afgewerkte-final 4759
47
Individual stations do not observe at exactly the same timeIn order to validate the existence of such a marginal reported sunspot a qualified SIDCscientist must then check the detailed chronology within that day and consider the overallobserver capability (value of K coefficient)In common practice the fact that a sunspot is reported by a significant group of observersleads to the inclusion of the sunspot on that date thus neglecting the no-sunspotobservationsThe rationale is multiple observations of a sunspot exclude the possibility that the reportedsunspot was an independent false detection So a sunspot was really present on that dayalthough it may have existed only for part of the day or it was small enough to be missed bypart of the observers with smaller instruments or imperfect atmospheric conditionsAlso keep in mind that the sunspot index is derived with a limited precision just like any otherindex If the monthly mean sunspot number is 0 or 05 you can definitely say that activitywas low
What index should be used
If you want to perform long-term investigations the definitive ISN series is definitely the mostsuitable However there is a delay of a few months So when investigating the last cycle andrecent evolution use the definitive numbers in combination with the provisional ISN to be upto date to the last month The provisional numbers are also used in models forecasting thesunspot number for the coming months Now if you need a proxy for solar activity in a modelthat runs in real-time then you may use the estimated ISNImprovements and rethinking of the processing method is an ongoing project We arecurrently developing an alternative program for calculating the PISN Of course long-termconsistency is vital Therefore a cross-analysis between the output from the old and newsoftware must be applied over an extended period
832019 Ew Afgewerkte Final
httpslidepdfcomreaderfullew-afgewerkte-final 4859
48
Above graphs show different kinds of the International Sunspot Number The left plot gives an overview from 1700 up to now from the yearly (black) and monthly smoothed Sunspot Number The graph in the right top corner shows the monthly and monthly smoothed sunspot number while the graph in the right bottom corner show the daily monthly smoothed monthly sunspot number For every the time range of investigation there is an appropriate sunspot number
832019 Ew Afgewerkte Final
httpslidepdfcomreaderfullew-afgewerkte-final 4959
49
Appendix XI Filaments and prominences
httpsohowwwnascomnasagovpickoftheweekold26feb2004
This is a picture taken by SOHO on 26 February 2004
832019 Ew Afgewerkte Final
httpslidepdfcomreaderfullew-afgewerkte-final 5059
50
Appendix XII The reconnection of magnetic loops
httpwwwioporgEJarticle0004-637X558287253575webpdfrequest-id=73e38daa-69ae-4e01-b9a6- b4bd0ba071dd
In (a) sunspot B and C have different polarity and move towards each other The twomagnetic loops will reconnect and form one big magnetic loop showed in (b) This will
happen to other magnetic loops too as can be seen in (c) When G en F are close enough they
will reconnect and so E en H will reconnect too It is possible that the magnetic field line is
trapped around another in this case AD The mass ejected from the sun will be trapped
between the magnetic field lines and form a solar prominence
832019 Ew Afgewerkte Final
httpslidepdfcomreaderfullew-afgewerkte-final 5159
832019 Ew Afgewerkte Final
httpslidepdfcomreaderfullew-afgewerkte-final 5259
52
httptheinvisibleagentwordpresscom20090117amazing-celestial-images
An group of active prominences
httpapodnasagovapodap051109html
httpwhassupinthemilkywayblogspotcom200903cloudy-planhtml
A picture taken by SOHO In the left corner you can see the prominence with twisted
magnetic field lines
832019 Ew Afgewerkte Final
httpslidepdfcomreaderfullew-afgewerkte-final 5359
53
Appendix XIV Polar crown
httpsciencenasagovheadlinesy200817sep_polarcrownhtm
Photograph of a polar crown taken on 13 June 1999 by the Meudon Observatory
832019 Ew Afgewerkte Final
httpslidepdfcomreaderfullew-afgewerkte-final 5459
54
Appendix XV Coronal holes
httpsunearthdaynasagov2007multimediagal_020php
The black segment is a huge coronal hole The bright parts are x-rays from sunspots
832019 Ew Afgewerkte Final
httpslidepdfcomreaderfullew-afgewerkte-final 5559
55
Appendix XVI Coronal mass ejection
httpzuserver2staruclacuk~idhapodap000309html
Picture of a CME taken by SOHO in February 2000
832019 Ew Afgewerkte Final
httpslidepdfcomreaderfullew-afgewerkte-final 5659
56
Bibliography
Books
BEATTY JK PETERSEN CC and CHAIKIN A The new solar system fourth edition
Cambridge University Press Cambridge 1999 421 p
COMINS NF and KAUFMANN III WJ Discovering the universe eighth edition WH
Freeman and Company New York 2008 535 p
DETHIER T Het zonnestelsel Standaard Uitgeverij 1992 415 p
GOLUB L and PASACHOFF JM Nearest star the surprising science of our sun Harvard
university press Harvard 2001 267 p
GREEN SF and JONES M H An introduction to the Sun and Stars The Open University
Cambridge 2004 373 p
HILL S and CARLOWITZ M The sun Abrams New York 2006 239 p
HOLMAN GD lsquoThe mysterious origins of solar flaresrsquo Scientific America April 2006 p
24-31 volume 294 number 4
JANSSENS J Zon en aarde een unieke relatie Garant Antwerpen 2003 254 p
KELLER H-U Van Supernovarsquos tot zwarte gaten Tirion Natuur AH Baarn 2003 169 p
LANG KR Sun earth and sky Springer Germany 1995 282 p
LILENSTEN J and BORNAREL J Sous les feux du soleil EDP Sciences Les Ulis Cedex
A 2001 247 p
832019 Ew Afgewerkte Final
httpslidepdfcomreaderfullew-afgewerkte-final 5759
57
Articles
CUYPERS J and others lsquoLa rechercheacute en heacuteliophysique en Belgiquersquo Space connection
October 2007 20 p
DE KEYSER J lsquoDe magnetopauzersquo Heelal maart 1998 p 66-73
JANSSENS J lsquoHet maximum van de 23ste zonnevlekkencyclus (I)rsquo Heelal Oktober 1998 p
256-263
JANSSENS J lsquohet maximum van de 23ste zonnenvlekkencyclus (II)rsquo Heelal November
1998 p 284-290
JANSSENS J lsquoZonnefakkelsrsquo Heelal Oktober 1994 p 256-261
SMITS F lsquoDe coronarsquo Heelal Februari 1999 p 40-42
SMITS F lsquoProtuberanzenrsquo Heelal Juli 1991 p 182-185
VAN DEN BERGHE S lsquoHet Zeemaneffectrsquo Heelal September 1998 p 228-231
832019 Ew Afgewerkte Final
httpslidepdfcomreaderfullew-afgewerkte-final 5859
58
Webography
BOEN B Birth of a coronal mass ejection Internet
(httpwwwnasagovmission_pagessolar-b solar_005html) 290408
BRAEUNIG R A Glossary Internet (httpwwwbraeunigusspaceglossaryhtm) 2006
CORDIS Researchers reveal why Suns atmosphere is hotter than its surface Internet
(httpcordiseuropaeusearchindexcfmfuseaction=newsdocumentampN_LANG=ENampN_R
CN=30598amppid=0ampq=87F36474805A6BEC0B89404F72D0351Famptype=sim) 20032009
DAY C Alfveacuten waves may heat the Sunrsquos corona Internet
(httpblogsphysicstodayorgupdate200903 alfven-waves-may-heat-the-sunshtml)
310309
ELLERMAN F Solar prominences Internet (httparticlesadsabsharvardedufull
1928ASPL173E 0000074000html) (03042009)
ENCYCLODPEDIA OF SCIENCE Corona hole Internet
(httpwwwdaviddarlinginfoencyclopediaC coronal_holehtml) (04042009)
HATHAWAY D H The sunspot cycle Internet
(httpspacesciencespacerefcomsslpadsolarsunspots htm) 04012000
JANSSENS J The case of the missing solar cycle (published in lsquoheelalrsquo January 2008)
Internet (httpuserstelenetbejjanssensMSCwebEngpdf)
KNISELY D Solar prominences Internet
(httpwwwicstarscomHTMLSolarSectionHAlphaOBSERVINGTHESUNHAlpha3html)
(03042009)
KOPANSKI J Atom Internet (httpknolgooglecomkjan-
kopanskiatom1amrwrct7rvi27) 060209
MARTENS PC and ZWAAN C Origin and evolution of filament-prominence systems
Internet (http wwwioporgEJarticle0004-637X558287253575webpdfrequest-
id=73e38daa-69ae-4e01-b9a6-b4bd0ba071dd) 092001
NASA The corona Internet (httpsolarsciencemsfcnasagovcoronashtml) 180107
NASA The heliosphere Internet (httpheliosgsfcnasagovheliosphhtml) 20012009
OFFICIAL SITE OF STONEHENGE About Stonehenge Internet
(httpwwwstonehengecouk) (03022009)
OTTERSDORF M Astronomy On the sunspot cycle Internet
(httpuserszoominternetnet~matto MCASsunspot_cyclehtmZeemaneffect) 031103
PARIAT E and SCHMIEDER B Magnetic flux emergence Internet(httpwwwscholarpediaorgarticleMagnetic_field_emergence) 18042008
832019 Ew Afgewerkte Final
httpslidepdfcomreaderfullew-afgewerkte-final 5959
59
PRIEST E R Dynamics and Structure of Quiescent Solar Prominences Internet
(httpbooksgooglebe booksid=h599q3jz1w4Campdq=quiescent+prominencesampprintsec=fro
ntcoverampsource=blampots=58b79Qeyabampsig=1eklQ-
WszOIebZZaq7fq7gm6bxAamphl=nlampei=urPtSe7ZCo61-
Qa166jHDwampsa=Xampoi=book_resultampct=result ampresnum=3PPA6M2) 1989
RUSSELL R Rotation of the sun Internet
(httpwwwwindowsucaredutourlink=sunSolar_interior
Sun_layersdifferential_rotationhtml) 16082005
RUSSELL R Sunspots and magnetic fields Internet
(httpwwwwindowsucaredutourlink=sunatmospheresunspot_magnetismhtmlampedu=hig
h) 060908
UNIVERSITY OF GLASGOW Bibliography of Peter Sweet Internet
(httpwwwuniversitystoryglaacuk biographyid=WH2144amptype=P) (10042009)
WIKIPEDIA Orbiting Solar Observatory Internet
(httpenwikipediaorgwikiOrbiting_Solar_Observatory) 24012009
WINDOWS TEAM Maunderrsquos Butterfly Diagram Internet
(httpwwwwindowsucaredutourlink=sun activitybutterflyhtml) 2000
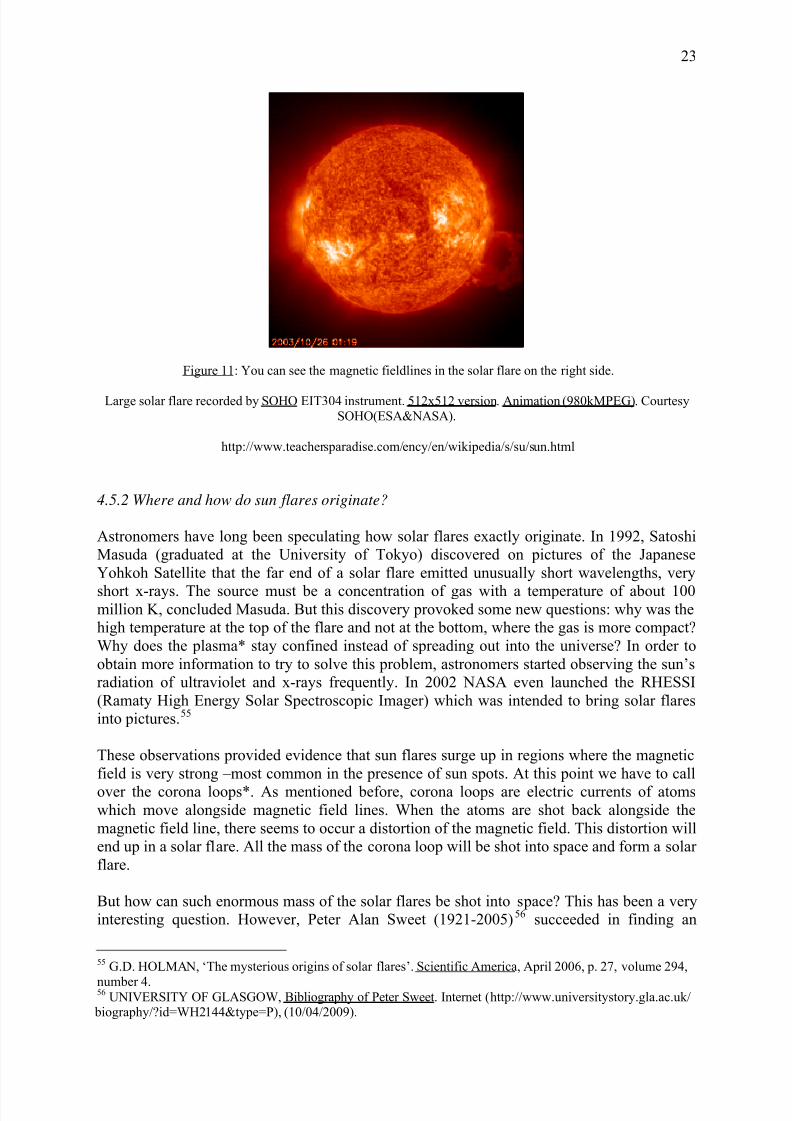
832019 Ew Afgewerkte Final
httpslidepdfcomreaderfullew-afgewerkte-final 2359
23
Figure 11 You can see the magnetic fieldlines in the solar flare on the right side
Large solar flare recorded by SOHO EIT304 instrument 512x512 version Animation (980kMPEG) CourtesySOHO(ESAampNASA)
httpwwwteachersparadisecomencyenwikipediassusunhtml
452 Where and how do sun flares originate
Astronomers have long been speculating how solar flares exactly originate In 1992 Satoshi
Masuda (graduated at the University of Tokyo) discovered on pictures of the Japanese
Yohkoh Satellite that the far end of a solar flare emitted unusually short wavelengths very
short x-rays The source must be a concentration of gas with a temperature of about 100million K concluded Masuda But this discovery provoked some new questions why was the
high temperature at the top of the flare and not at the bottom where the gas is more compact
Why does the plasma stay confined instead of spreading out into the universe In order to
obtain more information to try to solve this problem astronomers started observing the sunrsquos
radiation of ultraviolet and x-rays frequently In 2002 NASA even launched the RHESSI
(Ramaty High Energy Solar Spectroscopic Imager) which was intended to bring solar flares
into pictures55
These observations provided evidence that sun flares surge up in regions where the magnetic
field is very strong ndashmost common in the presence of sun spots At this point we have to call
over the corona loops As mentioned before corona loops are electric currents of atoms
which move alongside magnetic field lines When the atoms are shot back alongside the
magnetic field line there seems to occur a distortion of the magnetic field This distortion will
end up in a solar flare All the mass of the corona loop will be shot into space and form a solar
flare
But how can such enormous mass of the solar flares be shot into s pace This has been a very
interesting question However Peter Alan Sweet (1921-2005)56 succeeded in finding an
55 GD HOLMAN lsquoThe mysterious origins of solar flaresrsquo Scientific America April 2006 p 27 volume 294
number 456UNIVERSITY OF GLASGOW Bibliography of Peter Sweet Internet (httpwwwuniversitystoryglaacuk
biographyid=WH2144amptype=P) (10042009)
832019 Ew Afgewerkte Final
httpslidepdfcomreaderfullew-afgewerkte-final 2459
24
answer already in 1956 If magnetic field lines break apart and then reconnect they bring
together two opposing fields that will cancel each other and cause a huge burst of energy The
reconnection will create new magnetic field lines This reconnection is called the Sweet-
Parker reconnection Yet this is a slow reconnection which cannot take place at the base of a
solar flare with a dazzling speed Fortunately Harry P Petschek published an article about
reconnection in 1964 and solved that problem under certain circumstances it is possible toreconnect much faster which explains solar flares This faster reconnection is also called the
Petschek reconnection But unfortunately with the current technology it is not yet possible to
take pictures of those reconnections57
If the energy comes from the reconnection then where does this reconnection take place
From pictures of solar flares astronomers discovered that at the top of the corona loop a
mysterious x-ray source was found The x-ray source began to give a higher energy level and
at the same time the particles move down towards the sunrsquos surface Yet the x-ray source
stays at the same placehellipThen when the x-rays reach their maximum the loop suddenly
changes direction But this time the x-ray source will move upwards too unexpectedly it
moves at the speed of light approximately three hundred thousands kilometres an hour awayfrom the sun This is the same speed as the coronal mass ejections
46 Coronal mass ejections
461 What is a coronal mass ejection58
Coronal mass ejections (CMErsquos) (appendix XVI) are huge amounts of gas some billions of
plasma from the sun that are ejected into space Their temperature can reach 25 million K59
A coronal mass ejection can last for several hours and it can at last enter the solar wind A
CME can reach a speed of 50kms- 2000kms which means more than 7 million kilometres
an hour60 The mass of a large CME varies from 5 x 10⁶ to 5 x 10¹³ kg61 During a solar
maximum there are more coronal mass ejections than during a minimum but they can occur
at any time of the solar cycle Coronal mass ejections are related both to solar flares and
prominences Very heavy coronal mass ejections can cause some geomagnetic storms on
earth
462 Reconnection
The reconnection of a solar flare can end up in a coronal mass ejection When magneticfield lines that are opposite are starting to reconnect and form new magnetic field lines half of
the magnetic field lines will point downwards and join some existing magnetic loops
However the other part of the magnetic field lines will move upwards at a very high speed
and will form some loops more upwards Between those loops that moved downwards and
those that moved upwards there is some mass that isnrsquot connected to the sun anymore It is
57GD HOLMAN lsquoThe mysterious origins of solar flaresrsquo Scientific America April 2006 p 29 volume 294
number 458
BRAEUNIG R A Glossary Internet (httpwwwbraeunigusspaceglossaryhtm) 200659 LILENSTEN J and BORNAREL J Sous les feux du soleil EDP Sciences Les Ulis Cedex A 2001 p 4460 Cuypers J and others lsquoLa rechercheacute en heacuteliophysique en Belgiquersquo Space connection October 2007 p 10-
1161GREEN SF and JONES M H An introduction to the Sun and Stars The Open University Cambridge
2004 p 68
832019 Ew Afgewerkte Final
httpslidepdfcomreaderfullew-afgewerkte-final 2559
25
known that for an amount of solar flares that this mass between the loops will end up in a
coronal mass ejection Yet this doesnrsquot count for all the solar flares The coronal mass
ejection only takes place if the magnetic field lines twist around each other while forming the
letter lsquoSrsquo (see figure 12)62
Figure 12 Here you can see the reconnection that takes place before the coronal mass ejection starts
httpwwwnasagovmission_pagessolar-bsolar_005html
Certainly we will be capable to answer all the questions about solar flares and coronal mass
ejections in the nearby future But there are also some very interesting questions left what is
at the basis of the acceleration of the atoms in solar flares How does magnetic reconnection
originate Hopefully we will find the answers in the near future
47 Solar wind
471 What is the solar wind
Every second of every day of the year the sunrsquos corona emits a continuous stream of mass
from the sun The temperature of the corona is so high that the sunrsquos magnetic field just
cannot control the outflow of particles We know that the particles are accelerated but
astronomers cannot explain all the details about the solar wind yet
472 What do we know about the solar wind
The speed of the solar wind can change it differs from 300kmh up to 800kmh This speed
depends on the outflow of gases If there is a corona hole pointing towards the earth the solar
wind will reach a speed of around 800kmh The different speeds can interact with each other
and form a new speed according to the rules of light emission When two emissions connect
with each other they can form a faster or slower solar wind just like waves can interact and
form new waves
62BOEN B Birth of a coronal mass ejection Internet (httpwwwnasagovmission_pagessolar-b
solar_005html) 290408
832019 Ew Afgewerkte Final
httpslidepdfcomreaderfullew-afgewerkte-final 2659
26
The ionized atoms with very high temperature coming from the sunrsquos corona are one of the
most important parts of the solar wind but the magnetic fields are important too The
magnetic field outside the sun gets wrapped into a spiral called the Parker-spiral named after
the scientist who described it as the first one (because the sun rotates) This influences the
magnetic field of the sun from the outside The solar wind is emitted in spiral too (see figure
13)
Figure 13 The course of the solar wind caused by the rotation of the sun
httpheliosgsfcnasagovsolarmaghtml
473 Heliosphere
We can describe the heliosphere as a gigantic magnetic bubble around the sun This is
everywhere in space till where the sunrsquos magnetic field reaches and still has an influence The
heliosphere is filled with solar wind although the solar wind has a very low density Yet it
is a very hot wind but because of the very low density it does not have such a great influence
on earth However it can cause some energetic storms on earth63
63 NASA The heliosphere Internet (httpheliosgsfcnasagovheliosphhtml) 20012009
832019 Ew Afgewerkte Final
httpslidepdfcomreaderfullew-afgewerkte-final 2759
27
Conclusion
The sunrsquos magnetic field is a complex system to understand Yet I hope you have learned a
lot from this paper and that you do understand the exiting phenomena described in the
previous chapters
We can discuss the sunrsquos magnetic field from two perspectives The first one is looking at the
magnetic field for global long-term changing dimensions The second way is based on
phenomena on lower scale
The global changes involve the solar cycle and the switch of the magnetic poles The solar
cycle is divided into a decrease of the solar activity until it reaches solar minimum and an
increase of the solar activity until it reaches solar maximum The frequency of the phenomena
that can be found in the outer layers of the sun are directly connected to the solar activity and
thus to the solar cycle Sunspots are the easiest to see they appear as black spots against the
much brighter surface of the sun Corona loops are connected to sunspots and can extend into
solar flares and solar prominences These flares and prominences can burst out into a coronalmass ejection All these phenomena influence the sun and its solar wind how small their part
may be The solar wind has a directly influence on the earth
There is still much to be discovered Astronomers hope to discover much more about the
magnetic field of the sun Today many astronomers and scientists are observing the sun and
every day they discover more and more aspects of the sun Recently a group of researchers
led by David Jess of Queens University Belfast has revealed why the sunrsquos atmosphere is
hotter than its surface64 As you can see astronomy is a very developing science
64
CORDIS Researchers reveal why Suns atmosphere is hotter than its surface Internet (httpcordiseuropaeusearchindexcfmfuseaction=newsdocumentampN_LANG=ENampN_RCN=30598amppid=0ampq=87F36474805A6BEC0B89404F72D0351Famptype=sim) 20032009
832019 Ew Afgewerkte Final
httpslidepdfcomreaderfullew-afgewerkte-final 2859
28
Glossary
Absorption lines A dark line superimposed on a continuous spectrum when a gas absorbs
light from a continuous source that is hotter than the absorbing gas
Aurora Light radiated by atoms and ions formed by the solar wind in the earthrsquos upper atmosphere seen most commonly in the polar regions
Chromosphere The layer in the solar atmosphere between the photosphere and the corona It
is the lowest layer of the atmosphere characterized by reddish hue and by an increase of the
temperature with altitude through all but its lower regions
Convection The transfer of heat from a region of high temperature to a region of lower
temperature by the displacement of the cooler molecules by the warmer molecules The hot
gas will be moved upwards the cool gas will be pushed downwards into the sun
Corona The sunrsquos outer atmosphere It is very extensive and has a very low density It isextremely hot
Coronal hole A dark region of the sunrsquos inner corona as seen at X-ray wavelengths
Coronal loop Closed loops of magnetic field lines extending from the sunrsquos photosphere into
the corona which contain plasma at high temperature They are typically observed through
ultraviolet or x-ray emission from the hot plasma
Coronal mass ejection Large volumes of high energy gas released from the sunrsquos corona
Differential rotation The rotation of a non rigid object in which parts at different latitudes or
different radial distances move at different speeds
Dynamo theory The generation of a magnetic field by circulating electric charges
Eclipse The blocking of a part or all of the light from the moon by the earth (lunar eclipse) or
from the sun by the moon (solar eclipse)
Emission lines Emission lines are used in physics chemistry and astronomy to determine
what kind of gas is doing the emission Every element has a different electronic structure and
will thus have a different emission line fingerprint Emission lines are produced whenelectrons in atoms jump from one energy level to lower energy level
Filament A dark curve seen above the sunrsquos photosphere that is the top view of a solar
prominence
Flux tube Is a generally tube-like (cylindrical) region of space containing a magnetic field
such that the field at the side surfaces is parallel to them Both the cross-sectional area of the
tube and the field contained may vary along the length of the tube but the magnetic flux is
always constant
832019 Ew Afgewerkte Final
httpslidepdfcomreaderfullew-afgewerkte-final 2959
29
Geomagnetic storm When unusually strong surges of solar wind (charged particles from the
Sun) hit the Earth This effect causes variations in the magnetic field which surrounds the
Earth The visible results are eg the aurora (Northern and Southern lights)
Granulation Granules are related to the convective zone The granulation that shows up in the
photosphere is a result of the rising and falling of hot gas that takes place in the convectivezone
Hα absorption line An absorption line due to an electronic transition in hydrogen atoms in
which the atom absorbs a photon so that the electron makes a transition from a state
corresponding to the electronic energy level with n=2 to the one above with n=3 The photon
wavelength in a vacuum is 6563 nm
Heliosphere The volume of space within which the sun through the solar wind influences its
environment in the interstellar medium
Magnetic dynamo A theory that explains phenomena of the solar cycle as a result of periodicwinding and unwinding of the sunrsquos magnetic field in the solar atmosphere
Magnetic reconnection A process taking place in a plasma in which neighbouring
oppositely directed magnetic field lines suddenly part and reconnect in a new configuration
The abrupt change in a magnetic field represented by this process can release large amounts
of energy and it is thought to be important in explaining solar flares and other phenomena
Penumbra The portion of a shadow in which only part of the light source is covered by the
shadow-making body
Photosphere The region in the solar atmosphere from which most of the visible light escapes
into space
Plasma A fourth state of matter (not found naturally on Earth) of very hot gases Plasma is a
fluid with the ability to carry electric currents with no local accumulations of electric charge
Prominence Flamelike protrusion seen near the limb of the sun and extending into the solar
corona The side view of a filament
Quantum theory A theory in physics based on the principle that matter and energy have the
properties of both particles and waves created to explain the radiation of energy from a blackbody the photoelectric effect and the Bohr theory and now used to account for a wide
range of physical phenomena including the existence of discrete packets of energy and
matter the uncertainty principle and the exclusion principle Itrsquos a theory of the interaction of
matter and radiation developed early in the twentieth century which is based on the
quantization of energy and applied to a wide variety of processes that involve an exchange of
energy at the atomic level
Reconnection See magnetic reconnection
Solar cycle A 22-year-cycle during which the sunrsquos magnetic field reverses its polarity twice
Solar flare A violent eruption on the sunrsquos surface
832019 Ew Afgewerkte Final
httpslidepdfcomreaderfullew-afgewerkte-final 3059
30
Solar wind An outward flow of particles (mostly electrons and protons) from the sun
Solstice Either of two points along the ecliptic at which the Sun reaches its maximum
distance north or south of the celestial equator
Spectroscopy Concerns the production and study of spectra
Spectrum The result of electromagnetic radiation passing through a prism or grating so that
different wavelengths are separated
Spicule Short-lived (lifetime from rising to falling is about 15 minutes) jets vertical to the
solar surface that are several thousand kilometres long and about 1 kilometre thick (see also
appendix IV) in the solar chromosphere
Sunspot A temporary cool region in the solar photosphere created by protruding magnetic
fields
Umbra The central completely dark portion of a shadow
Zeemaneffect A splitting of spectra lines in the presence of a magnetic field
Bibliography and webography of the glossary
COMINS NF and KAUFMANN III WJ Discovering the universe eighth edition WH
Freeman and Company New York 2008 535 p
GREEN SF and JONES M H An introduction to the Sun and Stars The Open University
Cambridge 2004 373 p
httpenmimihuastronomygranulationhtml
httpenmimihuastronomyplasmahtml
httpwwwspacecomspacewatchspace_weather_glossaryhtml
httpenmimihuastronomyemission_linehtml
httpenmimihuastronomyabsorption_linehtml
httpwwwpbsorgfaithandreasonphysglossqm-bodyhtml
httpwwwanswerscomtopicquantum-theory
httpenwikipediaorgwikiFlux_tube
832019 Ew Afgewerkte Final
httpslidepdfcomreaderfullew-afgewerkte-final 3159
31
Appendix I The sun in figures
Physical quantity Comment
Radius 695 510 km 109 x earths radius
Mass 1989 x1030 kg 332 946 earths mass
Mass sun in the solar
system
9986 Total mass sun total mass of
our solar system
Volume 1412 x10sup3sup3 cmsup3 13 million x earths volume
Age 455 milliard years
Luminosity 3854 x 10sup3sup3 ergss
Magnitude -2773
Density center 1513 gcmsup3
Density mean 1409 gcmsup3
Pressure center 2334 x1011 bars
Pressure photosphere 00001 bar
Temperature center 15 557 000deg K
Temperature photosphere 5 780deg K Various sources mention
different grades
Temperature corona 2 000 000 to 3 000 000deg K
Rotation time at North or
South pole
up to 35 days on earth
Rotation time at Equator 25 days on earth The difference in rotation
times is called differential
rotation
Rotation time general 2538 days on earth
Mean distance sun-earth
(AU)
14959787 x108 km 1 AU = 1 Astronomical Unit
= 149 598 000 km
Chemical composition of
the sun ( of total number
of atoms)
Hydrogen 921
Helium 78
All others 01
Various sources mention
slightly different percentages
832019 Ew Afgewerkte Final
httpslidepdfcomreaderfullew-afgewerkte-final 3259
32
Chemical composition of
the sun ( of total mass)
Hydrogen 7346
Helium 2485
All others 169
Various sources mention
slightly different percentages
Total transforming of
hydrogen into helium persecond
700 billions of kilograms of
hydrogen are transformedinto 6957 billions of
kilograms of helium each
second
Based on the following references
- BEATTY JK PETERSEN CC and CHAIKIN A The new solar system fourth edition
Cambridge University Press Cambridge 1999 p 421
- LILENSTEN J and BORNAREL J Sous les feux du soleil EDP Sciences Les Ulis
Cedex A 2001 p 247
- LANG KR Sun earth and sky Springer Germany 1995 p 282- DENTHIER T Het zonnestelsel Standaard Uitgeverij 1992 p 415
- JANSSENS J Zon en aarde een unieke relatie Garant Antwerpen 2003 p 254- VOLKSSTERRENWACHT URANIA VZW De zon Internet(httpwwwuraniabesterrenkundezonnestelselzonphp) (01012009)
832019 Ew Afgewerkte Final
httpslidepdfcomreaderfullew-afgewerkte-final 3359
33
Appendix II Anatomy of the sun
httpwwwcosmographicacomgalleryinfographicssolar_anatomyhtml
The middle the sun consists of a heavy core this consists of plasma just as the outer layers
of the sun but the pressure in the core is so high that it behaves much more like a solid bodyThe most outer layer is the corona it reaches far into space More to the inside there is the
chromosphere and then the photosphere The corona the chromosphere and the
photosphere are explained in chapter 1
832019 Ew Afgewerkte Final
httpslidepdfcomreaderfullew-afgewerkte-final 3459
34
Appendix III Granulation
httpwwwwindowsucaredutourlink=sunSolar_interiorsolar_furnacehtml
At the surface of the sun we can find granules These are created by convection the warmest
parts of the sunrsquos interior move upwards and the colder parts at the surface move downwardsThis causes currents of plasma The dark lines are the colder particles We see them darker
because they emit less light than their surrounding neighbourhood
832019 Ew Afgewerkte Final
httpslidepdfcomreaderfullew-afgewerkte-final 3559
35
Appendix IV Spicules
Picture httplpc1clpccdcccauslpcharpellastro20a20deinfo_s09htmInformation httpwwwdaviddarlinginfoencyclopediaSspiculehtml
On this picture you can see spicules Spicules only last for several minutes and can be foundin the chromosphere They are little jets of gas There also exist macrospicules that can be
approximately ten times larger than a normal spicule
832019 Ew Afgewerkte Final
httpslidepdfcomreaderfullew-afgewerkte-final 3659
36
Appendix V The most important satellites observing the sun
Here you can find the most important satellites observing the sun and their missions
Solar and Heliospheric Obseratory (SOHO)
httpsohowwwnascomnasagovaboutabouthtml
SOHO the Solar amp Heliospheric Observatory is a project of international collaboration
between ESA and NASA to study the Sun from its deep core to the outer corona and the solar
wind
SOHO was launched on December 2 1995 The SOHO spacecraft was built in Europe by an
industry team led by prime contractor Matra Marconi Space (now EADS Astrium) under
overall management by ESA The twelve instruments on board SOHO were provided by
European and American scientists Nine of the international instrument consortia are led by
European Principal Investigators (PIs) three by PIs from the US Large engineering teamsand more than 200 co-investigators from many institutions supported the PIs in the
development of the instruments and in the preparation of their operations and data analysis
NASA was responsible for the launch and is now responsible for mission operations Large
radio dishes around the world which form NASAs Deep Space Network are used for data
downlink and commanding Mission control is based at Goddard Space Flight Center in
Maryland
More information about SOHO can be found on
httpsohowwwnascomnasagovaboutdocsSOHO_Fact_Sheetpdf
832019 Ew Afgewerkte Final
httpslidepdfcomreaderfullew-afgewerkte-final 3759
37
Transition Region and Coronal Explorer (TRACE)
httptracelmsalcomProjectMissionmissionhtm
TRACE enables solar physicists to study the connections between fine-scale magnetic fields
and the associated plasma structures on the Sun in a quantitative way by observing the photosphere the transition region and the corona With TRACE these temperature domains
are observed nearly simultaneously (with as little delay as only a second between different
wavelengths) with a spatial resolution of one second of arc
This is accomplished by obtaining precisely coaligned image sequences of photosphere
transition region and corona with high spatial resolution and uninterrupted viewing of the
Sun for up to eight months
TRACE Mission
TRACE explores the magnetic field in the solar atmosphere by studyingbull The 3-dimensional field structure
bull Its temporal evolution in response to photospheric flows
bull The time-dependent coronal fine structure
bull The coronal and transition region thermal topology
TRACE was launched on a Pegasus launch vehicle from Vandenberg Air Force Base in April
1998 The launch was scheduled to allow joint observations with SOHO during the rising
phase of the solar cycle to sunspot maximum No transition region or coronal imager has
witnessed the onset and rise of a solar cycle
Pegasus in flight
The two satellites provide complementary observations TRACE produces the high spatial
and temporal resolution images while SoHO yields images and spectral data out to 30 solar
radii at much lower spatial and temporal resolution Jointly they provide the opportunity to
obtain simultaneous digital measurements of all the temperature regimes of the solar
atmosphere in both high-resolution imaging and spectroscopy
With these data we expect to shatter the current ignorance of coronal heating and impulsive
MHD phenomena with benefits not only to solar physics but also to studies ranging from
stellar activity to the MHD of accretion disks The magnetograms produced by MDI on SoHO
provide a complete record of the eruption and distribution of photosphere magnetic fields
which will be invaluable for understanding TRACE observations of coronal hole formation
and coronal mass ejections Both of these phenomena have profound effects on our space
environment and the Earth`s magnetic field
TRACE is the first US solar research satellite since the Solar Maximum Mission
Coordination with SOHO provides an unprecedented opportunity to follow the emergence of
magnetic flux from the base of the convection zone deep inside the Sun through the
photosphere chromosphere and transitional region to the low-beta outer corona while
observing the effects of this emergence such as coronal mass ejections with high spatial andtemporal resolution
832019 Ew Afgewerkte Final
httpslidepdfcomreaderfullew-afgewerkte-final 3859
38
The transition from the photosphere where magnetic fields and plasma are in rough
equipartition to the corona where magnetic fields dominate is extremely difficult to model
and until recently to observe at high temporal and spatial resolution Many of the physical
problems that arise here such as plasma confinement reconnection wave propagation and plasma heating arise throughout space physics and astrophysics The detailed study of these
processed in the solar outer atmosphere is invaluable to astrophysics in general and stellar
studies in particular
More information about TRACE observations can be found on
httptracelmsalcomOperationsGeneraloperatiohtm
832019 Ew Afgewerkte Final
httpslidepdfcomreaderfullew-afgewerkte-final 3959
39
Reuven Ramaty High Energy Solar Spectroscopic Imager (RHESSI)
httphesperiagsfcnasagovhessibrochurehtm
What Questions will HESSI Address
bull How is such a large amount of energy released so rapidly during a flare
bull How are so many electrons and protons accelerated so quickly to such high energies
bull Where are the electrons and protons accelerated in the solar atmosphere and where do
they deposit their energy
How will HESSI Address these Questions
HESSI shown below will concentrate on electrons and protons accelerated in solar flares
through observations of the X-rays and gamma rays that they produce
bull HESSI will obtain the first ever X-ray and gamma-ray images of flares from 100 keV
to 20 MeVbull HESSI will do the first ever nuclear gamma-ray line spectroscopy of solar flares
bull HESSI will obtain pictures of flares in X-rays with an angular resolution of 2
arcseconds a factor of three better than previously possible
bull HESSI will measure X-ray and gamma-ray spectra with less than 1 keV energy
resolution a factor of 20-40 better than previously possible with scintillation counters
More information about the RHESSIrsquos Mission can be found on
httphesperiagsfcnasagovhessiconcepthtm
832019 Ew Afgewerkte Final
httpslidepdfcomreaderfullew-afgewerkte-final 4059
40
Solar Radiation and Climate Experiment (SORCE)
httplaspcoloradoedusorcesciencebackgroundhtm
The Solar Radiation and Climate Experiment (SORCE) is a NASA-sponsored satellite
mission that is providing state-of-the-art measurements of incoming x-ray ultraviolet visiblenear-infrared and total solar radiation The measurements provided by SORCE specifically
address long-term climate change natural variability and enhanced climate prediction and
atmospheric ozone and UV-B radiation These measurements are critical to studies of the Sun
its effect on our Earth system and its influence on humankind
The SORCE spacecraft was launched on January 25 2003 on a Pegasus XL launch vehicle to
provide NASAs Earth Science Enterprise (ESE) with precise measurements of solar
radiation It launched into a 645 km 40 degree orbit and is operated by the Laboratory for
Atmospheric and Space Physics (LASP) at the University of Colorado (CU) in Boulder
Colorado USA It will continue the precise measurements of total solar irradiance (TSI) that
began with the ERB instrument in 1979 and has continued to the present with the ACRIM series of measurements SORCE will also provide the measurements of the solar spectral
irradiance from 1nm to 2000nm accounting for 95 of the spectral contribution to TSI
SORCE carries four instruments including the Spectral Irradiance Monitor (SIM) Solar
Stellar Irradiance Comparison Experiment (SOLSTICE) Total Irradiance Monitor (TIM) and
the XUV Photometer System (XPS)
The primary goal of the NASA Earth Observing Systems (EOS) SOlar Radiation and Climate
Experiment (SORCE) is to enable solar-terrestrial studies by providing precise daily
measurements of the total solar irradiance (TSI) and the solar spectral irradiance atwavelengths extending from the ultraviolet to the near infrared The following lists the
SORCE science objectives
1 Make accurate measurements with high precision of total solar irradiance connect
them to previous TSI measurements and continue this long-term climate record
Provide TSI with an accuracy of 001 (100 parts per million) based on SI units and
with a long-term repeatability of 0001yr
2 Make daily measurements of the solar ultraviolet irradiance from 120 to 300 nm with
a spectral resolution of 1 nm Achieve this spectral irradiance measurement with an
accuracy of better than 5 and with a long-term repeatability of 05yr Use the
solarstellar comparison technique to relate the solar irradiance to the ensembleaverage flux from a number of bright early-type stars (same stars used by the UARS
SOLSTICE program)
3 Make the first measurements of the visible and near IR solar irradiance with sufficient
precision for future climate studies Obtain daily measurements of solar spectral
irradiance between 03 and 2 microm with a spectral resolution of at least 130 an
accuracy of 003 and a long-term repeatability of better than 001yr
4 Improve the understanding of how and why solar irradiance varies estimate past and
future solar behavior and investigate climate responses
More information about SORCE can be found on
httplaspcoloradoedusorcesciencescience_opshtm
832019 Ew Afgewerkte Final
httpslidepdfcomreaderfullew-afgewerkte-final 4159
41
Appendix VI Wavelengths
httpeosweblarcnasagovEDDOCSWavelengths_for_Colorshtml
As you can see on the figure visible light situates in the centre of the wavelengths having not
the shortest nor the longest wavelengths Gamma rays have the shortest wavelength radioways the longest All sort of wavelengths are used for daily purpose like radio waves for
radio and TV and gamma rays for treatments
832019 Ew Afgewerkte Final
httpslidepdfcomreaderfullew-afgewerkte-final 4259
42
Appendix VII Absorption lines in the sunrsquos spectrum
Picture httpwwwsolarnavigatornetthe_sunhtmExplanation COMINS NF and KAUFMANN III WJ Discovering the universe eighth edition WHFreeman and Company New York 2008 p 109
This photo is called a spectrogram It contains the spectrum of the sun All the black lines are
absorption lines The amount of black lines is related to the amount of elements that the sun
is emitting From a spectrogram we can deduct a lot of things including their mass the
temperature of the surface the chemical composition of the sun rotation rates and much
more
832019 Ew Afgewerkte Final
httpslidepdfcomreaderfullew-afgewerkte-final 4359
832019 Ew Afgewerkte Final
httpslidepdfcomreaderfullew-afgewerkte-final 4459
44
Appendix IX Butterfly-diagram
httpspacesciencespacerefcomsslpadsolarimagesbflygif
A butterfly-diagram
In a butterfly-diagram we can find the sunspots with their latitude (y-axis) through the years(x-axis) As you can see the sunspots appear like lsquobutterfliesrsquo this was discovered in 1904 by
Edward Maunder (1851-1928 an English astronomer best remembered for his study of
sunspots and the solar magnetic cycle) Thatrsquos why this graph is also called Maunders
butterfly diagram
832019 Ew Afgewerkte Final
httpslidepdfcomreaderfullew-afgewerkte-final 4559
45
Appendix X The Wolf-numbers
httpsidcomabenews106sunspotnumberclarifiedpdf
The sunspot number clarified By Petra Vanlommel
Which kinds of daily International Sunspot Numbers (ISN) are currentlypublished by the SIDC
Three daily indices are currently published by the SIDCthe Estimated ISN (EISN)the Provisional ISN (PISN)the Definitive ISN (DISN)Although they are all based on the same type of observations ie visual sunspot counts as ameasure of solar activity they are obtained from different data sets by different processingmethods with different accuracies and they serve different purposes
In the ideal case the three numbers are equal but in practice it is inevitable that there aresmall differences Therefore It is useful to explain what each index actually means
What is the source of the Wolf number
Once per day observers worldwide communicate their measured Wolf number (= 10G + S)based on visual sunspot (S) and group (G) counts to the World Data Center for the SunspotIndex Presently this is done through a dedicated password-protected WEB form the Wolfinterface However some observers still use the old way of reporting their observations onpaper through regular mail This method slows down the final processing but for the sake ofcontinuity in the index it is important to keep these observers included as some of them
represent the longest individual datasetsThe observers give the exact observing time the observing conditions the total numbers(group count sunspot count and Wolf number) and optionally the NorthSouth and centralzone numbers The observers using the web interface can provide their results to the SIDCimmediately after each observation However some users prefer to insert their data as ablock creating some delay but this must be done at least once a month
The personal reduction coefficient K
A personal reduction coefficient K is calculated for each station It has values typically in therange 04 and 17 and leads to a normalized sunspot number K(10G+S) In other words theK factor rescales the raw sunspot counts of each observer to the ones of Rudolph Wolf the
astronomer who introduced the above Wolf formula thus simulating the same eyes sametelescope and same conditionsDuring the procedure for calculating the Provisional ISN the K factor of every station iscomputed for every observation that passes the elimination procedure Once a year apersonal K factor for every station and for every month of the previous year is calculated Ayearly mean K value per station is also computed
The estimated sunspot index
The Estimated ISN (EISN) is calculated and issued on a daily basis for the day of calculationand the day before Only the total EISN is calculated with no hemispheric index It is anautomated procedure and no manual intervention is done The EISN is meant as a quicktemporary and approximate index for real-time applications
832019 Ew Afgewerkte Final
httpslidepdfcomreaderfullew-afgewerkte-final 4659
46
We use the raw Wolf number from all observatories that have provided counts early in theday ie before 1230 UT Typically there is between 10 and 20 stations available Thecalculation of the EISN is based on a simple and straightforward statistical method The Wolfnumbers are multiplied with the yearly mean K factor (see paragraph about the personalreduction coefficient K) The EISN is a simple average of the K-scaled values after excludingany individual value that deviates abnormally from the other valuesOnce the Provisional ISN (PISN) is calculated after the end of a month the temporary EISNis dropped and replaced by the PISN
The provisional sunspot Index
The Provisional ISN (PISN) is calculated and issued on the first of every month Theoutcome is a daily total and hemispheric sunspot number for the entire elapsed month Anexample on the first of September we calculate the daily PISN for each day of August ThePISN is computed semi-automatically with as little manual intervention as possibleTo calculate the PISN values for the concerned month we use all Wolf numbers Typicallythere is data from around 65 stations available
The calculation of the PISN is based on an extensive statistical treatment This treatmentfilters out any abnormal daily observation or the complete data set from an erratic station(quality control) This prevents long-term drifts in the resulting index One of the key elementsderived from this processing is to update the K reduction coefficients for each station theevolution of each station is monitored for each day relative to the entire networkA subset of the contributing stations also provides hemispheric counts A similar process isapplied to the North and South counts to derive the hemispheric PISN There is an additionalconstraint the sum of the North and South ISN must match the total ISNThe PISN replaces the EISN And once the Definitive ISN (DISN) is calculated the DISNreplaces the PISN
The definitive sunspot index
The Definitive ISN is calculated and issued on a quarterly basis when we have collecteddata from all the contributing observatories This is the final index and it is appended to thehistorical sunspot index time series The same semi-automated treatment as for the PISN isnow applied to the full data set If the result agrees within 5 of the PISN value the PISN iskept and becomes definitive Otherwise the new calculated value replaces the PISN andbecomes the definitive ISNIt is only at this stage and only in peculiar situations that a manual verification by ourscientific staff is required For example this happens when the observed raw Wolf valuesfrom the whole network are clustered around two distinct values This special case can becaused by small short-lived isolated sunspots (lifetimes lt 24 hours) or by the appearance ordisappearance of a large group at the solar limb in the course of one UT dayThe DISN replaces the provisional and estimated International Sunspot Number
Handling very low activity levels
One of the situations requiring a human arbitration is associated with single small isolatedand short-lived sunspots This is most noticeable around the minimum of the solar activitycycle like the one occurring now in 2008 Due to the 24hour binning (observations aregrouped between 0hUT and 24hUT) and the variable ability of each observer to detect thesmallest sunspots we end up with some stations reporting one sunspot and others who didno see any sunspot Let us explain further No sunspot may mean that the sunspot waspresent but the observer was unable to see it because of poor observational conditions such
as weather a small telescope On the other hand it may also indicate that the sunspot hadactually vanished by that time while it was present earlier on the same day
832019 Ew Afgewerkte Final
httpslidepdfcomreaderfullew-afgewerkte-final 4759
47
Individual stations do not observe at exactly the same timeIn order to validate the existence of such a marginal reported sunspot a qualified SIDCscientist must then check the detailed chronology within that day and consider the overallobserver capability (value of K coefficient)In common practice the fact that a sunspot is reported by a significant group of observersleads to the inclusion of the sunspot on that date thus neglecting the no-sunspotobservationsThe rationale is multiple observations of a sunspot exclude the possibility that the reportedsunspot was an independent false detection So a sunspot was really present on that dayalthough it may have existed only for part of the day or it was small enough to be missed bypart of the observers with smaller instruments or imperfect atmospheric conditionsAlso keep in mind that the sunspot index is derived with a limited precision just like any otherindex If the monthly mean sunspot number is 0 or 05 you can definitely say that activitywas low
What index should be used
If you want to perform long-term investigations the definitive ISN series is definitely the mostsuitable However there is a delay of a few months So when investigating the last cycle andrecent evolution use the definitive numbers in combination with the provisional ISN to be upto date to the last month The provisional numbers are also used in models forecasting thesunspot number for the coming months Now if you need a proxy for solar activity in a modelthat runs in real-time then you may use the estimated ISNImprovements and rethinking of the processing method is an ongoing project We arecurrently developing an alternative program for calculating the PISN Of course long-termconsistency is vital Therefore a cross-analysis between the output from the old and newsoftware must be applied over an extended period
832019 Ew Afgewerkte Final
httpslidepdfcomreaderfullew-afgewerkte-final 4859
48
Above graphs show different kinds of the International Sunspot Number The left plot gives an overview from 1700 up to now from the yearly (black) and monthly smoothed Sunspot Number The graph in the right top corner shows the monthly and monthly smoothed sunspot number while the graph in the right bottom corner show the daily monthly smoothed monthly sunspot number For every the time range of investigation there is an appropriate sunspot number
832019 Ew Afgewerkte Final
httpslidepdfcomreaderfullew-afgewerkte-final 4959
49
Appendix XI Filaments and prominences
httpsohowwwnascomnasagovpickoftheweekold26feb2004
This is a picture taken by SOHO on 26 February 2004
832019 Ew Afgewerkte Final
httpslidepdfcomreaderfullew-afgewerkte-final 5059
50
Appendix XII The reconnection of magnetic loops
httpwwwioporgEJarticle0004-637X558287253575webpdfrequest-id=73e38daa-69ae-4e01-b9a6- b4bd0ba071dd
In (a) sunspot B and C have different polarity and move towards each other The twomagnetic loops will reconnect and form one big magnetic loop showed in (b) This will
happen to other magnetic loops too as can be seen in (c) When G en F are close enough they
will reconnect and so E en H will reconnect too It is possible that the magnetic field line is
trapped around another in this case AD The mass ejected from the sun will be trapped
between the magnetic field lines and form a solar prominence
832019 Ew Afgewerkte Final
httpslidepdfcomreaderfullew-afgewerkte-final 5159
832019 Ew Afgewerkte Final
httpslidepdfcomreaderfullew-afgewerkte-final 5259
52
httptheinvisibleagentwordpresscom20090117amazing-celestial-images
An group of active prominences
httpapodnasagovapodap051109html
httpwhassupinthemilkywayblogspotcom200903cloudy-planhtml
A picture taken by SOHO In the left corner you can see the prominence with twisted
magnetic field lines
832019 Ew Afgewerkte Final
httpslidepdfcomreaderfullew-afgewerkte-final 5359
53
Appendix XIV Polar crown
httpsciencenasagovheadlinesy200817sep_polarcrownhtm
Photograph of a polar crown taken on 13 June 1999 by the Meudon Observatory
832019 Ew Afgewerkte Final
httpslidepdfcomreaderfullew-afgewerkte-final 5459
54
Appendix XV Coronal holes
httpsunearthdaynasagov2007multimediagal_020php
The black segment is a huge coronal hole The bright parts are x-rays from sunspots
832019 Ew Afgewerkte Final
httpslidepdfcomreaderfullew-afgewerkte-final 5559
55
Appendix XVI Coronal mass ejection
httpzuserver2staruclacuk~idhapodap000309html
Picture of a CME taken by SOHO in February 2000
832019 Ew Afgewerkte Final
httpslidepdfcomreaderfullew-afgewerkte-final 5659
56
Bibliography
Books
BEATTY JK PETERSEN CC and CHAIKIN A The new solar system fourth edition
Cambridge University Press Cambridge 1999 421 p
COMINS NF and KAUFMANN III WJ Discovering the universe eighth edition WH
Freeman and Company New York 2008 535 p
DETHIER T Het zonnestelsel Standaard Uitgeverij 1992 415 p
GOLUB L and PASACHOFF JM Nearest star the surprising science of our sun Harvard
university press Harvard 2001 267 p
GREEN SF and JONES M H An introduction to the Sun and Stars The Open University
Cambridge 2004 373 p
HILL S and CARLOWITZ M The sun Abrams New York 2006 239 p
HOLMAN GD lsquoThe mysterious origins of solar flaresrsquo Scientific America April 2006 p
24-31 volume 294 number 4
JANSSENS J Zon en aarde een unieke relatie Garant Antwerpen 2003 254 p
KELLER H-U Van Supernovarsquos tot zwarte gaten Tirion Natuur AH Baarn 2003 169 p
LANG KR Sun earth and sky Springer Germany 1995 282 p
LILENSTEN J and BORNAREL J Sous les feux du soleil EDP Sciences Les Ulis Cedex
A 2001 247 p
832019 Ew Afgewerkte Final
httpslidepdfcomreaderfullew-afgewerkte-final 5759
57
Articles
CUYPERS J and others lsquoLa rechercheacute en heacuteliophysique en Belgiquersquo Space connection
October 2007 20 p
DE KEYSER J lsquoDe magnetopauzersquo Heelal maart 1998 p 66-73
JANSSENS J lsquoHet maximum van de 23ste zonnevlekkencyclus (I)rsquo Heelal Oktober 1998 p
256-263
JANSSENS J lsquohet maximum van de 23ste zonnenvlekkencyclus (II)rsquo Heelal November
1998 p 284-290
JANSSENS J lsquoZonnefakkelsrsquo Heelal Oktober 1994 p 256-261
SMITS F lsquoDe coronarsquo Heelal Februari 1999 p 40-42
SMITS F lsquoProtuberanzenrsquo Heelal Juli 1991 p 182-185
VAN DEN BERGHE S lsquoHet Zeemaneffectrsquo Heelal September 1998 p 228-231
832019 Ew Afgewerkte Final
httpslidepdfcomreaderfullew-afgewerkte-final 5859
58
Webography
BOEN B Birth of a coronal mass ejection Internet
(httpwwwnasagovmission_pagessolar-b solar_005html) 290408
BRAEUNIG R A Glossary Internet (httpwwwbraeunigusspaceglossaryhtm) 2006
CORDIS Researchers reveal why Suns atmosphere is hotter than its surface Internet
(httpcordiseuropaeusearchindexcfmfuseaction=newsdocumentampN_LANG=ENampN_R
CN=30598amppid=0ampq=87F36474805A6BEC0B89404F72D0351Famptype=sim) 20032009
DAY C Alfveacuten waves may heat the Sunrsquos corona Internet
(httpblogsphysicstodayorgupdate200903 alfven-waves-may-heat-the-sunshtml)
310309
ELLERMAN F Solar prominences Internet (httparticlesadsabsharvardedufull
1928ASPL173E 0000074000html) (03042009)
ENCYCLODPEDIA OF SCIENCE Corona hole Internet
(httpwwwdaviddarlinginfoencyclopediaC coronal_holehtml) (04042009)
HATHAWAY D H The sunspot cycle Internet
(httpspacesciencespacerefcomsslpadsolarsunspots htm) 04012000
JANSSENS J The case of the missing solar cycle (published in lsquoheelalrsquo January 2008)
Internet (httpuserstelenetbejjanssensMSCwebEngpdf)
KNISELY D Solar prominences Internet
(httpwwwicstarscomHTMLSolarSectionHAlphaOBSERVINGTHESUNHAlpha3html)
(03042009)
KOPANSKI J Atom Internet (httpknolgooglecomkjan-
kopanskiatom1amrwrct7rvi27) 060209
MARTENS PC and ZWAAN C Origin and evolution of filament-prominence systems
Internet (http wwwioporgEJarticle0004-637X558287253575webpdfrequest-
id=73e38daa-69ae-4e01-b9a6-b4bd0ba071dd) 092001
NASA The corona Internet (httpsolarsciencemsfcnasagovcoronashtml) 180107
NASA The heliosphere Internet (httpheliosgsfcnasagovheliosphhtml) 20012009
OFFICIAL SITE OF STONEHENGE About Stonehenge Internet
(httpwwwstonehengecouk) (03022009)
OTTERSDORF M Astronomy On the sunspot cycle Internet
(httpuserszoominternetnet~matto MCASsunspot_cyclehtmZeemaneffect) 031103
PARIAT E and SCHMIEDER B Magnetic flux emergence Internet(httpwwwscholarpediaorgarticleMagnetic_field_emergence) 18042008
832019 Ew Afgewerkte Final
httpslidepdfcomreaderfullew-afgewerkte-final 5959
59
PRIEST E R Dynamics and Structure of Quiescent Solar Prominences Internet
(httpbooksgooglebe booksid=h599q3jz1w4Campdq=quiescent+prominencesampprintsec=fro
ntcoverampsource=blampots=58b79Qeyabampsig=1eklQ-
WszOIebZZaq7fq7gm6bxAamphl=nlampei=urPtSe7ZCo61-
Qa166jHDwampsa=Xampoi=book_resultampct=result ampresnum=3PPA6M2) 1989
RUSSELL R Rotation of the sun Internet
(httpwwwwindowsucaredutourlink=sunSolar_interior
Sun_layersdifferential_rotationhtml) 16082005
RUSSELL R Sunspots and magnetic fields Internet
(httpwwwwindowsucaredutourlink=sunatmospheresunspot_magnetismhtmlampedu=hig
h) 060908
UNIVERSITY OF GLASGOW Bibliography of Peter Sweet Internet
(httpwwwuniversitystoryglaacuk biographyid=WH2144amptype=P) (10042009)
WIKIPEDIA Orbiting Solar Observatory Internet
(httpenwikipediaorgwikiOrbiting_Solar_Observatory) 24012009
WINDOWS TEAM Maunderrsquos Butterfly Diagram Internet
(httpwwwwindowsucaredutourlink=sun activitybutterflyhtml) 2000
832019 Ew Afgewerkte Final
httpslidepdfcomreaderfullew-afgewerkte-final 2459
24
answer already in 1956 If magnetic field lines break apart and then reconnect they bring
together two opposing fields that will cancel each other and cause a huge burst of energy The
reconnection will create new magnetic field lines This reconnection is called the Sweet-
Parker reconnection Yet this is a slow reconnection which cannot take place at the base of a
solar flare with a dazzling speed Fortunately Harry P Petschek published an article about
reconnection in 1964 and solved that problem under certain circumstances it is possible toreconnect much faster which explains solar flares This faster reconnection is also called the
Petschek reconnection But unfortunately with the current technology it is not yet possible to
take pictures of those reconnections57
If the energy comes from the reconnection then where does this reconnection take place
From pictures of solar flares astronomers discovered that at the top of the corona loop a
mysterious x-ray source was found The x-ray source began to give a higher energy level and
at the same time the particles move down towards the sunrsquos surface Yet the x-ray source
stays at the same placehellipThen when the x-rays reach their maximum the loop suddenly
changes direction But this time the x-ray source will move upwards too unexpectedly it
moves at the speed of light approximately three hundred thousands kilometres an hour awayfrom the sun This is the same speed as the coronal mass ejections
46 Coronal mass ejections
461 What is a coronal mass ejection58
Coronal mass ejections (CMErsquos) (appendix XVI) are huge amounts of gas some billions of
plasma from the sun that are ejected into space Their temperature can reach 25 million K59
A coronal mass ejection can last for several hours and it can at last enter the solar wind A
CME can reach a speed of 50kms- 2000kms which means more than 7 million kilometres
an hour60 The mass of a large CME varies from 5 x 10⁶ to 5 x 10¹³ kg61 During a solar
maximum there are more coronal mass ejections than during a minimum but they can occur
at any time of the solar cycle Coronal mass ejections are related both to solar flares and
prominences Very heavy coronal mass ejections can cause some geomagnetic storms on
earth
462 Reconnection
The reconnection of a solar flare can end up in a coronal mass ejection When magneticfield lines that are opposite are starting to reconnect and form new magnetic field lines half of
the magnetic field lines will point downwards and join some existing magnetic loops
However the other part of the magnetic field lines will move upwards at a very high speed
and will form some loops more upwards Between those loops that moved downwards and
those that moved upwards there is some mass that isnrsquot connected to the sun anymore It is
57GD HOLMAN lsquoThe mysterious origins of solar flaresrsquo Scientific America April 2006 p 29 volume 294
number 458
BRAEUNIG R A Glossary Internet (httpwwwbraeunigusspaceglossaryhtm) 200659 LILENSTEN J and BORNAREL J Sous les feux du soleil EDP Sciences Les Ulis Cedex A 2001 p 4460 Cuypers J and others lsquoLa rechercheacute en heacuteliophysique en Belgiquersquo Space connection October 2007 p 10-
1161GREEN SF and JONES M H An introduction to the Sun and Stars The Open University Cambridge
2004 p 68
832019 Ew Afgewerkte Final
httpslidepdfcomreaderfullew-afgewerkte-final 2559
25
known that for an amount of solar flares that this mass between the loops will end up in a
coronal mass ejection Yet this doesnrsquot count for all the solar flares The coronal mass
ejection only takes place if the magnetic field lines twist around each other while forming the
letter lsquoSrsquo (see figure 12)62
Figure 12 Here you can see the reconnection that takes place before the coronal mass ejection starts
httpwwwnasagovmission_pagessolar-bsolar_005html
Certainly we will be capable to answer all the questions about solar flares and coronal mass
ejections in the nearby future But there are also some very interesting questions left what is
at the basis of the acceleration of the atoms in solar flares How does magnetic reconnection
originate Hopefully we will find the answers in the near future
47 Solar wind
471 What is the solar wind
Every second of every day of the year the sunrsquos corona emits a continuous stream of mass
from the sun The temperature of the corona is so high that the sunrsquos magnetic field just
cannot control the outflow of particles We know that the particles are accelerated but
astronomers cannot explain all the details about the solar wind yet
472 What do we know about the solar wind
The speed of the solar wind can change it differs from 300kmh up to 800kmh This speed
depends on the outflow of gases If there is a corona hole pointing towards the earth the solar
wind will reach a speed of around 800kmh The different speeds can interact with each other
and form a new speed according to the rules of light emission When two emissions connect
with each other they can form a faster or slower solar wind just like waves can interact and
form new waves
62BOEN B Birth of a coronal mass ejection Internet (httpwwwnasagovmission_pagessolar-b
solar_005html) 290408
832019 Ew Afgewerkte Final
httpslidepdfcomreaderfullew-afgewerkte-final 2659
26
The ionized atoms with very high temperature coming from the sunrsquos corona are one of the
most important parts of the solar wind but the magnetic fields are important too The
magnetic field outside the sun gets wrapped into a spiral called the Parker-spiral named after
the scientist who described it as the first one (because the sun rotates) This influences the
magnetic field of the sun from the outside The solar wind is emitted in spiral too (see figure
13)
Figure 13 The course of the solar wind caused by the rotation of the sun
httpheliosgsfcnasagovsolarmaghtml
473 Heliosphere
We can describe the heliosphere as a gigantic magnetic bubble around the sun This is
everywhere in space till where the sunrsquos magnetic field reaches and still has an influence The
heliosphere is filled with solar wind although the solar wind has a very low density Yet it
is a very hot wind but because of the very low density it does not have such a great influence
on earth However it can cause some energetic storms on earth63
63 NASA The heliosphere Internet (httpheliosgsfcnasagovheliosphhtml) 20012009
832019 Ew Afgewerkte Final
httpslidepdfcomreaderfullew-afgewerkte-final 2759
27
Conclusion
The sunrsquos magnetic field is a complex system to understand Yet I hope you have learned a
lot from this paper and that you do understand the exiting phenomena described in the
previous chapters
We can discuss the sunrsquos magnetic field from two perspectives The first one is looking at the
magnetic field for global long-term changing dimensions The second way is based on
phenomena on lower scale
The global changes involve the solar cycle and the switch of the magnetic poles The solar
cycle is divided into a decrease of the solar activity until it reaches solar minimum and an
increase of the solar activity until it reaches solar maximum The frequency of the phenomena
that can be found in the outer layers of the sun are directly connected to the solar activity and
thus to the solar cycle Sunspots are the easiest to see they appear as black spots against the
much brighter surface of the sun Corona loops are connected to sunspots and can extend into
solar flares and solar prominences These flares and prominences can burst out into a coronalmass ejection All these phenomena influence the sun and its solar wind how small their part
may be The solar wind has a directly influence on the earth
There is still much to be discovered Astronomers hope to discover much more about the
magnetic field of the sun Today many astronomers and scientists are observing the sun and
every day they discover more and more aspects of the sun Recently a group of researchers
led by David Jess of Queens University Belfast has revealed why the sunrsquos atmosphere is
hotter than its surface64 As you can see astronomy is a very developing science
64
CORDIS Researchers reveal why Suns atmosphere is hotter than its surface Internet (httpcordiseuropaeusearchindexcfmfuseaction=newsdocumentampN_LANG=ENampN_RCN=30598amppid=0ampq=87F36474805A6BEC0B89404F72D0351Famptype=sim) 20032009
832019 Ew Afgewerkte Final
httpslidepdfcomreaderfullew-afgewerkte-final 2859
28
Glossary
Absorption lines A dark line superimposed on a continuous spectrum when a gas absorbs
light from a continuous source that is hotter than the absorbing gas
Aurora Light radiated by atoms and ions formed by the solar wind in the earthrsquos upper atmosphere seen most commonly in the polar regions
Chromosphere The layer in the solar atmosphere between the photosphere and the corona It
is the lowest layer of the atmosphere characterized by reddish hue and by an increase of the
temperature with altitude through all but its lower regions
Convection The transfer of heat from a region of high temperature to a region of lower
temperature by the displacement of the cooler molecules by the warmer molecules The hot
gas will be moved upwards the cool gas will be pushed downwards into the sun
Corona The sunrsquos outer atmosphere It is very extensive and has a very low density It isextremely hot
Coronal hole A dark region of the sunrsquos inner corona as seen at X-ray wavelengths
Coronal loop Closed loops of magnetic field lines extending from the sunrsquos photosphere into
the corona which contain plasma at high temperature They are typically observed through
ultraviolet or x-ray emission from the hot plasma
Coronal mass ejection Large volumes of high energy gas released from the sunrsquos corona
Differential rotation The rotation of a non rigid object in which parts at different latitudes or
different radial distances move at different speeds
Dynamo theory The generation of a magnetic field by circulating electric charges
Eclipse The blocking of a part or all of the light from the moon by the earth (lunar eclipse) or
from the sun by the moon (solar eclipse)
Emission lines Emission lines are used in physics chemistry and astronomy to determine
what kind of gas is doing the emission Every element has a different electronic structure and
will thus have a different emission line fingerprint Emission lines are produced whenelectrons in atoms jump from one energy level to lower energy level
Filament A dark curve seen above the sunrsquos photosphere that is the top view of a solar
prominence
Flux tube Is a generally tube-like (cylindrical) region of space containing a magnetic field
such that the field at the side surfaces is parallel to them Both the cross-sectional area of the
tube and the field contained may vary along the length of the tube but the magnetic flux is
always constant
832019 Ew Afgewerkte Final
httpslidepdfcomreaderfullew-afgewerkte-final 2959
29
Geomagnetic storm When unusually strong surges of solar wind (charged particles from the
Sun) hit the Earth This effect causes variations in the magnetic field which surrounds the
Earth The visible results are eg the aurora (Northern and Southern lights)
Granulation Granules are related to the convective zone The granulation that shows up in the
photosphere is a result of the rising and falling of hot gas that takes place in the convectivezone
Hα absorption line An absorption line due to an electronic transition in hydrogen atoms in
which the atom absorbs a photon so that the electron makes a transition from a state
corresponding to the electronic energy level with n=2 to the one above with n=3 The photon
wavelength in a vacuum is 6563 nm
Heliosphere The volume of space within which the sun through the solar wind influences its
environment in the interstellar medium
Magnetic dynamo A theory that explains phenomena of the solar cycle as a result of periodicwinding and unwinding of the sunrsquos magnetic field in the solar atmosphere
Magnetic reconnection A process taking place in a plasma in which neighbouring
oppositely directed magnetic field lines suddenly part and reconnect in a new configuration
The abrupt change in a magnetic field represented by this process can release large amounts
of energy and it is thought to be important in explaining solar flares and other phenomena
Penumbra The portion of a shadow in which only part of the light source is covered by the
shadow-making body
Photosphere The region in the solar atmosphere from which most of the visible light escapes
into space
Plasma A fourth state of matter (not found naturally on Earth) of very hot gases Plasma is a
fluid with the ability to carry electric currents with no local accumulations of electric charge
Prominence Flamelike protrusion seen near the limb of the sun and extending into the solar
corona The side view of a filament
Quantum theory A theory in physics based on the principle that matter and energy have the
properties of both particles and waves created to explain the radiation of energy from a blackbody the photoelectric effect and the Bohr theory and now used to account for a wide
range of physical phenomena including the existence of discrete packets of energy and
matter the uncertainty principle and the exclusion principle Itrsquos a theory of the interaction of
matter and radiation developed early in the twentieth century which is based on the
quantization of energy and applied to a wide variety of processes that involve an exchange of
energy at the atomic level
Reconnection See magnetic reconnection
Solar cycle A 22-year-cycle during which the sunrsquos magnetic field reverses its polarity twice
Solar flare A violent eruption on the sunrsquos surface
832019 Ew Afgewerkte Final
httpslidepdfcomreaderfullew-afgewerkte-final 3059
30
Solar wind An outward flow of particles (mostly electrons and protons) from the sun
Solstice Either of two points along the ecliptic at which the Sun reaches its maximum
distance north or south of the celestial equator
Spectroscopy Concerns the production and study of spectra
Spectrum The result of electromagnetic radiation passing through a prism or grating so that
different wavelengths are separated
Spicule Short-lived (lifetime from rising to falling is about 15 minutes) jets vertical to the
solar surface that are several thousand kilometres long and about 1 kilometre thick (see also
appendix IV) in the solar chromosphere
Sunspot A temporary cool region in the solar photosphere created by protruding magnetic
fields
Umbra The central completely dark portion of a shadow
Zeemaneffect A splitting of spectra lines in the presence of a magnetic field
Bibliography and webography of the glossary
COMINS NF and KAUFMANN III WJ Discovering the universe eighth edition WH
Freeman and Company New York 2008 535 p
GREEN SF and JONES M H An introduction to the Sun and Stars The Open University
Cambridge 2004 373 p
httpenmimihuastronomygranulationhtml
httpenmimihuastronomyplasmahtml
httpwwwspacecomspacewatchspace_weather_glossaryhtml
httpenmimihuastronomyemission_linehtml
httpenmimihuastronomyabsorption_linehtml
httpwwwpbsorgfaithandreasonphysglossqm-bodyhtml
httpwwwanswerscomtopicquantum-theory
httpenwikipediaorgwikiFlux_tube
832019 Ew Afgewerkte Final
httpslidepdfcomreaderfullew-afgewerkte-final 3159
31
Appendix I The sun in figures
Physical quantity Comment
Radius 695 510 km 109 x earths radius
Mass 1989 x1030 kg 332 946 earths mass
Mass sun in the solar
system
9986 Total mass sun total mass of
our solar system
Volume 1412 x10sup3sup3 cmsup3 13 million x earths volume
Age 455 milliard years
Luminosity 3854 x 10sup3sup3 ergss
Magnitude -2773
Density center 1513 gcmsup3
Density mean 1409 gcmsup3
Pressure center 2334 x1011 bars
Pressure photosphere 00001 bar
Temperature center 15 557 000deg K
Temperature photosphere 5 780deg K Various sources mention
different grades
Temperature corona 2 000 000 to 3 000 000deg K
Rotation time at North or
South pole
up to 35 days on earth
Rotation time at Equator 25 days on earth The difference in rotation
times is called differential
rotation
Rotation time general 2538 days on earth
Mean distance sun-earth
(AU)
14959787 x108 km 1 AU = 1 Astronomical Unit
= 149 598 000 km
Chemical composition of
the sun ( of total number
of atoms)
Hydrogen 921
Helium 78
All others 01
Various sources mention
slightly different percentages
832019 Ew Afgewerkte Final
httpslidepdfcomreaderfullew-afgewerkte-final 3259
32
Chemical composition of
the sun ( of total mass)
Hydrogen 7346
Helium 2485
All others 169
Various sources mention
slightly different percentages
Total transforming of
hydrogen into helium persecond
700 billions of kilograms of
hydrogen are transformedinto 6957 billions of
kilograms of helium each
second
Based on the following references
- BEATTY JK PETERSEN CC and CHAIKIN A The new solar system fourth edition
Cambridge University Press Cambridge 1999 p 421
- LILENSTEN J and BORNAREL J Sous les feux du soleil EDP Sciences Les Ulis
Cedex A 2001 p 247
- LANG KR Sun earth and sky Springer Germany 1995 p 282- DENTHIER T Het zonnestelsel Standaard Uitgeverij 1992 p 415
- JANSSENS J Zon en aarde een unieke relatie Garant Antwerpen 2003 p 254- VOLKSSTERRENWACHT URANIA VZW De zon Internet(httpwwwuraniabesterrenkundezonnestelselzonphp) (01012009)
832019 Ew Afgewerkte Final
httpslidepdfcomreaderfullew-afgewerkte-final 3359
33
Appendix II Anatomy of the sun
httpwwwcosmographicacomgalleryinfographicssolar_anatomyhtml
The middle the sun consists of a heavy core this consists of plasma just as the outer layers
of the sun but the pressure in the core is so high that it behaves much more like a solid bodyThe most outer layer is the corona it reaches far into space More to the inside there is the
chromosphere and then the photosphere The corona the chromosphere and the
photosphere are explained in chapter 1
832019 Ew Afgewerkte Final
httpslidepdfcomreaderfullew-afgewerkte-final 3459
34
Appendix III Granulation
httpwwwwindowsucaredutourlink=sunSolar_interiorsolar_furnacehtml
At the surface of the sun we can find granules These are created by convection the warmest
parts of the sunrsquos interior move upwards and the colder parts at the surface move downwardsThis causes currents of plasma The dark lines are the colder particles We see them darker
because they emit less light than their surrounding neighbourhood
832019 Ew Afgewerkte Final
httpslidepdfcomreaderfullew-afgewerkte-final 3559
35
Appendix IV Spicules
Picture httplpc1clpccdcccauslpcharpellastro20a20deinfo_s09htmInformation httpwwwdaviddarlinginfoencyclopediaSspiculehtml
On this picture you can see spicules Spicules only last for several minutes and can be foundin the chromosphere They are little jets of gas There also exist macrospicules that can be
approximately ten times larger than a normal spicule
832019 Ew Afgewerkte Final
httpslidepdfcomreaderfullew-afgewerkte-final 3659
36
Appendix V The most important satellites observing the sun
Here you can find the most important satellites observing the sun and their missions
Solar and Heliospheric Obseratory (SOHO)
httpsohowwwnascomnasagovaboutabouthtml
SOHO the Solar amp Heliospheric Observatory is a project of international collaboration
between ESA and NASA to study the Sun from its deep core to the outer corona and the solar
wind
SOHO was launched on December 2 1995 The SOHO spacecraft was built in Europe by an
industry team led by prime contractor Matra Marconi Space (now EADS Astrium) under
overall management by ESA The twelve instruments on board SOHO were provided by
European and American scientists Nine of the international instrument consortia are led by
European Principal Investigators (PIs) three by PIs from the US Large engineering teamsand more than 200 co-investigators from many institutions supported the PIs in the
development of the instruments and in the preparation of their operations and data analysis
NASA was responsible for the launch and is now responsible for mission operations Large
radio dishes around the world which form NASAs Deep Space Network are used for data
downlink and commanding Mission control is based at Goddard Space Flight Center in
Maryland
More information about SOHO can be found on
httpsohowwwnascomnasagovaboutdocsSOHO_Fact_Sheetpdf
832019 Ew Afgewerkte Final
httpslidepdfcomreaderfullew-afgewerkte-final 3759
37
Transition Region and Coronal Explorer (TRACE)
httptracelmsalcomProjectMissionmissionhtm
TRACE enables solar physicists to study the connections between fine-scale magnetic fields
and the associated plasma structures on the Sun in a quantitative way by observing the photosphere the transition region and the corona With TRACE these temperature domains
are observed nearly simultaneously (with as little delay as only a second between different
wavelengths) with a spatial resolution of one second of arc
This is accomplished by obtaining precisely coaligned image sequences of photosphere
transition region and corona with high spatial resolution and uninterrupted viewing of the
Sun for up to eight months
TRACE Mission
TRACE explores the magnetic field in the solar atmosphere by studyingbull The 3-dimensional field structure
bull Its temporal evolution in response to photospheric flows
bull The time-dependent coronal fine structure
bull The coronal and transition region thermal topology
TRACE was launched on a Pegasus launch vehicle from Vandenberg Air Force Base in April
1998 The launch was scheduled to allow joint observations with SOHO during the rising
phase of the solar cycle to sunspot maximum No transition region or coronal imager has
witnessed the onset and rise of a solar cycle
Pegasus in flight
The two satellites provide complementary observations TRACE produces the high spatial
and temporal resolution images while SoHO yields images and spectral data out to 30 solar
radii at much lower spatial and temporal resolution Jointly they provide the opportunity to
obtain simultaneous digital measurements of all the temperature regimes of the solar
atmosphere in both high-resolution imaging and spectroscopy
With these data we expect to shatter the current ignorance of coronal heating and impulsive
MHD phenomena with benefits not only to solar physics but also to studies ranging from
stellar activity to the MHD of accretion disks The magnetograms produced by MDI on SoHO
provide a complete record of the eruption and distribution of photosphere magnetic fields
which will be invaluable for understanding TRACE observations of coronal hole formation
and coronal mass ejections Both of these phenomena have profound effects on our space
environment and the Earth`s magnetic field
TRACE is the first US solar research satellite since the Solar Maximum Mission
Coordination with SOHO provides an unprecedented opportunity to follow the emergence of
magnetic flux from the base of the convection zone deep inside the Sun through the
photosphere chromosphere and transitional region to the low-beta outer corona while
observing the effects of this emergence such as coronal mass ejections with high spatial andtemporal resolution
832019 Ew Afgewerkte Final
httpslidepdfcomreaderfullew-afgewerkte-final 3859
38
The transition from the photosphere where magnetic fields and plasma are in rough
equipartition to the corona where magnetic fields dominate is extremely difficult to model
and until recently to observe at high temporal and spatial resolution Many of the physical
problems that arise here such as plasma confinement reconnection wave propagation and plasma heating arise throughout space physics and astrophysics The detailed study of these
processed in the solar outer atmosphere is invaluable to astrophysics in general and stellar
studies in particular
More information about TRACE observations can be found on
httptracelmsalcomOperationsGeneraloperatiohtm
832019 Ew Afgewerkte Final
httpslidepdfcomreaderfullew-afgewerkte-final 3959
39
Reuven Ramaty High Energy Solar Spectroscopic Imager (RHESSI)
httphesperiagsfcnasagovhessibrochurehtm
What Questions will HESSI Address
bull How is such a large amount of energy released so rapidly during a flare
bull How are so many electrons and protons accelerated so quickly to such high energies
bull Where are the electrons and protons accelerated in the solar atmosphere and where do
they deposit their energy
How will HESSI Address these Questions
HESSI shown below will concentrate on electrons and protons accelerated in solar flares
through observations of the X-rays and gamma rays that they produce
bull HESSI will obtain the first ever X-ray and gamma-ray images of flares from 100 keV
to 20 MeVbull HESSI will do the first ever nuclear gamma-ray line spectroscopy of solar flares
bull HESSI will obtain pictures of flares in X-rays with an angular resolution of 2
arcseconds a factor of three better than previously possible
bull HESSI will measure X-ray and gamma-ray spectra with less than 1 keV energy
resolution a factor of 20-40 better than previously possible with scintillation counters
More information about the RHESSIrsquos Mission can be found on
httphesperiagsfcnasagovhessiconcepthtm
832019 Ew Afgewerkte Final
httpslidepdfcomreaderfullew-afgewerkte-final 4059
40
Solar Radiation and Climate Experiment (SORCE)
httplaspcoloradoedusorcesciencebackgroundhtm
The Solar Radiation and Climate Experiment (SORCE) is a NASA-sponsored satellite
mission that is providing state-of-the-art measurements of incoming x-ray ultraviolet visiblenear-infrared and total solar radiation The measurements provided by SORCE specifically
address long-term climate change natural variability and enhanced climate prediction and
atmospheric ozone and UV-B radiation These measurements are critical to studies of the Sun
its effect on our Earth system and its influence on humankind
The SORCE spacecraft was launched on January 25 2003 on a Pegasus XL launch vehicle to
provide NASAs Earth Science Enterprise (ESE) with precise measurements of solar
radiation It launched into a 645 km 40 degree orbit and is operated by the Laboratory for
Atmospheric and Space Physics (LASP) at the University of Colorado (CU) in Boulder
Colorado USA It will continue the precise measurements of total solar irradiance (TSI) that
began with the ERB instrument in 1979 and has continued to the present with the ACRIM series of measurements SORCE will also provide the measurements of the solar spectral
irradiance from 1nm to 2000nm accounting for 95 of the spectral contribution to TSI
SORCE carries four instruments including the Spectral Irradiance Monitor (SIM) Solar
Stellar Irradiance Comparison Experiment (SOLSTICE) Total Irradiance Monitor (TIM) and
the XUV Photometer System (XPS)
The primary goal of the NASA Earth Observing Systems (EOS) SOlar Radiation and Climate
Experiment (SORCE) is to enable solar-terrestrial studies by providing precise daily
measurements of the total solar irradiance (TSI) and the solar spectral irradiance atwavelengths extending from the ultraviolet to the near infrared The following lists the
SORCE science objectives
1 Make accurate measurements with high precision of total solar irradiance connect
them to previous TSI measurements and continue this long-term climate record
Provide TSI with an accuracy of 001 (100 parts per million) based on SI units and
with a long-term repeatability of 0001yr
2 Make daily measurements of the solar ultraviolet irradiance from 120 to 300 nm with
a spectral resolution of 1 nm Achieve this spectral irradiance measurement with an
accuracy of better than 5 and with a long-term repeatability of 05yr Use the
solarstellar comparison technique to relate the solar irradiance to the ensembleaverage flux from a number of bright early-type stars (same stars used by the UARS
SOLSTICE program)
3 Make the first measurements of the visible and near IR solar irradiance with sufficient
precision for future climate studies Obtain daily measurements of solar spectral
irradiance between 03 and 2 microm with a spectral resolution of at least 130 an
accuracy of 003 and a long-term repeatability of better than 001yr
4 Improve the understanding of how and why solar irradiance varies estimate past and
future solar behavior and investigate climate responses
More information about SORCE can be found on
httplaspcoloradoedusorcesciencescience_opshtm
832019 Ew Afgewerkte Final
httpslidepdfcomreaderfullew-afgewerkte-final 4159
41
Appendix VI Wavelengths
httpeosweblarcnasagovEDDOCSWavelengths_for_Colorshtml
As you can see on the figure visible light situates in the centre of the wavelengths having not
the shortest nor the longest wavelengths Gamma rays have the shortest wavelength radioways the longest All sort of wavelengths are used for daily purpose like radio waves for
radio and TV and gamma rays for treatments
832019 Ew Afgewerkte Final
httpslidepdfcomreaderfullew-afgewerkte-final 4259
42
Appendix VII Absorption lines in the sunrsquos spectrum
Picture httpwwwsolarnavigatornetthe_sunhtmExplanation COMINS NF and KAUFMANN III WJ Discovering the universe eighth edition WHFreeman and Company New York 2008 p 109
This photo is called a spectrogram It contains the spectrum of the sun All the black lines are
absorption lines The amount of black lines is related to the amount of elements that the sun
is emitting From a spectrogram we can deduct a lot of things including their mass the
temperature of the surface the chemical composition of the sun rotation rates and much
more
832019 Ew Afgewerkte Final
httpslidepdfcomreaderfullew-afgewerkte-final 4359
832019 Ew Afgewerkte Final
httpslidepdfcomreaderfullew-afgewerkte-final 4459
44
Appendix IX Butterfly-diagram
httpspacesciencespacerefcomsslpadsolarimagesbflygif
A butterfly-diagram
In a butterfly-diagram we can find the sunspots with their latitude (y-axis) through the years(x-axis) As you can see the sunspots appear like lsquobutterfliesrsquo this was discovered in 1904 by
Edward Maunder (1851-1928 an English astronomer best remembered for his study of
sunspots and the solar magnetic cycle) Thatrsquos why this graph is also called Maunders
butterfly diagram
832019 Ew Afgewerkte Final
httpslidepdfcomreaderfullew-afgewerkte-final 4559
45
Appendix X The Wolf-numbers
httpsidcomabenews106sunspotnumberclarifiedpdf
The sunspot number clarified By Petra Vanlommel
Which kinds of daily International Sunspot Numbers (ISN) are currentlypublished by the SIDC
Three daily indices are currently published by the SIDCthe Estimated ISN (EISN)the Provisional ISN (PISN)the Definitive ISN (DISN)Although they are all based on the same type of observations ie visual sunspot counts as ameasure of solar activity they are obtained from different data sets by different processingmethods with different accuracies and they serve different purposes
In the ideal case the three numbers are equal but in practice it is inevitable that there aresmall differences Therefore It is useful to explain what each index actually means
What is the source of the Wolf number
Once per day observers worldwide communicate their measured Wolf number (= 10G + S)based on visual sunspot (S) and group (G) counts to the World Data Center for the SunspotIndex Presently this is done through a dedicated password-protected WEB form the Wolfinterface However some observers still use the old way of reporting their observations onpaper through regular mail This method slows down the final processing but for the sake ofcontinuity in the index it is important to keep these observers included as some of them
represent the longest individual datasetsThe observers give the exact observing time the observing conditions the total numbers(group count sunspot count and Wolf number) and optionally the NorthSouth and centralzone numbers The observers using the web interface can provide their results to the SIDCimmediately after each observation However some users prefer to insert their data as ablock creating some delay but this must be done at least once a month
The personal reduction coefficient K
A personal reduction coefficient K is calculated for each station It has values typically in therange 04 and 17 and leads to a normalized sunspot number K(10G+S) In other words theK factor rescales the raw sunspot counts of each observer to the ones of Rudolph Wolf the
astronomer who introduced the above Wolf formula thus simulating the same eyes sametelescope and same conditionsDuring the procedure for calculating the Provisional ISN the K factor of every station iscomputed for every observation that passes the elimination procedure Once a year apersonal K factor for every station and for every month of the previous year is calculated Ayearly mean K value per station is also computed
The estimated sunspot index
The Estimated ISN (EISN) is calculated and issued on a daily basis for the day of calculationand the day before Only the total EISN is calculated with no hemispheric index It is anautomated procedure and no manual intervention is done The EISN is meant as a quicktemporary and approximate index for real-time applications
832019 Ew Afgewerkte Final
httpslidepdfcomreaderfullew-afgewerkte-final 4659
46
We use the raw Wolf number from all observatories that have provided counts early in theday ie before 1230 UT Typically there is between 10 and 20 stations available Thecalculation of the EISN is based on a simple and straightforward statistical method The Wolfnumbers are multiplied with the yearly mean K factor (see paragraph about the personalreduction coefficient K) The EISN is a simple average of the K-scaled values after excludingany individual value that deviates abnormally from the other valuesOnce the Provisional ISN (PISN) is calculated after the end of a month the temporary EISNis dropped and replaced by the PISN
The provisional sunspot Index
The Provisional ISN (PISN) is calculated and issued on the first of every month Theoutcome is a daily total and hemispheric sunspot number for the entire elapsed month Anexample on the first of September we calculate the daily PISN for each day of August ThePISN is computed semi-automatically with as little manual intervention as possibleTo calculate the PISN values for the concerned month we use all Wolf numbers Typicallythere is data from around 65 stations available
The calculation of the PISN is based on an extensive statistical treatment This treatmentfilters out any abnormal daily observation or the complete data set from an erratic station(quality control) This prevents long-term drifts in the resulting index One of the key elementsderived from this processing is to update the K reduction coefficients for each station theevolution of each station is monitored for each day relative to the entire networkA subset of the contributing stations also provides hemispheric counts A similar process isapplied to the North and South counts to derive the hemispheric PISN There is an additionalconstraint the sum of the North and South ISN must match the total ISNThe PISN replaces the EISN And once the Definitive ISN (DISN) is calculated the DISNreplaces the PISN
The definitive sunspot index
The Definitive ISN is calculated and issued on a quarterly basis when we have collecteddata from all the contributing observatories This is the final index and it is appended to thehistorical sunspot index time series The same semi-automated treatment as for the PISN isnow applied to the full data set If the result agrees within 5 of the PISN value the PISN iskept and becomes definitive Otherwise the new calculated value replaces the PISN andbecomes the definitive ISNIt is only at this stage and only in peculiar situations that a manual verification by ourscientific staff is required For example this happens when the observed raw Wolf valuesfrom the whole network are clustered around two distinct values This special case can becaused by small short-lived isolated sunspots (lifetimes lt 24 hours) or by the appearance ordisappearance of a large group at the solar limb in the course of one UT dayThe DISN replaces the provisional and estimated International Sunspot Number
Handling very low activity levels
One of the situations requiring a human arbitration is associated with single small isolatedand short-lived sunspots This is most noticeable around the minimum of the solar activitycycle like the one occurring now in 2008 Due to the 24hour binning (observations aregrouped between 0hUT and 24hUT) and the variable ability of each observer to detect thesmallest sunspots we end up with some stations reporting one sunspot and others who didno see any sunspot Let us explain further No sunspot may mean that the sunspot waspresent but the observer was unable to see it because of poor observational conditions such
as weather a small telescope On the other hand it may also indicate that the sunspot hadactually vanished by that time while it was present earlier on the same day
832019 Ew Afgewerkte Final
httpslidepdfcomreaderfullew-afgewerkte-final 4759
47
Individual stations do not observe at exactly the same timeIn order to validate the existence of such a marginal reported sunspot a qualified SIDCscientist must then check the detailed chronology within that day and consider the overallobserver capability (value of K coefficient)In common practice the fact that a sunspot is reported by a significant group of observersleads to the inclusion of the sunspot on that date thus neglecting the no-sunspotobservationsThe rationale is multiple observations of a sunspot exclude the possibility that the reportedsunspot was an independent false detection So a sunspot was really present on that dayalthough it may have existed only for part of the day or it was small enough to be missed bypart of the observers with smaller instruments or imperfect atmospheric conditionsAlso keep in mind that the sunspot index is derived with a limited precision just like any otherindex If the monthly mean sunspot number is 0 or 05 you can definitely say that activitywas low
What index should be used
If you want to perform long-term investigations the definitive ISN series is definitely the mostsuitable However there is a delay of a few months So when investigating the last cycle andrecent evolution use the definitive numbers in combination with the provisional ISN to be upto date to the last month The provisional numbers are also used in models forecasting thesunspot number for the coming months Now if you need a proxy for solar activity in a modelthat runs in real-time then you may use the estimated ISNImprovements and rethinking of the processing method is an ongoing project We arecurrently developing an alternative program for calculating the PISN Of course long-termconsistency is vital Therefore a cross-analysis between the output from the old and newsoftware must be applied over an extended period
832019 Ew Afgewerkte Final
httpslidepdfcomreaderfullew-afgewerkte-final 4859
48
Above graphs show different kinds of the International Sunspot Number The left plot gives an overview from 1700 up to now from the yearly (black) and monthly smoothed Sunspot Number The graph in the right top corner shows the monthly and monthly smoothed sunspot number while the graph in the right bottom corner show the daily monthly smoothed monthly sunspot number For every the time range of investigation there is an appropriate sunspot number
832019 Ew Afgewerkte Final
httpslidepdfcomreaderfullew-afgewerkte-final 4959
49
Appendix XI Filaments and prominences
httpsohowwwnascomnasagovpickoftheweekold26feb2004
This is a picture taken by SOHO on 26 February 2004
832019 Ew Afgewerkte Final
httpslidepdfcomreaderfullew-afgewerkte-final 5059
50
Appendix XII The reconnection of magnetic loops
httpwwwioporgEJarticle0004-637X558287253575webpdfrequest-id=73e38daa-69ae-4e01-b9a6- b4bd0ba071dd
In (a) sunspot B and C have different polarity and move towards each other The twomagnetic loops will reconnect and form one big magnetic loop showed in (b) This will
happen to other magnetic loops too as can be seen in (c) When G en F are close enough they
will reconnect and so E en H will reconnect too It is possible that the magnetic field line is
trapped around another in this case AD The mass ejected from the sun will be trapped
between the magnetic field lines and form a solar prominence
832019 Ew Afgewerkte Final
httpslidepdfcomreaderfullew-afgewerkte-final 5159
832019 Ew Afgewerkte Final
httpslidepdfcomreaderfullew-afgewerkte-final 5259
52
httptheinvisibleagentwordpresscom20090117amazing-celestial-images
An group of active prominences
httpapodnasagovapodap051109html
httpwhassupinthemilkywayblogspotcom200903cloudy-planhtml
A picture taken by SOHO In the left corner you can see the prominence with twisted
magnetic field lines
832019 Ew Afgewerkte Final
httpslidepdfcomreaderfullew-afgewerkte-final 5359
53
Appendix XIV Polar crown
httpsciencenasagovheadlinesy200817sep_polarcrownhtm
Photograph of a polar crown taken on 13 June 1999 by the Meudon Observatory
832019 Ew Afgewerkte Final
httpslidepdfcomreaderfullew-afgewerkte-final 5459
54
Appendix XV Coronal holes
httpsunearthdaynasagov2007multimediagal_020php
The black segment is a huge coronal hole The bright parts are x-rays from sunspots
832019 Ew Afgewerkte Final
httpslidepdfcomreaderfullew-afgewerkte-final 5559
55
Appendix XVI Coronal mass ejection
httpzuserver2staruclacuk~idhapodap000309html
Picture of a CME taken by SOHO in February 2000
832019 Ew Afgewerkte Final
httpslidepdfcomreaderfullew-afgewerkte-final 5659
56
Bibliography
Books
BEATTY JK PETERSEN CC and CHAIKIN A The new solar system fourth edition
Cambridge University Press Cambridge 1999 421 p
COMINS NF and KAUFMANN III WJ Discovering the universe eighth edition WH
Freeman and Company New York 2008 535 p
DETHIER T Het zonnestelsel Standaard Uitgeverij 1992 415 p
GOLUB L and PASACHOFF JM Nearest star the surprising science of our sun Harvard
university press Harvard 2001 267 p
GREEN SF and JONES M H An introduction to the Sun and Stars The Open University
Cambridge 2004 373 p
HILL S and CARLOWITZ M The sun Abrams New York 2006 239 p
HOLMAN GD lsquoThe mysterious origins of solar flaresrsquo Scientific America April 2006 p
24-31 volume 294 number 4
JANSSENS J Zon en aarde een unieke relatie Garant Antwerpen 2003 254 p
KELLER H-U Van Supernovarsquos tot zwarte gaten Tirion Natuur AH Baarn 2003 169 p
LANG KR Sun earth and sky Springer Germany 1995 282 p
LILENSTEN J and BORNAREL J Sous les feux du soleil EDP Sciences Les Ulis Cedex
A 2001 247 p
832019 Ew Afgewerkte Final
httpslidepdfcomreaderfullew-afgewerkte-final 5759
57
Articles
CUYPERS J and others lsquoLa rechercheacute en heacuteliophysique en Belgiquersquo Space connection
October 2007 20 p
DE KEYSER J lsquoDe magnetopauzersquo Heelal maart 1998 p 66-73
JANSSENS J lsquoHet maximum van de 23ste zonnevlekkencyclus (I)rsquo Heelal Oktober 1998 p
256-263
JANSSENS J lsquohet maximum van de 23ste zonnenvlekkencyclus (II)rsquo Heelal November
1998 p 284-290
JANSSENS J lsquoZonnefakkelsrsquo Heelal Oktober 1994 p 256-261
SMITS F lsquoDe coronarsquo Heelal Februari 1999 p 40-42
SMITS F lsquoProtuberanzenrsquo Heelal Juli 1991 p 182-185
VAN DEN BERGHE S lsquoHet Zeemaneffectrsquo Heelal September 1998 p 228-231
832019 Ew Afgewerkte Final
httpslidepdfcomreaderfullew-afgewerkte-final 5859
58
Webography
BOEN B Birth of a coronal mass ejection Internet
(httpwwwnasagovmission_pagessolar-b solar_005html) 290408
BRAEUNIG R A Glossary Internet (httpwwwbraeunigusspaceglossaryhtm) 2006
CORDIS Researchers reveal why Suns atmosphere is hotter than its surface Internet
(httpcordiseuropaeusearchindexcfmfuseaction=newsdocumentampN_LANG=ENampN_R
CN=30598amppid=0ampq=87F36474805A6BEC0B89404F72D0351Famptype=sim) 20032009
DAY C Alfveacuten waves may heat the Sunrsquos corona Internet
(httpblogsphysicstodayorgupdate200903 alfven-waves-may-heat-the-sunshtml)
310309
ELLERMAN F Solar prominences Internet (httparticlesadsabsharvardedufull
1928ASPL173E 0000074000html) (03042009)
ENCYCLODPEDIA OF SCIENCE Corona hole Internet
(httpwwwdaviddarlinginfoencyclopediaC coronal_holehtml) (04042009)
HATHAWAY D H The sunspot cycle Internet
(httpspacesciencespacerefcomsslpadsolarsunspots htm) 04012000
JANSSENS J The case of the missing solar cycle (published in lsquoheelalrsquo January 2008)
Internet (httpuserstelenetbejjanssensMSCwebEngpdf)
KNISELY D Solar prominences Internet
(httpwwwicstarscomHTMLSolarSectionHAlphaOBSERVINGTHESUNHAlpha3html)
(03042009)
KOPANSKI J Atom Internet (httpknolgooglecomkjan-
kopanskiatom1amrwrct7rvi27) 060209
MARTENS PC and ZWAAN C Origin and evolution of filament-prominence systems
Internet (http wwwioporgEJarticle0004-637X558287253575webpdfrequest-
id=73e38daa-69ae-4e01-b9a6-b4bd0ba071dd) 092001
NASA The corona Internet (httpsolarsciencemsfcnasagovcoronashtml) 180107
NASA The heliosphere Internet (httpheliosgsfcnasagovheliosphhtml) 20012009
OFFICIAL SITE OF STONEHENGE About Stonehenge Internet
(httpwwwstonehengecouk) (03022009)
OTTERSDORF M Astronomy On the sunspot cycle Internet
(httpuserszoominternetnet~matto MCASsunspot_cyclehtmZeemaneffect) 031103
PARIAT E and SCHMIEDER B Magnetic flux emergence Internet(httpwwwscholarpediaorgarticleMagnetic_field_emergence) 18042008
832019 Ew Afgewerkte Final
httpslidepdfcomreaderfullew-afgewerkte-final 5959
59
PRIEST E R Dynamics and Structure of Quiescent Solar Prominences Internet
(httpbooksgooglebe booksid=h599q3jz1w4Campdq=quiescent+prominencesampprintsec=fro
ntcoverampsource=blampots=58b79Qeyabampsig=1eklQ-
WszOIebZZaq7fq7gm6bxAamphl=nlampei=urPtSe7ZCo61-
Qa166jHDwampsa=Xampoi=book_resultampct=result ampresnum=3PPA6M2) 1989
RUSSELL R Rotation of the sun Internet
(httpwwwwindowsucaredutourlink=sunSolar_interior
Sun_layersdifferential_rotationhtml) 16082005
RUSSELL R Sunspots and magnetic fields Internet
(httpwwwwindowsucaredutourlink=sunatmospheresunspot_magnetismhtmlampedu=hig
h) 060908
UNIVERSITY OF GLASGOW Bibliography of Peter Sweet Internet
(httpwwwuniversitystoryglaacuk biographyid=WH2144amptype=P) (10042009)
WIKIPEDIA Orbiting Solar Observatory Internet
(httpenwikipediaorgwikiOrbiting_Solar_Observatory) 24012009
WINDOWS TEAM Maunderrsquos Butterfly Diagram Internet
(httpwwwwindowsucaredutourlink=sun activitybutterflyhtml) 2000

832019 Ew Afgewerkte Final
httpslidepdfcomreaderfullew-afgewerkte-final 2559
25
known that for an amount of solar flares that this mass between the loops will end up in a
coronal mass ejection Yet this doesnrsquot count for all the solar flares The coronal mass
ejection only takes place if the magnetic field lines twist around each other while forming the
letter lsquoSrsquo (see figure 12)62
Figure 12 Here you can see the reconnection that takes place before the coronal mass ejection starts
httpwwwnasagovmission_pagessolar-bsolar_005html
Certainly we will be capable to answer all the questions about solar flares and coronal mass
ejections in the nearby future But there are also some very interesting questions left what is
at the basis of the acceleration of the atoms in solar flares How does magnetic reconnection
originate Hopefully we will find the answers in the near future
47 Solar wind
471 What is the solar wind
Every second of every day of the year the sunrsquos corona emits a continuous stream of mass
from the sun The temperature of the corona is so high that the sunrsquos magnetic field just
cannot control the outflow of particles We know that the particles are accelerated but
astronomers cannot explain all the details about the solar wind yet
472 What do we know about the solar wind
The speed of the solar wind can change it differs from 300kmh up to 800kmh This speed
depends on the outflow of gases If there is a corona hole pointing towards the earth the solar
wind will reach a speed of around 800kmh The different speeds can interact with each other
and form a new speed according to the rules of light emission When two emissions connect
with each other they can form a faster or slower solar wind just like waves can interact and
form new waves
62BOEN B Birth of a coronal mass ejection Internet (httpwwwnasagovmission_pagessolar-b
solar_005html) 290408
832019 Ew Afgewerkte Final
httpslidepdfcomreaderfullew-afgewerkte-final 2659
26
The ionized atoms with very high temperature coming from the sunrsquos corona are one of the
most important parts of the solar wind but the magnetic fields are important too The
magnetic field outside the sun gets wrapped into a spiral called the Parker-spiral named after
the scientist who described it as the first one (because the sun rotates) This influences the
magnetic field of the sun from the outside The solar wind is emitted in spiral too (see figure
13)
Figure 13 The course of the solar wind caused by the rotation of the sun
httpheliosgsfcnasagovsolarmaghtml
473 Heliosphere
We can describe the heliosphere as a gigantic magnetic bubble around the sun This is
everywhere in space till where the sunrsquos magnetic field reaches and still has an influence The
heliosphere is filled with solar wind although the solar wind has a very low density Yet it
is a very hot wind but because of the very low density it does not have such a great influence
on earth However it can cause some energetic storms on earth63
63 NASA The heliosphere Internet (httpheliosgsfcnasagovheliosphhtml) 20012009
832019 Ew Afgewerkte Final
httpslidepdfcomreaderfullew-afgewerkte-final 2759
27
Conclusion
The sunrsquos magnetic field is a complex system to understand Yet I hope you have learned a
lot from this paper and that you do understand the exiting phenomena described in the
previous chapters
We can discuss the sunrsquos magnetic field from two perspectives The first one is looking at the
magnetic field for global long-term changing dimensions The second way is based on
phenomena on lower scale
The global changes involve the solar cycle and the switch of the magnetic poles The solar
cycle is divided into a decrease of the solar activity until it reaches solar minimum and an
increase of the solar activity until it reaches solar maximum The frequency of the phenomena
that can be found in the outer layers of the sun are directly connected to the solar activity and
thus to the solar cycle Sunspots are the easiest to see they appear as black spots against the
much brighter surface of the sun Corona loops are connected to sunspots and can extend into
solar flares and solar prominences These flares and prominences can burst out into a coronalmass ejection All these phenomena influence the sun and its solar wind how small their part
may be The solar wind has a directly influence on the earth
There is still much to be discovered Astronomers hope to discover much more about the
magnetic field of the sun Today many astronomers and scientists are observing the sun and
every day they discover more and more aspects of the sun Recently a group of researchers
led by David Jess of Queens University Belfast has revealed why the sunrsquos atmosphere is
hotter than its surface64 As you can see astronomy is a very developing science
64
CORDIS Researchers reveal why Suns atmosphere is hotter than its surface Internet (httpcordiseuropaeusearchindexcfmfuseaction=newsdocumentampN_LANG=ENampN_RCN=30598amppid=0ampq=87F36474805A6BEC0B89404F72D0351Famptype=sim) 20032009
832019 Ew Afgewerkte Final
httpslidepdfcomreaderfullew-afgewerkte-final 2859
28
Glossary
Absorption lines A dark line superimposed on a continuous spectrum when a gas absorbs
light from a continuous source that is hotter than the absorbing gas
Aurora Light radiated by atoms and ions formed by the solar wind in the earthrsquos upper atmosphere seen most commonly in the polar regions
Chromosphere The layer in the solar atmosphere between the photosphere and the corona It
is the lowest layer of the atmosphere characterized by reddish hue and by an increase of the
temperature with altitude through all but its lower regions
Convection The transfer of heat from a region of high temperature to a region of lower
temperature by the displacement of the cooler molecules by the warmer molecules The hot
gas will be moved upwards the cool gas will be pushed downwards into the sun
Corona The sunrsquos outer atmosphere It is very extensive and has a very low density It isextremely hot
Coronal hole A dark region of the sunrsquos inner corona as seen at X-ray wavelengths
Coronal loop Closed loops of magnetic field lines extending from the sunrsquos photosphere into
the corona which contain plasma at high temperature They are typically observed through
ultraviolet or x-ray emission from the hot plasma
Coronal mass ejection Large volumes of high energy gas released from the sunrsquos corona
Differential rotation The rotation of a non rigid object in which parts at different latitudes or
different radial distances move at different speeds
Dynamo theory The generation of a magnetic field by circulating electric charges
Eclipse The blocking of a part or all of the light from the moon by the earth (lunar eclipse) or
from the sun by the moon (solar eclipse)
Emission lines Emission lines are used in physics chemistry and astronomy to determine
what kind of gas is doing the emission Every element has a different electronic structure and
will thus have a different emission line fingerprint Emission lines are produced whenelectrons in atoms jump from one energy level to lower energy level
Filament A dark curve seen above the sunrsquos photosphere that is the top view of a solar
prominence
Flux tube Is a generally tube-like (cylindrical) region of space containing a magnetic field
such that the field at the side surfaces is parallel to them Both the cross-sectional area of the
tube and the field contained may vary along the length of the tube but the magnetic flux is
always constant
832019 Ew Afgewerkte Final
httpslidepdfcomreaderfullew-afgewerkte-final 2959
29
Geomagnetic storm When unusually strong surges of solar wind (charged particles from the
Sun) hit the Earth This effect causes variations in the magnetic field which surrounds the
Earth The visible results are eg the aurora (Northern and Southern lights)
Granulation Granules are related to the convective zone The granulation that shows up in the
photosphere is a result of the rising and falling of hot gas that takes place in the convectivezone
Hα absorption line An absorption line due to an electronic transition in hydrogen atoms in
which the atom absorbs a photon so that the electron makes a transition from a state
corresponding to the electronic energy level with n=2 to the one above with n=3 The photon
wavelength in a vacuum is 6563 nm
Heliosphere The volume of space within which the sun through the solar wind influences its
environment in the interstellar medium
Magnetic dynamo A theory that explains phenomena of the solar cycle as a result of periodicwinding and unwinding of the sunrsquos magnetic field in the solar atmosphere
Magnetic reconnection A process taking place in a plasma in which neighbouring
oppositely directed magnetic field lines suddenly part and reconnect in a new configuration
The abrupt change in a magnetic field represented by this process can release large amounts
of energy and it is thought to be important in explaining solar flares and other phenomena
Penumbra The portion of a shadow in which only part of the light source is covered by the
shadow-making body
Photosphere The region in the solar atmosphere from which most of the visible light escapes
into space
Plasma A fourth state of matter (not found naturally on Earth) of very hot gases Plasma is a
fluid with the ability to carry electric currents with no local accumulations of electric charge
Prominence Flamelike protrusion seen near the limb of the sun and extending into the solar
corona The side view of a filament
Quantum theory A theory in physics based on the principle that matter and energy have the
properties of both particles and waves created to explain the radiation of energy from a blackbody the photoelectric effect and the Bohr theory and now used to account for a wide
range of physical phenomena including the existence of discrete packets of energy and
matter the uncertainty principle and the exclusion principle Itrsquos a theory of the interaction of
matter and radiation developed early in the twentieth century which is based on the
quantization of energy and applied to a wide variety of processes that involve an exchange of
energy at the atomic level
Reconnection See magnetic reconnection
Solar cycle A 22-year-cycle during which the sunrsquos magnetic field reverses its polarity twice
Solar flare A violent eruption on the sunrsquos surface
832019 Ew Afgewerkte Final
httpslidepdfcomreaderfullew-afgewerkte-final 3059
30
Solar wind An outward flow of particles (mostly electrons and protons) from the sun
Solstice Either of two points along the ecliptic at which the Sun reaches its maximum
distance north or south of the celestial equator
Spectroscopy Concerns the production and study of spectra
Spectrum The result of electromagnetic radiation passing through a prism or grating so that
different wavelengths are separated
Spicule Short-lived (lifetime from rising to falling is about 15 minutes) jets vertical to the
solar surface that are several thousand kilometres long and about 1 kilometre thick (see also
appendix IV) in the solar chromosphere
Sunspot A temporary cool region in the solar photosphere created by protruding magnetic
fields
Umbra The central completely dark portion of a shadow
Zeemaneffect A splitting of spectra lines in the presence of a magnetic field
Bibliography and webography of the glossary
COMINS NF and KAUFMANN III WJ Discovering the universe eighth edition WH
Freeman and Company New York 2008 535 p
GREEN SF and JONES M H An introduction to the Sun and Stars The Open University
Cambridge 2004 373 p
httpenmimihuastronomygranulationhtml
httpenmimihuastronomyplasmahtml
httpwwwspacecomspacewatchspace_weather_glossaryhtml
httpenmimihuastronomyemission_linehtml
httpenmimihuastronomyabsorption_linehtml
httpwwwpbsorgfaithandreasonphysglossqm-bodyhtml
httpwwwanswerscomtopicquantum-theory
httpenwikipediaorgwikiFlux_tube
832019 Ew Afgewerkte Final
httpslidepdfcomreaderfullew-afgewerkte-final 3159
31
Appendix I The sun in figures
Physical quantity Comment
Radius 695 510 km 109 x earths radius
Mass 1989 x1030 kg 332 946 earths mass
Mass sun in the solar
system
9986 Total mass sun total mass of
our solar system
Volume 1412 x10sup3sup3 cmsup3 13 million x earths volume
Age 455 milliard years
Luminosity 3854 x 10sup3sup3 ergss
Magnitude -2773
Density center 1513 gcmsup3
Density mean 1409 gcmsup3
Pressure center 2334 x1011 bars
Pressure photosphere 00001 bar
Temperature center 15 557 000deg K
Temperature photosphere 5 780deg K Various sources mention
different grades
Temperature corona 2 000 000 to 3 000 000deg K
Rotation time at North or
South pole
up to 35 days on earth
Rotation time at Equator 25 days on earth The difference in rotation
times is called differential
rotation
Rotation time general 2538 days on earth
Mean distance sun-earth
(AU)
14959787 x108 km 1 AU = 1 Astronomical Unit
= 149 598 000 km
Chemical composition of
the sun ( of total number
of atoms)
Hydrogen 921
Helium 78
All others 01
Various sources mention
slightly different percentages
832019 Ew Afgewerkte Final
httpslidepdfcomreaderfullew-afgewerkte-final 3259
32
Chemical composition of
the sun ( of total mass)
Hydrogen 7346
Helium 2485
All others 169
Various sources mention
slightly different percentages
Total transforming of
hydrogen into helium persecond
700 billions of kilograms of
hydrogen are transformedinto 6957 billions of
kilograms of helium each
second
Based on the following references
- BEATTY JK PETERSEN CC and CHAIKIN A The new solar system fourth edition
Cambridge University Press Cambridge 1999 p 421
- LILENSTEN J and BORNAREL J Sous les feux du soleil EDP Sciences Les Ulis
Cedex A 2001 p 247
- LANG KR Sun earth and sky Springer Germany 1995 p 282- DENTHIER T Het zonnestelsel Standaard Uitgeverij 1992 p 415
- JANSSENS J Zon en aarde een unieke relatie Garant Antwerpen 2003 p 254- VOLKSSTERRENWACHT URANIA VZW De zon Internet(httpwwwuraniabesterrenkundezonnestelselzonphp) (01012009)
832019 Ew Afgewerkte Final
httpslidepdfcomreaderfullew-afgewerkte-final 3359
33
Appendix II Anatomy of the sun
httpwwwcosmographicacomgalleryinfographicssolar_anatomyhtml
The middle the sun consists of a heavy core this consists of plasma just as the outer layers
of the sun but the pressure in the core is so high that it behaves much more like a solid bodyThe most outer layer is the corona it reaches far into space More to the inside there is the
chromosphere and then the photosphere The corona the chromosphere and the
photosphere are explained in chapter 1
832019 Ew Afgewerkte Final
httpslidepdfcomreaderfullew-afgewerkte-final 3459
34
Appendix III Granulation
httpwwwwindowsucaredutourlink=sunSolar_interiorsolar_furnacehtml
At the surface of the sun we can find granules These are created by convection the warmest
parts of the sunrsquos interior move upwards and the colder parts at the surface move downwardsThis causes currents of plasma The dark lines are the colder particles We see them darker
because they emit less light than their surrounding neighbourhood
832019 Ew Afgewerkte Final
httpslidepdfcomreaderfullew-afgewerkte-final 3559
35
Appendix IV Spicules
Picture httplpc1clpccdcccauslpcharpellastro20a20deinfo_s09htmInformation httpwwwdaviddarlinginfoencyclopediaSspiculehtml
On this picture you can see spicules Spicules only last for several minutes and can be foundin the chromosphere They are little jets of gas There also exist macrospicules that can be
approximately ten times larger than a normal spicule
832019 Ew Afgewerkte Final
httpslidepdfcomreaderfullew-afgewerkte-final 3659
36
Appendix V The most important satellites observing the sun
Here you can find the most important satellites observing the sun and their missions
Solar and Heliospheric Obseratory (SOHO)
httpsohowwwnascomnasagovaboutabouthtml
SOHO the Solar amp Heliospheric Observatory is a project of international collaboration
between ESA and NASA to study the Sun from its deep core to the outer corona and the solar
wind
SOHO was launched on December 2 1995 The SOHO spacecraft was built in Europe by an
industry team led by prime contractor Matra Marconi Space (now EADS Astrium) under
overall management by ESA The twelve instruments on board SOHO were provided by
European and American scientists Nine of the international instrument consortia are led by
European Principal Investigators (PIs) three by PIs from the US Large engineering teamsand more than 200 co-investigators from many institutions supported the PIs in the
development of the instruments and in the preparation of their operations and data analysis
NASA was responsible for the launch and is now responsible for mission operations Large
radio dishes around the world which form NASAs Deep Space Network are used for data
downlink and commanding Mission control is based at Goddard Space Flight Center in
Maryland
More information about SOHO can be found on
httpsohowwwnascomnasagovaboutdocsSOHO_Fact_Sheetpdf
832019 Ew Afgewerkte Final
httpslidepdfcomreaderfullew-afgewerkte-final 3759
37
Transition Region and Coronal Explorer (TRACE)
httptracelmsalcomProjectMissionmissionhtm
TRACE enables solar physicists to study the connections between fine-scale magnetic fields
and the associated plasma structures on the Sun in a quantitative way by observing the photosphere the transition region and the corona With TRACE these temperature domains
are observed nearly simultaneously (with as little delay as only a second between different
wavelengths) with a spatial resolution of one second of arc
This is accomplished by obtaining precisely coaligned image sequences of photosphere
transition region and corona with high spatial resolution and uninterrupted viewing of the
Sun for up to eight months
TRACE Mission
TRACE explores the magnetic field in the solar atmosphere by studyingbull The 3-dimensional field structure
bull Its temporal evolution in response to photospheric flows
bull The time-dependent coronal fine structure
bull The coronal and transition region thermal topology
TRACE was launched on a Pegasus launch vehicle from Vandenberg Air Force Base in April
1998 The launch was scheduled to allow joint observations with SOHO during the rising
phase of the solar cycle to sunspot maximum No transition region or coronal imager has
witnessed the onset and rise of a solar cycle
Pegasus in flight
The two satellites provide complementary observations TRACE produces the high spatial
and temporal resolution images while SoHO yields images and spectral data out to 30 solar
radii at much lower spatial and temporal resolution Jointly they provide the opportunity to
obtain simultaneous digital measurements of all the temperature regimes of the solar
atmosphere in both high-resolution imaging and spectroscopy
With these data we expect to shatter the current ignorance of coronal heating and impulsive
MHD phenomena with benefits not only to solar physics but also to studies ranging from
stellar activity to the MHD of accretion disks The magnetograms produced by MDI on SoHO
provide a complete record of the eruption and distribution of photosphere magnetic fields
which will be invaluable for understanding TRACE observations of coronal hole formation
and coronal mass ejections Both of these phenomena have profound effects on our space
environment and the Earth`s magnetic field
TRACE is the first US solar research satellite since the Solar Maximum Mission
Coordination with SOHO provides an unprecedented opportunity to follow the emergence of
magnetic flux from the base of the convection zone deep inside the Sun through the
photosphere chromosphere and transitional region to the low-beta outer corona while
observing the effects of this emergence such as coronal mass ejections with high spatial andtemporal resolution
832019 Ew Afgewerkte Final
httpslidepdfcomreaderfullew-afgewerkte-final 3859
38
The transition from the photosphere where magnetic fields and plasma are in rough
equipartition to the corona where magnetic fields dominate is extremely difficult to model
and until recently to observe at high temporal and spatial resolution Many of the physical
problems that arise here such as plasma confinement reconnection wave propagation and plasma heating arise throughout space physics and astrophysics The detailed study of these
processed in the solar outer atmosphere is invaluable to astrophysics in general and stellar
studies in particular
More information about TRACE observations can be found on
httptracelmsalcomOperationsGeneraloperatiohtm
832019 Ew Afgewerkte Final
httpslidepdfcomreaderfullew-afgewerkte-final 3959
39
Reuven Ramaty High Energy Solar Spectroscopic Imager (RHESSI)
httphesperiagsfcnasagovhessibrochurehtm
What Questions will HESSI Address
bull How is such a large amount of energy released so rapidly during a flare
bull How are so many electrons and protons accelerated so quickly to such high energies
bull Where are the electrons and protons accelerated in the solar atmosphere and where do
they deposit their energy
How will HESSI Address these Questions
HESSI shown below will concentrate on electrons and protons accelerated in solar flares
through observations of the X-rays and gamma rays that they produce
bull HESSI will obtain the first ever X-ray and gamma-ray images of flares from 100 keV
to 20 MeVbull HESSI will do the first ever nuclear gamma-ray line spectroscopy of solar flares
bull HESSI will obtain pictures of flares in X-rays with an angular resolution of 2
arcseconds a factor of three better than previously possible
bull HESSI will measure X-ray and gamma-ray spectra with less than 1 keV energy
resolution a factor of 20-40 better than previously possible with scintillation counters
More information about the RHESSIrsquos Mission can be found on
httphesperiagsfcnasagovhessiconcepthtm
832019 Ew Afgewerkte Final
httpslidepdfcomreaderfullew-afgewerkte-final 4059
40
Solar Radiation and Climate Experiment (SORCE)
httplaspcoloradoedusorcesciencebackgroundhtm
The Solar Radiation and Climate Experiment (SORCE) is a NASA-sponsored satellite
mission that is providing state-of-the-art measurements of incoming x-ray ultraviolet visiblenear-infrared and total solar radiation The measurements provided by SORCE specifically
address long-term climate change natural variability and enhanced climate prediction and
atmospheric ozone and UV-B radiation These measurements are critical to studies of the Sun
its effect on our Earth system and its influence on humankind
The SORCE spacecraft was launched on January 25 2003 on a Pegasus XL launch vehicle to
provide NASAs Earth Science Enterprise (ESE) with precise measurements of solar
radiation It launched into a 645 km 40 degree orbit and is operated by the Laboratory for
Atmospheric and Space Physics (LASP) at the University of Colorado (CU) in Boulder
Colorado USA It will continue the precise measurements of total solar irradiance (TSI) that
began with the ERB instrument in 1979 and has continued to the present with the ACRIM series of measurements SORCE will also provide the measurements of the solar spectral
irradiance from 1nm to 2000nm accounting for 95 of the spectral contribution to TSI
SORCE carries four instruments including the Spectral Irradiance Monitor (SIM) Solar
Stellar Irradiance Comparison Experiment (SOLSTICE) Total Irradiance Monitor (TIM) and
the XUV Photometer System (XPS)
The primary goal of the NASA Earth Observing Systems (EOS) SOlar Radiation and Climate
Experiment (SORCE) is to enable solar-terrestrial studies by providing precise daily
measurements of the total solar irradiance (TSI) and the solar spectral irradiance atwavelengths extending from the ultraviolet to the near infrared The following lists the
SORCE science objectives
1 Make accurate measurements with high precision of total solar irradiance connect
them to previous TSI measurements and continue this long-term climate record
Provide TSI with an accuracy of 001 (100 parts per million) based on SI units and
with a long-term repeatability of 0001yr
2 Make daily measurements of the solar ultraviolet irradiance from 120 to 300 nm with
a spectral resolution of 1 nm Achieve this spectral irradiance measurement with an
accuracy of better than 5 and with a long-term repeatability of 05yr Use the
solarstellar comparison technique to relate the solar irradiance to the ensembleaverage flux from a number of bright early-type stars (same stars used by the UARS
SOLSTICE program)
3 Make the first measurements of the visible and near IR solar irradiance with sufficient
precision for future climate studies Obtain daily measurements of solar spectral
irradiance between 03 and 2 microm with a spectral resolution of at least 130 an
accuracy of 003 and a long-term repeatability of better than 001yr
4 Improve the understanding of how and why solar irradiance varies estimate past and
future solar behavior and investigate climate responses
More information about SORCE can be found on
httplaspcoloradoedusorcesciencescience_opshtm
832019 Ew Afgewerkte Final
httpslidepdfcomreaderfullew-afgewerkte-final 4159
41
Appendix VI Wavelengths
httpeosweblarcnasagovEDDOCSWavelengths_for_Colorshtml
As you can see on the figure visible light situates in the centre of the wavelengths having not
the shortest nor the longest wavelengths Gamma rays have the shortest wavelength radioways the longest All sort of wavelengths are used for daily purpose like radio waves for
radio and TV and gamma rays for treatments
832019 Ew Afgewerkte Final
httpslidepdfcomreaderfullew-afgewerkte-final 4259
42
Appendix VII Absorption lines in the sunrsquos spectrum
Picture httpwwwsolarnavigatornetthe_sunhtmExplanation COMINS NF and KAUFMANN III WJ Discovering the universe eighth edition WHFreeman and Company New York 2008 p 109
This photo is called a spectrogram It contains the spectrum of the sun All the black lines are
absorption lines The amount of black lines is related to the amount of elements that the sun
is emitting From a spectrogram we can deduct a lot of things including their mass the
temperature of the surface the chemical composition of the sun rotation rates and much
more
832019 Ew Afgewerkte Final
httpslidepdfcomreaderfullew-afgewerkte-final 4359
832019 Ew Afgewerkte Final
httpslidepdfcomreaderfullew-afgewerkte-final 4459
44
Appendix IX Butterfly-diagram
httpspacesciencespacerefcomsslpadsolarimagesbflygif
A butterfly-diagram
In a butterfly-diagram we can find the sunspots with their latitude (y-axis) through the years(x-axis) As you can see the sunspots appear like lsquobutterfliesrsquo this was discovered in 1904 by
Edward Maunder (1851-1928 an English astronomer best remembered for his study of
sunspots and the solar magnetic cycle) Thatrsquos why this graph is also called Maunders
butterfly diagram
832019 Ew Afgewerkte Final
httpslidepdfcomreaderfullew-afgewerkte-final 4559
45
Appendix X The Wolf-numbers
httpsidcomabenews106sunspotnumberclarifiedpdf
The sunspot number clarified By Petra Vanlommel
Which kinds of daily International Sunspot Numbers (ISN) are currentlypublished by the SIDC
Three daily indices are currently published by the SIDCthe Estimated ISN (EISN)the Provisional ISN (PISN)the Definitive ISN (DISN)Although they are all based on the same type of observations ie visual sunspot counts as ameasure of solar activity they are obtained from different data sets by different processingmethods with different accuracies and they serve different purposes
In the ideal case the three numbers are equal but in practice it is inevitable that there aresmall differences Therefore It is useful to explain what each index actually means
What is the source of the Wolf number
Once per day observers worldwide communicate their measured Wolf number (= 10G + S)based on visual sunspot (S) and group (G) counts to the World Data Center for the SunspotIndex Presently this is done through a dedicated password-protected WEB form the Wolfinterface However some observers still use the old way of reporting their observations onpaper through regular mail This method slows down the final processing but for the sake ofcontinuity in the index it is important to keep these observers included as some of them
represent the longest individual datasetsThe observers give the exact observing time the observing conditions the total numbers(group count sunspot count and Wolf number) and optionally the NorthSouth and centralzone numbers The observers using the web interface can provide their results to the SIDCimmediately after each observation However some users prefer to insert their data as ablock creating some delay but this must be done at least once a month
The personal reduction coefficient K
A personal reduction coefficient K is calculated for each station It has values typically in therange 04 and 17 and leads to a normalized sunspot number K(10G+S) In other words theK factor rescales the raw sunspot counts of each observer to the ones of Rudolph Wolf the
astronomer who introduced the above Wolf formula thus simulating the same eyes sametelescope and same conditionsDuring the procedure for calculating the Provisional ISN the K factor of every station iscomputed for every observation that passes the elimination procedure Once a year apersonal K factor for every station and for every month of the previous year is calculated Ayearly mean K value per station is also computed
The estimated sunspot index
The Estimated ISN (EISN) is calculated and issued on a daily basis for the day of calculationand the day before Only the total EISN is calculated with no hemispheric index It is anautomated procedure and no manual intervention is done The EISN is meant as a quicktemporary and approximate index for real-time applications
832019 Ew Afgewerkte Final
httpslidepdfcomreaderfullew-afgewerkte-final 4659
46
We use the raw Wolf number from all observatories that have provided counts early in theday ie before 1230 UT Typically there is between 10 and 20 stations available Thecalculation of the EISN is based on a simple and straightforward statistical method The Wolfnumbers are multiplied with the yearly mean K factor (see paragraph about the personalreduction coefficient K) The EISN is a simple average of the K-scaled values after excludingany individual value that deviates abnormally from the other valuesOnce the Provisional ISN (PISN) is calculated after the end of a month the temporary EISNis dropped and replaced by the PISN
The provisional sunspot Index
The Provisional ISN (PISN) is calculated and issued on the first of every month Theoutcome is a daily total and hemispheric sunspot number for the entire elapsed month Anexample on the first of September we calculate the daily PISN for each day of August ThePISN is computed semi-automatically with as little manual intervention as possibleTo calculate the PISN values for the concerned month we use all Wolf numbers Typicallythere is data from around 65 stations available
The calculation of the PISN is based on an extensive statistical treatment This treatmentfilters out any abnormal daily observation or the complete data set from an erratic station(quality control) This prevents long-term drifts in the resulting index One of the key elementsderived from this processing is to update the K reduction coefficients for each station theevolution of each station is monitored for each day relative to the entire networkA subset of the contributing stations also provides hemispheric counts A similar process isapplied to the North and South counts to derive the hemispheric PISN There is an additionalconstraint the sum of the North and South ISN must match the total ISNThe PISN replaces the EISN And once the Definitive ISN (DISN) is calculated the DISNreplaces the PISN
The definitive sunspot index
The Definitive ISN is calculated and issued on a quarterly basis when we have collecteddata from all the contributing observatories This is the final index and it is appended to thehistorical sunspot index time series The same semi-automated treatment as for the PISN isnow applied to the full data set If the result agrees within 5 of the PISN value the PISN iskept and becomes definitive Otherwise the new calculated value replaces the PISN andbecomes the definitive ISNIt is only at this stage and only in peculiar situations that a manual verification by ourscientific staff is required For example this happens when the observed raw Wolf valuesfrom the whole network are clustered around two distinct values This special case can becaused by small short-lived isolated sunspots (lifetimes lt 24 hours) or by the appearance ordisappearance of a large group at the solar limb in the course of one UT dayThe DISN replaces the provisional and estimated International Sunspot Number
Handling very low activity levels
One of the situations requiring a human arbitration is associated with single small isolatedand short-lived sunspots This is most noticeable around the minimum of the solar activitycycle like the one occurring now in 2008 Due to the 24hour binning (observations aregrouped between 0hUT and 24hUT) and the variable ability of each observer to detect thesmallest sunspots we end up with some stations reporting one sunspot and others who didno see any sunspot Let us explain further No sunspot may mean that the sunspot waspresent but the observer was unable to see it because of poor observational conditions such
as weather a small telescope On the other hand it may also indicate that the sunspot hadactually vanished by that time while it was present earlier on the same day
832019 Ew Afgewerkte Final
httpslidepdfcomreaderfullew-afgewerkte-final 4759
47
Individual stations do not observe at exactly the same timeIn order to validate the existence of such a marginal reported sunspot a qualified SIDCscientist must then check the detailed chronology within that day and consider the overallobserver capability (value of K coefficient)In common practice the fact that a sunspot is reported by a significant group of observersleads to the inclusion of the sunspot on that date thus neglecting the no-sunspotobservationsThe rationale is multiple observations of a sunspot exclude the possibility that the reportedsunspot was an independent false detection So a sunspot was really present on that dayalthough it may have existed only for part of the day or it was small enough to be missed bypart of the observers with smaller instruments or imperfect atmospheric conditionsAlso keep in mind that the sunspot index is derived with a limited precision just like any otherindex If the monthly mean sunspot number is 0 or 05 you can definitely say that activitywas low
What index should be used
If you want to perform long-term investigations the definitive ISN series is definitely the mostsuitable However there is a delay of a few months So when investigating the last cycle andrecent evolution use the definitive numbers in combination with the provisional ISN to be upto date to the last month The provisional numbers are also used in models forecasting thesunspot number for the coming months Now if you need a proxy for solar activity in a modelthat runs in real-time then you may use the estimated ISNImprovements and rethinking of the processing method is an ongoing project We arecurrently developing an alternative program for calculating the PISN Of course long-termconsistency is vital Therefore a cross-analysis between the output from the old and newsoftware must be applied over an extended period
832019 Ew Afgewerkte Final
httpslidepdfcomreaderfullew-afgewerkte-final 4859
48
Above graphs show different kinds of the International Sunspot Number The left plot gives an overview from 1700 up to now from the yearly (black) and monthly smoothed Sunspot Number The graph in the right top corner shows the monthly and monthly smoothed sunspot number while the graph in the right bottom corner show the daily monthly smoothed monthly sunspot number For every the time range of investigation there is an appropriate sunspot number
832019 Ew Afgewerkte Final
httpslidepdfcomreaderfullew-afgewerkte-final 4959
49
Appendix XI Filaments and prominences
httpsohowwwnascomnasagovpickoftheweekold26feb2004
This is a picture taken by SOHO on 26 February 2004
832019 Ew Afgewerkte Final
httpslidepdfcomreaderfullew-afgewerkte-final 5059
50
Appendix XII The reconnection of magnetic loops
httpwwwioporgEJarticle0004-637X558287253575webpdfrequest-id=73e38daa-69ae-4e01-b9a6- b4bd0ba071dd
In (a) sunspot B and C have different polarity and move towards each other The twomagnetic loops will reconnect and form one big magnetic loop showed in (b) This will
happen to other magnetic loops too as can be seen in (c) When G en F are close enough they
will reconnect and so E en H will reconnect too It is possible that the magnetic field line is
trapped around another in this case AD The mass ejected from the sun will be trapped
between the magnetic field lines and form a solar prominence
832019 Ew Afgewerkte Final
httpslidepdfcomreaderfullew-afgewerkte-final 5159
832019 Ew Afgewerkte Final
httpslidepdfcomreaderfullew-afgewerkte-final 5259
52
httptheinvisibleagentwordpresscom20090117amazing-celestial-images
An group of active prominences
httpapodnasagovapodap051109html
httpwhassupinthemilkywayblogspotcom200903cloudy-planhtml
A picture taken by SOHO In the left corner you can see the prominence with twisted
magnetic field lines
832019 Ew Afgewerkte Final
httpslidepdfcomreaderfullew-afgewerkte-final 5359
53
Appendix XIV Polar crown
httpsciencenasagovheadlinesy200817sep_polarcrownhtm
Photograph of a polar crown taken on 13 June 1999 by the Meudon Observatory
832019 Ew Afgewerkte Final
httpslidepdfcomreaderfullew-afgewerkte-final 5459
54
Appendix XV Coronal holes
httpsunearthdaynasagov2007multimediagal_020php
The black segment is a huge coronal hole The bright parts are x-rays from sunspots
832019 Ew Afgewerkte Final
httpslidepdfcomreaderfullew-afgewerkte-final 5559
55
Appendix XVI Coronal mass ejection
httpzuserver2staruclacuk~idhapodap000309html
Picture of a CME taken by SOHO in February 2000
832019 Ew Afgewerkte Final
httpslidepdfcomreaderfullew-afgewerkte-final 5659
56
Bibliography
Books
BEATTY JK PETERSEN CC and CHAIKIN A The new solar system fourth edition
Cambridge University Press Cambridge 1999 421 p
COMINS NF and KAUFMANN III WJ Discovering the universe eighth edition WH
Freeman and Company New York 2008 535 p
DETHIER T Het zonnestelsel Standaard Uitgeverij 1992 415 p
GOLUB L and PASACHOFF JM Nearest star the surprising science of our sun Harvard
university press Harvard 2001 267 p
GREEN SF and JONES M H An introduction to the Sun and Stars The Open University
Cambridge 2004 373 p
HILL S and CARLOWITZ M The sun Abrams New York 2006 239 p
HOLMAN GD lsquoThe mysterious origins of solar flaresrsquo Scientific America April 2006 p
24-31 volume 294 number 4
JANSSENS J Zon en aarde een unieke relatie Garant Antwerpen 2003 254 p
KELLER H-U Van Supernovarsquos tot zwarte gaten Tirion Natuur AH Baarn 2003 169 p
LANG KR Sun earth and sky Springer Germany 1995 282 p
LILENSTEN J and BORNAREL J Sous les feux du soleil EDP Sciences Les Ulis Cedex
A 2001 247 p
832019 Ew Afgewerkte Final
httpslidepdfcomreaderfullew-afgewerkte-final 5759
57
Articles
CUYPERS J and others lsquoLa rechercheacute en heacuteliophysique en Belgiquersquo Space connection
October 2007 20 p
DE KEYSER J lsquoDe magnetopauzersquo Heelal maart 1998 p 66-73
JANSSENS J lsquoHet maximum van de 23ste zonnevlekkencyclus (I)rsquo Heelal Oktober 1998 p
256-263
JANSSENS J lsquohet maximum van de 23ste zonnenvlekkencyclus (II)rsquo Heelal November
1998 p 284-290
JANSSENS J lsquoZonnefakkelsrsquo Heelal Oktober 1994 p 256-261
SMITS F lsquoDe coronarsquo Heelal Februari 1999 p 40-42
SMITS F lsquoProtuberanzenrsquo Heelal Juli 1991 p 182-185
VAN DEN BERGHE S lsquoHet Zeemaneffectrsquo Heelal September 1998 p 228-231
832019 Ew Afgewerkte Final
httpslidepdfcomreaderfullew-afgewerkte-final 5859
58
Webography
BOEN B Birth of a coronal mass ejection Internet
(httpwwwnasagovmission_pagessolar-b solar_005html) 290408
BRAEUNIG R A Glossary Internet (httpwwwbraeunigusspaceglossaryhtm) 2006
CORDIS Researchers reveal why Suns atmosphere is hotter than its surface Internet
(httpcordiseuropaeusearchindexcfmfuseaction=newsdocumentampN_LANG=ENampN_R
CN=30598amppid=0ampq=87F36474805A6BEC0B89404F72D0351Famptype=sim) 20032009
DAY C Alfveacuten waves may heat the Sunrsquos corona Internet
(httpblogsphysicstodayorgupdate200903 alfven-waves-may-heat-the-sunshtml)
310309
ELLERMAN F Solar prominences Internet (httparticlesadsabsharvardedufull
1928ASPL173E 0000074000html) (03042009)
ENCYCLODPEDIA OF SCIENCE Corona hole Internet
(httpwwwdaviddarlinginfoencyclopediaC coronal_holehtml) (04042009)
HATHAWAY D H The sunspot cycle Internet
(httpspacesciencespacerefcomsslpadsolarsunspots htm) 04012000
JANSSENS J The case of the missing solar cycle (published in lsquoheelalrsquo January 2008)
Internet (httpuserstelenetbejjanssensMSCwebEngpdf)
KNISELY D Solar prominences Internet
(httpwwwicstarscomHTMLSolarSectionHAlphaOBSERVINGTHESUNHAlpha3html)
(03042009)
KOPANSKI J Atom Internet (httpknolgooglecomkjan-
kopanskiatom1amrwrct7rvi27) 060209
MARTENS PC and ZWAAN C Origin and evolution of filament-prominence systems
Internet (http wwwioporgEJarticle0004-637X558287253575webpdfrequest-
id=73e38daa-69ae-4e01-b9a6-b4bd0ba071dd) 092001
NASA The corona Internet (httpsolarsciencemsfcnasagovcoronashtml) 180107
NASA The heliosphere Internet (httpheliosgsfcnasagovheliosphhtml) 20012009
OFFICIAL SITE OF STONEHENGE About Stonehenge Internet
(httpwwwstonehengecouk) (03022009)
OTTERSDORF M Astronomy On the sunspot cycle Internet
(httpuserszoominternetnet~matto MCASsunspot_cyclehtmZeemaneffect) 031103
PARIAT E and SCHMIEDER B Magnetic flux emergence Internet(httpwwwscholarpediaorgarticleMagnetic_field_emergence) 18042008
832019 Ew Afgewerkte Final
httpslidepdfcomreaderfullew-afgewerkte-final 5959
59
PRIEST E R Dynamics and Structure of Quiescent Solar Prominences Internet
(httpbooksgooglebe booksid=h599q3jz1w4Campdq=quiescent+prominencesampprintsec=fro
ntcoverampsource=blampots=58b79Qeyabampsig=1eklQ-
WszOIebZZaq7fq7gm6bxAamphl=nlampei=urPtSe7ZCo61-
Qa166jHDwampsa=Xampoi=book_resultampct=result ampresnum=3PPA6M2) 1989
RUSSELL R Rotation of the sun Internet
(httpwwwwindowsucaredutourlink=sunSolar_interior
Sun_layersdifferential_rotationhtml) 16082005
RUSSELL R Sunspots and magnetic fields Internet
(httpwwwwindowsucaredutourlink=sunatmospheresunspot_magnetismhtmlampedu=hig
h) 060908
UNIVERSITY OF GLASGOW Bibliography of Peter Sweet Internet
(httpwwwuniversitystoryglaacuk biographyid=WH2144amptype=P) (10042009)
WIKIPEDIA Orbiting Solar Observatory Internet
(httpenwikipediaorgwikiOrbiting_Solar_Observatory) 24012009
WINDOWS TEAM Maunderrsquos Butterfly Diagram Internet
(httpwwwwindowsucaredutourlink=sun activitybutterflyhtml) 2000
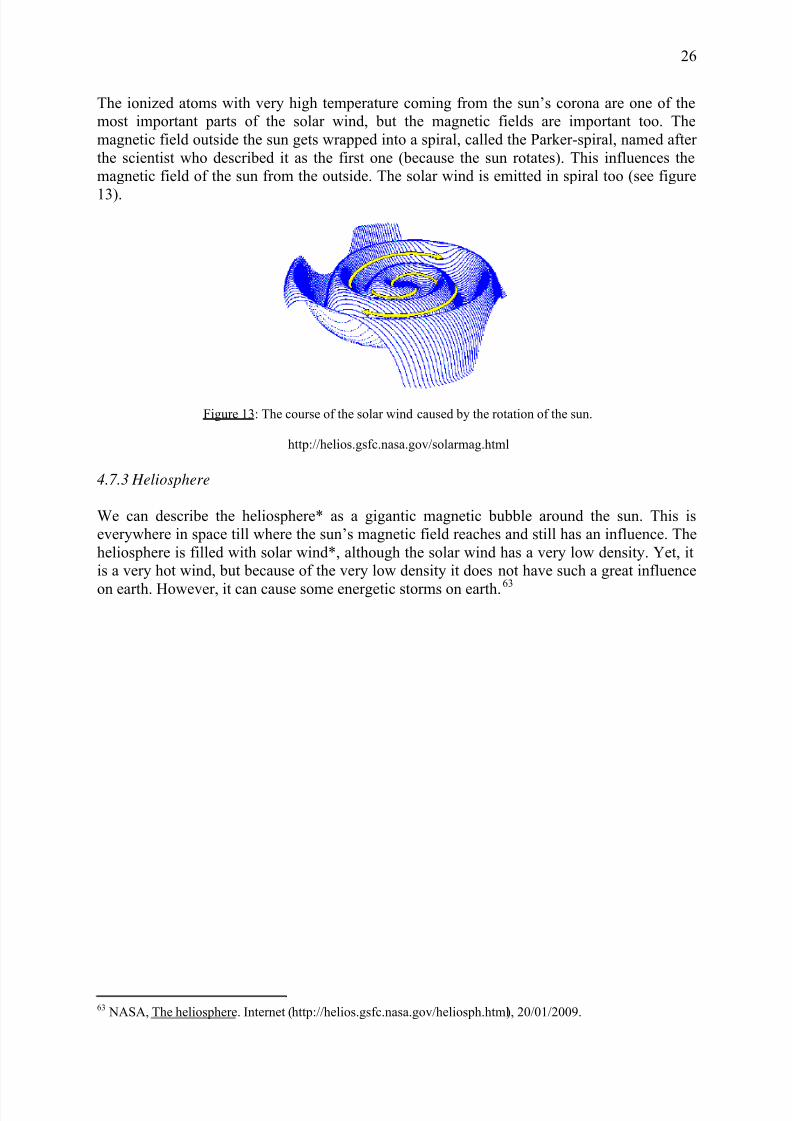
832019 Ew Afgewerkte Final
httpslidepdfcomreaderfullew-afgewerkte-final 2659
26
The ionized atoms with very high temperature coming from the sunrsquos corona are one of the
most important parts of the solar wind but the magnetic fields are important too The
magnetic field outside the sun gets wrapped into a spiral called the Parker-spiral named after
the scientist who described it as the first one (because the sun rotates) This influences the
magnetic field of the sun from the outside The solar wind is emitted in spiral too (see figure
13)
Figure 13 The course of the solar wind caused by the rotation of the sun
httpheliosgsfcnasagovsolarmaghtml
473 Heliosphere
We can describe the heliosphere as a gigantic magnetic bubble around the sun This is
everywhere in space till where the sunrsquos magnetic field reaches and still has an influence The
heliosphere is filled with solar wind although the solar wind has a very low density Yet it
is a very hot wind but because of the very low density it does not have such a great influence
on earth However it can cause some energetic storms on earth63
63 NASA The heliosphere Internet (httpheliosgsfcnasagovheliosphhtml) 20012009
832019 Ew Afgewerkte Final
httpslidepdfcomreaderfullew-afgewerkte-final 2759
27
Conclusion
The sunrsquos magnetic field is a complex system to understand Yet I hope you have learned a
lot from this paper and that you do understand the exiting phenomena described in the
previous chapters
We can discuss the sunrsquos magnetic field from two perspectives The first one is looking at the
magnetic field for global long-term changing dimensions The second way is based on
phenomena on lower scale
The global changes involve the solar cycle and the switch of the magnetic poles The solar
cycle is divided into a decrease of the solar activity until it reaches solar minimum and an
increase of the solar activity until it reaches solar maximum The frequency of the phenomena
that can be found in the outer layers of the sun are directly connected to the solar activity and
thus to the solar cycle Sunspots are the easiest to see they appear as black spots against the
much brighter surface of the sun Corona loops are connected to sunspots and can extend into
solar flares and solar prominences These flares and prominences can burst out into a coronalmass ejection All these phenomena influence the sun and its solar wind how small their part
may be The solar wind has a directly influence on the earth
There is still much to be discovered Astronomers hope to discover much more about the
magnetic field of the sun Today many astronomers and scientists are observing the sun and
every day they discover more and more aspects of the sun Recently a group of researchers
led by David Jess of Queens University Belfast has revealed why the sunrsquos atmosphere is
hotter than its surface64 As you can see astronomy is a very developing science
64
CORDIS Researchers reveal why Suns atmosphere is hotter than its surface Internet (httpcordiseuropaeusearchindexcfmfuseaction=newsdocumentampN_LANG=ENampN_RCN=30598amppid=0ampq=87F36474805A6BEC0B89404F72D0351Famptype=sim) 20032009
832019 Ew Afgewerkte Final
httpslidepdfcomreaderfullew-afgewerkte-final 2859
28
Glossary
Absorption lines A dark line superimposed on a continuous spectrum when a gas absorbs
light from a continuous source that is hotter than the absorbing gas
Aurora Light radiated by atoms and ions formed by the solar wind in the earthrsquos upper atmosphere seen most commonly in the polar regions
Chromosphere The layer in the solar atmosphere between the photosphere and the corona It
is the lowest layer of the atmosphere characterized by reddish hue and by an increase of the
temperature with altitude through all but its lower regions
Convection The transfer of heat from a region of high temperature to a region of lower
temperature by the displacement of the cooler molecules by the warmer molecules The hot
gas will be moved upwards the cool gas will be pushed downwards into the sun
Corona The sunrsquos outer atmosphere It is very extensive and has a very low density It isextremely hot
Coronal hole A dark region of the sunrsquos inner corona as seen at X-ray wavelengths
Coronal loop Closed loops of magnetic field lines extending from the sunrsquos photosphere into
the corona which contain plasma at high temperature They are typically observed through
ultraviolet or x-ray emission from the hot plasma
Coronal mass ejection Large volumes of high energy gas released from the sunrsquos corona
Differential rotation The rotation of a non rigid object in which parts at different latitudes or
different radial distances move at different speeds
Dynamo theory The generation of a magnetic field by circulating electric charges
Eclipse The blocking of a part or all of the light from the moon by the earth (lunar eclipse) or
from the sun by the moon (solar eclipse)
Emission lines Emission lines are used in physics chemistry and astronomy to determine
what kind of gas is doing the emission Every element has a different electronic structure and
will thus have a different emission line fingerprint Emission lines are produced whenelectrons in atoms jump from one energy level to lower energy level
Filament A dark curve seen above the sunrsquos photosphere that is the top view of a solar
prominence
Flux tube Is a generally tube-like (cylindrical) region of space containing a magnetic field
such that the field at the side surfaces is parallel to them Both the cross-sectional area of the
tube and the field contained may vary along the length of the tube but the magnetic flux is
always constant
832019 Ew Afgewerkte Final
httpslidepdfcomreaderfullew-afgewerkte-final 2959
29
Geomagnetic storm When unusually strong surges of solar wind (charged particles from the
Sun) hit the Earth This effect causes variations in the magnetic field which surrounds the
Earth The visible results are eg the aurora (Northern and Southern lights)
Granulation Granules are related to the convective zone The granulation that shows up in the
photosphere is a result of the rising and falling of hot gas that takes place in the convectivezone
Hα absorption line An absorption line due to an electronic transition in hydrogen atoms in
which the atom absorbs a photon so that the electron makes a transition from a state
corresponding to the electronic energy level with n=2 to the one above with n=3 The photon
wavelength in a vacuum is 6563 nm
Heliosphere The volume of space within which the sun through the solar wind influences its
environment in the interstellar medium
Magnetic dynamo A theory that explains phenomena of the solar cycle as a result of periodicwinding and unwinding of the sunrsquos magnetic field in the solar atmosphere
Magnetic reconnection A process taking place in a plasma in which neighbouring
oppositely directed magnetic field lines suddenly part and reconnect in a new configuration
The abrupt change in a magnetic field represented by this process can release large amounts
of energy and it is thought to be important in explaining solar flares and other phenomena
Penumbra The portion of a shadow in which only part of the light source is covered by the
shadow-making body
Photosphere The region in the solar atmosphere from which most of the visible light escapes
into space
Plasma A fourth state of matter (not found naturally on Earth) of very hot gases Plasma is a
fluid with the ability to carry electric currents with no local accumulations of electric charge
Prominence Flamelike protrusion seen near the limb of the sun and extending into the solar
corona The side view of a filament
Quantum theory A theory in physics based on the principle that matter and energy have the
properties of both particles and waves created to explain the radiation of energy from a blackbody the photoelectric effect and the Bohr theory and now used to account for a wide
range of physical phenomena including the existence of discrete packets of energy and
matter the uncertainty principle and the exclusion principle Itrsquos a theory of the interaction of
matter and radiation developed early in the twentieth century which is based on the
quantization of energy and applied to a wide variety of processes that involve an exchange of
energy at the atomic level
Reconnection See magnetic reconnection
Solar cycle A 22-year-cycle during which the sunrsquos magnetic field reverses its polarity twice
Solar flare A violent eruption on the sunrsquos surface
832019 Ew Afgewerkte Final
httpslidepdfcomreaderfullew-afgewerkte-final 3059
30
Solar wind An outward flow of particles (mostly electrons and protons) from the sun
Solstice Either of two points along the ecliptic at which the Sun reaches its maximum
distance north or south of the celestial equator
Spectroscopy Concerns the production and study of spectra
Spectrum The result of electromagnetic radiation passing through a prism or grating so that
different wavelengths are separated
Spicule Short-lived (lifetime from rising to falling is about 15 minutes) jets vertical to the
solar surface that are several thousand kilometres long and about 1 kilometre thick (see also
appendix IV) in the solar chromosphere
Sunspot A temporary cool region in the solar photosphere created by protruding magnetic
fields
Umbra The central completely dark portion of a shadow
Zeemaneffect A splitting of spectra lines in the presence of a magnetic field
Bibliography and webography of the glossary
COMINS NF and KAUFMANN III WJ Discovering the universe eighth edition WH
Freeman and Company New York 2008 535 p
GREEN SF and JONES M H An introduction to the Sun and Stars The Open University
Cambridge 2004 373 p
httpenmimihuastronomygranulationhtml
httpenmimihuastronomyplasmahtml
httpwwwspacecomspacewatchspace_weather_glossaryhtml
httpenmimihuastronomyemission_linehtml
httpenmimihuastronomyabsorption_linehtml
httpwwwpbsorgfaithandreasonphysglossqm-bodyhtml
httpwwwanswerscomtopicquantum-theory
httpenwikipediaorgwikiFlux_tube
832019 Ew Afgewerkte Final
httpslidepdfcomreaderfullew-afgewerkte-final 3159
31
Appendix I The sun in figures
Physical quantity Comment
Radius 695 510 km 109 x earths radius
Mass 1989 x1030 kg 332 946 earths mass
Mass sun in the solar
system
9986 Total mass sun total mass of
our solar system
Volume 1412 x10sup3sup3 cmsup3 13 million x earths volume
Age 455 milliard years
Luminosity 3854 x 10sup3sup3 ergss
Magnitude -2773
Density center 1513 gcmsup3
Density mean 1409 gcmsup3
Pressure center 2334 x1011 bars
Pressure photosphere 00001 bar
Temperature center 15 557 000deg K
Temperature photosphere 5 780deg K Various sources mention
different grades
Temperature corona 2 000 000 to 3 000 000deg K
Rotation time at North or
South pole
up to 35 days on earth
Rotation time at Equator 25 days on earth The difference in rotation
times is called differential
rotation
Rotation time general 2538 days on earth
Mean distance sun-earth
(AU)
14959787 x108 km 1 AU = 1 Astronomical Unit
= 149 598 000 km
Chemical composition of
the sun ( of total number
of atoms)
Hydrogen 921
Helium 78
All others 01
Various sources mention
slightly different percentages
832019 Ew Afgewerkte Final
httpslidepdfcomreaderfullew-afgewerkte-final 3259
32
Chemical composition of
the sun ( of total mass)
Hydrogen 7346
Helium 2485
All others 169
Various sources mention
slightly different percentages
Total transforming of
hydrogen into helium persecond
700 billions of kilograms of
hydrogen are transformedinto 6957 billions of
kilograms of helium each
second
Based on the following references
- BEATTY JK PETERSEN CC and CHAIKIN A The new solar system fourth edition
Cambridge University Press Cambridge 1999 p 421
- LILENSTEN J and BORNAREL J Sous les feux du soleil EDP Sciences Les Ulis
Cedex A 2001 p 247
- LANG KR Sun earth and sky Springer Germany 1995 p 282- DENTHIER T Het zonnestelsel Standaard Uitgeverij 1992 p 415
- JANSSENS J Zon en aarde een unieke relatie Garant Antwerpen 2003 p 254- VOLKSSTERRENWACHT URANIA VZW De zon Internet(httpwwwuraniabesterrenkundezonnestelselzonphp) (01012009)
832019 Ew Afgewerkte Final
httpslidepdfcomreaderfullew-afgewerkte-final 3359
33
Appendix II Anatomy of the sun
httpwwwcosmographicacomgalleryinfographicssolar_anatomyhtml
The middle the sun consists of a heavy core this consists of plasma just as the outer layers
of the sun but the pressure in the core is so high that it behaves much more like a solid bodyThe most outer layer is the corona it reaches far into space More to the inside there is the
chromosphere and then the photosphere The corona the chromosphere and the
photosphere are explained in chapter 1
832019 Ew Afgewerkte Final
httpslidepdfcomreaderfullew-afgewerkte-final 3459
34
Appendix III Granulation
httpwwwwindowsucaredutourlink=sunSolar_interiorsolar_furnacehtml
At the surface of the sun we can find granules These are created by convection the warmest
parts of the sunrsquos interior move upwards and the colder parts at the surface move downwardsThis causes currents of plasma The dark lines are the colder particles We see them darker
because they emit less light than their surrounding neighbourhood
832019 Ew Afgewerkte Final
httpslidepdfcomreaderfullew-afgewerkte-final 3559
35
Appendix IV Spicules
Picture httplpc1clpccdcccauslpcharpellastro20a20deinfo_s09htmInformation httpwwwdaviddarlinginfoencyclopediaSspiculehtml
On this picture you can see spicules Spicules only last for several minutes and can be foundin the chromosphere They are little jets of gas There also exist macrospicules that can be
approximately ten times larger than a normal spicule
832019 Ew Afgewerkte Final
httpslidepdfcomreaderfullew-afgewerkte-final 3659
36
Appendix V The most important satellites observing the sun
Here you can find the most important satellites observing the sun and their missions
Solar and Heliospheric Obseratory (SOHO)
httpsohowwwnascomnasagovaboutabouthtml
SOHO the Solar amp Heliospheric Observatory is a project of international collaboration
between ESA and NASA to study the Sun from its deep core to the outer corona and the solar
wind
SOHO was launched on December 2 1995 The SOHO spacecraft was built in Europe by an
industry team led by prime contractor Matra Marconi Space (now EADS Astrium) under
overall management by ESA The twelve instruments on board SOHO were provided by
European and American scientists Nine of the international instrument consortia are led by
European Principal Investigators (PIs) three by PIs from the US Large engineering teamsand more than 200 co-investigators from many institutions supported the PIs in the
development of the instruments and in the preparation of their operations and data analysis
NASA was responsible for the launch and is now responsible for mission operations Large
radio dishes around the world which form NASAs Deep Space Network are used for data
downlink and commanding Mission control is based at Goddard Space Flight Center in
Maryland
More information about SOHO can be found on
httpsohowwwnascomnasagovaboutdocsSOHO_Fact_Sheetpdf
832019 Ew Afgewerkte Final
httpslidepdfcomreaderfullew-afgewerkte-final 3759
37
Transition Region and Coronal Explorer (TRACE)
httptracelmsalcomProjectMissionmissionhtm
TRACE enables solar physicists to study the connections between fine-scale magnetic fields
and the associated plasma structures on the Sun in a quantitative way by observing the photosphere the transition region and the corona With TRACE these temperature domains
are observed nearly simultaneously (with as little delay as only a second between different
wavelengths) with a spatial resolution of one second of arc
This is accomplished by obtaining precisely coaligned image sequences of photosphere
transition region and corona with high spatial resolution and uninterrupted viewing of the
Sun for up to eight months
TRACE Mission
TRACE explores the magnetic field in the solar atmosphere by studyingbull The 3-dimensional field structure
bull Its temporal evolution in response to photospheric flows
bull The time-dependent coronal fine structure
bull The coronal and transition region thermal topology
TRACE was launched on a Pegasus launch vehicle from Vandenberg Air Force Base in April
1998 The launch was scheduled to allow joint observations with SOHO during the rising
phase of the solar cycle to sunspot maximum No transition region or coronal imager has
witnessed the onset and rise of a solar cycle
Pegasus in flight
The two satellites provide complementary observations TRACE produces the high spatial
and temporal resolution images while SoHO yields images and spectral data out to 30 solar
radii at much lower spatial and temporal resolution Jointly they provide the opportunity to
obtain simultaneous digital measurements of all the temperature regimes of the solar
atmosphere in both high-resolution imaging and spectroscopy
With these data we expect to shatter the current ignorance of coronal heating and impulsive
MHD phenomena with benefits not only to solar physics but also to studies ranging from
stellar activity to the MHD of accretion disks The magnetograms produced by MDI on SoHO
provide a complete record of the eruption and distribution of photosphere magnetic fields
which will be invaluable for understanding TRACE observations of coronal hole formation
and coronal mass ejections Both of these phenomena have profound effects on our space
environment and the Earth`s magnetic field
TRACE is the first US solar research satellite since the Solar Maximum Mission
Coordination with SOHO provides an unprecedented opportunity to follow the emergence of
magnetic flux from the base of the convection zone deep inside the Sun through the
photosphere chromosphere and transitional region to the low-beta outer corona while
observing the effects of this emergence such as coronal mass ejections with high spatial andtemporal resolution
832019 Ew Afgewerkte Final
httpslidepdfcomreaderfullew-afgewerkte-final 3859
38
The transition from the photosphere where magnetic fields and plasma are in rough
equipartition to the corona where magnetic fields dominate is extremely difficult to model
and until recently to observe at high temporal and spatial resolution Many of the physical
problems that arise here such as plasma confinement reconnection wave propagation and plasma heating arise throughout space physics and astrophysics The detailed study of these
processed in the solar outer atmosphere is invaluable to astrophysics in general and stellar
studies in particular
More information about TRACE observations can be found on
httptracelmsalcomOperationsGeneraloperatiohtm
832019 Ew Afgewerkte Final
httpslidepdfcomreaderfullew-afgewerkte-final 3959
39
Reuven Ramaty High Energy Solar Spectroscopic Imager (RHESSI)
httphesperiagsfcnasagovhessibrochurehtm
What Questions will HESSI Address
bull How is such a large amount of energy released so rapidly during a flare
bull How are so many electrons and protons accelerated so quickly to such high energies
bull Where are the electrons and protons accelerated in the solar atmosphere and where do
they deposit their energy
How will HESSI Address these Questions
HESSI shown below will concentrate on electrons and protons accelerated in solar flares
through observations of the X-rays and gamma rays that they produce
bull HESSI will obtain the first ever X-ray and gamma-ray images of flares from 100 keV
to 20 MeVbull HESSI will do the first ever nuclear gamma-ray line spectroscopy of solar flares
bull HESSI will obtain pictures of flares in X-rays with an angular resolution of 2
arcseconds a factor of three better than previously possible
bull HESSI will measure X-ray and gamma-ray spectra with less than 1 keV energy
resolution a factor of 20-40 better than previously possible with scintillation counters
More information about the RHESSIrsquos Mission can be found on
httphesperiagsfcnasagovhessiconcepthtm
832019 Ew Afgewerkte Final
httpslidepdfcomreaderfullew-afgewerkte-final 4059
40
Solar Radiation and Climate Experiment (SORCE)
httplaspcoloradoedusorcesciencebackgroundhtm
The Solar Radiation and Climate Experiment (SORCE) is a NASA-sponsored satellite
mission that is providing state-of-the-art measurements of incoming x-ray ultraviolet visiblenear-infrared and total solar radiation The measurements provided by SORCE specifically
address long-term climate change natural variability and enhanced climate prediction and
atmospheric ozone and UV-B radiation These measurements are critical to studies of the Sun
its effect on our Earth system and its influence on humankind
The SORCE spacecraft was launched on January 25 2003 on a Pegasus XL launch vehicle to
provide NASAs Earth Science Enterprise (ESE) with precise measurements of solar
radiation It launched into a 645 km 40 degree orbit and is operated by the Laboratory for
Atmospheric and Space Physics (LASP) at the University of Colorado (CU) in Boulder
Colorado USA It will continue the precise measurements of total solar irradiance (TSI) that
began with the ERB instrument in 1979 and has continued to the present with the ACRIM series of measurements SORCE will also provide the measurements of the solar spectral
irradiance from 1nm to 2000nm accounting for 95 of the spectral contribution to TSI
SORCE carries four instruments including the Spectral Irradiance Monitor (SIM) Solar
Stellar Irradiance Comparison Experiment (SOLSTICE) Total Irradiance Monitor (TIM) and
the XUV Photometer System (XPS)
The primary goal of the NASA Earth Observing Systems (EOS) SOlar Radiation and Climate
Experiment (SORCE) is to enable solar-terrestrial studies by providing precise daily
measurements of the total solar irradiance (TSI) and the solar spectral irradiance atwavelengths extending from the ultraviolet to the near infrared The following lists the
SORCE science objectives
1 Make accurate measurements with high precision of total solar irradiance connect
them to previous TSI measurements and continue this long-term climate record
Provide TSI with an accuracy of 001 (100 parts per million) based on SI units and
with a long-term repeatability of 0001yr
2 Make daily measurements of the solar ultraviolet irradiance from 120 to 300 nm with
a spectral resolution of 1 nm Achieve this spectral irradiance measurement with an
accuracy of better than 5 and with a long-term repeatability of 05yr Use the
solarstellar comparison technique to relate the solar irradiance to the ensembleaverage flux from a number of bright early-type stars (same stars used by the UARS
SOLSTICE program)
3 Make the first measurements of the visible and near IR solar irradiance with sufficient
precision for future climate studies Obtain daily measurements of solar spectral
irradiance between 03 and 2 microm with a spectral resolution of at least 130 an
accuracy of 003 and a long-term repeatability of better than 001yr
4 Improve the understanding of how and why solar irradiance varies estimate past and
future solar behavior and investigate climate responses
More information about SORCE can be found on
httplaspcoloradoedusorcesciencescience_opshtm
832019 Ew Afgewerkte Final
httpslidepdfcomreaderfullew-afgewerkte-final 4159
41
Appendix VI Wavelengths
httpeosweblarcnasagovEDDOCSWavelengths_for_Colorshtml
As you can see on the figure visible light situates in the centre of the wavelengths having not
the shortest nor the longest wavelengths Gamma rays have the shortest wavelength radioways the longest All sort of wavelengths are used for daily purpose like radio waves for
radio and TV and gamma rays for treatments
832019 Ew Afgewerkte Final
httpslidepdfcomreaderfullew-afgewerkte-final 4259
42
Appendix VII Absorption lines in the sunrsquos spectrum
Picture httpwwwsolarnavigatornetthe_sunhtmExplanation COMINS NF and KAUFMANN III WJ Discovering the universe eighth edition WHFreeman and Company New York 2008 p 109
This photo is called a spectrogram It contains the spectrum of the sun All the black lines are
absorption lines The amount of black lines is related to the amount of elements that the sun
is emitting From a spectrogram we can deduct a lot of things including their mass the
temperature of the surface the chemical composition of the sun rotation rates and much
more
832019 Ew Afgewerkte Final
httpslidepdfcomreaderfullew-afgewerkte-final 4359
832019 Ew Afgewerkte Final
httpslidepdfcomreaderfullew-afgewerkte-final 4459
44
Appendix IX Butterfly-diagram
httpspacesciencespacerefcomsslpadsolarimagesbflygif
A butterfly-diagram
In a butterfly-diagram we can find the sunspots with their latitude (y-axis) through the years(x-axis) As you can see the sunspots appear like lsquobutterfliesrsquo this was discovered in 1904 by
Edward Maunder (1851-1928 an English astronomer best remembered for his study of
sunspots and the solar magnetic cycle) Thatrsquos why this graph is also called Maunders
butterfly diagram
832019 Ew Afgewerkte Final
httpslidepdfcomreaderfullew-afgewerkte-final 4559
45
Appendix X The Wolf-numbers
httpsidcomabenews106sunspotnumberclarifiedpdf
The sunspot number clarified By Petra Vanlommel
Which kinds of daily International Sunspot Numbers (ISN) are currentlypublished by the SIDC
Three daily indices are currently published by the SIDCthe Estimated ISN (EISN)the Provisional ISN (PISN)the Definitive ISN (DISN)Although they are all based on the same type of observations ie visual sunspot counts as ameasure of solar activity they are obtained from different data sets by different processingmethods with different accuracies and they serve different purposes
In the ideal case the three numbers are equal but in practice it is inevitable that there aresmall differences Therefore It is useful to explain what each index actually means
What is the source of the Wolf number
Once per day observers worldwide communicate their measured Wolf number (= 10G + S)based on visual sunspot (S) and group (G) counts to the World Data Center for the SunspotIndex Presently this is done through a dedicated password-protected WEB form the Wolfinterface However some observers still use the old way of reporting their observations onpaper through regular mail This method slows down the final processing but for the sake ofcontinuity in the index it is important to keep these observers included as some of them
represent the longest individual datasetsThe observers give the exact observing time the observing conditions the total numbers(group count sunspot count and Wolf number) and optionally the NorthSouth and centralzone numbers The observers using the web interface can provide their results to the SIDCimmediately after each observation However some users prefer to insert their data as ablock creating some delay but this must be done at least once a month
The personal reduction coefficient K
A personal reduction coefficient K is calculated for each station It has values typically in therange 04 and 17 and leads to a normalized sunspot number K(10G+S) In other words theK factor rescales the raw sunspot counts of each observer to the ones of Rudolph Wolf the
astronomer who introduced the above Wolf formula thus simulating the same eyes sametelescope and same conditionsDuring the procedure for calculating the Provisional ISN the K factor of every station iscomputed for every observation that passes the elimination procedure Once a year apersonal K factor for every station and for every month of the previous year is calculated Ayearly mean K value per station is also computed
The estimated sunspot index
The Estimated ISN (EISN) is calculated and issued on a daily basis for the day of calculationand the day before Only the total EISN is calculated with no hemispheric index It is anautomated procedure and no manual intervention is done The EISN is meant as a quicktemporary and approximate index for real-time applications
832019 Ew Afgewerkte Final
httpslidepdfcomreaderfullew-afgewerkte-final 4659
46
We use the raw Wolf number from all observatories that have provided counts early in theday ie before 1230 UT Typically there is between 10 and 20 stations available Thecalculation of the EISN is based on a simple and straightforward statistical method The Wolfnumbers are multiplied with the yearly mean K factor (see paragraph about the personalreduction coefficient K) The EISN is a simple average of the K-scaled values after excludingany individual value that deviates abnormally from the other valuesOnce the Provisional ISN (PISN) is calculated after the end of a month the temporary EISNis dropped and replaced by the PISN
The provisional sunspot Index
The Provisional ISN (PISN) is calculated and issued on the first of every month Theoutcome is a daily total and hemispheric sunspot number for the entire elapsed month Anexample on the first of September we calculate the daily PISN for each day of August ThePISN is computed semi-automatically with as little manual intervention as possibleTo calculate the PISN values for the concerned month we use all Wolf numbers Typicallythere is data from around 65 stations available
The calculation of the PISN is based on an extensive statistical treatment This treatmentfilters out any abnormal daily observation or the complete data set from an erratic station(quality control) This prevents long-term drifts in the resulting index One of the key elementsderived from this processing is to update the K reduction coefficients for each station theevolution of each station is monitored for each day relative to the entire networkA subset of the contributing stations also provides hemispheric counts A similar process isapplied to the North and South counts to derive the hemispheric PISN There is an additionalconstraint the sum of the North and South ISN must match the total ISNThe PISN replaces the EISN And once the Definitive ISN (DISN) is calculated the DISNreplaces the PISN
The definitive sunspot index
The Definitive ISN is calculated and issued on a quarterly basis when we have collecteddata from all the contributing observatories This is the final index and it is appended to thehistorical sunspot index time series The same semi-automated treatment as for the PISN isnow applied to the full data set If the result agrees within 5 of the PISN value the PISN iskept and becomes definitive Otherwise the new calculated value replaces the PISN andbecomes the definitive ISNIt is only at this stage and only in peculiar situations that a manual verification by ourscientific staff is required For example this happens when the observed raw Wolf valuesfrom the whole network are clustered around two distinct values This special case can becaused by small short-lived isolated sunspots (lifetimes lt 24 hours) or by the appearance ordisappearance of a large group at the solar limb in the course of one UT dayThe DISN replaces the provisional and estimated International Sunspot Number
Handling very low activity levels
One of the situations requiring a human arbitration is associated with single small isolatedand short-lived sunspots This is most noticeable around the minimum of the solar activitycycle like the one occurring now in 2008 Due to the 24hour binning (observations aregrouped between 0hUT and 24hUT) and the variable ability of each observer to detect thesmallest sunspots we end up with some stations reporting one sunspot and others who didno see any sunspot Let us explain further No sunspot may mean that the sunspot waspresent but the observer was unable to see it because of poor observational conditions such
as weather a small telescope On the other hand it may also indicate that the sunspot hadactually vanished by that time while it was present earlier on the same day
832019 Ew Afgewerkte Final
httpslidepdfcomreaderfullew-afgewerkte-final 4759
47
Individual stations do not observe at exactly the same timeIn order to validate the existence of such a marginal reported sunspot a qualified SIDCscientist must then check the detailed chronology within that day and consider the overallobserver capability (value of K coefficient)In common practice the fact that a sunspot is reported by a significant group of observersleads to the inclusion of the sunspot on that date thus neglecting the no-sunspotobservationsThe rationale is multiple observations of a sunspot exclude the possibility that the reportedsunspot was an independent false detection So a sunspot was really present on that dayalthough it may have existed only for part of the day or it was small enough to be missed bypart of the observers with smaller instruments or imperfect atmospheric conditionsAlso keep in mind that the sunspot index is derived with a limited precision just like any otherindex If the monthly mean sunspot number is 0 or 05 you can definitely say that activitywas low
What index should be used
If you want to perform long-term investigations the definitive ISN series is definitely the mostsuitable However there is a delay of a few months So when investigating the last cycle andrecent evolution use the definitive numbers in combination with the provisional ISN to be upto date to the last month The provisional numbers are also used in models forecasting thesunspot number for the coming months Now if you need a proxy for solar activity in a modelthat runs in real-time then you may use the estimated ISNImprovements and rethinking of the processing method is an ongoing project We arecurrently developing an alternative program for calculating the PISN Of course long-termconsistency is vital Therefore a cross-analysis between the output from the old and newsoftware must be applied over an extended period
832019 Ew Afgewerkte Final
httpslidepdfcomreaderfullew-afgewerkte-final 4859
48
Above graphs show different kinds of the International Sunspot Number The left plot gives an overview from 1700 up to now from the yearly (black) and monthly smoothed Sunspot Number The graph in the right top corner shows the monthly and monthly smoothed sunspot number while the graph in the right bottom corner show the daily monthly smoothed monthly sunspot number For every the time range of investigation there is an appropriate sunspot number
832019 Ew Afgewerkte Final
httpslidepdfcomreaderfullew-afgewerkte-final 4959
49
Appendix XI Filaments and prominences
httpsohowwwnascomnasagovpickoftheweekold26feb2004
This is a picture taken by SOHO on 26 February 2004
832019 Ew Afgewerkte Final
httpslidepdfcomreaderfullew-afgewerkte-final 5059
50
Appendix XII The reconnection of magnetic loops
httpwwwioporgEJarticle0004-637X558287253575webpdfrequest-id=73e38daa-69ae-4e01-b9a6- b4bd0ba071dd
In (a) sunspot B and C have different polarity and move towards each other The twomagnetic loops will reconnect and form one big magnetic loop showed in (b) This will
happen to other magnetic loops too as can be seen in (c) When G en F are close enough they
will reconnect and so E en H will reconnect too It is possible that the magnetic field line is
trapped around another in this case AD The mass ejected from the sun will be trapped
between the magnetic field lines and form a solar prominence
832019 Ew Afgewerkte Final
httpslidepdfcomreaderfullew-afgewerkte-final 5159
832019 Ew Afgewerkte Final
httpslidepdfcomreaderfullew-afgewerkte-final 5259
52
httptheinvisibleagentwordpresscom20090117amazing-celestial-images
An group of active prominences
httpapodnasagovapodap051109html
httpwhassupinthemilkywayblogspotcom200903cloudy-planhtml
A picture taken by SOHO In the left corner you can see the prominence with twisted
magnetic field lines
832019 Ew Afgewerkte Final
httpslidepdfcomreaderfullew-afgewerkte-final 5359
53
Appendix XIV Polar crown
httpsciencenasagovheadlinesy200817sep_polarcrownhtm
Photograph of a polar crown taken on 13 June 1999 by the Meudon Observatory
832019 Ew Afgewerkte Final
httpslidepdfcomreaderfullew-afgewerkte-final 5459
54
Appendix XV Coronal holes
httpsunearthdaynasagov2007multimediagal_020php
The black segment is a huge coronal hole The bright parts are x-rays from sunspots
832019 Ew Afgewerkte Final
httpslidepdfcomreaderfullew-afgewerkte-final 5559
55
Appendix XVI Coronal mass ejection
httpzuserver2staruclacuk~idhapodap000309html
Picture of a CME taken by SOHO in February 2000
832019 Ew Afgewerkte Final
httpslidepdfcomreaderfullew-afgewerkte-final 5659
56
Bibliography
Books
BEATTY JK PETERSEN CC and CHAIKIN A The new solar system fourth edition
Cambridge University Press Cambridge 1999 421 p
COMINS NF and KAUFMANN III WJ Discovering the universe eighth edition WH
Freeman and Company New York 2008 535 p
DETHIER T Het zonnestelsel Standaard Uitgeverij 1992 415 p
GOLUB L and PASACHOFF JM Nearest star the surprising science of our sun Harvard
university press Harvard 2001 267 p
GREEN SF and JONES M H An introduction to the Sun and Stars The Open University
Cambridge 2004 373 p
HILL S and CARLOWITZ M The sun Abrams New York 2006 239 p
HOLMAN GD lsquoThe mysterious origins of solar flaresrsquo Scientific America April 2006 p
24-31 volume 294 number 4
JANSSENS J Zon en aarde een unieke relatie Garant Antwerpen 2003 254 p
KELLER H-U Van Supernovarsquos tot zwarte gaten Tirion Natuur AH Baarn 2003 169 p
LANG KR Sun earth and sky Springer Germany 1995 282 p
LILENSTEN J and BORNAREL J Sous les feux du soleil EDP Sciences Les Ulis Cedex
A 2001 247 p
832019 Ew Afgewerkte Final
httpslidepdfcomreaderfullew-afgewerkte-final 5759
57
Articles
CUYPERS J and others lsquoLa rechercheacute en heacuteliophysique en Belgiquersquo Space connection
October 2007 20 p
DE KEYSER J lsquoDe magnetopauzersquo Heelal maart 1998 p 66-73
JANSSENS J lsquoHet maximum van de 23ste zonnevlekkencyclus (I)rsquo Heelal Oktober 1998 p
256-263
JANSSENS J lsquohet maximum van de 23ste zonnenvlekkencyclus (II)rsquo Heelal November
1998 p 284-290
JANSSENS J lsquoZonnefakkelsrsquo Heelal Oktober 1994 p 256-261
SMITS F lsquoDe coronarsquo Heelal Februari 1999 p 40-42
SMITS F lsquoProtuberanzenrsquo Heelal Juli 1991 p 182-185
VAN DEN BERGHE S lsquoHet Zeemaneffectrsquo Heelal September 1998 p 228-231
832019 Ew Afgewerkte Final
httpslidepdfcomreaderfullew-afgewerkte-final 5859
58
Webography
BOEN B Birth of a coronal mass ejection Internet
(httpwwwnasagovmission_pagessolar-b solar_005html) 290408
BRAEUNIG R A Glossary Internet (httpwwwbraeunigusspaceglossaryhtm) 2006
CORDIS Researchers reveal why Suns atmosphere is hotter than its surface Internet
(httpcordiseuropaeusearchindexcfmfuseaction=newsdocumentampN_LANG=ENampN_R
CN=30598amppid=0ampq=87F36474805A6BEC0B89404F72D0351Famptype=sim) 20032009
DAY C Alfveacuten waves may heat the Sunrsquos corona Internet
(httpblogsphysicstodayorgupdate200903 alfven-waves-may-heat-the-sunshtml)
310309
ELLERMAN F Solar prominences Internet (httparticlesadsabsharvardedufull
1928ASPL173E 0000074000html) (03042009)
ENCYCLODPEDIA OF SCIENCE Corona hole Internet
(httpwwwdaviddarlinginfoencyclopediaC coronal_holehtml) (04042009)
HATHAWAY D H The sunspot cycle Internet
(httpspacesciencespacerefcomsslpadsolarsunspots htm) 04012000
JANSSENS J The case of the missing solar cycle (published in lsquoheelalrsquo January 2008)
Internet (httpuserstelenetbejjanssensMSCwebEngpdf)
KNISELY D Solar prominences Internet
(httpwwwicstarscomHTMLSolarSectionHAlphaOBSERVINGTHESUNHAlpha3html)
(03042009)
KOPANSKI J Atom Internet (httpknolgooglecomkjan-
kopanskiatom1amrwrct7rvi27) 060209
MARTENS PC and ZWAAN C Origin and evolution of filament-prominence systems
Internet (http wwwioporgEJarticle0004-637X558287253575webpdfrequest-
id=73e38daa-69ae-4e01-b9a6-b4bd0ba071dd) 092001
NASA The corona Internet (httpsolarsciencemsfcnasagovcoronashtml) 180107
NASA The heliosphere Internet (httpheliosgsfcnasagovheliosphhtml) 20012009
OFFICIAL SITE OF STONEHENGE About Stonehenge Internet
(httpwwwstonehengecouk) (03022009)
OTTERSDORF M Astronomy On the sunspot cycle Internet
(httpuserszoominternetnet~matto MCASsunspot_cyclehtmZeemaneffect) 031103
PARIAT E and SCHMIEDER B Magnetic flux emergence Internet(httpwwwscholarpediaorgarticleMagnetic_field_emergence) 18042008
832019 Ew Afgewerkte Final
httpslidepdfcomreaderfullew-afgewerkte-final 5959
59
PRIEST E R Dynamics and Structure of Quiescent Solar Prominences Internet
(httpbooksgooglebe booksid=h599q3jz1w4Campdq=quiescent+prominencesampprintsec=fro
ntcoverampsource=blampots=58b79Qeyabampsig=1eklQ-
WszOIebZZaq7fq7gm6bxAamphl=nlampei=urPtSe7ZCo61-
Qa166jHDwampsa=Xampoi=book_resultampct=result ampresnum=3PPA6M2) 1989
RUSSELL R Rotation of the sun Internet
(httpwwwwindowsucaredutourlink=sunSolar_interior
Sun_layersdifferential_rotationhtml) 16082005
RUSSELL R Sunspots and magnetic fields Internet
(httpwwwwindowsucaredutourlink=sunatmospheresunspot_magnetismhtmlampedu=hig
h) 060908
UNIVERSITY OF GLASGOW Bibliography of Peter Sweet Internet
(httpwwwuniversitystoryglaacuk biographyid=WH2144amptype=P) (10042009)
WIKIPEDIA Orbiting Solar Observatory Internet
(httpenwikipediaorgwikiOrbiting_Solar_Observatory) 24012009
WINDOWS TEAM Maunderrsquos Butterfly Diagram Internet
(httpwwwwindowsucaredutourlink=sun activitybutterflyhtml) 2000
832019 Ew Afgewerkte Final
httpslidepdfcomreaderfullew-afgewerkte-final 3059
30
Solar wind An outward flow of particles (mostly electrons and protons) from the sun
Solstice Either of two points along the ecliptic at which the Sun reaches its maximum
distance north or south of the celestial equator
Spectroscopy Concerns the production and study of spectra
Spectrum The result of electromagnetic radiation passing through a prism or grating so that
different wavelengths are separated
Spicule Short-lived (lifetime from rising to falling is about 15 minutes) jets vertical to the
solar surface that are several thousand kilometres long and about 1 kilometre thick (see also
appendix IV) in the solar chromosphere
Sunspot A temporary cool region in the solar photosphere created by protruding magnetic
fields
Umbra The central completely dark portion of a shadow
Zeemaneffect A splitting of spectra lines in the presence of a magnetic field
Bibliography and webography of the glossary
COMINS NF and KAUFMANN III WJ Discovering the universe eighth edition WH
Freeman and Company New York 2008 535 p
GREEN SF and JONES M H An introduction to the Sun and Stars The Open University
Cambridge 2004 373 p
httpenmimihuastronomygranulationhtml
httpenmimihuastronomyplasmahtml
httpwwwspacecomspacewatchspace_weather_glossaryhtml
httpenmimihuastronomyemission_linehtml
httpenmimihuastronomyabsorption_linehtml
httpwwwpbsorgfaithandreasonphysglossqm-bodyhtml
httpwwwanswerscomtopicquantum-theory
httpenwikipediaorgwikiFlux_tube
832019 Ew Afgewerkte Final
httpslidepdfcomreaderfullew-afgewerkte-final 3159
31
Appendix I The sun in figures
Physical quantity Comment
Radius 695 510 km 109 x earths radius
Mass 1989 x1030 kg 332 946 earths mass
Mass sun in the solar
system
9986 Total mass sun total mass of
our solar system
Volume 1412 x10sup3sup3 cmsup3 13 million x earths volume
Age 455 milliard years
Luminosity 3854 x 10sup3sup3 ergss
Magnitude -2773
Density center 1513 gcmsup3
Density mean 1409 gcmsup3
Pressure center 2334 x1011 bars
Pressure photosphere 00001 bar
Temperature center 15 557 000deg K
Temperature photosphere 5 780deg K Various sources mention
different grades
Temperature corona 2 000 000 to 3 000 000deg K
Rotation time at North or
South pole
up to 35 days on earth
Rotation time at Equator 25 days on earth The difference in rotation
times is called differential
rotation
Rotation time general 2538 days on earth
Mean distance sun-earth
(AU)
14959787 x108 km 1 AU = 1 Astronomical Unit
= 149 598 000 km
Chemical composition of
the sun ( of total number
of atoms)
Hydrogen 921
Helium 78
All others 01
Various sources mention
slightly different percentages
832019 Ew Afgewerkte Final
httpslidepdfcomreaderfullew-afgewerkte-final 3259
32
Chemical composition of
the sun ( of total mass)
Hydrogen 7346
Helium 2485
All others 169
Various sources mention
slightly different percentages
Total transforming of
hydrogen into helium persecond
700 billions of kilograms of
hydrogen are transformedinto 6957 billions of
kilograms of helium each
second
Based on the following references
- BEATTY JK PETERSEN CC and CHAIKIN A The new solar system fourth edition
Cambridge University Press Cambridge 1999 p 421
- LILENSTEN J and BORNAREL J Sous les feux du soleil EDP Sciences Les Ulis
Cedex A 2001 p 247
- LANG KR Sun earth and sky Springer Germany 1995 p 282- DENTHIER T Het zonnestelsel Standaard Uitgeverij 1992 p 415
- JANSSENS J Zon en aarde een unieke relatie Garant Antwerpen 2003 p 254- VOLKSSTERRENWACHT URANIA VZW De zon Internet(httpwwwuraniabesterrenkundezonnestelselzonphp) (01012009)
832019 Ew Afgewerkte Final
httpslidepdfcomreaderfullew-afgewerkte-final 3359
33
Appendix II Anatomy of the sun
httpwwwcosmographicacomgalleryinfographicssolar_anatomyhtml
The middle the sun consists of a heavy core this consists of plasma just as the outer layers
of the sun but the pressure in the core is so high that it behaves much more like a solid bodyThe most outer layer is the corona it reaches far into space More to the inside there is the
chromosphere and then the photosphere The corona the chromosphere and the
photosphere are explained in chapter 1
832019 Ew Afgewerkte Final
httpslidepdfcomreaderfullew-afgewerkte-final 3459
34
Appendix III Granulation
httpwwwwindowsucaredutourlink=sunSolar_interiorsolar_furnacehtml
At the surface of the sun we can find granules These are created by convection the warmest
parts of the sunrsquos interior move upwards and the colder parts at the surface move downwardsThis causes currents of plasma The dark lines are the colder particles We see them darker
because they emit less light than their surrounding neighbourhood
832019 Ew Afgewerkte Final
httpslidepdfcomreaderfullew-afgewerkte-final 3559
35
Appendix IV Spicules
Picture httplpc1clpccdcccauslpcharpellastro20a20deinfo_s09htmInformation httpwwwdaviddarlinginfoencyclopediaSspiculehtml
On this picture you can see spicules Spicules only last for several minutes and can be foundin the chromosphere They are little jets of gas There also exist macrospicules that can be
approximately ten times larger than a normal spicule
832019 Ew Afgewerkte Final
httpslidepdfcomreaderfullew-afgewerkte-final 3659
36
Appendix V The most important satellites observing the sun
Here you can find the most important satellites observing the sun and their missions
Solar and Heliospheric Obseratory (SOHO)
httpsohowwwnascomnasagovaboutabouthtml
SOHO the Solar amp Heliospheric Observatory is a project of international collaboration
between ESA and NASA to study the Sun from its deep core to the outer corona and the solar
wind
SOHO was launched on December 2 1995 The SOHO spacecraft was built in Europe by an
industry team led by prime contractor Matra Marconi Space (now EADS Astrium) under
overall management by ESA The twelve instruments on board SOHO were provided by
European and American scientists Nine of the international instrument consortia are led by
European Principal Investigators (PIs) three by PIs from the US Large engineering teamsand more than 200 co-investigators from many institutions supported the PIs in the
development of the instruments and in the preparation of their operations and data analysis
NASA was responsible for the launch and is now responsible for mission operations Large
radio dishes around the world which form NASAs Deep Space Network are used for data
downlink and commanding Mission control is based at Goddard Space Flight Center in
Maryland
More information about SOHO can be found on
httpsohowwwnascomnasagovaboutdocsSOHO_Fact_Sheetpdf
832019 Ew Afgewerkte Final
httpslidepdfcomreaderfullew-afgewerkte-final 3759
37
Transition Region and Coronal Explorer (TRACE)
httptracelmsalcomProjectMissionmissionhtm
TRACE enables solar physicists to study the connections between fine-scale magnetic fields
and the associated plasma structures on the Sun in a quantitative way by observing the photosphere the transition region and the corona With TRACE these temperature domains
are observed nearly simultaneously (with as little delay as only a second between different
wavelengths) with a spatial resolution of one second of arc
This is accomplished by obtaining precisely coaligned image sequences of photosphere
transition region and corona with high spatial resolution and uninterrupted viewing of the
Sun for up to eight months
TRACE Mission
TRACE explores the magnetic field in the solar atmosphere by studyingbull The 3-dimensional field structure
bull Its temporal evolution in response to photospheric flows
bull The time-dependent coronal fine structure
bull The coronal and transition region thermal topology
TRACE was launched on a Pegasus launch vehicle from Vandenberg Air Force Base in April
1998 The launch was scheduled to allow joint observations with SOHO during the rising
phase of the solar cycle to sunspot maximum No transition region or coronal imager has
witnessed the onset and rise of a solar cycle
Pegasus in flight
The two satellites provide complementary observations TRACE produces the high spatial
and temporal resolution images while SoHO yields images and spectral data out to 30 solar
radii at much lower spatial and temporal resolution Jointly they provide the opportunity to
obtain simultaneous digital measurements of all the temperature regimes of the solar
atmosphere in both high-resolution imaging and spectroscopy
With these data we expect to shatter the current ignorance of coronal heating and impulsive
MHD phenomena with benefits not only to solar physics but also to studies ranging from
stellar activity to the MHD of accretion disks The magnetograms produced by MDI on SoHO
provide a complete record of the eruption and distribution of photosphere magnetic fields
which will be invaluable for understanding TRACE observations of coronal hole formation
and coronal mass ejections Both of these phenomena have profound effects on our space
environment and the Earth`s magnetic field
TRACE is the first US solar research satellite since the Solar Maximum Mission
Coordination with SOHO provides an unprecedented opportunity to follow the emergence of
magnetic flux from the base of the convection zone deep inside the Sun through the
photosphere chromosphere and transitional region to the low-beta outer corona while
observing the effects of this emergence such as coronal mass ejections with high spatial andtemporal resolution
832019 Ew Afgewerkte Final
httpslidepdfcomreaderfullew-afgewerkte-final 3859
38
The transition from the photosphere where magnetic fields and plasma are in rough
equipartition to the corona where magnetic fields dominate is extremely difficult to model
and until recently to observe at high temporal and spatial resolution Many of the physical
problems that arise here such as plasma confinement reconnection wave propagation and plasma heating arise throughout space physics and astrophysics The detailed study of these
processed in the solar outer atmosphere is invaluable to astrophysics in general and stellar
studies in particular
More information about TRACE observations can be found on
httptracelmsalcomOperationsGeneraloperatiohtm
832019 Ew Afgewerkte Final
httpslidepdfcomreaderfullew-afgewerkte-final 3959
39
Reuven Ramaty High Energy Solar Spectroscopic Imager (RHESSI)
httphesperiagsfcnasagovhessibrochurehtm
What Questions will HESSI Address
bull How is such a large amount of energy released so rapidly during a flare
bull How are so many electrons and protons accelerated so quickly to such high energies
bull Where are the electrons and protons accelerated in the solar atmosphere and where do
they deposit their energy
How will HESSI Address these Questions
HESSI shown below will concentrate on electrons and protons accelerated in solar flares
through observations of the X-rays and gamma rays that they produce
bull HESSI will obtain the first ever X-ray and gamma-ray images of flares from 100 keV
to 20 MeVbull HESSI will do the first ever nuclear gamma-ray line spectroscopy of solar flares
bull HESSI will obtain pictures of flares in X-rays with an angular resolution of 2
arcseconds a factor of three better than previously possible
bull HESSI will measure X-ray and gamma-ray spectra with less than 1 keV energy
resolution a factor of 20-40 better than previously possible with scintillation counters
More information about the RHESSIrsquos Mission can be found on
httphesperiagsfcnasagovhessiconcepthtm
832019 Ew Afgewerkte Final
httpslidepdfcomreaderfullew-afgewerkte-final 4059
40
Solar Radiation and Climate Experiment (SORCE)
httplaspcoloradoedusorcesciencebackgroundhtm
The Solar Radiation and Climate Experiment (SORCE) is a NASA-sponsored satellite
mission that is providing state-of-the-art measurements of incoming x-ray ultraviolet visiblenear-infrared and total solar radiation The measurements provided by SORCE specifically
address long-term climate change natural variability and enhanced climate prediction and
atmospheric ozone and UV-B radiation These measurements are critical to studies of the Sun
its effect on our Earth system and its influence on humankind
The SORCE spacecraft was launched on January 25 2003 on a Pegasus XL launch vehicle to
provide NASAs Earth Science Enterprise (ESE) with precise measurements of solar
radiation It launched into a 645 km 40 degree orbit and is operated by the Laboratory for
Atmospheric and Space Physics (LASP) at the University of Colorado (CU) in Boulder
Colorado USA It will continue the precise measurements of total solar irradiance (TSI) that
began with the ERB instrument in 1979 and has continued to the present with the ACRIM series of measurements SORCE will also provide the measurements of the solar spectral
irradiance from 1nm to 2000nm accounting for 95 of the spectral contribution to TSI
SORCE carries four instruments including the Spectral Irradiance Monitor (SIM) Solar
Stellar Irradiance Comparison Experiment (SOLSTICE) Total Irradiance Monitor (TIM) and
the XUV Photometer System (XPS)
The primary goal of the NASA Earth Observing Systems (EOS) SOlar Radiation and Climate
Experiment (SORCE) is to enable solar-terrestrial studies by providing precise daily
measurements of the total solar irradiance (TSI) and the solar spectral irradiance atwavelengths extending from the ultraviolet to the near infrared The following lists the
SORCE science objectives
1 Make accurate measurements with high precision of total solar irradiance connect
them to previous TSI measurements and continue this long-term climate record
Provide TSI with an accuracy of 001 (100 parts per million) based on SI units and
with a long-term repeatability of 0001yr
2 Make daily measurements of the solar ultraviolet irradiance from 120 to 300 nm with
a spectral resolution of 1 nm Achieve this spectral irradiance measurement with an
accuracy of better than 5 and with a long-term repeatability of 05yr Use the
solarstellar comparison technique to relate the solar irradiance to the ensembleaverage flux from a number of bright early-type stars (same stars used by the UARS
SOLSTICE program)
3 Make the first measurements of the visible and near IR solar irradiance with sufficient
precision for future climate studies Obtain daily measurements of solar spectral
irradiance between 03 and 2 microm with a spectral resolution of at least 130 an
accuracy of 003 and a long-term repeatability of better than 001yr
4 Improve the understanding of how and why solar irradiance varies estimate past and
future solar behavior and investigate climate responses
More information about SORCE can be found on
httplaspcoloradoedusorcesciencescience_opshtm
832019 Ew Afgewerkte Final
httpslidepdfcomreaderfullew-afgewerkte-final 4159
41
Appendix VI Wavelengths
httpeosweblarcnasagovEDDOCSWavelengths_for_Colorshtml
As you can see on the figure visible light situates in the centre of the wavelengths having not
the shortest nor the longest wavelengths Gamma rays have the shortest wavelength radioways the longest All sort of wavelengths are used for daily purpose like radio waves for
radio and TV and gamma rays for treatments
832019 Ew Afgewerkte Final
httpslidepdfcomreaderfullew-afgewerkte-final 4259
42
Appendix VII Absorption lines in the sunrsquos spectrum
Picture httpwwwsolarnavigatornetthe_sunhtmExplanation COMINS NF and KAUFMANN III WJ Discovering the universe eighth edition WHFreeman and Company New York 2008 p 109
This photo is called a spectrogram It contains the spectrum of the sun All the black lines are
absorption lines The amount of black lines is related to the amount of elements that the sun
is emitting From a spectrogram we can deduct a lot of things including their mass the
temperature of the surface the chemical composition of the sun rotation rates and much
more
832019 Ew Afgewerkte Final
httpslidepdfcomreaderfullew-afgewerkte-final 4359
832019 Ew Afgewerkte Final
httpslidepdfcomreaderfullew-afgewerkte-final 4459
44
Appendix IX Butterfly-diagram
httpspacesciencespacerefcomsslpadsolarimagesbflygif
A butterfly-diagram
In a butterfly-diagram we can find the sunspots with their latitude (y-axis) through the years(x-axis) As you can see the sunspots appear like lsquobutterfliesrsquo this was discovered in 1904 by
Edward Maunder (1851-1928 an English astronomer best remembered for his study of
sunspots and the solar magnetic cycle) Thatrsquos why this graph is also called Maunders
butterfly diagram
832019 Ew Afgewerkte Final
httpslidepdfcomreaderfullew-afgewerkte-final 4559
45
Appendix X The Wolf-numbers
httpsidcomabenews106sunspotnumberclarifiedpdf
The sunspot number clarified By Petra Vanlommel
Which kinds of daily International Sunspot Numbers (ISN) are currentlypublished by the SIDC
Three daily indices are currently published by the SIDCthe Estimated ISN (EISN)the Provisional ISN (PISN)the Definitive ISN (DISN)Although they are all based on the same type of observations ie visual sunspot counts as ameasure of solar activity they are obtained from different data sets by different processingmethods with different accuracies and they serve different purposes
In the ideal case the three numbers are equal but in practice it is inevitable that there aresmall differences Therefore It is useful to explain what each index actually means
What is the source of the Wolf number
Once per day observers worldwide communicate their measured Wolf number (= 10G + S)based on visual sunspot (S) and group (G) counts to the World Data Center for the SunspotIndex Presently this is done through a dedicated password-protected WEB form the Wolfinterface However some observers still use the old way of reporting their observations onpaper through regular mail This method slows down the final processing but for the sake ofcontinuity in the index it is important to keep these observers included as some of them
represent the longest individual datasetsThe observers give the exact observing time the observing conditions the total numbers(group count sunspot count and Wolf number) and optionally the NorthSouth and centralzone numbers The observers using the web interface can provide their results to the SIDCimmediately after each observation However some users prefer to insert their data as ablock creating some delay but this must be done at least once a month
The personal reduction coefficient K
A personal reduction coefficient K is calculated for each station It has values typically in therange 04 and 17 and leads to a normalized sunspot number K(10G+S) In other words theK factor rescales the raw sunspot counts of each observer to the ones of Rudolph Wolf the
astronomer who introduced the above Wolf formula thus simulating the same eyes sametelescope and same conditionsDuring the procedure for calculating the Provisional ISN the K factor of every station iscomputed for every observation that passes the elimination procedure Once a year apersonal K factor for every station and for every month of the previous year is calculated Ayearly mean K value per station is also computed
The estimated sunspot index
The Estimated ISN (EISN) is calculated and issued on a daily basis for the day of calculationand the day before Only the total EISN is calculated with no hemispheric index It is anautomated procedure and no manual intervention is done The EISN is meant as a quicktemporary and approximate index for real-time applications
832019 Ew Afgewerkte Final
httpslidepdfcomreaderfullew-afgewerkte-final 4659
46
We use the raw Wolf number from all observatories that have provided counts early in theday ie before 1230 UT Typically there is between 10 and 20 stations available Thecalculation of the EISN is based on a simple and straightforward statistical method The Wolfnumbers are multiplied with the yearly mean K factor (see paragraph about the personalreduction coefficient K) The EISN is a simple average of the K-scaled values after excludingany individual value that deviates abnormally from the other valuesOnce the Provisional ISN (PISN) is calculated after the end of a month the temporary EISNis dropped and replaced by the PISN
The provisional sunspot Index
The Provisional ISN (PISN) is calculated and issued on the first of every month Theoutcome is a daily total and hemispheric sunspot number for the entire elapsed month Anexample on the first of September we calculate the daily PISN for each day of August ThePISN is computed semi-automatically with as little manual intervention as possibleTo calculate the PISN values for the concerned month we use all Wolf numbers Typicallythere is data from around 65 stations available
The calculation of the PISN is based on an extensive statistical treatment This treatmentfilters out any abnormal daily observation or the complete data set from an erratic station(quality control) This prevents long-term drifts in the resulting index One of the key elementsderived from this processing is to update the K reduction coefficients for each station theevolution of each station is monitored for each day relative to the entire networkA subset of the contributing stations also provides hemispheric counts A similar process isapplied to the North and South counts to derive the hemispheric PISN There is an additionalconstraint the sum of the North and South ISN must match the total ISNThe PISN replaces the EISN And once the Definitive ISN (DISN) is calculated the DISNreplaces the PISN
The definitive sunspot index
The Definitive ISN is calculated and issued on a quarterly basis when we have collecteddata from all the contributing observatories This is the final index and it is appended to thehistorical sunspot index time series The same semi-automated treatment as for the PISN isnow applied to the full data set If the result agrees within 5 of the PISN value the PISN iskept and becomes definitive Otherwise the new calculated value replaces the PISN andbecomes the definitive ISNIt is only at this stage and only in peculiar situations that a manual verification by ourscientific staff is required For example this happens when the observed raw Wolf valuesfrom the whole network are clustered around two distinct values This special case can becaused by small short-lived isolated sunspots (lifetimes lt 24 hours) or by the appearance ordisappearance of a large group at the solar limb in the course of one UT dayThe DISN replaces the provisional and estimated International Sunspot Number
Handling very low activity levels
One of the situations requiring a human arbitration is associated with single small isolatedand short-lived sunspots This is most noticeable around the minimum of the solar activitycycle like the one occurring now in 2008 Due to the 24hour binning (observations aregrouped between 0hUT and 24hUT) and the variable ability of each observer to detect thesmallest sunspots we end up with some stations reporting one sunspot and others who didno see any sunspot Let us explain further No sunspot may mean that the sunspot waspresent but the observer was unable to see it because of poor observational conditions such
as weather a small telescope On the other hand it may also indicate that the sunspot hadactually vanished by that time while it was present earlier on the same day
832019 Ew Afgewerkte Final
httpslidepdfcomreaderfullew-afgewerkte-final 4759
47
Individual stations do not observe at exactly the same timeIn order to validate the existence of such a marginal reported sunspot a qualified SIDCscientist must then check the detailed chronology within that day and consider the overallobserver capability (value of K coefficient)In common practice the fact that a sunspot is reported by a significant group of observersleads to the inclusion of the sunspot on that date thus neglecting the no-sunspotobservationsThe rationale is multiple observations of a sunspot exclude the possibility that the reportedsunspot was an independent false detection So a sunspot was really present on that dayalthough it may have existed only for part of the day or it was small enough to be missed bypart of the observers with smaller instruments or imperfect atmospheric conditionsAlso keep in mind that the sunspot index is derived with a limited precision just like any otherindex If the monthly mean sunspot number is 0 or 05 you can definitely say that activitywas low
What index should be used
If you want to perform long-term investigations the definitive ISN series is definitely the mostsuitable However there is a delay of a few months So when investigating the last cycle andrecent evolution use the definitive numbers in combination with the provisional ISN to be upto date to the last month The provisional numbers are also used in models forecasting thesunspot number for the coming months Now if you need a proxy for solar activity in a modelthat runs in real-time then you may use the estimated ISNImprovements and rethinking of the processing method is an ongoing project We arecurrently developing an alternative program for calculating the PISN Of course long-termconsistency is vital Therefore a cross-analysis between the output from the old and newsoftware must be applied over an extended period
832019 Ew Afgewerkte Final
httpslidepdfcomreaderfullew-afgewerkte-final 4859
48
Above graphs show different kinds of the International Sunspot Number The left plot gives an overview from 1700 up to now from the yearly (black) and monthly smoothed Sunspot Number The graph in the right top corner shows the monthly and monthly smoothed sunspot number while the graph in the right bottom corner show the daily monthly smoothed monthly sunspot number For every the time range of investigation there is an appropriate sunspot number
832019 Ew Afgewerkte Final
httpslidepdfcomreaderfullew-afgewerkte-final 4959
49
Appendix XI Filaments and prominences
httpsohowwwnascomnasagovpickoftheweekold26feb2004
This is a picture taken by SOHO on 26 February 2004
832019 Ew Afgewerkte Final
httpslidepdfcomreaderfullew-afgewerkte-final 5059
50
Appendix XII The reconnection of magnetic loops
httpwwwioporgEJarticle0004-637X558287253575webpdfrequest-id=73e38daa-69ae-4e01-b9a6- b4bd0ba071dd
In (a) sunspot B and C have different polarity and move towards each other The twomagnetic loops will reconnect and form one big magnetic loop showed in (b) This will
happen to other magnetic loops too as can be seen in (c) When G en F are close enough they
will reconnect and so E en H will reconnect too It is possible that the magnetic field line is
trapped around another in this case AD The mass ejected from the sun will be trapped
between the magnetic field lines and form a solar prominence
832019 Ew Afgewerkte Final
httpslidepdfcomreaderfullew-afgewerkte-final 5159
832019 Ew Afgewerkte Final
httpslidepdfcomreaderfullew-afgewerkte-final 5259
52
httptheinvisibleagentwordpresscom20090117amazing-celestial-images
An group of active prominences
httpapodnasagovapodap051109html
httpwhassupinthemilkywayblogspotcom200903cloudy-planhtml
A picture taken by SOHO In the left corner you can see the prominence with twisted
magnetic field lines
832019 Ew Afgewerkte Final
httpslidepdfcomreaderfullew-afgewerkte-final 5359
53
Appendix XIV Polar crown
httpsciencenasagovheadlinesy200817sep_polarcrownhtm
Photograph of a polar crown taken on 13 June 1999 by the Meudon Observatory
832019 Ew Afgewerkte Final
httpslidepdfcomreaderfullew-afgewerkte-final 5459
54
Appendix XV Coronal holes
httpsunearthdaynasagov2007multimediagal_020php
The black segment is a huge coronal hole The bright parts are x-rays from sunspots
832019 Ew Afgewerkte Final
httpslidepdfcomreaderfullew-afgewerkte-final 5559
55
Appendix XVI Coronal mass ejection
httpzuserver2staruclacuk~idhapodap000309html
Picture of a CME taken by SOHO in February 2000
832019 Ew Afgewerkte Final
httpslidepdfcomreaderfullew-afgewerkte-final 5659
56
Bibliography
Books
BEATTY JK PETERSEN CC and CHAIKIN A The new solar system fourth edition
Cambridge University Press Cambridge 1999 421 p
COMINS NF and KAUFMANN III WJ Discovering the universe eighth edition WH
Freeman and Company New York 2008 535 p
DETHIER T Het zonnestelsel Standaard Uitgeverij 1992 415 p
GOLUB L and PASACHOFF JM Nearest star the surprising science of our sun Harvard
university press Harvard 2001 267 p
GREEN SF and JONES M H An introduction to the Sun and Stars The Open University
Cambridge 2004 373 p
HILL S and CARLOWITZ M The sun Abrams New York 2006 239 p
HOLMAN GD lsquoThe mysterious origins of solar flaresrsquo Scientific America April 2006 p
24-31 volume 294 number 4
JANSSENS J Zon en aarde een unieke relatie Garant Antwerpen 2003 254 p
KELLER H-U Van Supernovarsquos tot zwarte gaten Tirion Natuur AH Baarn 2003 169 p
LANG KR Sun earth and sky Springer Germany 1995 282 p
LILENSTEN J and BORNAREL J Sous les feux du soleil EDP Sciences Les Ulis Cedex
A 2001 247 p
832019 Ew Afgewerkte Final
httpslidepdfcomreaderfullew-afgewerkte-final 5759
57
Articles
CUYPERS J and others lsquoLa rechercheacute en heacuteliophysique en Belgiquersquo Space connection
October 2007 20 p
DE KEYSER J lsquoDe magnetopauzersquo Heelal maart 1998 p 66-73
JANSSENS J lsquoHet maximum van de 23ste zonnevlekkencyclus (I)rsquo Heelal Oktober 1998 p
256-263
JANSSENS J lsquohet maximum van de 23ste zonnenvlekkencyclus (II)rsquo Heelal November
1998 p 284-290
JANSSENS J lsquoZonnefakkelsrsquo Heelal Oktober 1994 p 256-261
SMITS F lsquoDe coronarsquo Heelal Februari 1999 p 40-42
SMITS F lsquoProtuberanzenrsquo Heelal Juli 1991 p 182-185
VAN DEN BERGHE S lsquoHet Zeemaneffectrsquo Heelal September 1998 p 228-231
832019 Ew Afgewerkte Final
httpslidepdfcomreaderfullew-afgewerkte-final 5859
58
Webography
BOEN B Birth of a coronal mass ejection Internet
(httpwwwnasagovmission_pagessolar-b solar_005html) 290408
BRAEUNIG R A Glossary Internet (httpwwwbraeunigusspaceglossaryhtm) 2006
CORDIS Researchers reveal why Suns atmosphere is hotter than its surface Internet
(httpcordiseuropaeusearchindexcfmfuseaction=newsdocumentampN_LANG=ENampN_R
CN=30598amppid=0ampq=87F36474805A6BEC0B89404F72D0351Famptype=sim) 20032009
DAY C Alfveacuten waves may heat the Sunrsquos corona Internet
(httpblogsphysicstodayorgupdate200903 alfven-waves-may-heat-the-sunshtml)
310309
ELLERMAN F Solar prominences Internet (httparticlesadsabsharvardedufull
1928ASPL173E 0000074000html) (03042009)
ENCYCLODPEDIA OF SCIENCE Corona hole Internet
(httpwwwdaviddarlinginfoencyclopediaC coronal_holehtml) (04042009)
HATHAWAY D H The sunspot cycle Internet
(httpspacesciencespacerefcomsslpadsolarsunspots htm) 04012000
JANSSENS J The case of the missing solar cycle (published in lsquoheelalrsquo January 2008)
Internet (httpuserstelenetbejjanssensMSCwebEngpdf)
KNISELY D Solar prominences Internet
(httpwwwicstarscomHTMLSolarSectionHAlphaOBSERVINGTHESUNHAlpha3html)
(03042009)
KOPANSKI J Atom Internet (httpknolgooglecomkjan-
kopanskiatom1amrwrct7rvi27) 060209
MARTENS PC and ZWAAN C Origin and evolution of filament-prominence systems
Internet (http wwwioporgEJarticle0004-637X558287253575webpdfrequest-
id=73e38daa-69ae-4e01-b9a6-b4bd0ba071dd) 092001
NASA The corona Internet (httpsolarsciencemsfcnasagovcoronashtml) 180107
NASA The heliosphere Internet (httpheliosgsfcnasagovheliosphhtml) 20012009
OFFICIAL SITE OF STONEHENGE About Stonehenge Internet
(httpwwwstonehengecouk) (03022009)
OTTERSDORF M Astronomy On the sunspot cycle Internet
(httpuserszoominternetnet~matto MCASsunspot_cyclehtmZeemaneffect) 031103
PARIAT E and SCHMIEDER B Magnetic flux emergence Internet(httpwwwscholarpediaorgarticleMagnetic_field_emergence) 18042008
832019 Ew Afgewerkte Final
httpslidepdfcomreaderfullew-afgewerkte-final 5959
59
PRIEST E R Dynamics and Structure of Quiescent Solar Prominences Internet
(httpbooksgooglebe booksid=h599q3jz1w4Campdq=quiescent+prominencesampprintsec=fro
ntcoverampsource=blampots=58b79Qeyabampsig=1eklQ-
WszOIebZZaq7fq7gm6bxAamphl=nlampei=urPtSe7ZCo61-
Qa166jHDwampsa=Xampoi=book_resultampct=result ampresnum=3PPA6M2) 1989
RUSSELL R Rotation of the sun Internet
(httpwwwwindowsucaredutourlink=sunSolar_interior
Sun_layersdifferential_rotationhtml) 16082005
RUSSELL R Sunspots and magnetic fields Internet
(httpwwwwindowsucaredutourlink=sunatmospheresunspot_magnetismhtmlampedu=hig
h) 060908
UNIVERSITY OF GLASGOW Bibliography of Peter Sweet Internet
(httpwwwuniversitystoryglaacuk biographyid=WH2144amptype=P) (10042009)
WIKIPEDIA Orbiting Solar Observatory Internet
(httpenwikipediaorgwikiOrbiting_Solar_Observatory) 24012009
WINDOWS TEAM Maunderrsquos Butterfly Diagram Internet
(httpwwwwindowsucaredutourlink=sun activitybutterflyhtml) 2000

832019 Ew Afgewerkte Final
httpslidepdfcomreaderfullew-afgewerkte-final 3259
32
Chemical composition of
the sun ( of total mass)
Hydrogen 7346
Helium 2485
All others 169
Various sources mention
slightly different percentages
Total transforming of
hydrogen into helium persecond
700 billions of kilograms of
hydrogen are transformedinto 6957 billions of
kilograms of helium each
second
Based on the following references
- BEATTY JK PETERSEN CC and CHAIKIN A The new solar system fourth edition
Cambridge University Press Cambridge 1999 p 421
- LILENSTEN J and BORNAREL J Sous les feux du soleil EDP Sciences Les Ulis
Cedex A 2001 p 247
- LANG KR Sun earth and sky Springer Germany 1995 p 282- DENTHIER T Het zonnestelsel Standaard Uitgeverij 1992 p 415
- JANSSENS J Zon en aarde een unieke relatie Garant Antwerpen 2003 p 254- VOLKSSTERRENWACHT URANIA VZW De zon Internet(httpwwwuraniabesterrenkundezonnestelselzonphp) (01012009)
832019 Ew Afgewerkte Final
httpslidepdfcomreaderfullew-afgewerkte-final 3359
33
Appendix II Anatomy of the sun
httpwwwcosmographicacomgalleryinfographicssolar_anatomyhtml
The middle the sun consists of a heavy core this consists of plasma just as the outer layers
of the sun but the pressure in the core is so high that it behaves much more like a solid bodyThe most outer layer is the corona it reaches far into space More to the inside there is the
chromosphere and then the photosphere The corona the chromosphere and the
photosphere are explained in chapter 1
832019 Ew Afgewerkte Final
httpslidepdfcomreaderfullew-afgewerkte-final 3459
34
Appendix III Granulation
httpwwwwindowsucaredutourlink=sunSolar_interiorsolar_furnacehtml
At the surface of the sun we can find granules These are created by convection the warmest
parts of the sunrsquos interior move upwards and the colder parts at the surface move downwardsThis causes currents of plasma The dark lines are the colder particles We see them darker
because they emit less light than their surrounding neighbourhood
832019 Ew Afgewerkte Final
httpslidepdfcomreaderfullew-afgewerkte-final 3559
35
Appendix IV Spicules
Picture httplpc1clpccdcccauslpcharpellastro20a20deinfo_s09htmInformation httpwwwdaviddarlinginfoencyclopediaSspiculehtml
On this picture you can see spicules Spicules only last for several minutes and can be foundin the chromosphere They are little jets of gas There also exist macrospicules that can be
approximately ten times larger than a normal spicule
832019 Ew Afgewerkte Final
httpslidepdfcomreaderfullew-afgewerkte-final 3659
36
Appendix V The most important satellites observing the sun
Here you can find the most important satellites observing the sun and their missions
Solar and Heliospheric Obseratory (SOHO)
httpsohowwwnascomnasagovaboutabouthtml
SOHO the Solar amp Heliospheric Observatory is a project of international collaboration
between ESA and NASA to study the Sun from its deep core to the outer corona and the solar
wind
SOHO was launched on December 2 1995 The SOHO spacecraft was built in Europe by an
industry team led by prime contractor Matra Marconi Space (now EADS Astrium) under
overall management by ESA The twelve instruments on board SOHO were provided by
European and American scientists Nine of the international instrument consortia are led by
European Principal Investigators (PIs) three by PIs from the US Large engineering teamsand more than 200 co-investigators from many institutions supported the PIs in the
development of the instruments and in the preparation of their operations and data analysis
NASA was responsible for the launch and is now responsible for mission operations Large
radio dishes around the world which form NASAs Deep Space Network are used for data
downlink and commanding Mission control is based at Goddard Space Flight Center in
Maryland
More information about SOHO can be found on
httpsohowwwnascomnasagovaboutdocsSOHO_Fact_Sheetpdf
832019 Ew Afgewerkte Final
httpslidepdfcomreaderfullew-afgewerkte-final 3759
37
Transition Region and Coronal Explorer (TRACE)
httptracelmsalcomProjectMissionmissionhtm
TRACE enables solar physicists to study the connections between fine-scale magnetic fields
and the associated plasma structures on the Sun in a quantitative way by observing the photosphere the transition region and the corona With TRACE these temperature domains
are observed nearly simultaneously (with as little delay as only a second between different
wavelengths) with a spatial resolution of one second of arc
This is accomplished by obtaining precisely coaligned image sequences of photosphere
transition region and corona with high spatial resolution and uninterrupted viewing of the
Sun for up to eight months
TRACE Mission
TRACE explores the magnetic field in the solar atmosphere by studyingbull The 3-dimensional field structure
bull Its temporal evolution in response to photospheric flows
bull The time-dependent coronal fine structure
bull The coronal and transition region thermal topology
TRACE was launched on a Pegasus launch vehicle from Vandenberg Air Force Base in April
1998 The launch was scheduled to allow joint observations with SOHO during the rising
phase of the solar cycle to sunspot maximum No transition region or coronal imager has
witnessed the onset and rise of a solar cycle
Pegasus in flight
The two satellites provide complementary observations TRACE produces the high spatial
and temporal resolution images while SoHO yields images and spectral data out to 30 solar
radii at much lower spatial and temporal resolution Jointly they provide the opportunity to
obtain simultaneous digital measurements of all the temperature regimes of the solar
atmosphere in both high-resolution imaging and spectroscopy
With these data we expect to shatter the current ignorance of coronal heating and impulsive
MHD phenomena with benefits not only to solar physics but also to studies ranging from
stellar activity to the MHD of accretion disks The magnetograms produced by MDI on SoHO
provide a complete record of the eruption and distribution of photosphere magnetic fields
which will be invaluable for understanding TRACE observations of coronal hole formation
and coronal mass ejections Both of these phenomena have profound effects on our space
environment and the Earth`s magnetic field
TRACE is the first US solar research satellite since the Solar Maximum Mission
Coordination with SOHO provides an unprecedented opportunity to follow the emergence of
magnetic flux from the base of the convection zone deep inside the Sun through the
photosphere chromosphere and transitional region to the low-beta outer corona while
observing the effects of this emergence such as coronal mass ejections with high spatial andtemporal resolution
832019 Ew Afgewerkte Final
httpslidepdfcomreaderfullew-afgewerkte-final 3859
38
The transition from the photosphere where magnetic fields and plasma are in rough
equipartition to the corona where magnetic fields dominate is extremely difficult to model
and until recently to observe at high temporal and spatial resolution Many of the physical
problems that arise here such as plasma confinement reconnection wave propagation and plasma heating arise throughout space physics and astrophysics The detailed study of these
processed in the solar outer atmosphere is invaluable to astrophysics in general and stellar
studies in particular
More information about TRACE observations can be found on
httptracelmsalcomOperationsGeneraloperatiohtm
832019 Ew Afgewerkte Final
httpslidepdfcomreaderfullew-afgewerkte-final 3959
39
Reuven Ramaty High Energy Solar Spectroscopic Imager (RHESSI)
httphesperiagsfcnasagovhessibrochurehtm
What Questions will HESSI Address
bull How is such a large amount of energy released so rapidly during a flare
bull How are so many electrons and protons accelerated so quickly to such high energies
bull Where are the electrons and protons accelerated in the solar atmosphere and where do
they deposit their energy
How will HESSI Address these Questions
HESSI shown below will concentrate on electrons and protons accelerated in solar flares
through observations of the X-rays and gamma rays that they produce
bull HESSI will obtain the first ever X-ray and gamma-ray images of flares from 100 keV
to 20 MeVbull HESSI will do the first ever nuclear gamma-ray line spectroscopy of solar flares
bull HESSI will obtain pictures of flares in X-rays with an angular resolution of 2
arcseconds a factor of three better than previously possible
bull HESSI will measure X-ray and gamma-ray spectra with less than 1 keV energy
resolution a factor of 20-40 better than previously possible with scintillation counters
More information about the RHESSIrsquos Mission can be found on
httphesperiagsfcnasagovhessiconcepthtm
832019 Ew Afgewerkte Final
httpslidepdfcomreaderfullew-afgewerkte-final 4059
40
Solar Radiation and Climate Experiment (SORCE)
httplaspcoloradoedusorcesciencebackgroundhtm
The Solar Radiation and Climate Experiment (SORCE) is a NASA-sponsored satellite
mission that is providing state-of-the-art measurements of incoming x-ray ultraviolet visiblenear-infrared and total solar radiation The measurements provided by SORCE specifically
address long-term climate change natural variability and enhanced climate prediction and
atmospheric ozone and UV-B radiation These measurements are critical to studies of the Sun
its effect on our Earth system and its influence on humankind
The SORCE spacecraft was launched on January 25 2003 on a Pegasus XL launch vehicle to
provide NASAs Earth Science Enterprise (ESE) with precise measurements of solar
radiation It launched into a 645 km 40 degree orbit and is operated by the Laboratory for
Atmospheric and Space Physics (LASP) at the University of Colorado (CU) in Boulder
Colorado USA It will continue the precise measurements of total solar irradiance (TSI) that
began with the ERB instrument in 1979 and has continued to the present with the ACRIM series of measurements SORCE will also provide the measurements of the solar spectral
irradiance from 1nm to 2000nm accounting for 95 of the spectral contribution to TSI
SORCE carries four instruments including the Spectral Irradiance Monitor (SIM) Solar
Stellar Irradiance Comparison Experiment (SOLSTICE) Total Irradiance Monitor (TIM) and
the XUV Photometer System (XPS)
The primary goal of the NASA Earth Observing Systems (EOS) SOlar Radiation and Climate
Experiment (SORCE) is to enable solar-terrestrial studies by providing precise daily
measurements of the total solar irradiance (TSI) and the solar spectral irradiance atwavelengths extending from the ultraviolet to the near infrared The following lists the
SORCE science objectives
1 Make accurate measurements with high precision of total solar irradiance connect
them to previous TSI measurements and continue this long-term climate record
Provide TSI with an accuracy of 001 (100 parts per million) based on SI units and
with a long-term repeatability of 0001yr
2 Make daily measurements of the solar ultraviolet irradiance from 120 to 300 nm with
a spectral resolution of 1 nm Achieve this spectral irradiance measurement with an
accuracy of better than 5 and with a long-term repeatability of 05yr Use the
solarstellar comparison technique to relate the solar irradiance to the ensembleaverage flux from a number of bright early-type stars (same stars used by the UARS
SOLSTICE program)
3 Make the first measurements of the visible and near IR solar irradiance with sufficient
precision for future climate studies Obtain daily measurements of solar spectral
irradiance between 03 and 2 microm with a spectral resolution of at least 130 an
accuracy of 003 and a long-term repeatability of better than 001yr
4 Improve the understanding of how and why solar irradiance varies estimate past and
future solar behavior and investigate climate responses
More information about SORCE can be found on
httplaspcoloradoedusorcesciencescience_opshtm
832019 Ew Afgewerkte Final
httpslidepdfcomreaderfullew-afgewerkte-final 4159
41
Appendix VI Wavelengths
httpeosweblarcnasagovEDDOCSWavelengths_for_Colorshtml
As you can see on the figure visible light situates in the centre of the wavelengths having not
the shortest nor the longest wavelengths Gamma rays have the shortest wavelength radioways the longest All sort of wavelengths are used for daily purpose like radio waves for
radio and TV and gamma rays for treatments
832019 Ew Afgewerkte Final
httpslidepdfcomreaderfullew-afgewerkte-final 4259
42
Appendix VII Absorption lines in the sunrsquos spectrum
Picture httpwwwsolarnavigatornetthe_sunhtmExplanation COMINS NF and KAUFMANN III WJ Discovering the universe eighth edition WHFreeman and Company New York 2008 p 109
This photo is called a spectrogram It contains the spectrum of the sun All the black lines are
absorption lines The amount of black lines is related to the amount of elements that the sun
is emitting From a spectrogram we can deduct a lot of things including their mass the
temperature of the surface the chemical composition of the sun rotation rates and much
more
832019 Ew Afgewerkte Final
httpslidepdfcomreaderfullew-afgewerkte-final 4359
832019 Ew Afgewerkte Final
httpslidepdfcomreaderfullew-afgewerkte-final 4459
44
Appendix IX Butterfly-diagram
httpspacesciencespacerefcomsslpadsolarimagesbflygif
A butterfly-diagram
In a butterfly-diagram we can find the sunspots with their latitude (y-axis) through the years(x-axis) As you can see the sunspots appear like lsquobutterfliesrsquo this was discovered in 1904 by
Edward Maunder (1851-1928 an English astronomer best remembered for his study of
sunspots and the solar magnetic cycle) Thatrsquos why this graph is also called Maunders
butterfly diagram
832019 Ew Afgewerkte Final
httpslidepdfcomreaderfullew-afgewerkte-final 4559
45
Appendix X The Wolf-numbers
httpsidcomabenews106sunspotnumberclarifiedpdf
The sunspot number clarified By Petra Vanlommel
Which kinds of daily International Sunspot Numbers (ISN) are currentlypublished by the SIDC
Three daily indices are currently published by the SIDCthe Estimated ISN (EISN)the Provisional ISN (PISN)the Definitive ISN (DISN)Although they are all based on the same type of observations ie visual sunspot counts as ameasure of solar activity they are obtained from different data sets by different processingmethods with different accuracies and they serve different purposes
In the ideal case the three numbers are equal but in practice it is inevitable that there aresmall differences Therefore It is useful to explain what each index actually means
What is the source of the Wolf number
Once per day observers worldwide communicate their measured Wolf number (= 10G + S)based on visual sunspot (S) and group (G) counts to the World Data Center for the SunspotIndex Presently this is done through a dedicated password-protected WEB form the Wolfinterface However some observers still use the old way of reporting their observations onpaper through regular mail This method slows down the final processing but for the sake ofcontinuity in the index it is important to keep these observers included as some of them
represent the longest individual datasetsThe observers give the exact observing time the observing conditions the total numbers(group count sunspot count and Wolf number) and optionally the NorthSouth and centralzone numbers The observers using the web interface can provide their results to the SIDCimmediately after each observation However some users prefer to insert their data as ablock creating some delay but this must be done at least once a month
The personal reduction coefficient K
A personal reduction coefficient K is calculated for each station It has values typically in therange 04 and 17 and leads to a normalized sunspot number K(10G+S) In other words theK factor rescales the raw sunspot counts of each observer to the ones of Rudolph Wolf the
astronomer who introduced the above Wolf formula thus simulating the same eyes sametelescope and same conditionsDuring the procedure for calculating the Provisional ISN the K factor of every station iscomputed for every observation that passes the elimination procedure Once a year apersonal K factor for every station and for every month of the previous year is calculated Ayearly mean K value per station is also computed
The estimated sunspot index
The Estimated ISN (EISN) is calculated and issued on a daily basis for the day of calculationand the day before Only the total EISN is calculated with no hemispheric index It is anautomated procedure and no manual intervention is done The EISN is meant as a quicktemporary and approximate index for real-time applications
832019 Ew Afgewerkte Final
httpslidepdfcomreaderfullew-afgewerkte-final 4659
46
We use the raw Wolf number from all observatories that have provided counts early in theday ie before 1230 UT Typically there is between 10 and 20 stations available Thecalculation of the EISN is based on a simple and straightforward statistical method The Wolfnumbers are multiplied with the yearly mean K factor (see paragraph about the personalreduction coefficient K) The EISN is a simple average of the K-scaled values after excludingany individual value that deviates abnormally from the other valuesOnce the Provisional ISN (PISN) is calculated after the end of a month the temporary EISNis dropped and replaced by the PISN
The provisional sunspot Index
The Provisional ISN (PISN) is calculated and issued on the first of every month Theoutcome is a daily total and hemispheric sunspot number for the entire elapsed month Anexample on the first of September we calculate the daily PISN for each day of August ThePISN is computed semi-automatically with as little manual intervention as possibleTo calculate the PISN values for the concerned month we use all Wolf numbers Typicallythere is data from around 65 stations available
The calculation of the PISN is based on an extensive statistical treatment This treatmentfilters out any abnormal daily observation or the complete data set from an erratic station(quality control) This prevents long-term drifts in the resulting index One of the key elementsderived from this processing is to update the K reduction coefficients for each station theevolution of each station is monitored for each day relative to the entire networkA subset of the contributing stations also provides hemispheric counts A similar process isapplied to the North and South counts to derive the hemispheric PISN There is an additionalconstraint the sum of the North and South ISN must match the total ISNThe PISN replaces the EISN And once the Definitive ISN (DISN) is calculated the DISNreplaces the PISN
The definitive sunspot index
The Definitive ISN is calculated and issued on a quarterly basis when we have collecteddata from all the contributing observatories This is the final index and it is appended to thehistorical sunspot index time series The same semi-automated treatment as for the PISN isnow applied to the full data set If the result agrees within 5 of the PISN value the PISN iskept and becomes definitive Otherwise the new calculated value replaces the PISN andbecomes the definitive ISNIt is only at this stage and only in peculiar situations that a manual verification by ourscientific staff is required For example this happens when the observed raw Wolf valuesfrom the whole network are clustered around two distinct values This special case can becaused by small short-lived isolated sunspots (lifetimes lt 24 hours) or by the appearance ordisappearance of a large group at the solar limb in the course of one UT dayThe DISN replaces the provisional and estimated International Sunspot Number
Handling very low activity levels
One of the situations requiring a human arbitration is associated with single small isolatedand short-lived sunspots This is most noticeable around the minimum of the solar activitycycle like the one occurring now in 2008 Due to the 24hour binning (observations aregrouped between 0hUT and 24hUT) and the variable ability of each observer to detect thesmallest sunspots we end up with some stations reporting one sunspot and others who didno see any sunspot Let us explain further No sunspot may mean that the sunspot waspresent but the observer was unable to see it because of poor observational conditions such
as weather a small telescope On the other hand it may also indicate that the sunspot hadactually vanished by that time while it was present earlier on the same day
832019 Ew Afgewerkte Final
httpslidepdfcomreaderfullew-afgewerkte-final 4759
47
Individual stations do not observe at exactly the same timeIn order to validate the existence of such a marginal reported sunspot a qualified SIDCscientist must then check the detailed chronology within that day and consider the overallobserver capability (value of K coefficient)In common practice the fact that a sunspot is reported by a significant group of observersleads to the inclusion of the sunspot on that date thus neglecting the no-sunspotobservationsThe rationale is multiple observations of a sunspot exclude the possibility that the reportedsunspot was an independent false detection So a sunspot was really present on that dayalthough it may have existed only for part of the day or it was small enough to be missed bypart of the observers with smaller instruments or imperfect atmospheric conditionsAlso keep in mind that the sunspot index is derived with a limited precision just like any otherindex If the monthly mean sunspot number is 0 or 05 you can definitely say that activitywas low
What index should be used
If you want to perform long-term investigations the definitive ISN series is definitely the mostsuitable However there is a delay of a few months So when investigating the last cycle andrecent evolution use the definitive numbers in combination with the provisional ISN to be upto date to the last month The provisional numbers are also used in models forecasting thesunspot number for the coming months Now if you need a proxy for solar activity in a modelthat runs in real-time then you may use the estimated ISNImprovements and rethinking of the processing method is an ongoing project We arecurrently developing an alternative program for calculating the PISN Of course long-termconsistency is vital Therefore a cross-analysis between the output from the old and newsoftware must be applied over an extended period
832019 Ew Afgewerkte Final
httpslidepdfcomreaderfullew-afgewerkte-final 4859
48
Above graphs show different kinds of the International Sunspot Number The left plot gives an overview from 1700 up to now from the yearly (black) and monthly smoothed Sunspot Number The graph in the right top corner shows the monthly and monthly smoothed sunspot number while the graph in the right bottom corner show the daily monthly smoothed monthly sunspot number For every the time range of investigation there is an appropriate sunspot number
832019 Ew Afgewerkte Final
httpslidepdfcomreaderfullew-afgewerkte-final 4959
49
Appendix XI Filaments and prominences
httpsohowwwnascomnasagovpickoftheweekold26feb2004
This is a picture taken by SOHO on 26 February 2004
832019 Ew Afgewerkte Final
httpslidepdfcomreaderfullew-afgewerkte-final 5059
50
Appendix XII The reconnection of magnetic loops
httpwwwioporgEJarticle0004-637X558287253575webpdfrequest-id=73e38daa-69ae-4e01-b9a6- b4bd0ba071dd
In (a) sunspot B and C have different polarity and move towards each other The twomagnetic loops will reconnect and form one big magnetic loop showed in (b) This will
happen to other magnetic loops too as can be seen in (c) When G en F are close enough they
will reconnect and so E en H will reconnect too It is possible that the magnetic field line is
trapped around another in this case AD The mass ejected from the sun will be trapped
between the magnetic field lines and form a solar prominence
832019 Ew Afgewerkte Final
httpslidepdfcomreaderfullew-afgewerkte-final 5159
832019 Ew Afgewerkte Final
httpslidepdfcomreaderfullew-afgewerkte-final 5259
52
httptheinvisibleagentwordpresscom20090117amazing-celestial-images
An group of active prominences
httpapodnasagovapodap051109html
httpwhassupinthemilkywayblogspotcom200903cloudy-planhtml
A picture taken by SOHO In the left corner you can see the prominence with twisted
magnetic field lines
832019 Ew Afgewerkte Final
httpslidepdfcomreaderfullew-afgewerkte-final 5359
53
Appendix XIV Polar crown
httpsciencenasagovheadlinesy200817sep_polarcrownhtm
Photograph of a polar crown taken on 13 June 1999 by the Meudon Observatory
832019 Ew Afgewerkte Final
httpslidepdfcomreaderfullew-afgewerkte-final 5459
54
Appendix XV Coronal holes
httpsunearthdaynasagov2007multimediagal_020php
The black segment is a huge coronal hole The bright parts are x-rays from sunspots
832019 Ew Afgewerkte Final
httpslidepdfcomreaderfullew-afgewerkte-final 5559
55
Appendix XVI Coronal mass ejection
httpzuserver2staruclacuk~idhapodap000309html
Picture of a CME taken by SOHO in February 2000
832019 Ew Afgewerkte Final
httpslidepdfcomreaderfullew-afgewerkte-final 5659
56
Bibliography
Books
BEATTY JK PETERSEN CC and CHAIKIN A The new solar system fourth edition
Cambridge University Press Cambridge 1999 421 p
COMINS NF and KAUFMANN III WJ Discovering the universe eighth edition WH
Freeman and Company New York 2008 535 p
DETHIER T Het zonnestelsel Standaard Uitgeverij 1992 415 p
GOLUB L and PASACHOFF JM Nearest star the surprising science of our sun Harvard
university press Harvard 2001 267 p
GREEN SF and JONES M H An introduction to the Sun and Stars The Open University
Cambridge 2004 373 p
HILL S and CARLOWITZ M The sun Abrams New York 2006 239 p
HOLMAN GD lsquoThe mysterious origins of solar flaresrsquo Scientific America April 2006 p
24-31 volume 294 number 4
JANSSENS J Zon en aarde een unieke relatie Garant Antwerpen 2003 254 p
KELLER H-U Van Supernovarsquos tot zwarte gaten Tirion Natuur AH Baarn 2003 169 p
LANG KR Sun earth and sky Springer Germany 1995 282 p
LILENSTEN J and BORNAREL J Sous les feux du soleil EDP Sciences Les Ulis Cedex
A 2001 247 p
832019 Ew Afgewerkte Final
httpslidepdfcomreaderfullew-afgewerkte-final 5759
57
Articles
CUYPERS J and others lsquoLa rechercheacute en heacuteliophysique en Belgiquersquo Space connection
October 2007 20 p
DE KEYSER J lsquoDe magnetopauzersquo Heelal maart 1998 p 66-73
JANSSENS J lsquoHet maximum van de 23ste zonnevlekkencyclus (I)rsquo Heelal Oktober 1998 p
256-263
JANSSENS J lsquohet maximum van de 23ste zonnenvlekkencyclus (II)rsquo Heelal November
1998 p 284-290
JANSSENS J lsquoZonnefakkelsrsquo Heelal Oktober 1994 p 256-261
SMITS F lsquoDe coronarsquo Heelal Februari 1999 p 40-42
SMITS F lsquoProtuberanzenrsquo Heelal Juli 1991 p 182-185
VAN DEN BERGHE S lsquoHet Zeemaneffectrsquo Heelal September 1998 p 228-231
832019 Ew Afgewerkte Final
httpslidepdfcomreaderfullew-afgewerkte-final 5859
58
Webography
BOEN B Birth of a coronal mass ejection Internet
(httpwwwnasagovmission_pagessolar-b solar_005html) 290408
BRAEUNIG R A Glossary Internet (httpwwwbraeunigusspaceglossaryhtm) 2006
CORDIS Researchers reveal why Suns atmosphere is hotter than its surface Internet
(httpcordiseuropaeusearchindexcfmfuseaction=newsdocumentampN_LANG=ENampN_R
CN=30598amppid=0ampq=87F36474805A6BEC0B89404F72D0351Famptype=sim) 20032009
DAY C Alfveacuten waves may heat the Sunrsquos corona Internet
(httpblogsphysicstodayorgupdate200903 alfven-waves-may-heat-the-sunshtml)
310309
ELLERMAN F Solar prominences Internet (httparticlesadsabsharvardedufull
1928ASPL173E 0000074000html) (03042009)
ENCYCLODPEDIA OF SCIENCE Corona hole Internet
(httpwwwdaviddarlinginfoencyclopediaC coronal_holehtml) (04042009)
HATHAWAY D H The sunspot cycle Internet
(httpspacesciencespacerefcomsslpadsolarsunspots htm) 04012000
JANSSENS J The case of the missing solar cycle (published in lsquoheelalrsquo January 2008)
Internet (httpuserstelenetbejjanssensMSCwebEngpdf)
KNISELY D Solar prominences Internet
(httpwwwicstarscomHTMLSolarSectionHAlphaOBSERVINGTHESUNHAlpha3html)
(03042009)
KOPANSKI J Atom Internet (httpknolgooglecomkjan-
kopanskiatom1amrwrct7rvi27) 060209
MARTENS PC and ZWAAN C Origin and evolution of filament-prominence systems
Internet (http wwwioporgEJarticle0004-637X558287253575webpdfrequest-
id=73e38daa-69ae-4e01-b9a6-b4bd0ba071dd) 092001
NASA The corona Internet (httpsolarsciencemsfcnasagovcoronashtml) 180107
NASA The heliosphere Internet (httpheliosgsfcnasagovheliosphhtml) 20012009
OFFICIAL SITE OF STONEHENGE About Stonehenge Internet
(httpwwwstonehengecouk) (03022009)
OTTERSDORF M Astronomy On the sunspot cycle Internet
(httpuserszoominternetnet~matto MCASsunspot_cyclehtmZeemaneffect) 031103
PARIAT E and SCHMIEDER B Magnetic flux emergence Internet(httpwwwscholarpediaorgarticleMagnetic_field_emergence) 18042008
832019 Ew Afgewerkte Final
httpslidepdfcomreaderfullew-afgewerkte-final 5959
59
PRIEST E R Dynamics and Structure of Quiescent Solar Prominences Internet
(httpbooksgooglebe booksid=h599q3jz1w4Campdq=quiescent+prominencesampprintsec=fro
ntcoverampsource=blampots=58b79Qeyabampsig=1eklQ-
WszOIebZZaq7fq7gm6bxAamphl=nlampei=urPtSe7ZCo61-
Qa166jHDwampsa=Xampoi=book_resultampct=result ampresnum=3PPA6M2) 1989
RUSSELL R Rotation of the sun Internet
(httpwwwwindowsucaredutourlink=sunSolar_interior
Sun_layersdifferential_rotationhtml) 16082005
RUSSELL R Sunspots and magnetic fields Internet
(httpwwwwindowsucaredutourlink=sunatmospheresunspot_magnetismhtmlampedu=hig
h) 060908
UNIVERSITY OF GLASGOW Bibliography of Peter Sweet Internet
(httpwwwuniversitystoryglaacuk biographyid=WH2144amptype=P) (10042009)
WIKIPEDIA Orbiting Solar Observatory Internet
(httpenwikipediaorgwikiOrbiting_Solar_Observatory) 24012009
WINDOWS TEAM Maunderrsquos Butterfly Diagram Internet
(httpwwwwindowsucaredutourlink=sun activitybutterflyhtml) 2000
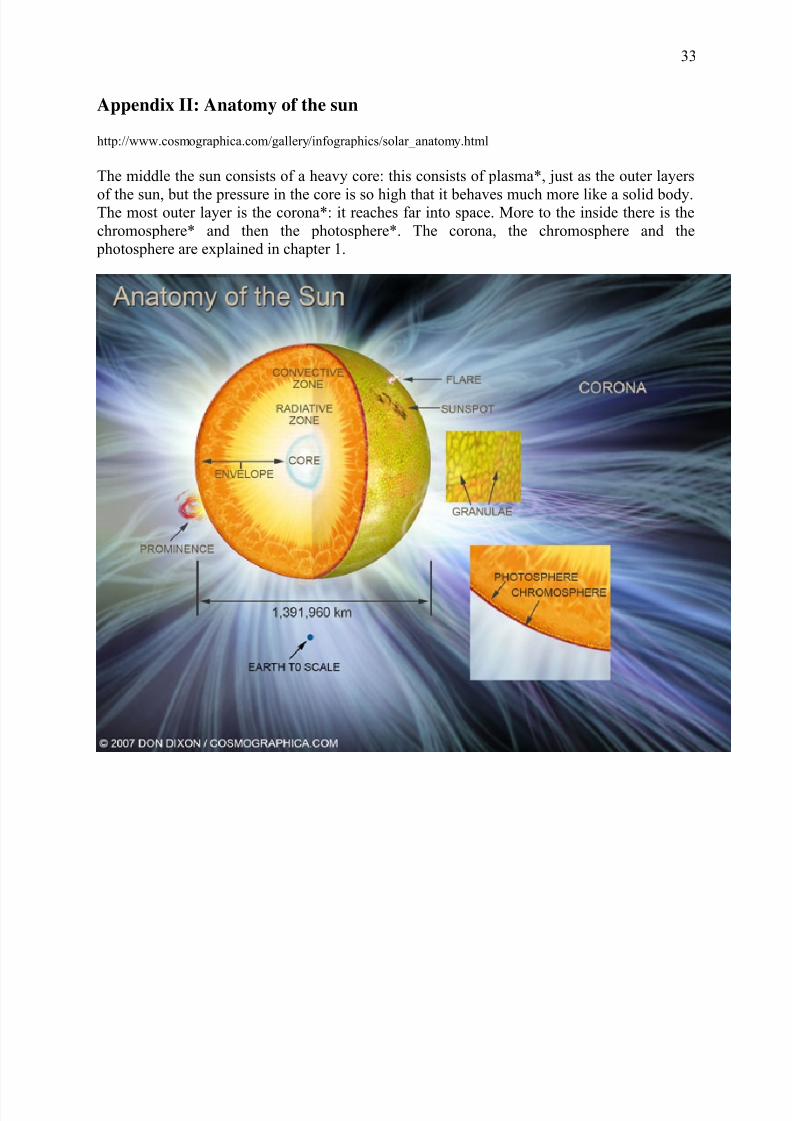
832019 Ew Afgewerkte Final
httpslidepdfcomreaderfullew-afgewerkte-final 3459
34
Appendix III Granulation
httpwwwwindowsucaredutourlink=sunSolar_interiorsolar_furnacehtml
At the surface of the sun we can find granules These are created by convection the warmest
parts of the sunrsquos interior move upwards and the colder parts at the surface move downwardsThis causes currents of plasma The dark lines are the colder particles We see them darker
because they emit less light than their surrounding neighbourhood
832019 Ew Afgewerkte Final
httpslidepdfcomreaderfullew-afgewerkte-final 3559
35
Appendix IV Spicules
Picture httplpc1clpccdcccauslpcharpellastro20a20deinfo_s09htmInformation httpwwwdaviddarlinginfoencyclopediaSspiculehtml
On this picture you can see spicules Spicules only last for several minutes and can be foundin the chromosphere They are little jets of gas There also exist macrospicules that can be
approximately ten times larger than a normal spicule
832019 Ew Afgewerkte Final
httpslidepdfcomreaderfullew-afgewerkte-final 3659
36
Appendix V The most important satellites observing the sun
Here you can find the most important satellites observing the sun and their missions
Solar and Heliospheric Obseratory (SOHO)
httpsohowwwnascomnasagovaboutabouthtml
SOHO the Solar amp Heliospheric Observatory is a project of international collaboration
between ESA and NASA to study the Sun from its deep core to the outer corona and the solar
wind
SOHO was launched on December 2 1995 The SOHO spacecraft was built in Europe by an
industry team led by prime contractor Matra Marconi Space (now EADS Astrium) under
overall management by ESA The twelve instruments on board SOHO were provided by
European and American scientists Nine of the international instrument consortia are led by
European Principal Investigators (PIs) three by PIs from the US Large engineering teamsand more than 200 co-investigators from many institutions supported the PIs in the
development of the instruments and in the preparation of their operations and data analysis
NASA was responsible for the launch and is now responsible for mission operations Large
radio dishes around the world which form NASAs Deep Space Network are used for data
downlink and commanding Mission control is based at Goddard Space Flight Center in
Maryland
More information about SOHO can be found on
httpsohowwwnascomnasagovaboutdocsSOHO_Fact_Sheetpdf
832019 Ew Afgewerkte Final
httpslidepdfcomreaderfullew-afgewerkte-final 3759
37
Transition Region and Coronal Explorer (TRACE)
httptracelmsalcomProjectMissionmissionhtm
TRACE enables solar physicists to study the connections between fine-scale magnetic fields
and the associated plasma structures on the Sun in a quantitative way by observing the photosphere the transition region and the corona With TRACE these temperature domains
are observed nearly simultaneously (with as little delay as only a second between different
wavelengths) with a spatial resolution of one second of arc
This is accomplished by obtaining precisely coaligned image sequences of photosphere
transition region and corona with high spatial resolution and uninterrupted viewing of the
Sun for up to eight months
TRACE Mission
TRACE explores the magnetic field in the solar atmosphere by studyingbull The 3-dimensional field structure
bull Its temporal evolution in response to photospheric flows
bull The time-dependent coronal fine structure
bull The coronal and transition region thermal topology
TRACE was launched on a Pegasus launch vehicle from Vandenberg Air Force Base in April
1998 The launch was scheduled to allow joint observations with SOHO during the rising
phase of the solar cycle to sunspot maximum No transition region or coronal imager has
witnessed the onset and rise of a solar cycle
Pegasus in flight
The two satellites provide complementary observations TRACE produces the high spatial
and temporal resolution images while SoHO yields images and spectral data out to 30 solar
radii at much lower spatial and temporal resolution Jointly they provide the opportunity to
obtain simultaneous digital measurements of all the temperature regimes of the solar
atmosphere in both high-resolution imaging and spectroscopy
With these data we expect to shatter the current ignorance of coronal heating and impulsive
MHD phenomena with benefits not only to solar physics but also to studies ranging from
stellar activity to the MHD of accretion disks The magnetograms produced by MDI on SoHO
provide a complete record of the eruption and distribution of photosphere magnetic fields
which will be invaluable for understanding TRACE observations of coronal hole formation
and coronal mass ejections Both of these phenomena have profound effects on our space
environment and the Earth`s magnetic field
TRACE is the first US solar research satellite since the Solar Maximum Mission
Coordination with SOHO provides an unprecedented opportunity to follow the emergence of
magnetic flux from the base of the convection zone deep inside the Sun through the
photosphere chromosphere and transitional region to the low-beta outer corona while
observing the effects of this emergence such as coronal mass ejections with high spatial andtemporal resolution
832019 Ew Afgewerkte Final
httpslidepdfcomreaderfullew-afgewerkte-final 3859
38
The transition from the photosphere where magnetic fields and plasma are in rough
equipartition to the corona where magnetic fields dominate is extremely difficult to model
and until recently to observe at high temporal and spatial resolution Many of the physical
problems that arise here such as plasma confinement reconnection wave propagation and plasma heating arise throughout space physics and astrophysics The detailed study of these
processed in the solar outer atmosphere is invaluable to astrophysics in general and stellar
studies in particular
More information about TRACE observations can be found on
httptracelmsalcomOperationsGeneraloperatiohtm
832019 Ew Afgewerkte Final
httpslidepdfcomreaderfullew-afgewerkte-final 3959
39
Reuven Ramaty High Energy Solar Spectroscopic Imager (RHESSI)
httphesperiagsfcnasagovhessibrochurehtm
What Questions will HESSI Address
bull How is such a large amount of energy released so rapidly during a flare
bull How are so many electrons and protons accelerated so quickly to such high energies
bull Where are the electrons and protons accelerated in the solar atmosphere and where do
they deposit their energy
How will HESSI Address these Questions
HESSI shown below will concentrate on electrons and protons accelerated in solar flares
through observations of the X-rays and gamma rays that they produce
bull HESSI will obtain the first ever X-ray and gamma-ray images of flares from 100 keV
to 20 MeVbull HESSI will do the first ever nuclear gamma-ray line spectroscopy of solar flares
bull HESSI will obtain pictures of flares in X-rays with an angular resolution of 2
arcseconds a factor of three better than previously possible
bull HESSI will measure X-ray and gamma-ray spectra with less than 1 keV energy
resolution a factor of 20-40 better than previously possible with scintillation counters
More information about the RHESSIrsquos Mission can be found on
httphesperiagsfcnasagovhessiconcepthtm
832019 Ew Afgewerkte Final
httpslidepdfcomreaderfullew-afgewerkte-final 4059
40
Solar Radiation and Climate Experiment (SORCE)
httplaspcoloradoedusorcesciencebackgroundhtm
The Solar Radiation and Climate Experiment (SORCE) is a NASA-sponsored satellite
mission that is providing state-of-the-art measurements of incoming x-ray ultraviolet visiblenear-infrared and total solar radiation The measurements provided by SORCE specifically
address long-term climate change natural variability and enhanced climate prediction and
atmospheric ozone and UV-B radiation These measurements are critical to studies of the Sun
its effect on our Earth system and its influence on humankind
The SORCE spacecraft was launched on January 25 2003 on a Pegasus XL launch vehicle to
provide NASAs Earth Science Enterprise (ESE) with precise measurements of solar
radiation It launched into a 645 km 40 degree orbit and is operated by the Laboratory for
Atmospheric and Space Physics (LASP) at the University of Colorado (CU) in Boulder
Colorado USA It will continue the precise measurements of total solar irradiance (TSI) that
began with the ERB instrument in 1979 and has continued to the present with the ACRIM series of measurements SORCE will also provide the measurements of the solar spectral
irradiance from 1nm to 2000nm accounting for 95 of the spectral contribution to TSI
SORCE carries four instruments including the Spectral Irradiance Monitor (SIM) Solar
Stellar Irradiance Comparison Experiment (SOLSTICE) Total Irradiance Monitor (TIM) and
the XUV Photometer System (XPS)
The primary goal of the NASA Earth Observing Systems (EOS) SOlar Radiation and Climate
Experiment (SORCE) is to enable solar-terrestrial studies by providing precise daily
measurements of the total solar irradiance (TSI) and the solar spectral irradiance atwavelengths extending from the ultraviolet to the near infrared The following lists the
SORCE science objectives
1 Make accurate measurements with high precision of total solar irradiance connect
them to previous TSI measurements and continue this long-term climate record
Provide TSI with an accuracy of 001 (100 parts per million) based on SI units and
with a long-term repeatability of 0001yr
2 Make daily measurements of the solar ultraviolet irradiance from 120 to 300 nm with
a spectral resolution of 1 nm Achieve this spectral irradiance measurement with an
accuracy of better than 5 and with a long-term repeatability of 05yr Use the
solarstellar comparison technique to relate the solar irradiance to the ensembleaverage flux from a number of bright early-type stars (same stars used by the UARS
SOLSTICE program)
3 Make the first measurements of the visible and near IR solar irradiance with sufficient
precision for future climate studies Obtain daily measurements of solar spectral
irradiance between 03 and 2 microm with a spectral resolution of at least 130 an
accuracy of 003 and a long-term repeatability of better than 001yr
4 Improve the understanding of how and why solar irradiance varies estimate past and
future solar behavior and investigate climate responses
More information about SORCE can be found on
httplaspcoloradoedusorcesciencescience_opshtm
832019 Ew Afgewerkte Final
httpslidepdfcomreaderfullew-afgewerkte-final 4159
41
Appendix VI Wavelengths
httpeosweblarcnasagovEDDOCSWavelengths_for_Colorshtml
As you can see on the figure visible light situates in the centre of the wavelengths having not
the shortest nor the longest wavelengths Gamma rays have the shortest wavelength radioways the longest All sort of wavelengths are used for daily purpose like radio waves for
radio and TV and gamma rays for treatments
832019 Ew Afgewerkte Final
httpslidepdfcomreaderfullew-afgewerkte-final 4259
42
Appendix VII Absorption lines in the sunrsquos spectrum
Picture httpwwwsolarnavigatornetthe_sunhtmExplanation COMINS NF and KAUFMANN III WJ Discovering the universe eighth edition WHFreeman and Company New York 2008 p 109
This photo is called a spectrogram It contains the spectrum of the sun All the black lines are
absorption lines The amount of black lines is related to the amount of elements that the sun
is emitting From a spectrogram we can deduct a lot of things including their mass the
temperature of the surface the chemical composition of the sun rotation rates and much
more
832019 Ew Afgewerkte Final
httpslidepdfcomreaderfullew-afgewerkte-final 4359
832019 Ew Afgewerkte Final
httpslidepdfcomreaderfullew-afgewerkte-final 4459
44
Appendix IX Butterfly-diagram
httpspacesciencespacerefcomsslpadsolarimagesbflygif
A butterfly-diagram
In a butterfly-diagram we can find the sunspots with their latitude (y-axis) through the years(x-axis) As you can see the sunspots appear like lsquobutterfliesrsquo this was discovered in 1904 by
Edward Maunder (1851-1928 an English astronomer best remembered for his study of
sunspots and the solar magnetic cycle) Thatrsquos why this graph is also called Maunders
butterfly diagram
832019 Ew Afgewerkte Final
httpslidepdfcomreaderfullew-afgewerkte-final 4559
45
Appendix X The Wolf-numbers
httpsidcomabenews106sunspotnumberclarifiedpdf
The sunspot number clarified By Petra Vanlommel
Which kinds of daily International Sunspot Numbers (ISN) are currentlypublished by the SIDC
Three daily indices are currently published by the SIDCthe Estimated ISN (EISN)the Provisional ISN (PISN)the Definitive ISN (DISN)Although they are all based on the same type of observations ie visual sunspot counts as ameasure of solar activity they are obtained from different data sets by different processingmethods with different accuracies and they serve different purposes
In the ideal case the three numbers are equal but in practice it is inevitable that there aresmall differences Therefore It is useful to explain what each index actually means
What is the source of the Wolf number
Once per day observers worldwide communicate their measured Wolf number (= 10G + S)based on visual sunspot (S) and group (G) counts to the World Data Center for the SunspotIndex Presently this is done through a dedicated password-protected WEB form the Wolfinterface However some observers still use the old way of reporting their observations onpaper through regular mail This method slows down the final processing but for the sake ofcontinuity in the index it is important to keep these observers included as some of them
represent the longest individual datasetsThe observers give the exact observing time the observing conditions the total numbers(group count sunspot count and Wolf number) and optionally the NorthSouth and centralzone numbers The observers using the web interface can provide their results to the SIDCimmediately after each observation However some users prefer to insert their data as ablock creating some delay but this must be done at least once a month
The personal reduction coefficient K
A personal reduction coefficient K is calculated for each station It has values typically in therange 04 and 17 and leads to a normalized sunspot number K(10G+S) In other words theK factor rescales the raw sunspot counts of each observer to the ones of Rudolph Wolf the
astronomer who introduced the above Wolf formula thus simulating the same eyes sametelescope and same conditionsDuring the procedure for calculating the Provisional ISN the K factor of every station iscomputed for every observation that passes the elimination procedure Once a year apersonal K factor for every station and for every month of the previous year is calculated Ayearly mean K value per station is also computed
The estimated sunspot index
The Estimated ISN (EISN) is calculated and issued on a daily basis for the day of calculationand the day before Only the total EISN is calculated with no hemispheric index It is anautomated procedure and no manual intervention is done The EISN is meant as a quicktemporary and approximate index for real-time applications
832019 Ew Afgewerkte Final
httpslidepdfcomreaderfullew-afgewerkte-final 4659
46
We use the raw Wolf number from all observatories that have provided counts early in theday ie before 1230 UT Typically there is between 10 and 20 stations available Thecalculation of the EISN is based on a simple and straightforward statistical method The Wolfnumbers are multiplied with the yearly mean K factor (see paragraph about the personalreduction coefficient K) The EISN is a simple average of the K-scaled values after excludingany individual value that deviates abnormally from the other valuesOnce the Provisional ISN (PISN) is calculated after the end of a month the temporary EISNis dropped and replaced by the PISN
The provisional sunspot Index
The Provisional ISN (PISN) is calculated and issued on the first of every month Theoutcome is a daily total and hemispheric sunspot number for the entire elapsed month Anexample on the first of September we calculate the daily PISN for each day of August ThePISN is computed semi-automatically with as little manual intervention as possibleTo calculate the PISN values for the concerned month we use all Wolf numbers Typicallythere is data from around 65 stations available
The calculation of the PISN is based on an extensive statistical treatment This treatmentfilters out any abnormal daily observation or the complete data set from an erratic station(quality control) This prevents long-term drifts in the resulting index One of the key elementsderived from this processing is to update the K reduction coefficients for each station theevolution of each station is monitored for each day relative to the entire networkA subset of the contributing stations also provides hemispheric counts A similar process isapplied to the North and South counts to derive the hemispheric PISN There is an additionalconstraint the sum of the North and South ISN must match the total ISNThe PISN replaces the EISN And once the Definitive ISN (DISN) is calculated the DISNreplaces the PISN
The definitive sunspot index
The Definitive ISN is calculated and issued on a quarterly basis when we have collecteddata from all the contributing observatories This is the final index and it is appended to thehistorical sunspot index time series The same semi-automated treatment as for the PISN isnow applied to the full data set If the result agrees within 5 of the PISN value the PISN iskept and becomes definitive Otherwise the new calculated value replaces the PISN andbecomes the definitive ISNIt is only at this stage and only in peculiar situations that a manual verification by ourscientific staff is required For example this happens when the observed raw Wolf valuesfrom the whole network are clustered around two distinct values This special case can becaused by small short-lived isolated sunspots (lifetimes lt 24 hours) or by the appearance ordisappearance of a large group at the solar limb in the course of one UT dayThe DISN replaces the provisional and estimated International Sunspot Number
Handling very low activity levels
One of the situations requiring a human arbitration is associated with single small isolatedand short-lived sunspots This is most noticeable around the minimum of the solar activitycycle like the one occurring now in 2008 Due to the 24hour binning (observations aregrouped between 0hUT and 24hUT) and the variable ability of each observer to detect thesmallest sunspots we end up with some stations reporting one sunspot and others who didno see any sunspot Let us explain further No sunspot may mean that the sunspot waspresent but the observer was unable to see it because of poor observational conditions such
as weather a small telescope On the other hand it may also indicate that the sunspot hadactually vanished by that time while it was present earlier on the same day
832019 Ew Afgewerkte Final
httpslidepdfcomreaderfullew-afgewerkte-final 4759
47
Individual stations do not observe at exactly the same timeIn order to validate the existence of such a marginal reported sunspot a qualified SIDCscientist must then check the detailed chronology within that day and consider the overallobserver capability (value of K coefficient)In common practice the fact that a sunspot is reported by a significant group of observersleads to the inclusion of the sunspot on that date thus neglecting the no-sunspotobservationsThe rationale is multiple observations of a sunspot exclude the possibility that the reportedsunspot was an independent false detection So a sunspot was really present on that dayalthough it may have existed only for part of the day or it was small enough to be missed bypart of the observers with smaller instruments or imperfect atmospheric conditionsAlso keep in mind that the sunspot index is derived with a limited precision just like any otherindex If the monthly mean sunspot number is 0 or 05 you can definitely say that activitywas low
What index should be used
If you want to perform long-term investigations the definitive ISN series is definitely the mostsuitable However there is a delay of a few months So when investigating the last cycle andrecent evolution use the definitive numbers in combination with the provisional ISN to be upto date to the last month The provisional numbers are also used in models forecasting thesunspot number for the coming months Now if you need a proxy for solar activity in a modelthat runs in real-time then you may use the estimated ISNImprovements and rethinking of the processing method is an ongoing project We arecurrently developing an alternative program for calculating the PISN Of course long-termconsistency is vital Therefore a cross-analysis between the output from the old and newsoftware must be applied over an extended period
832019 Ew Afgewerkte Final
httpslidepdfcomreaderfullew-afgewerkte-final 4859
48
Above graphs show different kinds of the International Sunspot Number The left plot gives an overview from 1700 up to now from the yearly (black) and monthly smoothed Sunspot Number The graph in the right top corner shows the monthly and monthly smoothed sunspot number while the graph in the right bottom corner show the daily monthly smoothed monthly sunspot number For every the time range of investigation there is an appropriate sunspot number
832019 Ew Afgewerkte Final
httpslidepdfcomreaderfullew-afgewerkte-final 4959
49
Appendix XI Filaments and prominences
httpsohowwwnascomnasagovpickoftheweekold26feb2004
This is a picture taken by SOHO on 26 February 2004
832019 Ew Afgewerkte Final
httpslidepdfcomreaderfullew-afgewerkte-final 5059
50
Appendix XII The reconnection of magnetic loops
httpwwwioporgEJarticle0004-637X558287253575webpdfrequest-id=73e38daa-69ae-4e01-b9a6- b4bd0ba071dd
In (a) sunspot B and C have different polarity and move towards each other The twomagnetic loops will reconnect and form one big magnetic loop showed in (b) This will
happen to other magnetic loops too as can be seen in (c) When G en F are close enough they
will reconnect and so E en H will reconnect too It is possible that the magnetic field line is
trapped around another in this case AD The mass ejected from the sun will be trapped
between the magnetic field lines and form a solar prominence
832019 Ew Afgewerkte Final
httpslidepdfcomreaderfullew-afgewerkte-final 5159
832019 Ew Afgewerkte Final
httpslidepdfcomreaderfullew-afgewerkte-final 5259
52
httptheinvisibleagentwordpresscom20090117amazing-celestial-images
An group of active prominences
httpapodnasagovapodap051109html
httpwhassupinthemilkywayblogspotcom200903cloudy-planhtml
A picture taken by SOHO In the left corner you can see the prominence with twisted
magnetic field lines
832019 Ew Afgewerkte Final
httpslidepdfcomreaderfullew-afgewerkte-final 5359
53
Appendix XIV Polar crown
httpsciencenasagovheadlinesy200817sep_polarcrownhtm
Photograph of a polar crown taken on 13 June 1999 by the Meudon Observatory
832019 Ew Afgewerkte Final
httpslidepdfcomreaderfullew-afgewerkte-final 5459
54
Appendix XV Coronal holes
httpsunearthdaynasagov2007multimediagal_020php
The black segment is a huge coronal hole The bright parts are x-rays from sunspots
832019 Ew Afgewerkte Final
httpslidepdfcomreaderfullew-afgewerkte-final 5559
55
Appendix XVI Coronal mass ejection
httpzuserver2staruclacuk~idhapodap000309html
Picture of a CME taken by SOHO in February 2000
832019 Ew Afgewerkte Final
httpslidepdfcomreaderfullew-afgewerkte-final 5659
56
Bibliography
Books
BEATTY JK PETERSEN CC and CHAIKIN A The new solar system fourth edition
Cambridge University Press Cambridge 1999 421 p
COMINS NF and KAUFMANN III WJ Discovering the universe eighth edition WH
Freeman and Company New York 2008 535 p
DETHIER T Het zonnestelsel Standaard Uitgeverij 1992 415 p
GOLUB L and PASACHOFF JM Nearest star the surprising science of our sun Harvard
university press Harvard 2001 267 p
GREEN SF and JONES M H An introduction to the Sun and Stars The Open University
Cambridge 2004 373 p
HILL S and CARLOWITZ M The sun Abrams New York 2006 239 p
HOLMAN GD lsquoThe mysterious origins of solar flaresrsquo Scientific America April 2006 p
24-31 volume 294 number 4
JANSSENS J Zon en aarde een unieke relatie Garant Antwerpen 2003 254 p
KELLER H-U Van Supernovarsquos tot zwarte gaten Tirion Natuur AH Baarn 2003 169 p
LANG KR Sun earth and sky Springer Germany 1995 282 p
LILENSTEN J and BORNAREL J Sous les feux du soleil EDP Sciences Les Ulis Cedex
A 2001 247 p
832019 Ew Afgewerkte Final
httpslidepdfcomreaderfullew-afgewerkte-final 5759
57
Articles
CUYPERS J and others lsquoLa rechercheacute en heacuteliophysique en Belgiquersquo Space connection
October 2007 20 p
DE KEYSER J lsquoDe magnetopauzersquo Heelal maart 1998 p 66-73
JANSSENS J lsquoHet maximum van de 23ste zonnevlekkencyclus (I)rsquo Heelal Oktober 1998 p
256-263
JANSSENS J lsquohet maximum van de 23ste zonnenvlekkencyclus (II)rsquo Heelal November
1998 p 284-290
JANSSENS J lsquoZonnefakkelsrsquo Heelal Oktober 1994 p 256-261
SMITS F lsquoDe coronarsquo Heelal Februari 1999 p 40-42
SMITS F lsquoProtuberanzenrsquo Heelal Juli 1991 p 182-185
VAN DEN BERGHE S lsquoHet Zeemaneffectrsquo Heelal September 1998 p 228-231
832019 Ew Afgewerkte Final
httpslidepdfcomreaderfullew-afgewerkte-final 5859
58
Webography
BOEN B Birth of a coronal mass ejection Internet
(httpwwwnasagovmission_pagessolar-b solar_005html) 290408
BRAEUNIG R A Glossary Internet (httpwwwbraeunigusspaceglossaryhtm) 2006
CORDIS Researchers reveal why Suns atmosphere is hotter than its surface Internet
(httpcordiseuropaeusearchindexcfmfuseaction=newsdocumentampN_LANG=ENampN_R
CN=30598amppid=0ampq=87F36474805A6BEC0B89404F72D0351Famptype=sim) 20032009
DAY C Alfveacuten waves may heat the Sunrsquos corona Internet
(httpblogsphysicstodayorgupdate200903 alfven-waves-may-heat-the-sunshtml)
310309
ELLERMAN F Solar prominences Internet (httparticlesadsabsharvardedufull
1928ASPL173E 0000074000html) (03042009)
ENCYCLODPEDIA OF SCIENCE Corona hole Internet
(httpwwwdaviddarlinginfoencyclopediaC coronal_holehtml) (04042009)
HATHAWAY D H The sunspot cycle Internet
(httpspacesciencespacerefcomsslpadsolarsunspots htm) 04012000
JANSSENS J The case of the missing solar cycle (published in lsquoheelalrsquo January 2008)
Internet (httpuserstelenetbejjanssensMSCwebEngpdf)
KNISELY D Solar prominences Internet
(httpwwwicstarscomHTMLSolarSectionHAlphaOBSERVINGTHESUNHAlpha3html)
(03042009)
KOPANSKI J Atom Internet (httpknolgooglecomkjan-
kopanskiatom1amrwrct7rvi27) 060209
MARTENS PC and ZWAAN C Origin and evolution of filament-prominence systems
Internet (http wwwioporgEJarticle0004-637X558287253575webpdfrequest-
id=73e38daa-69ae-4e01-b9a6-b4bd0ba071dd) 092001
NASA The corona Internet (httpsolarsciencemsfcnasagovcoronashtml) 180107
NASA The heliosphere Internet (httpheliosgsfcnasagovheliosphhtml) 20012009
OFFICIAL SITE OF STONEHENGE About Stonehenge Internet
(httpwwwstonehengecouk) (03022009)
OTTERSDORF M Astronomy On the sunspot cycle Internet
(httpuserszoominternetnet~matto MCASsunspot_cyclehtmZeemaneffect) 031103
PARIAT E and SCHMIEDER B Magnetic flux emergence Internet(httpwwwscholarpediaorgarticleMagnetic_field_emergence) 18042008
832019 Ew Afgewerkte Final
httpslidepdfcomreaderfullew-afgewerkte-final 5959
59
PRIEST E R Dynamics and Structure of Quiescent Solar Prominences Internet
(httpbooksgooglebe booksid=h599q3jz1w4Campdq=quiescent+prominencesampprintsec=fro
ntcoverampsource=blampots=58b79Qeyabampsig=1eklQ-
WszOIebZZaq7fq7gm6bxAamphl=nlampei=urPtSe7ZCo61-
Qa166jHDwampsa=Xampoi=book_resultampct=result ampresnum=3PPA6M2) 1989
RUSSELL R Rotation of the sun Internet
(httpwwwwindowsucaredutourlink=sunSolar_interior
Sun_layersdifferential_rotationhtml) 16082005
RUSSELL R Sunspots and magnetic fields Internet
(httpwwwwindowsucaredutourlink=sunatmospheresunspot_magnetismhtmlampedu=hig
h) 060908
UNIVERSITY OF GLASGOW Bibliography of Peter Sweet Internet
(httpwwwuniversitystoryglaacuk biographyid=WH2144amptype=P) (10042009)
WIKIPEDIA Orbiting Solar Observatory Internet
(httpenwikipediaorgwikiOrbiting_Solar_Observatory) 24012009
WINDOWS TEAM Maunderrsquos Butterfly Diagram Internet
(httpwwwwindowsucaredutourlink=sun activitybutterflyhtml) 2000
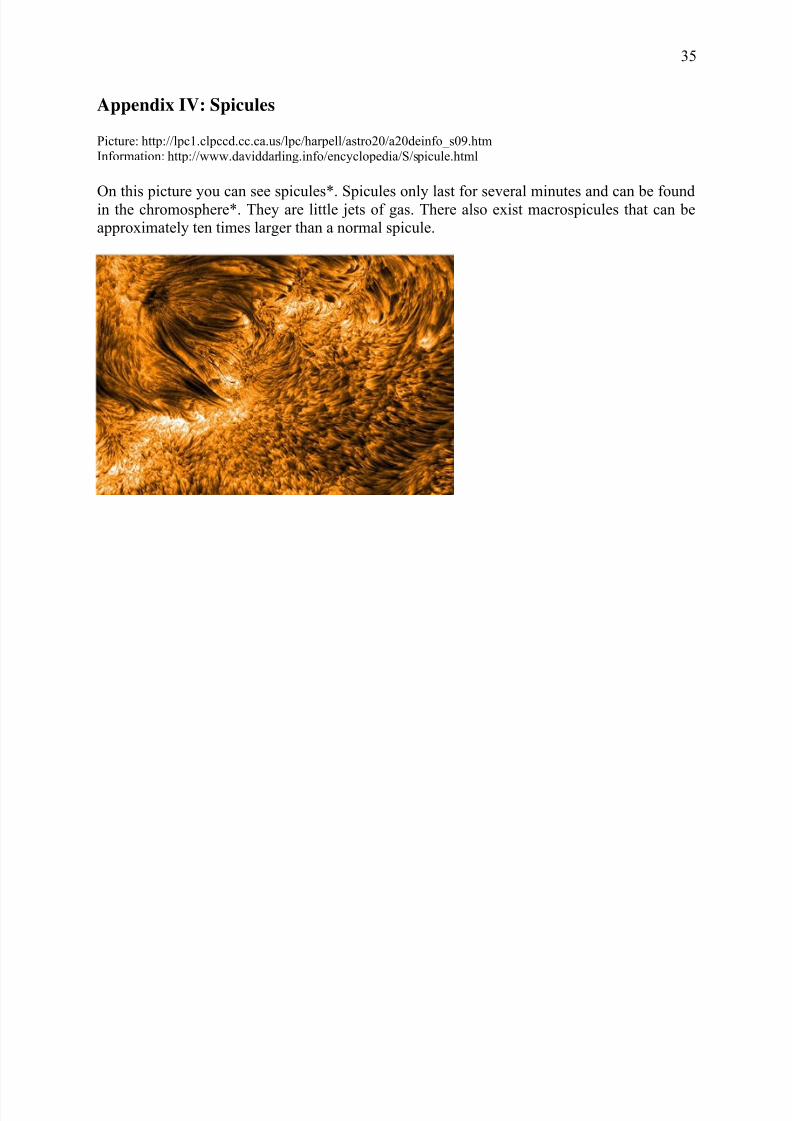
832019 Ew Afgewerkte Final
httpslidepdfcomreaderfullew-afgewerkte-final 3959
39
Reuven Ramaty High Energy Solar Spectroscopic Imager (RHESSI)
httphesperiagsfcnasagovhessibrochurehtm
What Questions will HESSI Address
bull How is such a large amount of energy released so rapidly during a flare
bull How are so many electrons and protons accelerated so quickly to such high energies
bull Where are the electrons and protons accelerated in the solar atmosphere and where do
they deposit their energy
How will HESSI Address these Questions
HESSI shown below will concentrate on electrons and protons accelerated in solar flares
through observations of the X-rays and gamma rays that they produce
bull HESSI will obtain the first ever X-ray and gamma-ray images of flares from 100 keV
to 20 MeVbull HESSI will do the first ever nuclear gamma-ray line spectroscopy of solar flares
bull HESSI will obtain pictures of flares in X-rays with an angular resolution of 2
arcseconds a factor of three better than previously possible
bull HESSI will measure X-ray and gamma-ray spectra with less than 1 keV energy
resolution a factor of 20-40 better than previously possible with scintillation counters
More information about the RHESSIrsquos Mission can be found on
httphesperiagsfcnasagovhessiconcepthtm
832019 Ew Afgewerkte Final
httpslidepdfcomreaderfullew-afgewerkte-final 4059
40
Solar Radiation and Climate Experiment (SORCE)
httplaspcoloradoedusorcesciencebackgroundhtm
The Solar Radiation and Climate Experiment (SORCE) is a NASA-sponsored satellite
mission that is providing state-of-the-art measurements of incoming x-ray ultraviolet visiblenear-infrared and total solar radiation The measurements provided by SORCE specifically
address long-term climate change natural variability and enhanced climate prediction and
atmospheric ozone and UV-B radiation These measurements are critical to studies of the Sun
its effect on our Earth system and its influence on humankind
The SORCE spacecraft was launched on January 25 2003 on a Pegasus XL launch vehicle to
provide NASAs Earth Science Enterprise (ESE) with precise measurements of solar
radiation It launched into a 645 km 40 degree orbit and is operated by the Laboratory for
Atmospheric and Space Physics (LASP) at the University of Colorado (CU) in Boulder
Colorado USA It will continue the precise measurements of total solar irradiance (TSI) that
began with the ERB instrument in 1979 and has continued to the present with the ACRIM series of measurements SORCE will also provide the measurements of the solar spectral
irradiance from 1nm to 2000nm accounting for 95 of the spectral contribution to TSI
SORCE carries four instruments including the Spectral Irradiance Monitor (SIM) Solar
Stellar Irradiance Comparison Experiment (SOLSTICE) Total Irradiance Monitor (TIM) and
the XUV Photometer System (XPS)
The primary goal of the NASA Earth Observing Systems (EOS) SOlar Radiation and Climate
Experiment (SORCE) is to enable solar-terrestrial studies by providing precise daily
measurements of the total solar irradiance (TSI) and the solar spectral irradiance atwavelengths extending from the ultraviolet to the near infrared The following lists the
SORCE science objectives
1 Make accurate measurements with high precision of total solar irradiance connect
them to previous TSI measurements and continue this long-term climate record
Provide TSI with an accuracy of 001 (100 parts per million) based on SI units and
with a long-term repeatability of 0001yr
2 Make daily measurements of the solar ultraviolet irradiance from 120 to 300 nm with
a spectral resolution of 1 nm Achieve this spectral irradiance measurement with an
accuracy of better than 5 and with a long-term repeatability of 05yr Use the
solarstellar comparison technique to relate the solar irradiance to the ensembleaverage flux from a number of bright early-type stars (same stars used by the UARS
SOLSTICE program)
3 Make the first measurements of the visible and near IR solar irradiance with sufficient
precision for future climate studies Obtain daily measurements of solar spectral
irradiance between 03 and 2 microm with a spectral resolution of at least 130 an
accuracy of 003 and a long-term repeatability of better than 001yr
4 Improve the understanding of how and why solar irradiance varies estimate past and
future solar behavior and investigate climate responses
More information about SORCE can be found on
httplaspcoloradoedusorcesciencescience_opshtm
832019 Ew Afgewerkte Final
httpslidepdfcomreaderfullew-afgewerkte-final 4159
41
Appendix VI Wavelengths
httpeosweblarcnasagovEDDOCSWavelengths_for_Colorshtml
As you can see on the figure visible light situates in the centre of the wavelengths having not
the shortest nor the longest wavelengths Gamma rays have the shortest wavelength radioways the longest All sort of wavelengths are used for daily purpose like radio waves for
radio and TV and gamma rays for treatments
832019 Ew Afgewerkte Final
httpslidepdfcomreaderfullew-afgewerkte-final 4259
42
Appendix VII Absorption lines in the sunrsquos spectrum
Picture httpwwwsolarnavigatornetthe_sunhtmExplanation COMINS NF and KAUFMANN III WJ Discovering the universe eighth edition WHFreeman and Company New York 2008 p 109
This photo is called a spectrogram It contains the spectrum of the sun All the black lines are
absorption lines The amount of black lines is related to the amount of elements that the sun
is emitting From a spectrogram we can deduct a lot of things including their mass the
temperature of the surface the chemical composition of the sun rotation rates and much
more
832019 Ew Afgewerkte Final
httpslidepdfcomreaderfullew-afgewerkte-final 4359
832019 Ew Afgewerkte Final
httpslidepdfcomreaderfullew-afgewerkte-final 4459
44
Appendix IX Butterfly-diagram
httpspacesciencespacerefcomsslpadsolarimagesbflygif
A butterfly-diagram
In a butterfly-diagram we can find the sunspots with their latitude (y-axis) through the years(x-axis) As you can see the sunspots appear like lsquobutterfliesrsquo this was discovered in 1904 by
Edward Maunder (1851-1928 an English astronomer best remembered for his study of
sunspots and the solar magnetic cycle) Thatrsquos why this graph is also called Maunders
butterfly diagram
832019 Ew Afgewerkte Final
httpslidepdfcomreaderfullew-afgewerkte-final 4559
45
Appendix X The Wolf-numbers
httpsidcomabenews106sunspotnumberclarifiedpdf
The sunspot number clarified By Petra Vanlommel
Which kinds of daily International Sunspot Numbers (ISN) are currentlypublished by the SIDC
Three daily indices are currently published by the SIDCthe Estimated ISN (EISN)the Provisional ISN (PISN)the Definitive ISN (DISN)Although they are all based on the same type of observations ie visual sunspot counts as ameasure of solar activity they are obtained from different data sets by different processingmethods with different accuracies and they serve different purposes
In the ideal case the three numbers are equal but in practice it is inevitable that there aresmall differences Therefore It is useful to explain what each index actually means
What is the source of the Wolf number
Once per day observers worldwide communicate their measured Wolf number (= 10G + S)based on visual sunspot (S) and group (G) counts to the World Data Center for the SunspotIndex Presently this is done through a dedicated password-protected WEB form the Wolfinterface However some observers still use the old way of reporting their observations onpaper through regular mail This method slows down the final processing but for the sake ofcontinuity in the index it is important to keep these observers included as some of them
represent the longest individual datasetsThe observers give the exact observing time the observing conditions the total numbers(group count sunspot count and Wolf number) and optionally the NorthSouth and centralzone numbers The observers using the web interface can provide their results to the SIDCimmediately after each observation However some users prefer to insert their data as ablock creating some delay but this must be done at least once a month
The personal reduction coefficient K
A personal reduction coefficient K is calculated for each station It has values typically in therange 04 and 17 and leads to a normalized sunspot number K(10G+S) In other words theK factor rescales the raw sunspot counts of each observer to the ones of Rudolph Wolf the
astronomer who introduced the above Wolf formula thus simulating the same eyes sametelescope and same conditionsDuring the procedure for calculating the Provisional ISN the K factor of every station iscomputed for every observation that passes the elimination procedure Once a year apersonal K factor for every station and for every month of the previous year is calculated Ayearly mean K value per station is also computed
The estimated sunspot index
The Estimated ISN (EISN) is calculated and issued on a daily basis for the day of calculationand the day before Only the total EISN is calculated with no hemispheric index It is anautomated procedure and no manual intervention is done The EISN is meant as a quicktemporary and approximate index for real-time applications
832019 Ew Afgewerkte Final
httpslidepdfcomreaderfullew-afgewerkte-final 4659
46
We use the raw Wolf number from all observatories that have provided counts early in theday ie before 1230 UT Typically there is between 10 and 20 stations available Thecalculation of the EISN is based on a simple and straightforward statistical method The Wolfnumbers are multiplied with the yearly mean K factor (see paragraph about the personalreduction coefficient K) The EISN is a simple average of the K-scaled values after excludingany individual value that deviates abnormally from the other valuesOnce the Provisional ISN (PISN) is calculated after the end of a month the temporary EISNis dropped and replaced by the PISN
The provisional sunspot Index
The Provisional ISN (PISN) is calculated and issued on the first of every month Theoutcome is a daily total and hemispheric sunspot number for the entire elapsed month Anexample on the first of September we calculate the daily PISN for each day of August ThePISN is computed semi-automatically with as little manual intervention as possibleTo calculate the PISN values for the concerned month we use all Wolf numbers Typicallythere is data from around 65 stations available
The calculation of the PISN is based on an extensive statistical treatment This treatmentfilters out any abnormal daily observation or the complete data set from an erratic station(quality control) This prevents long-term drifts in the resulting index One of the key elementsderived from this processing is to update the K reduction coefficients for each station theevolution of each station is monitored for each day relative to the entire networkA subset of the contributing stations also provides hemispheric counts A similar process isapplied to the North and South counts to derive the hemispheric PISN There is an additionalconstraint the sum of the North and South ISN must match the total ISNThe PISN replaces the EISN And once the Definitive ISN (DISN) is calculated the DISNreplaces the PISN
The definitive sunspot index
The Definitive ISN is calculated and issued on a quarterly basis when we have collecteddata from all the contributing observatories This is the final index and it is appended to thehistorical sunspot index time series The same semi-automated treatment as for the PISN isnow applied to the full data set If the result agrees within 5 of the PISN value the PISN iskept and becomes definitive Otherwise the new calculated value replaces the PISN andbecomes the definitive ISNIt is only at this stage and only in peculiar situations that a manual verification by ourscientific staff is required For example this happens when the observed raw Wolf valuesfrom the whole network are clustered around two distinct values This special case can becaused by small short-lived isolated sunspots (lifetimes lt 24 hours) or by the appearance ordisappearance of a large group at the solar limb in the course of one UT dayThe DISN replaces the provisional and estimated International Sunspot Number
Handling very low activity levels
One of the situations requiring a human arbitration is associated with single small isolatedand short-lived sunspots This is most noticeable around the minimum of the solar activitycycle like the one occurring now in 2008 Due to the 24hour binning (observations aregrouped between 0hUT and 24hUT) and the variable ability of each observer to detect thesmallest sunspots we end up with some stations reporting one sunspot and others who didno see any sunspot Let us explain further No sunspot may mean that the sunspot waspresent but the observer was unable to see it because of poor observational conditions such
as weather a small telescope On the other hand it may also indicate that the sunspot hadactually vanished by that time while it was present earlier on the same day
832019 Ew Afgewerkte Final
httpslidepdfcomreaderfullew-afgewerkte-final 4759
47
Individual stations do not observe at exactly the same timeIn order to validate the existence of such a marginal reported sunspot a qualified SIDCscientist must then check the detailed chronology within that day and consider the overallobserver capability (value of K coefficient)In common practice the fact that a sunspot is reported by a significant group of observersleads to the inclusion of the sunspot on that date thus neglecting the no-sunspotobservationsThe rationale is multiple observations of a sunspot exclude the possibility that the reportedsunspot was an independent false detection So a sunspot was really present on that dayalthough it may have existed only for part of the day or it was small enough to be missed bypart of the observers with smaller instruments or imperfect atmospheric conditionsAlso keep in mind that the sunspot index is derived with a limited precision just like any otherindex If the monthly mean sunspot number is 0 or 05 you can definitely say that activitywas low
What index should be used
If you want to perform long-term investigations the definitive ISN series is definitely the mostsuitable However there is a delay of a few months So when investigating the last cycle andrecent evolution use the definitive numbers in combination with the provisional ISN to be upto date to the last month The provisional numbers are also used in models forecasting thesunspot number for the coming months Now if you need a proxy for solar activity in a modelthat runs in real-time then you may use the estimated ISNImprovements and rethinking of the processing method is an ongoing project We arecurrently developing an alternative program for calculating the PISN Of course long-termconsistency is vital Therefore a cross-analysis between the output from the old and newsoftware must be applied over an extended period
832019 Ew Afgewerkte Final
httpslidepdfcomreaderfullew-afgewerkte-final 4859
48
Above graphs show different kinds of the International Sunspot Number The left plot gives an overview from 1700 up to now from the yearly (black) and monthly smoothed Sunspot Number The graph in the right top corner shows the monthly and monthly smoothed sunspot number while the graph in the right bottom corner show the daily monthly smoothed monthly sunspot number For every the time range of investigation there is an appropriate sunspot number
832019 Ew Afgewerkte Final
httpslidepdfcomreaderfullew-afgewerkte-final 4959
49
Appendix XI Filaments and prominences
httpsohowwwnascomnasagovpickoftheweekold26feb2004
This is a picture taken by SOHO on 26 February 2004
832019 Ew Afgewerkte Final
httpslidepdfcomreaderfullew-afgewerkte-final 5059
50
Appendix XII The reconnection of magnetic loops
httpwwwioporgEJarticle0004-637X558287253575webpdfrequest-id=73e38daa-69ae-4e01-b9a6- b4bd0ba071dd
In (a) sunspot B and C have different polarity and move towards each other The twomagnetic loops will reconnect and form one big magnetic loop showed in (b) This will
happen to other magnetic loops too as can be seen in (c) When G en F are close enough they
will reconnect and so E en H will reconnect too It is possible that the magnetic field line is
trapped around another in this case AD The mass ejected from the sun will be trapped
between the magnetic field lines and form a solar prominence
832019 Ew Afgewerkte Final
httpslidepdfcomreaderfullew-afgewerkte-final 5159
832019 Ew Afgewerkte Final
httpslidepdfcomreaderfullew-afgewerkte-final 5259
52
httptheinvisibleagentwordpresscom20090117amazing-celestial-images
An group of active prominences
httpapodnasagovapodap051109html
httpwhassupinthemilkywayblogspotcom200903cloudy-planhtml
A picture taken by SOHO In the left corner you can see the prominence with twisted
magnetic field lines
832019 Ew Afgewerkte Final
httpslidepdfcomreaderfullew-afgewerkte-final 5359
53
Appendix XIV Polar crown
httpsciencenasagovheadlinesy200817sep_polarcrownhtm
Photograph of a polar crown taken on 13 June 1999 by the Meudon Observatory
832019 Ew Afgewerkte Final
httpslidepdfcomreaderfullew-afgewerkte-final 5459
54
Appendix XV Coronal holes
httpsunearthdaynasagov2007multimediagal_020php
The black segment is a huge coronal hole The bright parts are x-rays from sunspots
832019 Ew Afgewerkte Final
httpslidepdfcomreaderfullew-afgewerkte-final 5559
55
Appendix XVI Coronal mass ejection
httpzuserver2staruclacuk~idhapodap000309html
Picture of a CME taken by SOHO in February 2000
832019 Ew Afgewerkte Final
httpslidepdfcomreaderfullew-afgewerkte-final 5659
56
Bibliography
Books
BEATTY JK PETERSEN CC and CHAIKIN A The new solar system fourth edition
Cambridge University Press Cambridge 1999 421 p
COMINS NF and KAUFMANN III WJ Discovering the universe eighth edition WH
Freeman and Company New York 2008 535 p
DETHIER T Het zonnestelsel Standaard Uitgeverij 1992 415 p
GOLUB L and PASACHOFF JM Nearest star the surprising science of our sun Harvard
university press Harvard 2001 267 p
GREEN SF and JONES M H An introduction to the Sun and Stars The Open University
Cambridge 2004 373 p
HILL S and CARLOWITZ M The sun Abrams New York 2006 239 p
HOLMAN GD lsquoThe mysterious origins of solar flaresrsquo Scientific America April 2006 p
24-31 volume 294 number 4
JANSSENS J Zon en aarde een unieke relatie Garant Antwerpen 2003 254 p
KELLER H-U Van Supernovarsquos tot zwarte gaten Tirion Natuur AH Baarn 2003 169 p
LANG KR Sun earth and sky Springer Germany 1995 282 p
LILENSTEN J and BORNAREL J Sous les feux du soleil EDP Sciences Les Ulis Cedex
A 2001 247 p
832019 Ew Afgewerkte Final
httpslidepdfcomreaderfullew-afgewerkte-final 5759
57
Articles
CUYPERS J and others lsquoLa rechercheacute en heacuteliophysique en Belgiquersquo Space connection
October 2007 20 p
DE KEYSER J lsquoDe magnetopauzersquo Heelal maart 1998 p 66-73
JANSSENS J lsquoHet maximum van de 23ste zonnevlekkencyclus (I)rsquo Heelal Oktober 1998 p
256-263
JANSSENS J lsquohet maximum van de 23ste zonnenvlekkencyclus (II)rsquo Heelal November
1998 p 284-290
JANSSENS J lsquoZonnefakkelsrsquo Heelal Oktober 1994 p 256-261
SMITS F lsquoDe coronarsquo Heelal Februari 1999 p 40-42
SMITS F lsquoProtuberanzenrsquo Heelal Juli 1991 p 182-185
VAN DEN BERGHE S lsquoHet Zeemaneffectrsquo Heelal September 1998 p 228-231
832019 Ew Afgewerkte Final
httpslidepdfcomreaderfullew-afgewerkte-final 5859
58
Webography
BOEN B Birth of a coronal mass ejection Internet
(httpwwwnasagovmission_pagessolar-b solar_005html) 290408
BRAEUNIG R A Glossary Internet (httpwwwbraeunigusspaceglossaryhtm) 2006
CORDIS Researchers reveal why Suns atmosphere is hotter than its surface Internet
(httpcordiseuropaeusearchindexcfmfuseaction=newsdocumentampN_LANG=ENampN_R
CN=30598amppid=0ampq=87F36474805A6BEC0B89404F72D0351Famptype=sim) 20032009
DAY C Alfveacuten waves may heat the Sunrsquos corona Internet
(httpblogsphysicstodayorgupdate200903 alfven-waves-may-heat-the-sunshtml)
310309
ELLERMAN F Solar prominences Internet (httparticlesadsabsharvardedufull
1928ASPL173E 0000074000html) (03042009)
ENCYCLODPEDIA OF SCIENCE Corona hole Internet
(httpwwwdaviddarlinginfoencyclopediaC coronal_holehtml) (04042009)
HATHAWAY D H The sunspot cycle Internet
(httpspacesciencespacerefcomsslpadsolarsunspots htm) 04012000
JANSSENS J The case of the missing solar cycle (published in lsquoheelalrsquo January 2008)
Internet (httpuserstelenetbejjanssensMSCwebEngpdf)
KNISELY D Solar prominences Internet
(httpwwwicstarscomHTMLSolarSectionHAlphaOBSERVINGTHESUNHAlpha3html)
(03042009)
KOPANSKI J Atom Internet (httpknolgooglecomkjan-
kopanskiatom1amrwrct7rvi27) 060209
MARTENS PC and ZWAAN C Origin and evolution of filament-prominence systems
Internet (http wwwioporgEJarticle0004-637X558287253575webpdfrequest-
id=73e38daa-69ae-4e01-b9a6-b4bd0ba071dd) 092001
NASA The corona Internet (httpsolarsciencemsfcnasagovcoronashtml) 180107
NASA The heliosphere Internet (httpheliosgsfcnasagovheliosphhtml) 20012009
OFFICIAL SITE OF STONEHENGE About Stonehenge Internet
(httpwwwstonehengecouk) (03022009)
OTTERSDORF M Astronomy On the sunspot cycle Internet
(httpuserszoominternetnet~matto MCASsunspot_cyclehtmZeemaneffect) 031103
PARIAT E and SCHMIEDER B Magnetic flux emergence Internet(httpwwwscholarpediaorgarticleMagnetic_field_emergence) 18042008
832019 Ew Afgewerkte Final
httpslidepdfcomreaderfullew-afgewerkte-final 5959
59
PRIEST E R Dynamics and Structure of Quiescent Solar Prominences Internet
(httpbooksgooglebe booksid=h599q3jz1w4Campdq=quiescent+prominencesampprintsec=fro
ntcoverampsource=blampots=58b79Qeyabampsig=1eklQ-
WszOIebZZaq7fq7gm6bxAamphl=nlampei=urPtSe7ZCo61-
Qa166jHDwampsa=Xampoi=book_resultampct=result ampresnum=3PPA6M2) 1989
RUSSELL R Rotation of the sun Internet
(httpwwwwindowsucaredutourlink=sunSolar_interior
Sun_layersdifferential_rotationhtml) 16082005
RUSSELL R Sunspots and magnetic fields Internet
(httpwwwwindowsucaredutourlink=sunatmospheresunspot_magnetismhtmlampedu=hig
h) 060908
UNIVERSITY OF GLASGOW Bibliography of Peter Sweet Internet
(httpwwwuniversitystoryglaacuk biographyid=WH2144amptype=P) (10042009)
WIKIPEDIA Orbiting Solar Observatory Internet
(httpenwikipediaorgwikiOrbiting_Solar_Observatory) 24012009
WINDOWS TEAM Maunderrsquos Butterfly Diagram Internet
(httpwwwwindowsucaredutourlink=sun activitybutterflyhtml) 2000
832019 Ew Afgewerkte Final
httpslidepdfcomreaderfullew-afgewerkte-final 4059
40
Solar Radiation and Climate Experiment (SORCE)
httplaspcoloradoedusorcesciencebackgroundhtm
The Solar Radiation and Climate Experiment (SORCE) is a NASA-sponsored satellite
mission that is providing state-of-the-art measurements of incoming x-ray ultraviolet visiblenear-infrared and total solar radiation The measurements provided by SORCE specifically
address long-term climate change natural variability and enhanced climate prediction and
atmospheric ozone and UV-B radiation These measurements are critical to studies of the Sun
its effect on our Earth system and its influence on humankind
The SORCE spacecraft was launched on January 25 2003 on a Pegasus XL launch vehicle to
provide NASAs Earth Science Enterprise (ESE) with precise measurements of solar
radiation It launched into a 645 km 40 degree orbit and is operated by the Laboratory for
Atmospheric and Space Physics (LASP) at the University of Colorado (CU) in Boulder
Colorado USA It will continue the precise measurements of total solar irradiance (TSI) that
began with the ERB instrument in 1979 and has continued to the present with the ACRIM series of measurements SORCE will also provide the measurements of the solar spectral
irradiance from 1nm to 2000nm accounting for 95 of the spectral contribution to TSI
SORCE carries four instruments including the Spectral Irradiance Monitor (SIM) Solar
Stellar Irradiance Comparison Experiment (SOLSTICE) Total Irradiance Monitor (TIM) and
the XUV Photometer System (XPS)
The primary goal of the NASA Earth Observing Systems (EOS) SOlar Radiation and Climate
Experiment (SORCE) is to enable solar-terrestrial studies by providing precise daily
measurements of the total solar irradiance (TSI) and the solar spectral irradiance atwavelengths extending from the ultraviolet to the near infrared The following lists the
SORCE science objectives
1 Make accurate measurements with high precision of total solar irradiance connect
them to previous TSI measurements and continue this long-term climate record
Provide TSI with an accuracy of 001 (100 parts per million) based on SI units and
with a long-term repeatability of 0001yr
2 Make daily measurements of the solar ultraviolet irradiance from 120 to 300 nm with
a spectral resolution of 1 nm Achieve this spectral irradiance measurement with an
accuracy of better than 5 and with a long-term repeatability of 05yr Use the
solarstellar comparison technique to relate the solar irradiance to the ensembleaverage flux from a number of bright early-type stars (same stars used by the UARS
SOLSTICE program)
3 Make the first measurements of the visible and near IR solar irradiance with sufficient
precision for future climate studies Obtain daily measurements of solar spectral
irradiance between 03 and 2 microm with a spectral resolution of at least 130 an
accuracy of 003 and a long-term repeatability of better than 001yr
4 Improve the understanding of how and why solar irradiance varies estimate past and
future solar behavior and investigate climate responses
More information about SORCE can be found on
httplaspcoloradoedusorcesciencescience_opshtm
832019 Ew Afgewerkte Final
httpslidepdfcomreaderfullew-afgewerkte-final 4159
41
Appendix VI Wavelengths
httpeosweblarcnasagovEDDOCSWavelengths_for_Colorshtml
As you can see on the figure visible light situates in the centre of the wavelengths having not
the shortest nor the longest wavelengths Gamma rays have the shortest wavelength radioways the longest All sort of wavelengths are used for daily purpose like radio waves for
radio and TV and gamma rays for treatments
832019 Ew Afgewerkte Final
httpslidepdfcomreaderfullew-afgewerkte-final 4259
42
Appendix VII Absorption lines in the sunrsquos spectrum
Picture httpwwwsolarnavigatornetthe_sunhtmExplanation COMINS NF and KAUFMANN III WJ Discovering the universe eighth edition WHFreeman and Company New York 2008 p 109
This photo is called a spectrogram It contains the spectrum of the sun All the black lines are
absorption lines The amount of black lines is related to the amount of elements that the sun
is emitting From a spectrogram we can deduct a lot of things including their mass the
temperature of the surface the chemical composition of the sun rotation rates and much
more
832019 Ew Afgewerkte Final
httpslidepdfcomreaderfullew-afgewerkte-final 4359
832019 Ew Afgewerkte Final
httpslidepdfcomreaderfullew-afgewerkte-final 4459
44
Appendix IX Butterfly-diagram
httpspacesciencespacerefcomsslpadsolarimagesbflygif
A butterfly-diagram
In a butterfly-diagram we can find the sunspots with their latitude (y-axis) through the years(x-axis) As you can see the sunspots appear like lsquobutterfliesrsquo this was discovered in 1904 by
Edward Maunder (1851-1928 an English astronomer best remembered for his study of
sunspots and the solar magnetic cycle) Thatrsquos why this graph is also called Maunders
butterfly diagram
832019 Ew Afgewerkte Final
httpslidepdfcomreaderfullew-afgewerkte-final 4559
45
Appendix X The Wolf-numbers
httpsidcomabenews106sunspotnumberclarifiedpdf
The sunspot number clarified By Petra Vanlommel
Which kinds of daily International Sunspot Numbers (ISN) are currentlypublished by the SIDC
Three daily indices are currently published by the SIDCthe Estimated ISN (EISN)the Provisional ISN (PISN)the Definitive ISN (DISN)Although they are all based on the same type of observations ie visual sunspot counts as ameasure of solar activity they are obtained from different data sets by different processingmethods with different accuracies and they serve different purposes
In the ideal case the three numbers are equal but in practice it is inevitable that there aresmall differences Therefore It is useful to explain what each index actually means
What is the source of the Wolf number
Once per day observers worldwide communicate their measured Wolf number (= 10G + S)based on visual sunspot (S) and group (G) counts to the World Data Center for the SunspotIndex Presently this is done through a dedicated password-protected WEB form the Wolfinterface However some observers still use the old way of reporting their observations onpaper through regular mail This method slows down the final processing but for the sake ofcontinuity in the index it is important to keep these observers included as some of them
represent the longest individual datasetsThe observers give the exact observing time the observing conditions the total numbers(group count sunspot count and Wolf number) and optionally the NorthSouth and centralzone numbers The observers using the web interface can provide their results to the SIDCimmediately after each observation However some users prefer to insert their data as ablock creating some delay but this must be done at least once a month
The personal reduction coefficient K
A personal reduction coefficient K is calculated for each station It has values typically in therange 04 and 17 and leads to a normalized sunspot number K(10G+S) In other words theK factor rescales the raw sunspot counts of each observer to the ones of Rudolph Wolf the
astronomer who introduced the above Wolf formula thus simulating the same eyes sametelescope and same conditionsDuring the procedure for calculating the Provisional ISN the K factor of every station iscomputed for every observation that passes the elimination procedure Once a year apersonal K factor for every station and for every month of the previous year is calculated Ayearly mean K value per station is also computed
The estimated sunspot index
The Estimated ISN (EISN) is calculated and issued on a daily basis for the day of calculationand the day before Only the total EISN is calculated with no hemispheric index It is anautomated procedure and no manual intervention is done The EISN is meant as a quicktemporary and approximate index for real-time applications
832019 Ew Afgewerkte Final
httpslidepdfcomreaderfullew-afgewerkte-final 4659
46
We use the raw Wolf number from all observatories that have provided counts early in theday ie before 1230 UT Typically there is between 10 and 20 stations available Thecalculation of the EISN is based on a simple and straightforward statistical method The Wolfnumbers are multiplied with the yearly mean K factor (see paragraph about the personalreduction coefficient K) The EISN is a simple average of the K-scaled values after excludingany individual value that deviates abnormally from the other valuesOnce the Provisional ISN (PISN) is calculated after the end of a month the temporary EISNis dropped and replaced by the PISN
The provisional sunspot Index
The Provisional ISN (PISN) is calculated and issued on the first of every month Theoutcome is a daily total and hemispheric sunspot number for the entire elapsed month Anexample on the first of September we calculate the daily PISN for each day of August ThePISN is computed semi-automatically with as little manual intervention as possibleTo calculate the PISN values for the concerned month we use all Wolf numbers Typicallythere is data from around 65 stations available
The calculation of the PISN is based on an extensive statistical treatment This treatmentfilters out any abnormal daily observation or the complete data set from an erratic station(quality control) This prevents long-term drifts in the resulting index One of the key elementsderived from this processing is to update the K reduction coefficients for each station theevolution of each station is monitored for each day relative to the entire networkA subset of the contributing stations also provides hemispheric counts A similar process isapplied to the North and South counts to derive the hemispheric PISN There is an additionalconstraint the sum of the North and South ISN must match the total ISNThe PISN replaces the EISN And once the Definitive ISN (DISN) is calculated the DISNreplaces the PISN
The definitive sunspot index
The Definitive ISN is calculated and issued on a quarterly basis when we have collecteddata from all the contributing observatories This is the final index and it is appended to thehistorical sunspot index time series The same semi-automated treatment as for the PISN isnow applied to the full data set If the result agrees within 5 of the PISN value the PISN iskept and becomes definitive Otherwise the new calculated value replaces the PISN andbecomes the definitive ISNIt is only at this stage and only in peculiar situations that a manual verification by ourscientific staff is required For example this happens when the observed raw Wolf valuesfrom the whole network are clustered around two distinct values This special case can becaused by small short-lived isolated sunspots (lifetimes lt 24 hours) or by the appearance ordisappearance of a large group at the solar limb in the course of one UT dayThe DISN replaces the provisional and estimated International Sunspot Number
Handling very low activity levels
One of the situations requiring a human arbitration is associated with single small isolatedand short-lived sunspots This is most noticeable around the minimum of the solar activitycycle like the one occurring now in 2008 Due to the 24hour binning (observations aregrouped between 0hUT and 24hUT) and the variable ability of each observer to detect thesmallest sunspots we end up with some stations reporting one sunspot and others who didno see any sunspot Let us explain further No sunspot may mean that the sunspot waspresent but the observer was unable to see it because of poor observational conditions such
as weather a small telescope On the other hand it may also indicate that the sunspot hadactually vanished by that time while it was present earlier on the same day
832019 Ew Afgewerkte Final
httpslidepdfcomreaderfullew-afgewerkte-final 4759
47
Individual stations do not observe at exactly the same timeIn order to validate the existence of such a marginal reported sunspot a qualified SIDCscientist must then check the detailed chronology within that day and consider the overallobserver capability (value of K coefficient)In common practice the fact that a sunspot is reported by a significant group of observersleads to the inclusion of the sunspot on that date thus neglecting the no-sunspotobservationsThe rationale is multiple observations of a sunspot exclude the possibility that the reportedsunspot was an independent false detection So a sunspot was really present on that dayalthough it may have existed only for part of the day or it was small enough to be missed bypart of the observers with smaller instruments or imperfect atmospheric conditionsAlso keep in mind that the sunspot index is derived with a limited precision just like any otherindex If the monthly mean sunspot number is 0 or 05 you can definitely say that activitywas low
What index should be used
If you want to perform long-term investigations the definitive ISN series is definitely the mostsuitable However there is a delay of a few months So when investigating the last cycle andrecent evolution use the definitive numbers in combination with the provisional ISN to be upto date to the last month The provisional numbers are also used in models forecasting thesunspot number for the coming months Now if you need a proxy for solar activity in a modelthat runs in real-time then you may use the estimated ISNImprovements and rethinking of the processing method is an ongoing project We arecurrently developing an alternative program for calculating the PISN Of course long-termconsistency is vital Therefore a cross-analysis between the output from the old and newsoftware must be applied over an extended period
832019 Ew Afgewerkte Final
httpslidepdfcomreaderfullew-afgewerkte-final 4859
48
Above graphs show different kinds of the International Sunspot Number The left plot gives an overview from 1700 up to now from the yearly (black) and monthly smoothed Sunspot Number The graph in the right top corner shows the monthly and monthly smoothed sunspot number while the graph in the right bottom corner show the daily monthly smoothed monthly sunspot number For every the time range of investigation there is an appropriate sunspot number
832019 Ew Afgewerkte Final
httpslidepdfcomreaderfullew-afgewerkte-final 4959
49
Appendix XI Filaments and prominences
httpsohowwwnascomnasagovpickoftheweekold26feb2004
This is a picture taken by SOHO on 26 February 2004
832019 Ew Afgewerkte Final
httpslidepdfcomreaderfullew-afgewerkte-final 5059
50
Appendix XII The reconnection of magnetic loops
httpwwwioporgEJarticle0004-637X558287253575webpdfrequest-id=73e38daa-69ae-4e01-b9a6- b4bd0ba071dd
In (a) sunspot B and C have different polarity and move towards each other The twomagnetic loops will reconnect and form one big magnetic loop showed in (b) This will
happen to other magnetic loops too as can be seen in (c) When G en F are close enough they
will reconnect and so E en H will reconnect too It is possible that the magnetic field line is
trapped around another in this case AD The mass ejected from the sun will be trapped
between the magnetic field lines and form a solar prominence
832019 Ew Afgewerkte Final
httpslidepdfcomreaderfullew-afgewerkte-final 5159
832019 Ew Afgewerkte Final
httpslidepdfcomreaderfullew-afgewerkte-final 5259
52
httptheinvisibleagentwordpresscom20090117amazing-celestial-images
An group of active prominences
httpapodnasagovapodap051109html
httpwhassupinthemilkywayblogspotcom200903cloudy-planhtml
A picture taken by SOHO In the left corner you can see the prominence with twisted
magnetic field lines
832019 Ew Afgewerkte Final
httpslidepdfcomreaderfullew-afgewerkte-final 5359
53
Appendix XIV Polar crown
httpsciencenasagovheadlinesy200817sep_polarcrownhtm
Photograph of a polar crown taken on 13 June 1999 by the Meudon Observatory
832019 Ew Afgewerkte Final
httpslidepdfcomreaderfullew-afgewerkte-final 5459
54
Appendix XV Coronal holes
httpsunearthdaynasagov2007multimediagal_020php
The black segment is a huge coronal hole The bright parts are x-rays from sunspots
832019 Ew Afgewerkte Final
httpslidepdfcomreaderfullew-afgewerkte-final 5559
55
Appendix XVI Coronal mass ejection
httpzuserver2staruclacuk~idhapodap000309html
Picture of a CME taken by SOHO in February 2000
832019 Ew Afgewerkte Final
httpslidepdfcomreaderfullew-afgewerkte-final 5659
56
Bibliography
Books
BEATTY JK PETERSEN CC and CHAIKIN A The new solar system fourth edition
Cambridge University Press Cambridge 1999 421 p
COMINS NF and KAUFMANN III WJ Discovering the universe eighth edition WH
Freeman and Company New York 2008 535 p
DETHIER T Het zonnestelsel Standaard Uitgeverij 1992 415 p
GOLUB L and PASACHOFF JM Nearest star the surprising science of our sun Harvard
university press Harvard 2001 267 p
GREEN SF and JONES M H An introduction to the Sun and Stars The Open University
Cambridge 2004 373 p
HILL S and CARLOWITZ M The sun Abrams New York 2006 239 p
HOLMAN GD lsquoThe mysterious origins of solar flaresrsquo Scientific America April 2006 p
24-31 volume 294 number 4
JANSSENS J Zon en aarde een unieke relatie Garant Antwerpen 2003 254 p
KELLER H-U Van Supernovarsquos tot zwarte gaten Tirion Natuur AH Baarn 2003 169 p
LANG KR Sun earth and sky Springer Germany 1995 282 p
LILENSTEN J and BORNAREL J Sous les feux du soleil EDP Sciences Les Ulis Cedex
A 2001 247 p
832019 Ew Afgewerkte Final
httpslidepdfcomreaderfullew-afgewerkte-final 5759
57
Articles
CUYPERS J and others lsquoLa rechercheacute en heacuteliophysique en Belgiquersquo Space connection
October 2007 20 p
DE KEYSER J lsquoDe magnetopauzersquo Heelal maart 1998 p 66-73
JANSSENS J lsquoHet maximum van de 23ste zonnevlekkencyclus (I)rsquo Heelal Oktober 1998 p
256-263
JANSSENS J lsquohet maximum van de 23ste zonnenvlekkencyclus (II)rsquo Heelal November
1998 p 284-290
JANSSENS J lsquoZonnefakkelsrsquo Heelal Oktober 1994 p 256-261
SMITS F lsquoDe coronarsquo Heelal Februari 1999 p 40-42
SMITS F lsquoProtuberanzenrsquo Heelal Juli 1991 p 182-185
VAN DEN BERGHE S lsquoHet Zeemaneffectrsquo Heelal September 1998 p 228-231
832019 Ew Afgewerkte Final
httpslidepdfcomreaderfullew-afgewerkte-final 5859
58
Webography
BOEN B Birth of a coronal mass ejection Internet
(httpwwwnasagovmission_pagessolar-b solar_005html) 290408
BRAEUNIG R A Glossary Internet (httpwwwbraeunigusspaceglossaryhtm) 2006
CORDIS Researchers reveal why Suns atmosphere is hotter than its surface Internet
(httpcordiseuropaeusearchindexcfmfuseaction=newsdocumentampN_LANG=ENampN_R
CN=30598amppid=0ampq=87F36474805A6BEC0B89404F72D0351Famptype=sim) 20032009
DAY C Alfveacuten waves may heat the Sunrsquos corona Internet
(httpblogsphysicstodayorgupdate200903 alfven-waves-may-heat-the-sunshtml)
310309
ELLERMAN F Solar prominences Internet (httparticlesadsabsharvardedufull
1928ASPL173E 0000074000html) (03042009)
ENCYCLODPEDIA OF SCIENCE Corona hole Internet
(httpwwwdaviddarlinginfoencyclopediaC coronal_holehtml) (04042009)
HATHAWAY D H The sunspot cycle Internet
(httpspacesciencespacerefcomsslpadsolarsunspots htm) 04012000
JANSSENS J The case of the missing solar cycle (published in lsquoheelalrsquo January 2008)
Internet (httpuserstelenetbejjanssensMSCwebEngpdf)
KNISELY D Solar prominences Internet
(httpwwwicstarscomHTMLSolarSectionHAlphaOBSERVINGTHESUNHAlpha3html)
(03042009)
KOPANSKI J Atom Internet (httpknolgooglecomkjan-
kopanskiatom1amrwrct7rvi27) 060209
MARTENS PC and ZWAAN C Origin and evolution of filament-prominence systems
Internet (http wwwioporgEJarticle0004-637X558287253575webpdfrequest-
id=73e38daa-69ae-4e01-b9a6-b4bd0ba071dd) 092001
NASA The corona Internet (httpsolarsciencemsfcnasagovcoronashtml) 180107
NASA The heliosphere Internet (httpheliosgsfcnasagovheliosphhtml) 20012009
OFFICIAL SITE OF STONEHENGE About Stonehenge Internet
(httpwwwstonehengecouk) (03022009)
OTTERSDORF M Astronomy On the sunspot cycle Internet
(httpuserszoominternetnet~matto MCASsunspot_cyclehtmZeemaneffect) 031103
PARIAT E and SCHMIEDER B Magnetic flux emergence Internet(httpwwwscholarpediaorgarticleMagnetic_field_emergence) 18042008
832019 Ew Afgewerkte Final
httpslidepdfcomreaderfullew-afgewerkte-final 5959
59
PRIEST E R Dynamics and Structure of Quiescent Solar Prominences Internet
(httpbooksgooglebe booksid=h599q3jz1w4Campdq=quiescent+prominencesampprintsec=fro
ntcoverampsource=blampots=58b79Qeyabampsig=1eklQ-
WszOIebZZaq7fq7gm6bxAamphl=nlampei=urPtSe7ZCo61-
Qa166jHDwampsa=Xampoi=book_resultampct=result ampresnum=3PPA6M2) 1989
RUSSELL R Rotation of the sun Internet
(httpwwwwindowsucaredutourlink=sunSolar_interior
Sun_layersdifferential_rotationhtml) 16082005
RUSSELL R Sunspots and magnetic fields Internet
(httpwwwwindowsucaredutourlink=sunatmospheresunspot_magnetismhtmlampedu=hig
h) 060908
UNIVERSITY OF GLASGOW Bibliography of Peter Sweet Internet
(httpwwwuniversitystoryglaacuk biographyid=WH2144amptype=P) (10042009)
WIKIPEDIA Orbiting Solar Observatory Internet
(httpenwikipediaorgwikiOrbiting_Solar_Observatory) 24012009
WINDOWS TEAM Maunderrsquos Butterfly Diagram Internet
(httpwwwwindowsucaredutourlink=sun activitybutterflyhtml) 2000
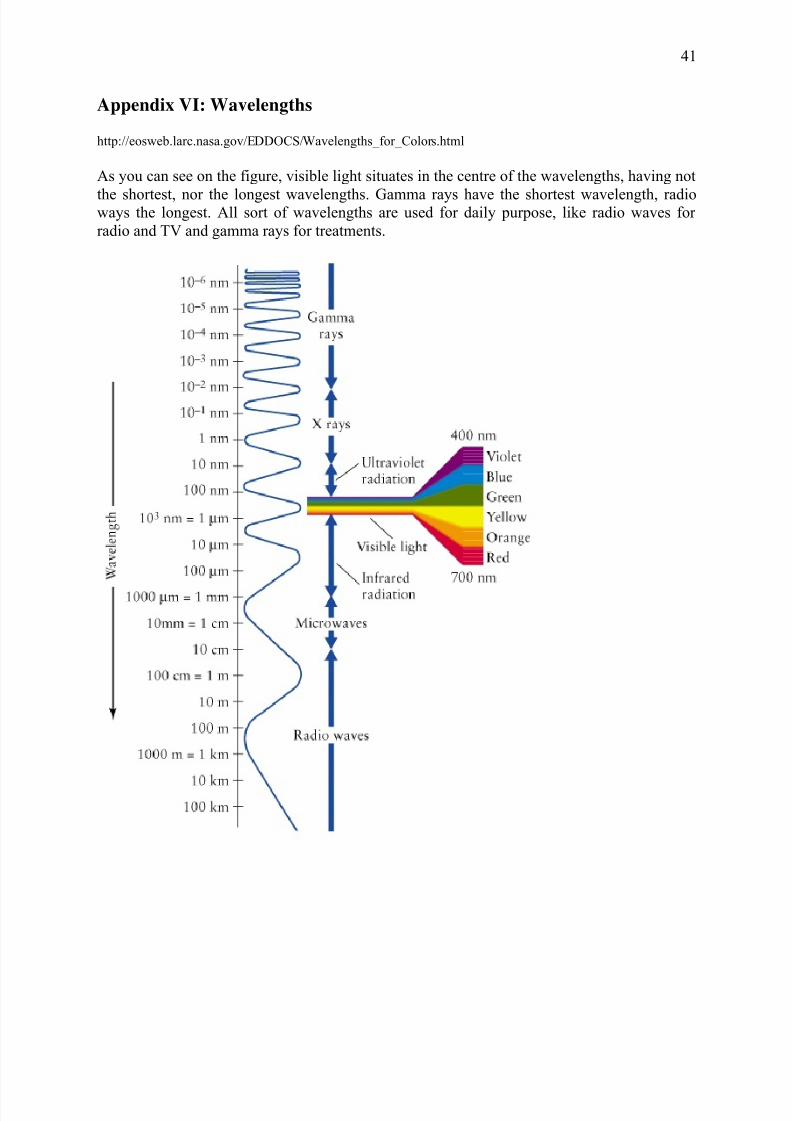
832019 Ew Afgewerkte Final
httpslidepdfcomreaderfullew-afgewerkte-final 4159
41
Appendix VI Wavelengths
httpeosweblarcnasagovEDDOCSWavelengths_for_Colorshtml
As you can see on the figure visible light situates in the centre of the wavelengths having not
the shortest nor the longest wavelengths Gamma rays have the shortest wavelength radioways the longest All sort of wavelengths are used for daily purpose like radio waves for
radio and TV and gamma rays for treatments
832019 Ew Afgewerkte Final
httpslidepdfcomreaderfullew-afgewerkte-final 4259
42
Appendix VII Absorption lines in the sunrsquos spectrum
Picture httpwwwsolarnavigatornetthe_sunhtmExplanation COMINS NF and KAUFMANN III WJ Discovering the universe eighth edition WHFreeman and Company New York 2008 p 109
This photo is called a spectrogram It contains the spectrum of the sun All the black lines are
absorption lines The amount of black lines is related to the amount of elements that the sun
is emitting From a spectrogram we can deduct a lot of things including their mass the
temperature of the surface the chemical composition of the sun rotation rates and much
more
832019 Ew Afgewerkte Final
httpslidepdfcomreaderfullew-afgewerkte-final 4359
832019 Ew Afgewerkte Final
httpslidepdfcomreaderfullew-afgewerkte-final 4459
44
Appendix IX Butterfly-diagram
httpspacesciencespacerefcomsslpadsolarimagesbflygif
A butterfly-diagram
In a butterfly-diagram we can find the sunspots with their latitude (y-axis) through the years(x-axis) As you can see the sunspots appear like lsquobutterfliesrsquo this was discovered in 1904 by
Edward Maunder (1851-1928 an English astronomer best remembered for his study of
sunspots and the solar magnetic cycle) Thatrsquos why this graph is also called Maunders
butterfly diagram
832019 Ew Afgewerkte Final
httpslidepdfcomreaderfullew-afgewerkte-final 4559
45
Appendix X The Wolf-numbers
httpsidcomabenews106sunspotnumberclarifiedpdf
The sunspot number clarified By Petra Vanlommel
Which kinds of daily International Sunspot Numbers (ISN) are currentlypublished by the SIDC
Three daily indices are currently published by the SIDCthe Estimated ISN (EISN)the Provisional ISN (PISN)the Definitive ISN (DISN)Although they are all based on the same type of observations ie visual sunspot counts as ameasure of solar activity they are obtained from different data sets by different processingmethods with different accuracies and they serve different purposes
In the ideal case the three numbers are equal but in practice it is inevitable that there aresmall differences Therefore It is useful to explain what each index actually means
What is the source of the Wolf number
Once per day observers worldwide communicate their measured Wolf number (= 10G + S)based on visual sunspot (S) and group (G) counts to the World Data Center for the SunspotIndex Presently this is done through a dedicated password-protected WEB form the Wolfinterface However some observers still use the old way of reporting their observations onpaper through regular mail This method slows down the final processing but for the sake ofcontinuity in the index it is important to keep these observers included as some of them
represent the longest individual datasetsThe observers give the exact observing time the observing conditions the total numbers(group count sunspot count and Wolf number) and optionally the NorthSouth and centralzone numbers The observers using the web interface can provide their results to the SIDCimmediately after each observation However some users prefer to insert their data as ablock creating some delay but this must be done at least once a month
The personal reduction coefficient K
A personal reduction coefficient K is calculated for each station It has values typically in therange 04 and 17 and leads to a normalized sunspot number K(10G+S) In other words theK factor rescales the raw sunspot counts of each observer to the ones of Rudolph Wolf the
astronomer who introduced the above Wolf formula thus simulating the same eyes sametelescope and same conditionsDuring the procedure for calculating the Provisional ISN the K factor of every station iscomputed for every observation that passes the elimination procedure Once a year apersonal K factor for every station and for every month of the previous year is calculated Ayearly mean K value per station is also computed
The estimated sunspot index
The Estimated ISN (EISN) is calculated and issued on a daily basis for the day of calculationand the day before Only the total EISN is calculated with no hemispheric index It is anautomated procedure and no manual intervention is done The EISN is meant as a quicktemporary and approximate index for real-time applications
832019 Ew Afgewerkte Final
httpslidepdfcomreaderfullew-afgewerkte-final 4659
46
We use the raw Wolf number from all observatories that have provided counts early in theday ie before 1230 UT Typically there is between 10 and 20 stations available Thecalculation of the EISN is based on a simple and straightforward statistical method The Wolfnumbers are multiplied with the yearly mean K factor (see paragraph about the personalreduction coefficient K) The EISN is a simple average of the K-scaled values after excludingany individual value that deviates abnormally from the other valuesOnce the Provisional ISN (PISN) is calculated after the end of a month the temporary EISNis dropped and replaced by the PISN
The provisional sunspot Index
The Provisional ISN (PISN) is calculated and issued on the first of every month Theoutcome is a daily total and hemispheric sunspot number for the entire elapsed month Anexample on the first of September we calculate the daily PISN for each day of August ThePISN is computed semi-automatically with as little manual intervention as possibleTo calculate the PISN values for the concerned month we use all Wolf numbers Typicallythere is data from around 65 stations available
The calculation of the PISN is based on an extensive statistical treatment This treatmentfilters out any abnormal daily observation or the complete data set from an erratic station(quality control) This prevents long-term drifts in the resulting index One of the key elementsderived from this processing is to update the K reduction coefficients for each station theevolution of each station is monitored for each day relative to the entire networkA subset of the contributing stations also provides hemispheric counts A similar process isapplied to the North and South counts to derive the hemispheric PISN There is an additionalconstraint the sum of the North and South ISN must match the total ISNThe PISN replaces the EISN And once the Definitive ISN (DISN) is calculated the DISNreplaces the PISN
The definitive sunspot index
The Definitive ISN is calculated and issued on a quarterly basis when we have collecteddata from all the contributing observatories This is the final index and it is appended to thehistorical sunspot index time series The same semi-automated treatment as for the PISN isnow applied to the full data set If the result agrees within 5 of the PISN value the PISN iskept and becomes definitive Otherwise the new calculated value replaces the PISN andbecomes the definitive ISNIt is only at this stage and only in peculiar situations that a manual verification by ourscientific staff is required For example this happens when the observed raw Wolf valuesfrom the whole network are clustered around two distinct values This special case can becaused by small short-lived isolated sunspots (lifetimes lt 24 hours) or by the appearance ordisappearance of a large group at the solar limb in the course of one UT dayThe DISN replaces the provisional and estimated International Sunspot Number
Handling very low activity levels
One of the situations requiring a human arbitration is associated with single small isolatedand short-lived sunspots This is most noticeable around the minimum of the solar activitycycle like the one occurring now in 2008 Due to the 24hour binning (observations aregrouped between 0hUT and 24hUT) and the variable ability of each observer to detect thesmallest sunspots we end up with some stations reporting one sunspot and others who didno see any sunspot Let us explain further No sunspot may mean that the sunspot waspresent but the observer was unable to see it because of poor observational conditions such
as weather a small telescope On the other hand it may also indicate that the sunspot hadactually vanished by that time while it was present earlier on the same day
832019 Ew Afgewerkte Final
httpslidepdfcomreaderfullew-afgewerkte-final 4759
47
Individual stations do not observe at exactly the same timeIn order to validate the existence of such a marginal reported sunspot a qualified SIDCscientist must then check the detailed chronology within that day and consider the overallobserver capability (value of K coefficient)In common practice the fact that a sunspot is reported by a significant group of observersleads to the inclusion of the sunspot on that date thus neglecting the no-sunspotobservationsThe rationale is multiple observations of a sunspot exclude the possibility that the reportedsunspot was an independent false detection So a sunspot was really present on that dayalthough it may have existed only for part of the day or it was small enough to be missed bypart of the observers with smaller instruments or imperfect atmospheric conditionsAlso keep in mind that the sunspot index is derived with a limited precision just like any otherindex If the monthly mean sunspot number is 0 or 05 you can definitely say that activitywas low
What index should be used
If you want to perform long-term investigations the definitive ISN series is definitely the mostsuitable However there is a delay of a few months So when investigating the last cycle andrecent evolution use the definitive numbers in combination with the provisional ISN to be upto date to the last month The provisional numbers are also used in models forecasting thesunspot number for the coming months Now if you need a proxy for solar activity in a modelthat runs in real-time then you may use the estimated ISNImprovements and rethinking of the processing method is an ongoing project We arecurrently developing an alternative program for calculating the PISN Of course long-termconsistency is vital Therefore a cross-analysis between the output from the old and newsoftware must be applied over an extended period
832019 Ew Afgewerkte Final
httpslidepdfcomreaderfullew-afgewerkte-final 4859
48
Above graphs show different kinds of the International Sunspot Number The left plot gives an overview from 1700 up to now from the yearly (black) and monthly smoothed Sunspot Number The graph in the right top corner shows the monthly and monthly smoothed sunspot number while the graph in the right bottom corner show the daily monthly smoothed monthly sunspot number For every the time range of investigation there is an appropriate sunspot number
832019 Ew Afgewerkte Final
httpslidepdfcomreaderfullew-afgewerkte-final 4959
49
Appendix XI Filaments and prominences
httpsohowwwnascomnasagovpickoftheweekold26feb2004
This is a picture taken by SOHO on 26 February 2004
832019 Ew Afgewerkte Final
httpslidepdfcomreaderfullew-afgewerkte-final 5059
50
Appendix XII The reconnection of magnetic loops
httpwwwioporgEJarticle0004-637X558287253575webpdfrequest-id=73e38daa-69ae-4e01-b9a6- b4bd0ba071dd
In (a) sunspot B and C have different polarity and move towards each other The twomagnetic loops will reconnect and form one big magnetic loop showed in (b) This will
happen to other magnetic loops too as can be seen in (c) When G en F are close enough they
will reconnect and so E en H will reconnect too It is possible that the magnetic field line is
trapped around another in this case AD The mass ejected from the sun will be trapped
between the magnetic field lines and form a solar prominence
832019 Ew Afgewerkte Final
httpslidepdfcomreaderfullew-afgewerkte-final 5159
832019 Ew Afgewerkte Final
httpslidepdfcomreaderfullew-afgewerkte-final 5259
52
httptheinvisibleagentwordpresscom20090117amazing-celestial-images
An group of active prominences
httpapodnasagovapodap051109html
httpwhassupinthemilkywayblogspotcom200903cloudy-planhtml
A picture taken by SOHO In the left corner you can see the prominence with twisted
magnetic field lines
832019 Ew Afgewerkte Final
httpslidepdfcomreaderfullew-afgewerkte-final 5359
53
Appendix XIV Polar crown
httpsciencenasagovheadlinesy200817sep_polarcrownhtm
Photograph of a polar crown taken on 13 June 1999 by the Meudon Observatory
832019 Ew Afgewerkte Final
httpslidepdfcomreaderfullew-afgewerkte-final 5459
54
Appendix XV Coronal holes
httpsunearthdaynasagov2007multimediagal_020php
The black segment is a huge coronal hole The bright parts are x-rays from sunspots
832019 Ew Afgewerkte Final
httpslidepdfcomreaderfullew-afgewerkte-final 5559
55
Appendix XVI Coronal mass ejection
httpzuserver2staruclacuk~idhapodap000309html
Picture of a CME taken by SOHO in February 2000
832019 Ew Afgewerkte Final
httpslidepdfcomreaderfullew-afgewerkte-final 5659
56
Bibliography
Books
BEATTY JK PETERSEN CC and CHAIKIN A The new solar system fourth edition
Cambridge University Press Cambridge 1999 421 p
COMINS NF and KAUFMANN III WJ Discovering the universe eighth edition WH
Freeman and Company New York 2008 535 p
DETHIER T Het zonnestelsel Standaard Uitgeverij 1992 415 p
GOLUB L and PASACHOFF JM Nearest star the surprising science of our sun Harvard
university press Harvard 2001 267 p
GREEN SF and JONES M H An introduction to the Sun and Stars The Open University
Cambridge 2004 373 p
HILL S and CARLOWITZ M The sun Abrams New York 2006 239 p
HOLMAN GD lsquoThe mysterious origins of solar flaresrsquo Scientific America April 2006 p
24-31 volume 294 number 4
JANSSENS J Zon en aarde een unieke relatie Garant Antwerpen 2003 254 p
KELLER H-U Van Supernovarsquos tot zwarte gaten Tirion Natuur AH Baarn 2003 169 p
LANG KR Sun earth and sky Springer Germany 1995 282 p
LILENSTEN J and BORNAREL J Sous les feux du soleil EDP Sciences Les Ulis Cedex
A 2001 247 p
832019 Ew Afgewerkte Final
httpslidepdfcomreaderfullew-afgewerkte-final 5759
57
Articles
CUYPERS J and others lsquoLa rechercheacute en heacuteliophysique en Belgiquersquo Space connection
October 2007 20 p
DE KEYSER J lsquoDe magnetopauzersquo Heelal maart 1998 p 66-73
JANSSENS J lsquoHet maximum van de 23ste zonnevlekkencyclus (I)rsquo Heelal Oktober 1998 p
256-263
JANSSENS J lsquohet maximum van de 23ste zonnenvlekkencyclus (II)rsquo Heelal November
1998 p 284-290
JANSSENS J lsquoZonnefakkelsrsquo Heelal Oktober 1994 p 256-261
SMITS F lsquoDe coronarsquo Heelal Februari 1999 p 40-42
SMITS F lsquoProtuberanzenrsquo Heelal Juli 1991 p 182-185
VAN DEN BERGHE S lsquoHet Zeemaneffectrsquo Heelal September 1998 p 228-231
832019 Ew Afgewerkte Final
httpslidepdfcomreaderfullew-afgewerkte-final 5859
58
Webography
BOEN B Birth of a coronal mass ejection Internet
(httpwwwnasagovmission_pagessolar-b solar_005html) 290408
BRAEUNIG R A Glossary Internet (httpwwwbraeunigusspaceglossaryhtm) 2006
CORDIS Researchers reveal why Suns atmosphere is hotter than its surface Internet
(httpcordiseuropaeusearchindexcfmfuseaction=newsdocumentampN_LANG=ENampN_R
CN=30598amppid=0ampq=87F36474805A6BEC0B89404F72D0351Famptype=sim) 20032009
DAY C Alfveacuten waves may heat the Sunrsquos corona Internet
(httpblogsphysicstodayorgupdate200903 alfven-waves-may-heat-the-sunshtml)
310309
ELLERMAN F Solar prominences Internet (httparticlesadsabsharvardedufull
1928ASPL173E 0000074000html) (03042009)
ENCYCLODPEDIA OF SCIENCE Corona hole Internet
(httpwwwdaviddarlinginfoencyclopediaC coronal_holehtml) (04042009)
HATHAWAY D H The sunspot cycle Internet
(httpspacesciencespacerefcomsslpadsolarsunspots htm) 04012000
JANSSENS J The case of the missing solar cycle (published in lsquoheelalrsquo January 2008)
Internet (httpuserstelenetbejjanssensMSCwebEngpdf)
KNISELY D Solar prominences Internet
(httpwwwicstarscomHTMLSolarSectionHAlphaOBSERVINGTHESUNHAlpha3html)
(03042009)
KOPANSKI J Atom Internet (httpknolgooglecomkjan-
kopanskiatom1amrwrct7rvi27) 060209
MARTENS PC and ZWAAN C Origin and evolution of filament-prominence systems
Internet (http wwwioporgEJarticle0004-637X558287253575webpdfrequest-
id=73e38daa-69ae-4e01-b9a6-b4bd0ba071dd) 092001
NASA The corona Internet (httpsolarsciencemsfcnasagovcoronashtml) 180107
NASA The heliosphere Internet (httpheliosgsfcnasagovheliosphhtml) 20012009
OFFICIAL SITE OF STONEHENGE About Stonehenge Internet
(httpwwwstonehengecouk) (03022009)
OTTERSDORF M Astronomy On the sunspot cycle Internet
(httpuserszoominternetnet~matto MCASsunspot_cyclehtmZeemaneffect) 031103
PARIAT E and SCHMIEDER B Magnetic flux emergence Internet(httpwwwscholarpediaorgarticleMagnetic_field_emergence) 18042008
832019 Ew Afgewerkte Final
httpslidepdfcomreaderfullew-afgewerkte-final 5959
59
PRIEST E R Dynamics and Structure of Quiescent Solar Prominences Internet
(httpbooksgooglebe booksid=h599q3jz1w4Campdq=quiescent+prominencesampprintsec=fro
ntcoverampsource=blampots=58b79Qeyabampsig=1eklQ-
WszOIebZZaq7fq7gm6bxAamphl=nlampei=urPtSe7ZCo61-
Qa166jHDwampsa=Xampoi=book_resultampct=result ampresnum=3PPA6M2) 1989
RUSSELL R Rotation of the sun Internet
(httpwwwwindowsucaredutourlink=sunSolar_interior
Sun_layersdifferential_rotationhtml) 16082005
RUSSELL R Sunspots and magnetic fields Internet
(httpwwwwindowsucaredutourlink=sunatmospheresunspot_magnetismhtmlampedu=hig
h) 060908
UNIVERSITY OF GLASGOW Bibliography of Peter Sweet Internet
(httpwwwuniversitystoryglaacuk biographyid=WH2144amptype=P) (10042009)
WIKIPEDIA Orbiting Solar Observatory Internet
(httpenwikipediaorgwikiOrbiting_Solar_Observatory) 24012009
WINDOWS TEAM Maunderrsquos Butterfly Diagram Internet
(httpwwwwindowsucaredutourlink=sun activitybutterflyhtml) 2000
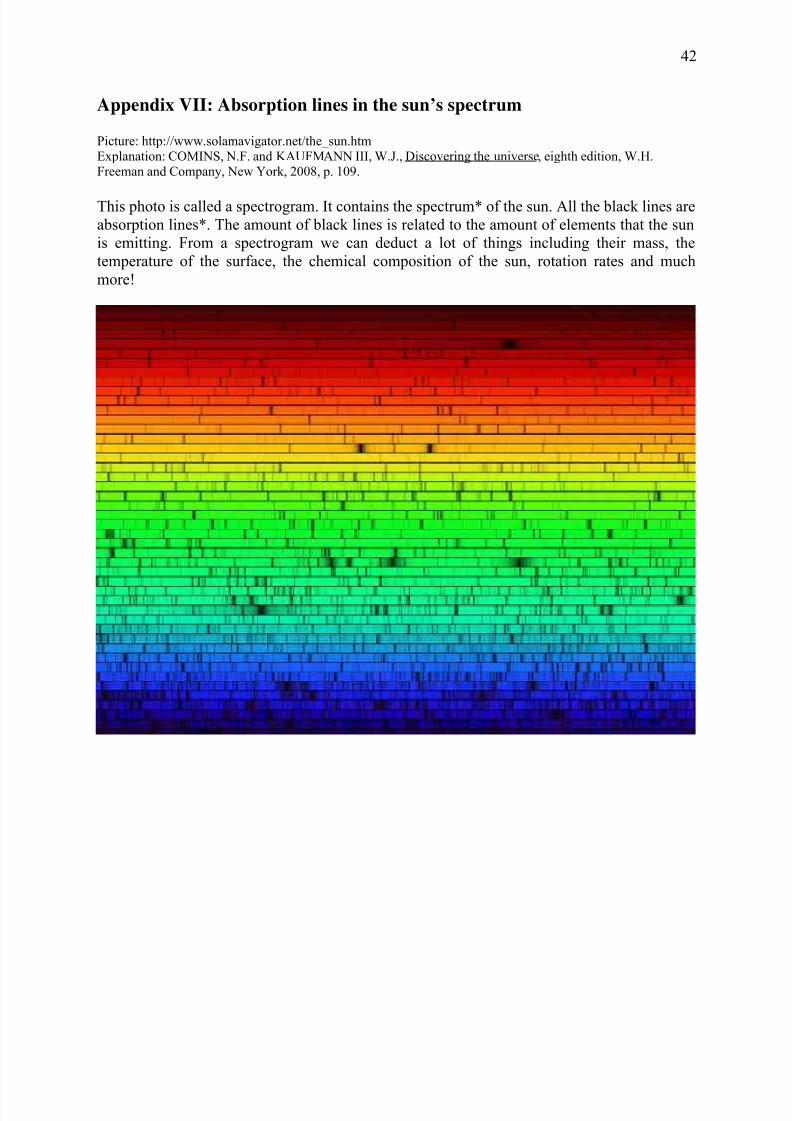
832019 Ew Afgewerkte Final
httpslidepdfcomreaderfullew-afgewerkte-final 4259
42
Appendix VII Absorption lines in the sunrsquos spectrum
Picture httpwwwsolarnavigatornetthe_sunhtmExplanation COMINS NF and KAUFMANN III WJ Discovering the universe eighth edition WHFreeman and Company New York 2008 p 109
This photo is called a spectrogram It contains the spectrum of the sun All the black lines are
absorption lines The amount of black lines is related to the amount of elements that the sun
is emitting From a spectrogram we can deduct a lot of things including their mass the
temperature of the surface the chemical composition of the sun rotation rates and much
more
832019 Ew Afgewerkte Final
httpslidepdfcomreaderfullew-afgewerkte-final 4359
832019 Ew Afgewerkte Final
httpslidepdfcomreaderfullew-afgewerkte-final 4459
44
Appendix IX Butterfly-diagram
httpspacesciencespacerefcomsslpadsolarimagesbflygif
A butterfly-diagram
In a butterfly-diagram we can find the sunspots with their latitude (y-axis) through the years(x-axis) As you can see the sunspots appear like lsquobutterfliesrsquo this was discovered in 1904 by
Edward Maunder (1851-1928 an English astronomer best remembered for his study of
sunspots and the solar magnetic cycle) Thatrsquos why this graph is also called Maunders
butterfly diagram
832019 Ew Afgewerkte Final
httpslidepdfcomreaderfullew-afgewerkte-final 4559
45
Appendix X The Wolf-numbers
httpsidcomabenews106sunspotnumberclarifiedpdf
The sunspot number clarified By Petra Vanlommel
Which kinds of daily International Sunspot Numbers (ISN) are currentlypublished by the SIDC
Three daily indices are currently published by the SIDCthe Estimated ISN (EISN)the Provisional ISN (PISN)the Definitive ISN (DISN)Although they are all based on the same type of observations ie visual sunspot counts as ameasure of solar activity they are obtained from different data sets by different processingmethods with different accuracies and they serve different purposes
In the ideal case the three numbers are equal but in practice it is inevitable that there aresmall differences Therefore It is useful to explain what each index actually means
What is the source of the Wolf number
Once per day observers worldwide communicate their measured Wolf number (= 10G + S)based on visual sunspot (S) and group (G) counts to the World Data Center for the SunspotIndex Presently this is done through a dedicated password-protected WEB form the Wolfinterface However some observers still use the old way of reporting their observations onpaper through regular mail This method slows down the final processing but for the sake ofcontinuity in the index it is important to keep these observers included as some of them
represent the longest individual datasetsThe observers give the exact observing time the observing conditions the total numbers(group count sunspot count and Wolf number) and optionally the NorthSouth and centralzone numbers The observers using the web interface can provide their results to the SIDCimmediately after each observation However some users prefer to insert their data as ablock creating some delay but this must be done at least once a month
The personal reduction coefficient K
A personal reduction coefficient K is calculated for each station It has values typically in therange 04 and 17 and leads to a normalized sunspot number K(10G+S) In other words theK factor rescales the raw sunspot counts of each observer to the ones of Rudolph Wolf the
astronomer who introduced the above Wolf formula thus simulating the same eyes sametelescope and same conditionsDuring the procedure for calculating the Provisional ISN the K factor of every station iscomputed for every observation that passes the elimination procedure Once a year apersonal K factor for every station and for every month of the previous year is calculated Ayearly mean K value per station is also computed
The estimated sunspot index
The Estimated ISN (EISN) is calculated and issued on a daily basis for the day of calculationand the day before Only the total EISN is calculated with no hemispheric index It is anautomated procedure and no manual intervention is done The EISN is meant as a quicktemporary and approximate index for real-time applications
832019 Ew Afgewerkte Final
httpslidepdfcomreaderfullew-afgewerkte-final 4659
46
We use the raw Wolf number from all observatories that have provided counts early in theday ie before 1230 UT Typically there is between 10 and 20 stations available Thecalculation of the EISN is based on a simple and straightforward statistical method The Wolfnumbers are multiplied with the yearly mean K factor (see paragraph about the personalreduction coefficient K) The EISN is a simple average of the K-scaled values after excludingany individual value that deviates abnormally from the other valuesOnce the Provisional ISN (PISN) is calculated after the end of a month the temporary EISNis dropped and replaced by the PISN
The provisional sunspot Index
The Provisional ISN (PISN) is calculated and issued on the first of every month Theoutcome is a daily total and hemispheric sunspot number for the entire elapsed month Anexample on the first of September we calculate the daily PISN for each day of August ThePISN is computed semi-automatically with as little manual intervention as possibleTo calculate the PISN values for the concerned month we use all Wolf numbers Typicallythere is data from around 65 stations available
The calculation of the PISN is based on an extensive statistical treatment This treatmentfilters out any abnormal daily observation or the complete data set from an erratic station(quality control) This prevents long-term drifts in the resulting index One of the key elementsderived from this processing is to update the K reduction coefficients for each station theevolution of each station is monitored for each day relative to the entire networkA subset of the contributing stations also provides hemispheric counts A similar process isapplied to the North and South counts to derive the hemispheric PISN There is an additionalconstraint the sum of the North and South ISN must match the total ISNThe PISN replaces the EISN And once the Definitive ISN (DISN) is calculated the DISNreplaces the PISN
The definitive sunspot index
The Definitive ISN is calculated and issued on a quarterly basis when we have collecteddata from all the contributing observatories This is the final index and it is appended to thehistorical sunspot index time series The same semi-automated treatment as for the PISN isnow applied to the full data set If the result agrees within 5 of the PISN value the PISN iskept and becomes definitive Otherwise the new calculated value replaces the PISN andbecomes the definitive ISNIt is only at this stage and only in peculiar situations that a manual verification by ourscientific staff is required For example this happens when the observed raw Wolf valuesfrom the whole network are clustered around two distinct values This special case can becaused by small short-lived isolated sunspots (lifetimes lt 24 hours) or by the appearance ordisappearance of a large group at the solar limb in the course of one UT dayThe DISN replaces the provisional and estimated International Sunspot Number
Handling very low activity levels
One of the situations requiring a human arbitration is associated with single small isolatedand short-lived sunspots This is most noticeable around the minimum of the solar activitycycle like the one occurring now in 2008 Due to the 24hour binning (observations aregrouped between 0hUT and 24hUT) and the variable ability of each observer to detect thesmallest sunspots we end up with some stations reporting one sunspot and others who didno see any sunspot Let us explain further No sunspot may mean that the sunspot waspresent but the observer was unable to see it because of poor observational conditions such
as weather a small telescope On the other hand it may also indicate that the sunspot hadactually vanished by that time while it was present earlier on the same day
832019 Ew Afgewerkte Final
httpslidepdfcomreaderfullew-afgewerkte-final 4759
47
Individual stations do not observe at exactly the same timeIn order to validate the existence of such a marginal reported sunspot a qualified SIDCscientist must then check the detailed chronology within that day and consider the overallobserver capability (value of K coefficient)In common practice the fact that a sunspot is reported by a significant group of observersleads to the inclusion of the sunspot on that date thus neglecting the no-sunspotobservationsThe rationale is multiple observations of a sunspot exclude the possibility that the reportedsunspot was an independent false detection So a sunspot was really present on that dayalthough it may have existed only for part of the day or it was small enough to be missed bypart of the observers with smaller instruments or imperfect atmospheric conditionsAlso keep in mind that the sunspot index is derived with a limited precision just like any otherindex If the monthly mean sunspot number is 0 or 05 you can definitely say that activitywas low
What index should be used
If you want to perform long-term investigations the definitive ISN series is definitely the mostsuitable However there is a delay of a few months So when investigating the last cycle andrecent evolution use the definitive numbers in combination with the provisional ISN to be upto date to the last month The provisional numbers are also used in models forecasting thesunspot number for the coming months Now if you need a proxy for solar activity in a modelthat runs in real-time then you may use the estimated ISNImprovements and rethinking of the processing method is an ongoing project We arecurrently developing an alternative program for calculating the PISN Of course long-termconsistency is vital Therefore a cross-analysis between the output from the old and newsoftware must be applied over an extended period
832019 Ew Afgewerkte Final
httpslidepdfcomreaderfullew-afgewerkte-final 4859
48
Above graphs show different kinds of the International Sunspot Number The left plot gives an overview from 1700 up to now from the yearly (black) and monthly smoothed Sunspot Number The graph in the right top corner shows the monthly and monthly smoothed sunspot number while the graph in the right bottom corner show the daily monthly smoothed monthly sunspot number For every the time range of investigation there is an appropriate sunspot number
832019 Ew Afgewerkte Final
httpslidepdfcomreaderfullew-afgewerkte-final 4959
49
Appendix XI Filaments and prominences
httpsohowwwnascomnasagovpickoftheweekold26feb2004
This is a picture taken by SOHO on 26 February 2004
832019 Ew Afgewerkte Final
httpslidepdfcomreaderfullew-afgewerkte-final 5059
50
Appendix XII The reconnection of magnetic loops
httpwwwioporgEJarticle0004-637X558287253575webpdfrequest-id=73e38daa-69ae-4e01-b9a6- b4bd0ba071dd
In (a) sunspot B and C have different polarity and move towards each other The twomagnetic loops will reconnect and form one big magnetic loop showed in (b) This will
happen to other magnetic loops too as can be seen in (c) When G en F are close enough they
will reconnect and so E en H will reconnect too It is possible that the magnetic field line is
trapped around another in this case AD The mass ejected from the sun will be trapped
between the magnetic field lines and form a solar prominence
832019 Ew Afgewerkte Final
httpslidepdfcomreaderfullew-afgewerkte-final 5159
832019 Ew Afgewerkte Final
httpslidepdfcomreaderfullew-afgewerkte-final 5259
52
httptheinvisibleagentwordpresscom20090117amazing-celestial-images
An group of active prominences
httpapodnasagovapodap051109html
httpwhassupinthemilkywayblogspotcom200903cloudy-planhtml
A picture taken by SOHO In the left corner you can see the prominence with twisted
magnetic field lines
832019 Ew Afgewerkte Final
httpslidepdfcomreaderfullew-afgewerkte-final 5359
53
Appendix XIV Polar crown
httpsciencenasagovheadlinesy200817sep_polarcrownhtm
Photograph of a polar crown taken on 13 June 1999 by the Meudon Observatory
832019 Ew Afgewerkte Final
httpslidepdfcomreaderfullew-afgewerkte-final 5459
54
Appendix XV Coronal holes
httpsunearthdaynasagov2007multimediagal_020php
The black segment is a huge coronal hole The bright parts are x-rays from sunspots
832019 Ew Afgewerkte Final
httpslidepdfcomreaderfullew-afgewerkte-final 5559
55
Appendix XVI Coronal mass ejection
httpzuserver2staruclacuk~idhapodap000309html
Picture of a CME taken by SOHO in February 2000
832019 Ew Afgewerkte Final
httpslidepdfcomreaderfullew-afgewerkte-final 5659
56
Bibliography
Books
BEATTY JK PETERSEN CC and CHAIKIN A The new solar system fourth edition
Cambridge University Press Cambridge 1999 421 p
COMINS NF and KAUFMANN III WJ Discovering the universe eighth edition WH
Freeman and Company New York 2008 535 p
DETHIER T Het zonnestelsel Standaard Uitgeverij 1992 415 p
GOLUB L and PASACHOFF JM Nearest star the surprising science of our sun Harvard
university press Harvard 2001 267 p
GREEN SF and JONES M H An introduction to the Sun and Stars The Open University
Cambridge 2004 373 p
HILL S and CARLOWITZ M The sun Abrams New York 2006 239 p
HOLMAN GD lsquoThe mysterious origins of solar flaresrsquo Scientific America April 2006 p
24-31 volume 294 number 4
JANSSENS J Zon en aarde een unieke relatie Garant Antwerpen 2003 254 p
KELLER H-U Van Supernovarsquos tot zwarte gaten Tirion Natuur AH Baarn 2003 169 p
LANG KR Sun earth and sky Springer Germany 1995 282 p
LILENSTEN J and BORNAREL J Sous les feux du soleil EDP Sciences Les Ulis Cedex
A 2001 247 p
832019 Ew Afgewerkte Final
httpslidepdfcomreaderfullew-afgewerkte-final 5759
57
Articles
CUYPERS J and others lsquoLa rechercheacute en heacuteliophysique en Belgiquersquo Space connection
October 2007 20 p
DE KEYSER J lsquoDe magnetopauzersquo Heelal maart 1998 p 66-73
JANSSENS J lsquoHet maximum van de 23ste zonnevlekkencyclus (I)rsquo Heelal Oktober 1998 p
256-263
JANSSENS J lsquohet maximum van de 23ste zonnenvlekkencyclus (II)rsquo Heelal November
1998 p 284-290
JANSSENS J lsquoZonnefakkelsrsquo Heelal Oktober 1994 p 256-261
SMITS F lsquoDe coronarsquo Heelal Februari 1999 p 40-42
SMITS F lsquoProtuberanzenrsquo Heelal Juli 1991 p 182-185
VAN DEN BERGHE S lsquoHet Zeemaneffectrsquo Heelal September 1998 p 228-231
832019 Ew Afgewerkte Final
httpslidepdfcomreaderfullew-afgewerkte-final 5859
58
Webography
BOEN B Birth of a coronal mass ejection Internet
(httpwwwnasagovmission_pagessolar-b solar_005html) 290408
BRAEUNIG R A Glossary Internet (httpwwwbraeunigusspaceglossaryhtm) 2006
CORDIS Researchers reveal why Suns atmosphere is hotter than its surface Internet
(httpcordiseuropaeusearchindexcfmfuseaction=newsdocumentampN_LANG=ENampN_R
CN=30598amppid=0ampq=87F36474805A6BEC0B89404F72D0351Famptype=sim) 20032009
DAY C Alfveacuten waves may heat the Sunrsquos corona Internet
(httpblogsphysicstodayorgupdate200903 alfven-waves-may-heat-the-sunshtml)
310309
ELLERMAN F Solar prominences Internet (httparticlesadsabsharvardedufull
1928ASPL173E 0000074000html) (03042009)
ENCYCLODPEDIA OF SCIENCE Corona hole Internet
(httpwwwdaviddarlinginfoencyclopediaC coronal_holehtml) (04042009)
HATHAWAY D H The sunspot cycle Internet
(httpspacesciencespacerefcomsslpadsolarsunspots htm) 04012000
JANSSENS J The case of the missing solar cycle (published in lsquoheelalrsquo January 2008)
Internet (httpuserstelenetbejjanssensMSCwebEngpdf)
KNISELY D Solar prominences Internet
(httpwwwicstarscomHTMLSolarSectionHAlphaOBSERVINGTHESUNHAlpha3html)
(03042009)
KOPANSKI J Atom Internet (httpknolgooglecomkjan-
kopanskiatom1amrwrct7rvi27) 060209
MARTENS PC and ZWAAN C Origin and evolution of filament-prominence systems
Internet (http wwwioporgEJarticle0004-637X558287253575webpdfrequest-
id=73e38daa-69ae-4e01-b9a6-b4bd0ba071dd) 092001
NASA The corona Internet (httpsolarsciencemsfcnasagovcoronashtml) 180107
NASA The heliosphere Internet (httpheliosgsfcnasagovheliosphhtml) 20012009
OFFICIAL SITE OF STONEHENGE About Stonehenge Internet
(httpwwwstonehengecouk) (03022009)
OTTERSDORF M Astronomy On the sunspot cycle Internet
(httpuserszoominternetnet~matto MCASsunspot_cyclehtmZeemaneffect) 031103
PARIAT E and SCHMIEDER B Magnetic flux emergence Internet(httpwwwscholarpediaorgarticleMagnetic_field_emergence) 18042008
832019 Ew Afgewerkte Final
httpslidepdfcomreaderfullew-afgewerkte-final 5959
59
PRIEST E R Dynamics and Structure of Quiescent Solar Prominences Internet
(httpbooksgooglebe booksid=h599q3jz1w4Campdq=quiescent+prominencesampprintsec=fro
ntcoverampsource=blampots=58b79Qeyabampsig=1eklQ-
WszOIebZZaq7fq7gm6bxAamphl=nlampei=urPtSe7ZCo61-
Qa166jHDwampsa=Xampoi=book_resultampct=result ampresnum=3PPA6M2) 1989
RUSSELL R Rotation of the sun Internet
(httpwwwwindowsucaredutourlink=sunSolar_interior
Sun_layersdifferential_rotationhtml) 16082005
RUSSELL R Sunspots and magnetic fields Internet
(httpwwwwindowsucaredutourlink=sunatmospheresunspot_magnetismhtmlampedu=hig
h) 060908
UNIVERSITY OF GLASGOW Bibliography of Peter Sweet Internet
(httpwwwuniversitystoryglaacuk biographyid=WH2144amptype=P) (10042009)
WIKIPEDIA Orbiting Solar Observatory Internet
(httpenwikipediaorgwikiOrbiting_Solar_Observatory) 24012009
WINDOWS TEAM Maunderrsquos Butterfly Diagram Internet
(httpwwwwindowsucaredutourlink=sun activitybutterflyhtml) 2000
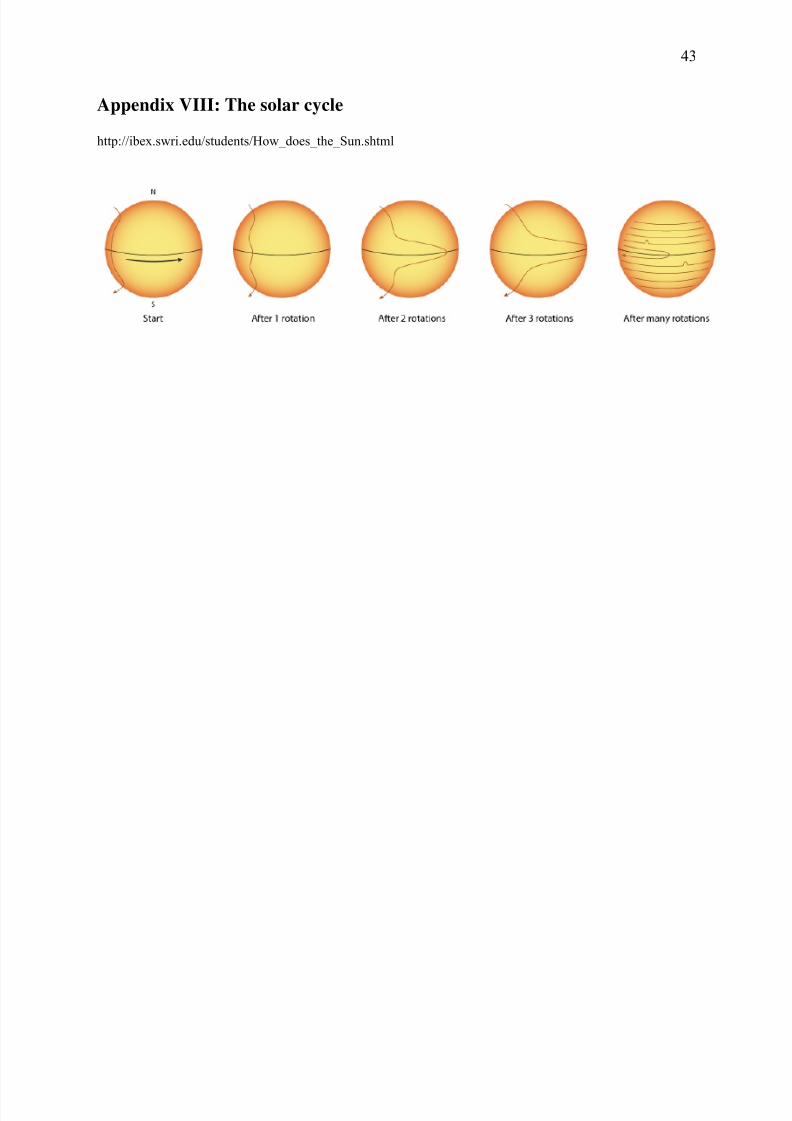
832019 Ew Afgewerkte Final
httpslidepdfcomreaderfullew-afgewerkte-final 4359
832019 Ew Afgewerkte Final
httpslidepdfcomreaderfullew-afgewerkte-final 4459
44
Appendix IX Butterfly-diagram
httpspacesciencespacerefcomsslpadsolarimagesbflygif
A butterfly-diagram
In a butterfly-diagram we can find the sunspots with their latitude (y-axis) through the years(x-axis) As you can see the sunspots appear like lsquobutterfliesrsquo this was discovered in 1904 by
Edward Maunder (1851-1928 an English astronomer best remembered for his study of
sunspots and the solar magnetic cycle) Thatrsquos why this graph is also called Maunders
butterfly diagram
832019 Ew Afgewerkte Final
httpslidepdfcomreaderfullew-afgewerkte-final 4559
45
Appendix X The Wolf-numbers
httpsidcomabenews106sunspotnumberclarifiedpdf
The sunspot number clarified By Petra Vanlommel
Which kinds of daily International Sunspot Numbers (ISN) are currentlypublished by the SIDC
Three daily indices are currently published by the SIDCthe Estimated ISN (EISN)the Provisional ISN (PISN)the Definitive ISN (DISN)Although they are all based on the same type of observations ie visual sunspot counts as ameasure of solar activity they are obtained from different data sets by different processingmethods with different accuracies and they serve different purposes
In the ideal case the three numbers are equal but in practice it is inevitable that there aresmall differences Therefore It is useful to explain what each index actually means
What is the source of the Wolf number
Once per day observers worldwide communicate their measured Wolf number (= 10G + S)based on visual sunspot (S) and group (G) counts to the World Data Center for the SunspotIndex Presently this is done through a dedicated password-protected WEB form the Wolfinterface However some observers still use the old way of reporting their observations onpaper through regular mail This method slows down the final processing but for the sake ofcontinuity in the index it is important to keep these observers included as some of them
represent the longest individual datasetsThe observers give the exact observing time the observing conditions the total numbers(group count sunspot count and Wolf number) and optionally the NorthSouth and centralzone numbers The observers using the web interface can provide their results to the SIDCimmediately after each observation However some users prefer to insert their data as ablock creating some delay but this must be done at least once a month
The personal reduction coefficient K
A personal reduction coefficient K is calculated for each station It has values typically in therange 04 and 17 and leads to a normalized sunspot number K(10G+S) In other words theK factor rescales the raw sunspot counts of each observer to the ones of Rudolph Wolf the
astronomer who introduced the above Wolf formula thus simulating the same eyes sametelescope and same conditionsDuring the procedure for calculating the Provisional ISN the K factor of every station iscomputed for every observation that passes the elimination procedure Once a year apersonal K factor for every station and for every month of the previous year is calculated Ayearly mean K value per station is also computed
The estimated sunspot index
The Estimated ISN (EISN) is calculated and issued on a daily basis for the day of calculationand the day before Only the total EISN is calculated with no hemispheric index It is anautomated procedure and no manual intervention is done The EISN is meant as a quicktemporary and approximate index for real-time applications
832019 Ew Afgewerkte Final
httpslidepdfcomreaderfullew-afgewerkte-final 4659
46
We use the raw Wolf number from all observatories that have provided counts early in theday ie before 1230 UT Typically there is between 10 and 20 stations available Thecalculation of the EISN is based on a simple and straightforward statistical method The Wolfnumbers are multiplied with the yearly mean K factor (see paragraph about the personalreduction coefficient K) The EISN is a simple average of the K-scaled values after excludingany individual value that deviates abnormally from the other valuesOnce the Provisional ISN (PISN) is calculated after the end of a month the temporary EISNis dropped and replaced by the PISN
The provisional sunspot Index
The Provisional ISN (PISN) is calculated and issued on the first of every month Theoutcome is a daily total and hemispheric sunspot number for the entire elapsed month Anexample on the first of September we calculate the daily PISN for each day of August ThePISN is computed semi-automatically with as little manual intervention as possibleTo calculate the PISN values for the concerned month we use all Wolf numbers Typicallythere is data from around 65 stations available
The calculation of the PISN is based on an extensive statistical treatment This treatmentfilters out any abnormal daily observation or the complete data set from an erratic station(quality control) This prevents long-term drifts in the resulting index One of the key elementsderived from this processing is to update the K reduction coefficients for each station theevolution of each station is monitored for each day relative to the entire networkA subset of the contributing stations also provides hemispheric counts A similar process isapplied to the North and South counts to derive the hemispheric PISN There is an additionalconstraint the sum of the North and South ISN must match the total ISNThe PISN replaces the EISN And once the Definitive ISN (DISN) is calculated the DISNreplaces the PISN
The definitive sunspot index
The Definitive ISN is calculated and issued on a quarterly basis when we have collecteddata from all the contributing observatories This is the final index and it is appended to thehistorical sunspot index time series The same semi-automated treatment as for the PISN isnow applied to the full data set If the result agrees within 5 of the PISN value the PISN iskept and becomes definitive Otherwise the new calculated value replaces the PISN andbecomes the definitive ISNIt is only at this stage and only in peculiar situations that a manual verification by ourscientific staff is required For example this happens when the observed raw Wolf valuesfrom the whole network are clustered around two distinct values This special case can becaused by small short-lived isolated sunspots (lifetimes lt 24 hours) or by the appearance ordisappearance of a large group at the solar limb in the course of one UT dayThe DISN replaces the provisional and estimated International Sunspot Number
Handling very low activity levels
One of the situations requiring a human arbitration is associated with single small isolatedand short-lived sunspots This is most noticeable around the minimum of the solar activitycycle like the one occurring now in 2008 Due to the 24hour binning (observations aregrouped between 0hUT and 24hUT) and the variable ability of each observer to detect thesmallest sunspots we end up with some stations reporting one sunspot and others who didno see any sunspot Let us explain further No sunspot may mean that the sunspot waspresent but the observer was unable to see it because of poor observational conditions such
as weather a small telescope On the other hand it may also indicate that the sunspot hadactually vanished by that time while it was present earlier on the same day
832019 Ew Afgewerkte Final
httpslidepdfcomreaderfullew-afgewerkte-final 4759
47
Individual stations do not observe at exactly the same timeIn order to validate the existence of such a marginal reported sunspot a qualified SIDCscientist must then check the detailed chronology within that day and consider the overallobserver capability (value of K coefficient)In common practice the fact that a sunspot is reported by a significant group of observersleads to the inclusion of the sunspot on that date thus neglecting the no-sunspotobservationsThe rationale is multiple observations of a sunspot exclude the possibility that the reportedsunspot was an independent false detection So a sunspot was really present on that dayalthough it may have existed only for part of the day or it was small enough to be missed bypart of the observers with smaller instruments or imperfect atmospheric conditionsAlso keep in mind that the sunspot index is derived with a limited precision just like any otherindex If the monthly mean sunspot number is 0 or 05 you can definitely say that activitywas low
What index should be used
If you want to perform long-term investigations the definitive ISN series is definitely the mostsuitable However there is a delay of a few months So when investigating the last cycle andrecent evolution use the definitive numbers in combination with the provisional ISN to be upto date to the last month The provisional numbers are also used in models forecasting thesunspot number for the coming months Now if you need a proxy for solar activity in a modelthat runs in real-time then you may use the estimated ISNImprovements and rethinking of the processing method is an ongoing project We arecurrently developing an alternative program for calculating the PISN Of course long-termconsistency is vital Therefore a cross-analysis between the output from the old and newsoftware must be applied over an extended period
832019 Ew Afgewerkte Final
httpslidepdfcomreaderfullew-afgewerkte-final 4859
48
Above graphs show different kinds of the International Sunspot Number The left plot gives an overview from 1700 up to now from the yearly (black) and monthly smoothed Sunspot Number The graph in the right top corner shows the monthly and monthly smoothed sunspot number while the graph in the right bottom corner show the daily monthly smoothed monthly sunspot number For every the time range of investigation there is an appropriate sunspot number
832019 Ew Afgewerkte Final
httpslidepdfcomreaderfullew-afgewerkte-final 4959
49
Appendix XI Filaments and prominences
httpsohowwwnascomnasagovpickoftheweekold26feb2004
This is a picture taken by SOHO on 26 February 2004
832019 Ew Afgewerkte Final
httpslidepdfcomreaderfullew-afgewerkte-final 5059
50
Appendix XII The reconnection of magnetic loops
httpwwwioporgEJarticle0004-637X558287253575webpdfrequest-id=73e38daa-69ae-4e01-b9a6- b4bd0ba071dd
In (a) sunspot B and C have different polarity and move towards each other The twomagnetic loops will reconnect and form one big magnetic loop showed in (b) This will
happen to other magnetic loops too as can be seen in (c) When G en F are close enough they
will reconnect and so E en H will reconnect too It is possible that the magnetic field line is
trapped around another in this case AD The mass ejected from the sun will be trapped
between the magnetic field lines and form a solar prominence
832019 Ew Afgewerkte Final
httpslidepdfcomreaderfullew-afgewerkte-final 5159
832019 Ew Afgewerkte Final
httpslidepdfcomreaderfullew-afgewerkte-final 5259
52
httptheinvisibleagentwordpresscom20090117amazing-celestial-images
An group of active prominences
httpapodnasagovapodap051109html
httpwhassupinthemilkywayblogspotcom200903cloudy-planhtml
A picture taken by SOHO In the left corner you can see the prominence with twisted
magnetic field lines
832019 Ew Afgewerkte Final
httpslidepdfcomreaderfullew-afgewerkte-final 5359
53
Appendix XIV Polar crown
httpsciencenasagovheadlinesy200817sep_polarcrownhtm
Photograph of a polar crown taken on 13 June 1999 by the Meudon Observatory
832019 Ew Afgewerkte Final
httpslidepdfcomreaderfullew-afgewerkte-final 5459
54
Appendix XV Coronal holes
httpsunearthdaynasagov2007multimediagal_020php
The black segment is a huge coronal hole The bright parts are x-rays from sunspots
832019 Ew Afgewerkte Final
httpslidepdfcomreaderfullew-afgewerkte-final 5559
55
Appendix XVI Coronal mass ejection
httpzuserver2staruclacuk~idhapodap000309html
Picture of a CME taken by SOHO in February 2000
832019 Ew Afgewerkte Final
httpslidepdfcomreaderfullew-afgewerkte-final 5659
56
Bibliography
Books
BEATTY JK PETERSEN CC and CHAIKIN A The new solar system fourth edition
Cambridge University Press Cambridge 1999 421 p
COMINS NF and KAUFMANN III WJ Discovering the universe eighth edition WH
Freeman and Company New York 2008 535 p
DETHIER T Het zonnestelsel Standaard Uitgeverij 1992 415 p
GOLUB L and PASACHOFF JM Nearest star the surprising science of our sun Harvard
university press Harvard 2001 267 p
GREEN SF and JONES M H An introduction to the Sun and Stars The Open University
Cambridge 2004 373 p
HILL S and CARLOWITZ M The sun Abrams New York 2006 239 p
HOLMAN GD lsquoThe mysterious origins of solar flaresrsquo Scientific America April 2006 p
24-31 volume 294 number 4
JANSSENS J Zon en aarde een unieke relatie Garant Antwerpen 2003 254 p
KELLER H-U Van Supernovarsquos tot zwarte gaten Tirion Natuur AH Baarn 2003 169 p
LANG KR Sun earth and sky Springer Germany 1995 282 p
LILENSTEN J and BORNAREL J Sous les feux du soleil EDP Sciences Les Ulis Cedex
A 2001 247 p
832019 Ew Afgewerkte Final
httpslidepdfcomreaderfullew-afgewerkte-final 5759
57
Articles
CUYPERS J and others lsquoLa rechercheacute en heacuteliophysique en Belgiquersquo Space connection
October 2007 20 p
DE KEYSER J lsquoDe magnetopauzersquo Heelal maart 1998 p 66-73
JANSSENS J lsquoHet maximum van de 23ste zonnevlekkencyclus (I)rsquo Heelal Oktober 1998 p
256-263
JANSSENS J lsquohet maximum van de 23ste zonnenvlekkencyclus (II)rsquo Heelal November
1998 p 284-290
JANSSENS J lsquoZonnefakkelsrsquo Heelal Oktober 1994 p 256-261
SMITS F lsquoDe coronarsquo Heelal Februari 1999 p 40-42
SMITS F lsquoProtuberanzenrsquo Heelal Juli 1991 p 182-185
VAN DEN BERGHE S lsquoHet Zeemaneffectrsquo Heelal September 1998 p 228-231
832019 Ew Afgewerkte Final
httpslidepdfcomreaderfullew-afgewerkte-final 5859
58
Webography
BOEN B Birth of a coronal mass ejection Internet
(httpwwwnasagovmission_pagessolar-b solar_005html) 290408
BRAEUNIG R A Glossary Internet (httpwwwbraeunigusspaceglossaryhtm) 2006
CORDIS Researchers reveal why Suns atmosphere is hotter than its surface Internet
(httpcordiseuropaeusearchindexcfmfuseaction=newsdocumentampN_LANG=ENampN_R
CN=30598amppid=0ampq=87F36474805A6BEC0B89404F72D0351Famptype=sim) 20032009
DAY C Alfveacuten waves may heat the Sunrsquos corona Internet
(httpblogsphysicstodayorgupdate200903 alfven-waves-may-heat-the-sunshtml)
310309
ELLERMAN F Solar prominences Internet (httparticlesadsabsharvardedufull
1928ASPL173E 0000074000html) (03042009)
ENCYCLODPEDIA OF SCIENCE Corona hole Internet
(httpwwwdaviddarlinginfoencyclopediaC coronal_holehtml) (04042009)
HATHAWAY D H The sunspot cycle Internet
(httpspacesciencespacerefcomsslpadsolarsunspots htm) 04012000
JANSSENS J The case of the missing solar cycle (published in lsquoheelalrsquo January 2008)
Internet (httpuserstelenetbejjanssensMSCwebEngpdf)
KNISELY D Solar prominences Internet
(httpwwwicstarscomHTMLSolarSectionHAlphaOBSERVINGTHESUNHAlpha3html)
(03042009)
KOPANSKI J Atom Internet (httpknolgooglecomkjan-
kopanskiatom1amrwrct7rvi27) 060209
MARTENS PC and ZWAAN C Origin and evolution of filament-prominence systems
Internet (http wwwioporgEJarticle0004-637X558287253575webpdfrequest-
id=73e38daa-69ae-4e01-b9a6-b4bd0ba071dd) 092001
NASA The corona Internet (httpsolarsciencemsfcnasagovcoronashtml) 180107
NASA The heliosphere Internet (httpheliosgsfcnasagovheliosphhtml) 20012009
OFFICIAL SITE OF STONEHENGE About Stonehenge Internet
(httpwwwstonehengecouk) (03022009)
OTTERSDORF M Astronomy On the sunspot cycle Internet
(httpuserszoominternetnet~matto MCASsunspot_cyclehtmZeemaneffect) 031103
PARIAT E and SCHMIEDER B Magnetic flux emergence Internet(httpwwwscholarpediaorgarticleMagnetic_field_emergence) 18042008
832019 Ew Afgewerkte Final
httpslidepdfcomreaderfullew-afgewerkte-final 5959
59
PRIEST E R Dynamics and Structure of Quiescent Solar Prominences Internet
(httpbooksgooglebe booksid=h599q3jz1w4Campdq=quiescent+prominencesampprintsec=fro
ntcoverampsource=blampots=58b79Qeyabampsig=1eklQ-
WszOIebZZaq7fq7gm6bxAamphl=nlampei=urPtSe7ZCo61-
Qa166jHDwampsa=Xampoi=book_resultampct=result ampresnum=3PPA6M2) 1989
RUSSELL R Rotation of the sun Internet
(httpwwwwindowsucaredutourlink=sunSolar_interior
Sun_layersdifferential_rotationhtml) 16082005
RUSSELL R Sunspots and magnetic fields Internet
(httpwwwwindowsucaredutourlink=sunatmospheresunspot_magnetismhtmlampedu=hig
h) 060908
UNIVERSITY OF GLASGOW Bibliography of Peter Sweet Internet
(httpwwwuniversitystoryglaacuk biographyid=WH2144amptype=P) (10042009)
WIKIPEDIA Orbiting Solar Observatory Internet
(httpenwikipediaorgwikiOrbiting_Solar_Observatory) 24012009
WINDOWS TEAM Maunderrsquos Butterfly Diagram Internet
(httpwwwwindowsucaredutourlink=sun activitybutterflyhtml) 2000
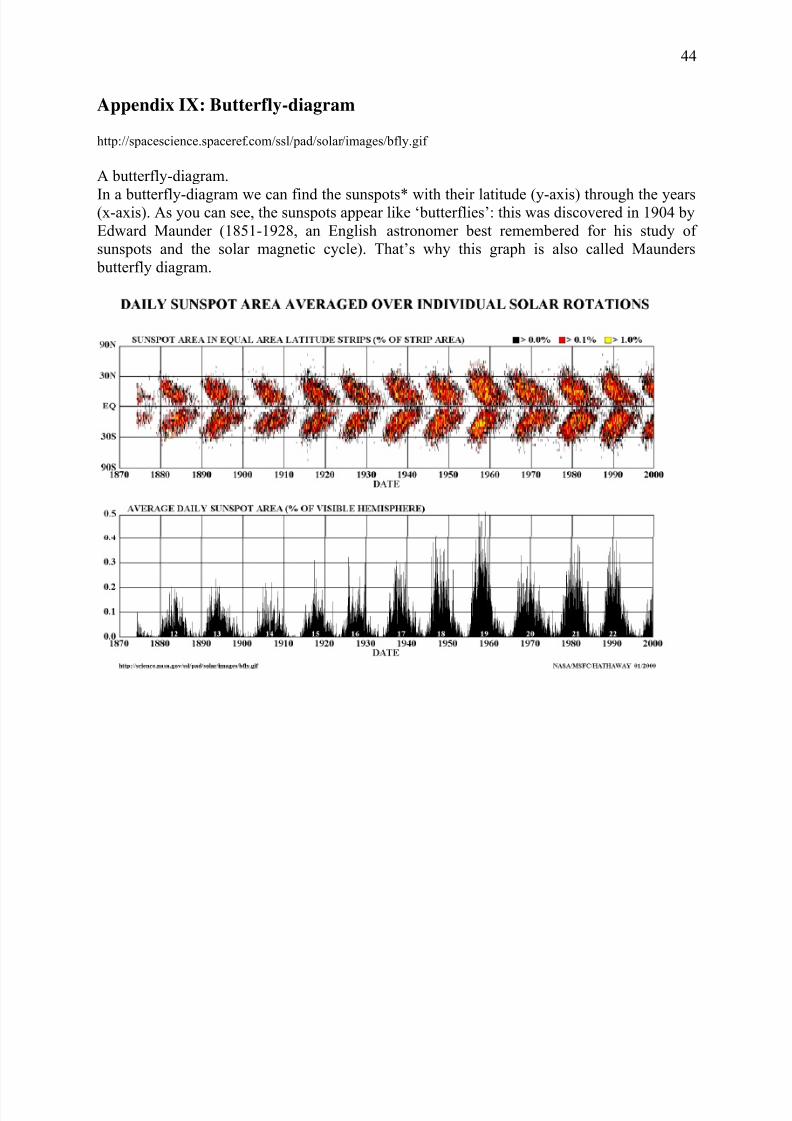
832019 Ew Afgewerkte Final
httpslidepdfcomreaderfullew-afgewerkte-final 4459
44
Appendix IX Butterfly-diagram
httpspacesciencespacerefcomsslpadsolarimagesbflygif
A butterfly-diagram
In a butterfly-diagram we can find the sunspots with their latitude (y-axis) through the years(x-axis) As you can see the sunspots appear like lsquobutterfliesrsquo this was discovered in 1904 by
Edward Maunder (1851-1928 an English astronomer best remembered for his study of
sunspots and the solar magnetic cycle) Thatrsquos why this graph is also called Maunders
butterfly diagram
832019 Ew Afgewerkte Final
httpslidepdfcomreaderfullew-afgewerkte-final 4559
45
Appendix X The Wolf-numbers
httpsidcomabenews106sunspotnumberclarifiedpdf
The sunspot number clarified By Petra Vanlommel
Which kinds of daily International Sunspot Numbers (ISN) are currentlypublished by the SIDC
Three daily indices are currently published by the SIDCthe Estimated ISN (EISN)the Provisional ISN (PISN)the Definitive ISN (DISN)Although they are all based on the same type of observations ie visual sunspot counts as ameasure of solar activity they are obtained from different data sets by different processingmethods with different accuracies and they serve different purposes
In the ideal case the three numbers are equal but in practice it is inevitable that there aresmall differences Therefore It is useful to explain what each index actually means
What is the source of the Wolf number
Once per day observers worldwide communicate their measured Wolf number (= 10G + S)based on visual sunspot (S) and group (G) counts to the World Data Center for the SunspotIndex Presently this is done through a dedicated password-protected WEB form the Wolfinterface However some observers still use the old way of reporting their observations onpaper through regular mail This method slows down the final processing but for the sake ofcontinuity in the index it is important to keep these observers included as some of them
represent the longest individual datasetsThe observers give the exact observing time the observing conditions the total numbers(group count sunspot count and Wolf number) and optionally the NorthSouth and centralzone numbers The observers using the web interface can provide their results to the SIDCimmediately after each observation However some users prefer to insert their data as ablock creating some delay but this must be done at least once a month
The personal reduction coefficient K
A personal reduction coefficient K is calculated for each station It has values typically in therange 04 and 17 and leads to a normalized sunspot number K(10G+S) In other words theK factor rescales the raw sunspot counts of each observer to the ones of Rudolph Wolf the
astronomer who introduced the above Wolf formula thus simulating the same eyes sametelescope and same conditionsDuring the procedure for calculating the Provisional ISN the K factor of every station iscomputed for every observation that passes the elimination procedure Once a year apersonal K factor for every station and for every month of the previous year is calculated Ayearly mean K value per station is also computed
The estimated sunspot index
The Estimated ISN (EISN) is calculated and issued on a daily basis for the day of calculationand the day before Only the total EISN is calculated with no hemispheric index It is anautomated procedure and no manual intervention is done The EISN is meant as a quicktemporary and approximate index for real-time applications
832019 Ew Afgewerkte Final
httpslidepdfcomreaderfullew-afgewerkte-final 4659
46
We use the raw Wolf number from all observatories that have provided counts early in theday ie before 1230 UT Typically there is between 10 and 20 stations available Thecalculation of the EISN is based on a simple and straightforward statistical method The Wolfnumbers are multiplied with the yearly mean K factor (see paragraph about the personalreduction coefficient K) The EISN is a simple average of the K-scaled values after excludingany individual value that deviates abnormally from the other valuesOnce the Provisional ISN (PISN) is calculated after the end of a month the temporary EISNis dropped and replaced by the PISN
The provisional sunspot Index
The Provisional ISN (PISN) is calculated and issued on the first of every month Theoutcome is a daily total and hemispheric sunspot number for the entire elapsed month Anexample on the first of September we calculate the daily PISN for each day of August ThePISN is computed semi-automatically with as little manual intervention as possibleTo calculate the PISN values for the concerned month we use all Wolf numbers Typicallythere is data from around 65 stations available
The calculation of the PISN is based on an extensive statistical treatment This treatmentfilters out any abnormal daily observation or the complete data set from an erratic station(quality control) This prevents long-term drifts in the resulting index One of the key elementsderived from this processing is to update the K reduction coefficients for each station theevolution of each station is monitored for each day relative to the entire networkA subset of the contributing stations also provides hemispheric counts A similar process isapplied to the North and South counts to derive the hemispheric PISN There is an additionalconstraint the sum of the North and South ISN must match the total ISNThe PISN replaces the EISN And once the Definitive ISN (DISN) is calculated the DISNreplaces the PISN
The definitive sunspot index
The Definitive ISN is calculated and issued on a quarterly basis when we have collecteddata from all the contributing observatories This is the final index and it is appended to thehistorical sunspot index time series The same semi-automated treatment as for the PISN isnow applied to the full data set If the result agrees within 5 of the PISN value the PISN iskept and becomes definitive Otherwise the new calculated value replaces the PISN andbecomes the definitive ISNIt is only at this stage and only in peculiar situations that a manual verification by ourscientific staff is required For example this happens when the observed raw Wolf valuesfrom the whole network are clustered around two distinct values This special case can becaused by small short-lived isolated sunspots (lifetimes lt 24 hours) or by the appearance ordisappearance of a large group at the solar limb in the course of one UT dayThe DISN replaces the provisional and estimated International Sunspot Number
Handling very low activity levels
One of the situations requiring a human arbitration is associated with single small isolatedand short-lived sunspots This is most noticeable around the minimum of the solar activitycycle like the one occurring now in 2008 Due to the 24hour binning (observations aregrouped between 0hUT and 24hUT) and the variable ability of each observer to detect thesmallest sunspots we end up with some stations reporting one sunspot and others who didno see any sunspot Let us explain further No sunspot may mean that the sunspot waspresent but the observer was unable to see it because of poor observational conditions such
as weather a small telescope On the other hand it may also indicate that the sunspot hadactually vanished by that time while it was present earlier on the same day
832019 Ew Afgewerkte Final
httpslidepdfcomreaderfullew-afgewerkte-final 4759
47
Individual stations do not observe at exactly the same timeIn order to validate the existence of such a marginal reported sunspot a qualified SIDCscientist must then check the detailed chronology within that day and consider the overallobserver capability (value of K coefficient)In common practice the fact that a sunspot is reported by a significant group of observersleads to the inclusion of the sunspot on that date thus neglecting the no-sunspotobservationsThe rationale is multiple observations of a sunspot exclude the possibility that the reportedsunspot was an independent false detection So a sunspot was really present on that dayalthough it may have existed only for part of the day or it was small enough to be missed bypart of the observers with smaller instruments or imperfect atmospheric conditionsAlso keep in mind that the sunspot index is derived with a limited precision just like any otherindex If the monthly mean sunspot number is 0 or 05 you can definitely say that activitywas low
What index should be used
If you want to perform long-term investigations the definitive ISN series is definitely the mostsuitable However there is a delay of a few months So when investigating the last cycle andrecent evolution use the definitive numbers in combination with the provisional ISN to be upto date to the last month The provisional numbers are also used in models forecasting thesunspot number for the coming months Now if you need a proxy for solar activity in a modelthat runs in real-time then you may use the estimated ISNImprovements and rethinking of the processing method is an ongoing project We arecurrently developing an alternative program for calculating the PISN Of course long-termconsistency is vital Therefore a cross-analysis between the output from the old and newsoftware must be applied over an extended period
832019 Ew Afgewerkte Final
httpslidepdfcomreaderfullew-afgewerkte-final 4859
48
Above graphs show different kinds of the International Sunspot Number The left plot gives an overview from 1700 up to now from the yearly (black) and monthly smoothed Sunspot Number The graph in the right top corner shows the monthly and monthly smoothed sunspot number while the graph in the right bottom corner show the daily monthly smoothed monthly sunspot number For every the time range of investigation there is an appropriate sunspot number
832019 Ew Afgewerkte Final
httpslidepdfcomreaderfullew-afgewerkte-final 4959
49
Appendix XI Filaments and prominences
httpsohowwwnascomnasagovpickoftheweekold26feb2004
This is a picture taken by SOHO on 26 February 2004
832019 Ew Afgewerkte Final
httpslidepdfcomreaderfullew-afgewerkte-final 5059
50
Appendix XII The reconnection of magnetic loops
httpwwwioporgEJarticle0004-637X558287253575webpdfrequest-id=73e38daa-69ae-4e01-b9a6- b4bd0ba071dd
In (a) sunspot B and C have different polarity and move towards each other The twomagnetic loops will reconnect and form one big magnetic loop showed in (b) This will
happen to other magnetic loops too as can be seen in (c) When G en F are close enough they
will reconnect and so E en H will reconnect too It is possible that the magnetic field line is
trapped around another in this case AD The mass ejected from the sun will be trapped
between the magnetic field lines and form a solar prominence
832019 Ew Afgewerkte Final
httpslidepdfcomreaderfullew-afgewerkte-final 5159
832019 Ew Afgewerkte Final
httpslidepdfcomreaderfullew-afgewerkte-final 5259
52
httptheinvisibleagentwordpresscom20090117amazing-celestial-images
An group of active prominences
httpapodnasagovapodap051109html
httpwhassupinthemilkywayblogspotcom200903cloudy-planhtml
A picture taken by SOHO In the left corner you can see the prominence with twisted
magnetic field lines
832019 Ew Afgewerkte Final
httpslidepdfcomreaderfullew-afgewerkte-final 5359
53
Appendix XIV Polar crown
httpsciencenasagovheadlinesy200817sep_polarcrownhtm
Photograph of a polar crown taken on 13 June 1999 by the Meudon Observatory
832019 Ew Afgewerkte Final
httpslidepdfcomreaderfullew-afgewerkte-final 5459
54
Appendix XV Coronal holes
httpsunearthdaynasagov2007multimediagal_020php
The black segment is a huge coronal hole The bright parts are x-rays from sunspots
832019 Ew Afgewerkte Final
httpslidepdfcomreaderfullew-afgewerkte-final 5559
55
Appendix XVI Coronal mass ejection
httpzuserver2staruclacuk~idhapodap000309html
Picture of a CME taken by SOHO in February 2000
832019 Ew Afgewerkte Final
httpslidepdfcomreaderfullew-afgewerkte-final 5659
56
Bibliography
Books
BEATTY JK PETERSEN CC and CHAIKIN A The new solar system fourth edition
Cambridge University Press Cambridge 1999 421 p
COMINS NF and KAUFMANN III WJ Discovering the universe eighth edition WH
Freeman and Company New York 2008 535 p
DETHIER T Het zonnestelsel Standaard Uitgeverij 1992 415 p
GOLUB L and PASACHOFF JM Nearest star the surprising science of our sun Harvard
university press Harvard 2001 267 p
GREEN SF and JONES M H An introduction to the Sun and Stars The Open University
Cambridge 2004 373 p
HILL S and CARLOWITZ M The sun Abrams New York 2006 239 p
HOLMAN GD lsquoThe mysterious origins of solar flaresrsquo Scientific America April 2006 p
24-31 volume 294 number 4
JANSSENS J Zon en aarde een unieke relatie Garant Antwerpen 2003 254 p
KELLER H-U Van Supernovarsquos tot zwarte gaten Tirion Natuur AH Baarn 2003 169 p
LANG KR Sun earth and sky Springer Germany 1995 282 p
LILENSTEN J and BORNAREL J Sous les feux du soleil EDP Sciences Les Ulis Cedex
A 2001 247 p
832019 Ew Afgewerkte Final
httpslidepdfcomreaderfullew-afgewerkte-final 5759
57
Articles
CUYPERS J and others lsquoLa rechercheacute en heacuteliophysique en Belgiquersquo Space connection
October 2007 20 p
DE KEYSER J lsquoDe magnetopauzersquo Heelal maart 1998 p 66-73
JANSSENS J lsquoHet maximum van de 23ste zonnevlekkencyclus (I)rsquo Heelal Oktober 1998 p
256-263
JANSSENS J lsquohet maximum van de 23ste zonnenvlekkencyclus (II)rsquo Heelal November
1998 p 284-290
JANSSENS J lsquoZonnefakkelsrsquo Heelal Oktober 1994 p 256-261
SMITS F lsquoDe coronarsquo Heelal Februari 1999 p 40-42
SMITS F lsquoProtuberanzenrsquo Heelal Juli 1991 p 182-185
VAN DEN BERGHE S lsquoHet Zeemaneffectrsquo Heelal September 1998 p 228-231
832019 Ew Afgewerkte Final
httpslidepdfcomreaderfullew-afgewerkte-final 5859
58
Webography
BOEN B Birth of a coronal mass ejection Internet
(httpwwwnasagovmission_pagessolar-b solar_005html) 290408
BRAEUNIG R A Glossary Internet (httpwwwbraeunigusspaceglossaryhtm) 2006
CORDIS Researchers reveal why Suns atmosphere is hotter than its surface Internet
(httpcordiseuropaeusearchindexcfmfuseaction=newsdocumentampN_LANG=ENampN_R
CN=30598amppid=0ampq=87F36474805A6BEC0B89404F72D0351Famptype=sim) 20032009
DAY C Alfveacuten waves may heat the Sunrsquos corona Internet
(httpblogsphysicstodayorgupdate200903 alfven-waves-may-heat-the-sunshtml)
310309
ELLERMAN F Solar prominences Internet (httparticlesadsabsharvardedufull
1928ASPL173E 0000074000html) (03042009)
ENCYCLODPEDIA OF SCIENCE Corona hole Internet
(httpwwwdaviddarlinginfoencyclopediaC coronal_holehtml) (04042009)
HATHAWAY D H The sunspot cycle Internet
(httpspacesciencespacerefcomsslpadsolarsunspots htm) 04012000
JANSSENS J The case of the missing solar cycle (published in lsquoheelalrsquo January 2008)
Internet (httpuserstelenetbejjanssensMSCwebEngpdf)
KNISELY D Solar prominences Internet
(httpwwwicstarscomHTMLSolarSectionHAlphaOBSERVINGTHESUNHAlpha3html)
(03042009)
KOPANSKI J Atom Internet (httpknolgooglecomkjan-
kopanskiatom1amrwrct7rvi27) 060209
MARTENS PC and ZWAAN C Origin and evolution of filament-prominence systems
Internet (http wwwioporgEJarticle0004-637X558287253575webpdfrequest-
id=73e38daa-69ae-4e01-b9a6-b4bd0ba071dd) 092001
NASA The corona Internet (httpsolarsciencemsfcnasagovcoronashtml) 180107
NASA The heliosphere Internet (httpheliosgsfcnasagovheliosphhtml) 20012009
OFFICIAL SITE OF STONEHENGE About Stonehenge Internet
(httpwwwstonehengecouk) (03022009)
OTTERSDORF M Astronomy On the sunspot cycle Internet
(httpuserszoominternetnet~matto MCASsunspot_cyclehtmZeemaneffect) 031103
PARIAT E and SCHMIEDER B Magnetic flux emergence Internet(httpwwwscholarpediaorgarticleMagnetic_field_emergence) 18042008
832019 Ew Afgewerkte Final
httpslidepdfcomreaderfullew-afgewerkte-final 5959
59
PRIEST E R Dynamics and Structure of Quiescent Solar Prominences Internet
(httpbooksgooglebe booksid=h599q3jz1w4Campdq=quiescent+prominencesampprintsec=fro
ntcoverampsource=blampots=58b79Qeyabampsig=1eklQ-
WszOIebZZaq7fq7gm6bxAamphl=nlampei=urPtSe7ZCo61-
Qa166jHDwampsa=Xampoi=book_resultampct=result ampresnum=3PPA6M2) 1989
RUSSELL R Rotation of the sun Internet
(httpwwwwindowsucaredutourlink=sunSolar_interior
Sun_layersdifferential_rotationhtml) 16082005
RUSSELL R Sunspots and magnetic fields Internet
(httpwwwwindowsucaredutourlink=sunatmospheresunspot_magnetismhtmlampedu=hig
h) 060908
UNIVERSITY OF GLASGOW Bibliography of Peter Sweet Internet
(httpwwwuniversitystoryglaacuk biographyid=WH2144amptype=P) (10042009)
WIKIPEDIA Orbiting Solar Observatory Internet
(httpenwikipediaorgwikiOrbiting_Solar_Observatory) 24012009
WINDOWS TEAM Maunderrsquos Butterfly Diagram Internet
(httpwwwwindowsucaredutourlink=sun activitybutterflyhtml) 2000
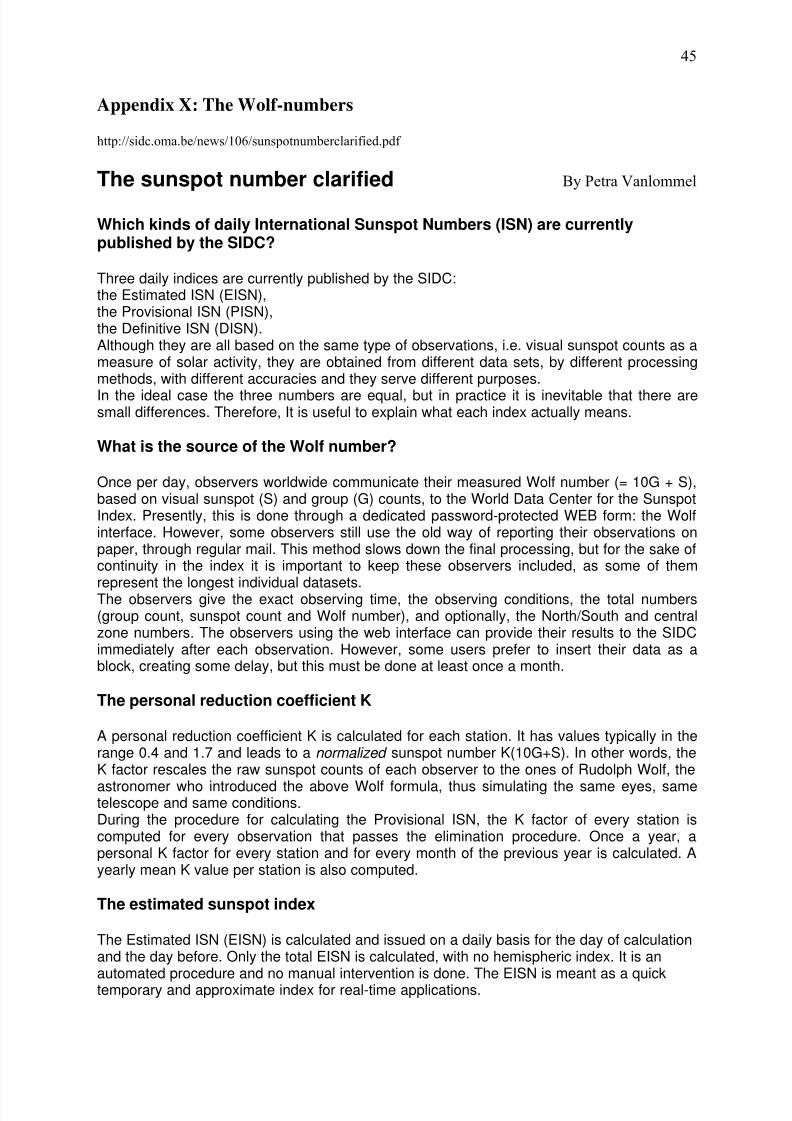
832019 Ew Afgewerkte Final
httpslidepdfcomreaderfullew-afgewerkte-final 4559
45
Appendix X The Wolf-numbers
httpsidcomabenews106sunspotnumberclarifiedpdf
The sunspot number clarified By Petra Vanlommel
Which kinds of daily International Sunspot Numbers (ISN) are currentlypublished by the SIDC
Three daily indices are currently published by the SIDCthe Estimated ISN (EISN)the Provisional ISN (PISN)the Definitive ISN (DISN)Although they are all based on the same type of observations ie visual sunspot counts as ameasure of solar activity they are obtained from different data sets by different processingmethods with different accuracies and they serve different purposes
In the ideal case the three numbers are equal but in practice it is inevitable that there aresmall differences Therefore It is useful to explain what each index actually means
What is the source of the Wolf number
Once per day observers worldwide communicate their measured Wolf number (= 10G + S)based on visual sunspot (S) and group (G) counts to the World Data Center for the SunspotIndex Presently this is done through a dedicated password-protected WEB form the Wolfinterface However some observers still use the old way of reporting their observations onpaper through regular mail This method slows down the final processing but for the sake ofcontinuity in the index it is important to keep these observers included as some of them
represent the longest individual datasetsThe observers give the exact observing time the observing conditions the total numbers(group count sunspot count and Wolf number) and optionally the NorthSouth and centralzone numbers The observers using the web interface can provide their results to the SIDCimmediately after each observation However some users prefer to insert their data as ablock creating some delay but this must be done at least once a month
The personal reduction coefficient K
A personal reduction coefficient K is calculated for each station It has values typically in therange 04 and 17 and leads to a normalized sunspot number K(10G+S) In other words theK factor rescales the raw sunspot counts of each observer to the ones of Rudolph Wolf the
astronomer who introduced the above Wolf formula thus simulating the same eyes sametelescope and same conditionsDuring the procedure for calculating the Provisional ISN the K factor of every station iscomputed for every observation that passes the elimination procedure Once a year apersonal K factor for every station and for every month of the previous year is calculated Ayearly mean K value per station is also computed
The estimated sunspot index
The Estimated ISN (EISN) is calculated and issued on a daily basis for the day of calculationand the day before Only the total EISN is calculated with no hemispheric index It is anautomated procedure and no manual intervention is done The EISN is meant as a quicktemporary and approximate index for real-time applications
832019 Ew Afgewerkte Final
httpslidepdfcomreaderfullew-afgewerkte-final 4659
46
We use the raw Wolf number from all observatories that have provided counts early in theday ie before 1230 UT Typically there is between 10 and 20 stations available Thecalculation of the EISN is based on a simple and straightforward statistical method The Wolfnumbers are multiplied with the yearly mean K factor (see paragraph about the personalreduction coefficient K) The EISN is a simple average of the K-scaled values after excludingany individual value that deviates abnormally from the other valuesOnce the Provisional ISN (PISN) is calculated after the end of a month the temporary EISNis dropped and replaced by the PISN
The provisional sunspot Index
The Provisional ISN (PISN) is calculated and issued on the first of every month Theoutcome is a daily total and hemispheric sunspot number for the entire elapsed month Anexample on the first of September we calculate the daily PISN for each day of August ThePISN is computed semi-automatically with as little manual intervention as possibleTo calculate the PISN values for the concerned month we use all Wolf numbers Typicallythere is data from around 65 stations available
The calculation of the PISN is based on an extensive statistical treatment This treatmentfilters out any abnormal daily observation or the complete data set from an erratic station(quality control) This prevents long-term drifts in the resulting index One of the key elementsderived from this processing is to update the K reduction coefficients for each station theevolution of each station is monitored for each day relative to the entire networkA subset of the contributing stations also provides hemispheric counts A similar process isapplied to the North and South counts to derive the hemispheric PISN There is an additionalconstraint the sum of the North and South ISN must match the total ISNThe PISN replaces the EISN And once the Definitive ISN (DISN) is calculated the DISNreplaces the PISN
The definitive sunspot index
The Definitive ISN is calculated and issued on a quarterly basis when we have collecteddata from all the contributing observatories This is the final index and it is appended to thehistorical sunspot index time series The same semi-automated treatment as for the PISN isnow applied to the full data set If the result agrees within 5 of the PISN value the PISN iskept and becomes definitive Otherwise the new calculated value replaces the PISN andbecomes the definitive ISNIt is only at this stage and only in peculiar situations that a manual verification by ourscientific staff is required For example this happens when the observed raw Wolf valuesfrom the whole network are clustered around two distinct values This special case can becaused by small short-lived isolated sunspots (lifetimes lt 24 hours) or by the appearance ordisappearance of a large group at the solar limb in the course of one UT dayThe DISN replaces the provisional and estimated International Sunspot Number
Handling very low activity levels
One of the situations requiring a human arbitration is associated with single small isolatedand short-lived sunspots This is most noticeable around the minimum of the solar activitycycle like the one occurring now in 2008 Due to the 24hour binning (observations aregrouped between 0hUT and 24hUT) and the variable ability of each observer to detect thesmallest sunspots we end up with some stations reporting one sunspot and others who didno see any sunspot Let us explain further No sunspot may mean that the sunspot waspresent but the observer was unable to see it because of poor observational conditions such
as weather a small telescope On the other hand it may also indicate that the sunspot hadactually vanished by that time while it was present earlier on the same day
832019 Ew Afgewerkte Final
httpslidepdfcomreaderfullew-afgewerkte-final 4759
47
Individual stations do not observe at exactly the same timeIn order to validate the existence of such a marginal reported sunspot a qualified SIDCscientist must then check the detailed chronology within that day and consider the overallobserver capability (value of K coefficient)In common practice the fact that a sunspot is reported by a significant group of observersleads to the inclusion of the sunspot on that date thus neglecting the no-sunspotobservationsThe rationale is multiple observations of a sunspot exclude the possibility that the reportedsunspot was an independent false detection So a sunspot was really present on that dayalthough it may have existed only for part of the day or it was small enough to be missed bypart of the observers with smaller instruments or imperfect atmospheric conditionsAlso keep in mind that the sunspot index is derived with a limited precision just like any otherindex If the monthly mean sunspot number is 0 or 05 you can definitely say that activitywas low
What index should be used
If you want to perform long-term investigations the definitive ISN series is definitely the mostsuitable However there is a delay of a few months So when investigating the last cycle andrecent evolution use the definitive numbers in combination with the provisional ISN to be upto date to the last month The provisional numbers are also used in models forecasting thesunspot number for the coming months Now if you need a proxy for solar activity in a modelthat runs in real-time then you may use the estimated ISNImprovements and rethinking of the processing method is an ongoing project We arecurrently developing an alternative program for calculating the PISN Of course long-termconsistency is vital Therefore a cross-analysis between the output from the old and newsoftware must be applied over an extended period
832019 Ew Afgewerkte Final
httpslidepdfcomreaderfullew-afgewerkte-final 4859
48
Above graphs show different kinds of the International Sunspot Number The left plot gives an overview from 1700 up to now from the yearly (black) and monthly smoothed Sunspot Number The graph in the right top corner shows the monthly and monthly smoothed sunspot number while the graph in the right bottom corner show the daily monthly smoothed monthly sunspot number For every the time range of investigation there is an appropriate sunspot number
832019 Ew Afgewerkte Final
httpslidepdfcomreaderfullew-afgewerkte-final 4959
49
Appendix XI Filaments and prominences
httpsohowwwnascomnasagovpickoftheweekold26feb2004
This is a picture taken by SOHO on 26 February 2004
832019 Ew Afgewerkte Final
httpslidepdfcomreaderfullew-afgewerkte-final 5059
50
Appendix XII The reconnection of magnetic loops
httpwwwioporgEJarticle0004-637X558287253575webpdfrequest-id=73e38daa-69ae-4e01-b9a6- b4bd0ba071dd
In (a) sunspot B and C have different polarity and move towards each other The twomagnetic loops will reconnect and form one big magnetic loop showed in (b) This will
happen to other magnetic loops too as can be seen in (c) When G en F are close enough they
will reconnect and so E en H will reconnect too It is possible that the magnetic field line is
trapped around another in this case AD The mass ejected from the sun will be trapped
between the magnetic field lines and form a solar prominence
832019 Ew Afgewerkte Final
httpslidepdfcomreaderfullew-afgewerkte-final 5159
832019 Ew Afgewerkte Final
httpslidepdfcomreaderfullew-afgewerkte-final 5259
52
httptheinvisibleagentwordpresscom20090117amazing-celestial-images
An group of active prominences
httpapodnasagovapodap051109html
httpwhassupinthemilkywayblogspotcom200903cloudy-planhtml
A picture taken by SOHO In the left corner you can see the prominence with twisted
magnetic field lines
832019 Ew Afgewerkte Final
httpslidepdfcomreaderfullew-afgewerkte-final 5359
53
Appendix XIV Polar crown
httpsciencenasagovheadlinesy200817sep_polarcrownhtm
Photograph of a polar crown taken on 13 June 1999 by the Meudon Observatory
832019 Ew Afgewerkte Final
httpslidepdfcomreaderfullew-afgewerkte-final 5459
54
Appendix XV Coronal holes
httpsunearthdaynasagov2007multimediagal_020php
The black segment is a huge coronal hole The bright parts are x-rays from sunspots
832019 Ew Afgewerkte Final
httpslidepdfcomreaderfullew-afgewerkte-final 5559
55
Appendix XVI Coronal mass ejection
httpzuserver2staruclacuk~idhapodap000309html
Picture of a CME taken by SOHO in February 2000
832019 Ew Afgewerkte Final
httpslidepdfcomreaderfullew-afgewerkte-final 5659
56
Bibliography
Books
BEATTY JK PETERSEN CC and CHAIKIN A The new solar system fourth edition
Cambridge University Press Cambridge 1999 421 p
COMINS NF and KAUFMANN III WJ Discovering the universe eighth edition WH
Freeman and Company New York 2008 535 p
DETHIER T Het zonnestelsel Standaard Uitgeverij 1992 415 p
GOLUB L and PASACHOFF JM Nearest star the surprising science of our sun Harvard
university press Harvard 2001 267 p
GREEN SF and JONES M H An introduction to the Sun and Stars The Open University
Cambridge 2004 373 p
HILL S and CARLOWITZ M The sun Abrams New York 2006 239 p
HOLMAN GD lsquoThe mysterious origins of solar flaresrsquo Scientific America April 2006 p
24-31 volume 294 number 4
JANSSENS J Zon en aarde een unieke relatie Garant Antwerpen 2003 254 p
KELLER H-U Van Supernovarsquos tot zwarte gaten Tirion Natuur AH Baarn 2003 169 p
LANG KR Sun earth and sky Springer Germany 1995 282 p
LILENSTEN J and BORNAREL J Sous les feux du soleil EDP Sciences Les Ulis Cedex
A 2001 247 p
832019 Ew Afgewerkte Final
httpslidepdfcomreaderfullew-afgewerkte-final 5759
57
Articles
CUYPERS J and others lsquoLa rechercheacute en heacuteliophysique en Belgiquersquo Space connection
October 2007 20 p
DE KEYSER J lsquoDe magnetopauzersquo Heelal maart 1998 p 66-73
JANSSENS J lsquoHet maximum van de 23ste zonnevlekkencyclus (I)rsquo Heelal Oktober 1998 p
256-263
JANSSENS J lsquohet maximum van de 23ste zonnenvlekkencyclus (II)rsquo Heelal November
1998 p 284-290
JANSSENS J lsquoZonnefakkelsrsquo Heelal Oktober 1994 p 256-261
SMITS F lsquoDe coronarsquo Heelal Februari 1999 p 40-42
SMITS F lsquoProtuberanzenrsquo Heelal Juli 1991 p 182-185
VAN DEN BERGHE S lsquoHet Zeemaneffectrsquo Heelal September 1998 p 228-231
832019 Ew Afgewerkte Final
httpslidepdfcomreaderfullew-afgewerkte-final 5859
58
Webography
BOEN B Birth of a coronal mass ejection Internet
(httpwwwnasagovmission_pagessolar-b solar_005html) 290408
BRAEUNIG R A Glossary Internet (httpwwwbraeunigusspaceglossaryhtm) 2006
CORDIS Researchers reveal why Suns atmosphere is hotter than its surface Internet
(httpcordiseuropaeusearchindexcfmfuseaction=newsdocumentampN_LANG=ENampN_R
CN=30598amppid=0ampq=87F36474805A6BEC0B89404F72D0351Famptype=sim) 20032009
DAY C Alfveacuten waves may heat the Sunrsquos corona Internet
(httpblogsphysicstodayorgupdate200903 alfven-waves-may-heat-the-sunshtml)
310309
ELLERMAN F Solar prominences Internet (httparticlesadsabsharvardedufull
1928ASPL173E 0000074000html) (03042009)
ENCYCLODPEDIA OF SCIENCE Corona hole Internet
(httpwwwdaviddarlinginfoencyclopediaC coronal_holehtml) (04042009)
HATHAWAY D H The sunspot cycle Internet
(httpspacesciencespacerefcomsslpadsolarsunspots htm) 04012000
JANSSENS J The case of the missing solar cycle (published in lsquoheelalrsquo January 2008)
Internet (httpuserstelenetbejjanssensMSCwebEngpdf)
KNISELY D Solar prominences Internet
(httpwwwicstarscomHTMLSolarSectionHAlphaOBSERVINGTHESUNHAlpha3html)
(03042009)
KOPANSKI J Atom Internet (httpknolgooglecomkjan-
kopanskiatom1amrwrct7rvi27) 060209
MARTENS PC and ZWAAN C Origin and evolution of filament-prominence systems
Internet (http wwwioporgEJarticle0004-637X558287253575webpdfrequest-
id=73e38daa-69ae-4e01-b9a6-b4bd0ba071dd) 092001
NASA The corona Internet (httpsolarsciencemsfcnasagovcoronashtml) 180107
NASA The heliosphere Internet (httpheliosgsfcnasagovheliosphhtml) 20012009
OFFICIAL SITE OF STONEHENGE About Stonehenge Internet
(httpwwwstonehengecouk) (03022009)
OTTERSDORF M Astronomy On the sunspot cycle Internet
(httpuserszoominternetnet~matto MCASsunspot_cyclehtmZeemaneffect) 031103
PARIAT E and SCHMIEDER B Magnetic flux emergence Internet(httpwwwscholarpediaorgarticleMagnetic_field_emergence) 18042008
832019 Ew Afgewerkte Final
httpslidepdfcomreaderfullew-afgewerkte-final 5959
59
PRIEST E R Dynamics and Structure of Quiescent Solar Prominences Internet
(httpbooksgooglebe booksid=h599q3jz1w4Campdq=quiescent+prominencesampprintsec=fro
ntcoverampsource=blampots=58b79Qeyabampsig=1eklQ-
WszOIebZZaq7fq7gm6bxAamphl=nlampei=urPtSe7ZCo61-
Qa166jHDwampsa=Xampoi=book_resultampct=result ampresnum=3PPA6M2) 1989
RUSSELL R Rotation of the sun Internet
(httpwwwwindowsucaredutourlink=sunSolar_interior
Sun_layersdifferential_rotationhtml) 16082005
RUSSELL R Sunspots and magnetic fields Internet
(httpwwwwindowsucaredutourlink=sunatmospheresunspot_magnetismhtmlampedu=hig
h) 060908
UNIVERSITY OF GLASGOW Bibliography of Peter Sweet Internet
(httpwwwuniversitystoryglaacuk biographyid=WH2144amptype=P) (10042009)
WIKIPEDIA Orbiting Solar Observatory Internet
(httpenwikipediaorgwikiOrbiting_Solar_Observatory) 24012009
WINDOWS TEAM Maunderrsquos Butterfly Diagram Internet
(httpwwwwindowsucaredutourlink=sun activitybutterflyhtml) 2000
832019 Ew Afgewerkte Final
httpslidepdfcomreaderfullew-afgewerkte-final 4659
46
We use the raw Wolf number from all observatories that have provided counts early in theday ie before 1230 UT Typically there is between 10 and 20 stations available Thecalculation of the EISN is based on a simple and straightforward statistical method The Wolfnumbers are multiplied with the yearly mean K factor (see paragraph about the personalreduction coefficient K) The EISN is a simple average of the K-scaled values after excludingany individual value that deviates abnormally from the other valuesOnce the Provisional ISN (PISN) is calculated after the end of a month the temporary EISNis dropped and replaced by the PISN
The provisional sunspot Index
The Provisional ISN (PISN) is calculated and issued on the first of every month Theoutcome is a daily total and hemispheric sunspot number for the entire elapsed month Anexample on the first of September we calculate the daily PISN for each day of August ThePISN is computed semi-automatically with as little manual intervention as possibleTo calculate the PISN values for the concerned month we use all Wolf numbers Typicallythere is data from around 65 stations available
The calculation of the PISN is based on an extensive statistical treatment This treatmentfilters out any abnormal daily observation or the complete data set from an erratic station(quality control) This prevents long-term drifts in the resulting index One of the key elementsderived from this processing is to update the K reduction coefficients for each station theevolution of each station is monitored for each day relative to the entire networkA subset of the contributing stations also provides hemispheric counts A similar process isapplied to the North and South counts to derive the hemispheric PISN There is an additionalconstraint the sum of the North and South ISN must match the total ISNThe PISN replaces the EISN And once the Definitive ISN (DISN) is calculated the DISNreplaces the PISN
The definitive sunspot index
The Definitive ISN is calculated and issued on a quarterly basis when we have collecteddata from all the contributing observatories This is the final index and it is appended to thehistorical sunspot index time series The same semi-automated treatment as for the PISN isnow applied to the full data set If the result agrees within 5 of the PISN value the PISN iskept and becomes definitive Otherwise the new calculated value replaces the PISN andbecomes the definitive ISNIt is only at this stage and only in peculiar situations that a manual verification by ourscientific staff is required For example this happens when the observed raw Wolf valuesfrom the whole network are clustered around two distinct values This special case can becaused by small short-lived isolated sunspots (lifetimes lt 24 hours) or by the appearance ordisappearance of a large group at the solar limb in the course of one UT dayThe DISN replaces the provisional and estimated International Sunspot Number
Handling very low activity levels
One of the situations requiring a human arbitration is associated with single small isolatedand short-lived sunspots This is most noticeable around the minimum of the solar activitycycle like the one occurring now in 2008 Due to the 24hour binning (observations aregrouped between 0hUT and 24hUT) and the variable ability of each observer to detect thesmallest sunspots we end up with some stations reporting one sunspot and others who didno see any sunspot Let us explain further No sunspot may mean that the sunspot waspresent but the observer was unable to see it because of poor observational conditions such
as weather a small telescope On the other hand it may also indicate that the sunspot hadactually vanished by that time while it was present earlier on the same day
832019 Ew Afgewerkte Final
httpslidepdfcomreaderfullew-afgewerkte-final 4759
47
Individual stations do not observe at exactly the same timeIn order to validate the existence of such a marginal reported sunspot a qualified SIDCscientist must then check the detailed chronology within that day and consider the overallobserver capability (value of K coefficient)In common practice the fact that a sunspot is reported by a significant group of observersleads to the inclusion of the sunspot on that date thus neglecting the no-sunspotobservationsThe rationale is multiple observations of a sunspot exclude the possibility that the reportedsunspot was an independent false detection So a sunspot was really present on that dayalthough it may have existed only for part of the day or it was small enough to be missed bypart of the observers with smaller instruments or imperfect atmospheric conditionsAlso keep in mind that the sunspot index is derived with a limited precision just like any otherindex If the monthly mean sunspot number is 0 or 05 you can definitely say that activitywas low
What index should be used
If you want to perform long-term investigations the definitive ISN series is definitely the mostsuitable However there is a delay of a few months So when investigating the last cycle andrecent evolution use the definitive numbers in combination with the provisional ISN to be upto date to the last month The provisional numbers are also used in models forecasting thesunspot number for the coming months Now if you need a proxy for solar activity in a modelthat runs in real-time then you may use the estimated ISNImprovements and rethinking of the processing method is an ongoing project We arecurrently developing an alternative program for calculating the PISN Of course long-termconsistency is vital Therefore a cross-analysis between the output from the old and newsoftware must be applied over an extended period
832019 Ew Afgewerkte Final
httpslidepdfcomreaderfullew-afgewerkte-final 4859
48
Above graphs show different kinds of the International Sunspot Number The left plot gives an overview from 1700 up to now from the yearly (black) and monthly smoothed Sunspot Number The graph in the right top corner shows the monthly and monthly smoothed sunspot number while the graph in the right bottom corner show the daily monthly smoothed monthly sunspot number For every the time range of investigation there is an appropriate sunspot number
832019 Ew Afgewerkte Final
httpslidepdfcomreaderfullew-afgewerkte-final 4959
49
Appendix XI Filaments and prominences
httpsohowwwnascomnasagovpickoftheweekold26feb2004
This is a picture taken by SOHO on 26 February 2004
832019 Ew Afgewerkte Final
httpslidepdfcomreaderfullew-afgewerkte-final 5059
50
Appendix XII The reconnection of magnetic loops
httpwwwioporgEJarticle0004-637X558287253575webpdfrequest-id=73e38daa-69ae-4e01-b9a6- b4bd0ba071dd
In (a) sunspot B and C have different polarity and move towards each other The twomagnetic loops will reconnect and form one big magnetic loop showed in (b) This will
happen to other magnetic loops too as can be seen in (c) When G en F are close enough they
will reconnect and so E en H will reconnect too It is possible that the magnetic field line is
trapped around another in this case AD The mass ejected from the sun will be trapped
between the magnetic field lines and form a solar prominence
832019 Ew Afgewerkte Final
httpslidepdfcomreaderfullew-afgewerkte-final 5159
832019 Ew Afgewerkte Final
httpslidepdfcomreaderfullew-afgewerkte-final 5259
52
httptheinvisibleagentwordpresscom20090117amazing-celestial-images
An group of active prominences
httpapodnasagovapodap051109html
httpwhassupinthemilkywayblogspotcom200903cloudy-planhtml
A picture taken by SOHO In the left corner you can see the prominence with twisted
magnetic field lines
832019 Ew Afgewerkte Final
httpslidepdfcomreaderfullew-afgewerkte-final 5359
53
Appendix XIV Polar crown
httpsciencenasagovheadlinesy200817sep_polarcrownhtm
Photograph of a polar crown taken on 13 June 1999 by the Meudon Observatory
832019 Ew Afgewerkte Final
httpslidepdfcomreaderfullew-afgewerkte-final 5459
54
Appendix XV Coronal holes
httpsunearthdaynasagov2007multimediagal_020php
The black segment is a huge coronal hole The bright parts are x-rays from sunspots
832019 Ew Afgewerkte Final
httpslidepdfcomreaderfullew-afgewerkte-final 5559
55
Appendix XVI Coronal mass ejection
httpzuserver2staruclacuk~idhapodap000309html
Picture of a CME taken by SOHO in February 2000
832019 Ew Afgewerkte Final
httpslidepdfcomreaderfullew-afgewerkte-final 5659
56
Bibliography
Books
BEATTY JK PETERSEN CC and CHAIKIN A The new solar system fourth edition
Cambridge University Press Cambridge 1999 421 p
COMINS NF and KAUFMANN III WJ Discovering the universe eighth edition WH
Freeman and Company New York 2008 535 p
DETHIER T Het zonnestelsel Standaard Uitgeverij 1992 415 p
GOLUB L and PASACHOFF JM Nearest star the surprising science of our sun Harvard
university press Harvard 2001 267 p
GREEN SF and JONES M H An introduction to the Sun and Stars The Open University
Cambridge 2004 373 p
HILL S and CARLOWITZ M The sun Abrams New York 2006 239 p
HOLMAN GD lsquoThe mysterious origins of solar flaresrsquo Scientific America April 2006 p
24-31 volume 294 number 4
JANSSENS J Zon en aarde een unieke relatie Garant Antwerpen 2003 254 p
KELLER H-U Van Supernovarsquos tot zwarte gaten Tirion Natuur AH Baarn 2003 169 p
LANG KR Sun earth and sky Springer Germany 1995 282 p
LILENSTEN J and BORNAREL J Sous les feux du soleil EDP Sciences Les Ulis Cedex
A 2001 247 p
832019 Ew Afgewerkte Final
httpslidepdfcomreaderfullew-afgewerkte-final 5759
57
Articles
CUYPERS J and others lsquoLa rechercheacute en heacuteliophysique en Belgiquersquo Space connection
October 2007 20 p
DE KEYSER J lsquoDe magnetopauzersquo Heelal maart 1998 p 66-73
JANSSENS J lsquoHet maximum van de 23ste zonnevlekkencyclus (I)rsquo Heelal Oktober 1998 p
256-263
JANSSENS J lsquohet maximum van de 23ste zonnenvlekkencyclus (II)rsquo Heelal November
1998 p 284-290
JANSSENS J lsquoZonnefakkelsrsquo Heelal Oktober 1994 p 256-261
SMITS F lsquoDe coronarsquo Heelal Februari 1999 p 40-42
SMITS F lsquoProtuberanzenrsquo Heelal Juli 1991 p 182-185
VAN DEN BERGHE S lsquoHet Zeemaneffectrsquo Heelal September 1998 p 228-231
832019 Ew Afgewerkte Final
httpslidepdfcomreaderfullew-afgewerkte-final 5859
58
Webography
BOEN B Birth of a coronal mass ejection Internet
(httpwwwnasagovmission_pagessolar-b solar_005html) 290408
BRAEUNIG R A Glossary Internet (httpwwwbraeunigusspaceglossaryhtm) 2006
CORDIS Researchers reveal why Suns atmosphere is hotter than its surface Internet
(httpcordiseuropaeusearchindexcfmfuseaction=newsdocumentampN_LANG=ENampN_R
CN=30598amppid=0ampq=87F36474805A6BEC0B89404F72D0351Famptype=sim) 20032009
DAY C Alfveacuten waves may heat the Sunrsquos corona Internet
(httpblogsphysicstodayorgupdate200903 alfven-waves-may-heat-the-sunshtml)
310309
ELLERMAN F Solar prominences Internet (httparticlesadsabsharvardedufull
1928ASPL173E 0000074000html) (03042009)
ENCYCLODPEDIA OF SCIENCE Corona hole Internet
(httpwwwdaviddarlinginfoencyclopediaC coronal_holehtml) (04042009)
HATHAWAY D H The sunspot cycle Internet
(httpspacesciencespacerefcomsslpadsolarsunspots htm) 04012000
JANSSENS J The case of the missing solar cycle (published in lsquoheelalrsquo January 2008)
Internet (httpuserstelenetbejjanssensMSCwebEngpdf)
KNISELY D Solar prominences Internet
(httpwwwicstarscomHTMLSolarSectionHAlphaOBSERVINGTHESUNHAlpha3html)
(03042009)
KOPANSKI J Atom Internet (httpknolgooglecomkjan-
kopanskiatom1amrwrct7rvi27) 060209
MARTENS PC and ZWAAN C Origin and evolution of filament-prominence systems
Internet (http wwwioporgEJarticle0004-637X558287253575webpdfrequest-
id=73e38daa-69ae-4e01-b9a6-b4bd0ba071dd) 092001
NASA The corona Internet (httpsolarsciencemsfcnasagovcoronashtml) 180107
NASA The heliosphere Internet (httpheliosgsfcnasagovheliosphhtml) 20012009
OFFICIAL SITE OF STONEHENGE About Stonehenge Internet
(httpwwwstonehengecouk) (03022009)
OTTERSDORF M Astronomy On the sunspot cycle Internet
(httpuserszoominternetnet~matto MCASsunspot_cyclehtmZeemaneffect) 031103
PARIAT E and SCHMIEDER B Magnetic flux emergence Internet(httpwwwscholarpediaorgarticleMagnetic_field_emergence) 18042008
832019 Ew Afgewerkte Final
httpslidepdfcomreaderfullew-afgewerkte-final 5959
59
PRIEST E R Dynamics and Structure of Quiescent Solar Prominences Internet
(httpbooksgooglebe booksid=h599q3jz1w4Campdq=quiescent+prominencesampprintsec=fro
ntcoverampsource=blampots=58b79Qeyabampsig=1eklQ-
WszOIebZZaq7fq7gm6bxAamphl=nlampei=urPtSe7ZCo61-
Qa166jHDwampsa=Xampoi=book_resultampct=result ampresnum=3PPA6M2) 1989
RUSSELL R Rotation of the sun Internet
(httpwwwwindowsucaredutourlink=sunSolar_interior
Sun_layersdifferential_rotationhtml) 16082005
RUSSELL R Sunspots and magnetic fields Internet
(httpwwwwindowsucaredutourlink=sunatmospheresunspot_magnetismhtmlampedu=hig
h) 060908
UNIVERSITY OF GLASGOW Bibliography of Peter Sweet Internet
(httpwwwuniversitystoryglaacuk biographyid=WH2144amptype=P) (10042009)
WIKIPEDIA Orbiting Solar Observatory Internet
(httpenwikipediaorgwikiOrbiting_Solar_Observatory) 24012009
WINDOWS TEAM Maunderrsquos Butterfly Diagram Internet
(httpwwwwindowsucaredutourlink=sun activitybutterflyhtml) 2000

832019 Ew Afgewerkte Final
httpslidepdfcomreaderfullew-afgewerkte-final 4759
47
Individual stations do not observe at exactly the same timeIn order to validate the existence of such a marginal reported sunspot a qualified SIDCscientist must then check the detailed chronology within that day and consider the overallobserver capability (value of K coefficient)In common practice the fact that a sunspot is reported by a significant group of observersleads to the inclusion of the sunspot on that date thus neglecting the no-sunspotobservationsThe rationale is multiple observations of a sunspot exclude the possibility that the reportedsunspot was an independent false detection So a sunspot was really present on that dayalthough it may have existed only for part of the day or it was small enough to be missed bypart of the observers with smaller instruments or imperfect atmospheric conditionsAlso keep in mind that the sunspot index is derived with a limited precision just like any otherindex If the monthly mean sunspot number is 0 or 05 you can definitely say that activitywas low
What index should be used
If you want to perform long-term investigations the definitive ISN series is definitely the mostsuitable However there is a delay of a few months So when investigating the last cycle andrecent evolution use the definitive numbers in combination with the provisional ISN to be upto date to the last month The provisional numbers are also used in models forecasting thesunspot number for the coming months Now if you need a proxy for solar activity in a modelthat runs in real-time then you may use the estimated ISNImprovements and rethinking of the processing method is an ongoing project We arecurrently developing an alternative program for calculating the PISN Of course long-termconsistency is vital Therefore a cross-analysis between the output from the old and newsoftware must be applied over an extended period
832019 Ew Afgewerkte Final
httpslidepdfcomreaderfullew-afgewerkte-final 4859
48
Above graphs show different kinds of the International Sunspot Number The left plot gives an overview from 1700 up to now from the yearly (black) and monthly smoothed Sunspot Number The graph in the right top corner shows the monthly and monthly smoothed sunspot number while the graph in the right bottom corner show the daily monthly smoothed monthly sunspot number For every the time range of investigation there is an appropriate sunspot number
832019 Ew Afgewerkte Final
httpslidepdfcomreaderfullew-afgewerkte-final 4959
49
Appendix XI Filaments and prominences
httpsohowwwnascomnasagovpickoftheweekold26feb2004
This is a picture taken by SOHO on 26 February 2004
832019 Ew Afgewerkte Final
httpslidepdfcomreaderfullew-afgewerkte-final 5059
50
Appendix XII The reconnection of magnetic loops
httpwwwioporgEJarticle0004-637X558287253575webpdfrequest-id=73e38daa-69ae-4e01-b9a6- b4bd0ba071dd
In (a) sunspot B and C have different polarity and move towards each other The twomagnetic loops will reconnect and form one big magnetic loop showed in (b) This will
happen to other magnetic loops too as can be seen in (c) When G en F are close enough they
will reconnect and so E en H will reconnect too It is possible that the magnetic field line is
trapped around another in this case AD The mass ejected from the sun will be trapped
between the magnetic field lines and form a solar prominence
832019 Ew Afgewerkte Final
httpslidepdfcomreaderfullew-afgewerkte-final 5159
832019 Ew Afgewerkte Final
httpslidepdfcomreaderfullew-afgewerkte-final 5259
52
httptheinvisibleagentwordpresscom20090117amazing-celestial-images
An group of active prominences
httpapodnasagovapodap051109html
httpwhassupinthemilkywayblogspotcom200903cloudy-planhtml
A picture taken by SOHO In the left corner you can see the prominence with twisted
magnetic field lines
832019 Ew Afgewerkte Final
httpslidepdfcomreaderfullew-afgewerkte-final 5359
53
Appendix XIV Polar crown
httpsciencenasagovheadlinesy200817sep_polarcrownhtm
Photograph of a polar crown taken on 13 June 1999 by the Meudon Observatory
832019 Ew Afgewerkte Final
httpslidepdfcomreaderfullew-afgewerkte-final 5459
54
Appendix XV Coronal holes
httpsunearthdaynasagov2007multimediagal_020php
The black segment is a huge coronal hole The bright parts are x-rays from sunspots
832019 Ew Afgewerkte Final
httpslidepdfcomreaderfullew-afgewerkte-final 5559
55
Appendix XVI Coronal mass ejection
httpzuserver2staruclacuk~idhapodap000309html
Picture of a CME taken by SOHO in February 2000
832019 Ew Afgewerkte Final
httpslidepdfcomreaderfullew-afgewerkte-final 5659
56
Bibliography
Books
BEATTY JK PETERSEN CC and CHAIKIN A The new solar system fourth edition
Cambridge University Press Cambridge 1999 421 p
COMINS NF and KAUFMANN III WJ Discovering the universe eighth edition WH
Freeman and Company New York 2008 535 p
DETHIER T Het zonnestelsel Standaard Uitgeverij 1992 415 p
GOLUB L and PASACHOFF JM Nearest star the surprising science of our sun Harvard
university press Harvard 2001 267 p
GREEN SF and JONES M H An introduction to the Sun and Stars The Open University
Cambridge 2004 373 p
HILL S and CARLOWITZ M The sun Abrams New York 2006 239 p
HOLMAN GD lsquoThe mysterious origins of solar flaresrsquo Scientific America April 2006 p
24-31 volume 294 number 4
JANSSENS J Zon en aarde een unieke relatie Garant Antwerpen 2003 254 p
KELLER H-U Van Supernovarsquos tot zwarte gaten Tirion Natuur AH Baarn 2003 169 p
LANG KR Sun earth and sky Springer Germany 1995 282 p
LILENSTEN J and BORNAREL J Sous les feux du soleil EDP Sciences Les Ulis Cedex
A 2001 247 p
832019 Ew Afgewerkte Final
httpslidepdfcomreaderfullew-afgewerkte-final 5759
57
Articles
CUYPERS J and others lsquoLa rechercheacute en heacuteliophysique en Belgiquersquo Space connection
October 2007 20 p
DE KEYSER J lsquoDe magnetopauzersquo Heelal maart 1998 p 66-73
JANSSENS J lsquoHet maximum van de 23ste zonnevlekkencyclus (I)rsquo Heelal Oktober 1998 p
256-263
JANSSENS J lsquohet maximum van de 23ste zonnenvlekkencyclus (II)rsquo Heelal November
1998 p 284-290
JANSSENS J lsquoZonnefakkelsrsquo Heelal Oktober 1994 p 256-261
SMITS F lsquoDe coronarsquo Heelal Februari 1999 p 40-42
SMITS F lsquoProtuberanzenrsquo Heelal Juli 1991 p 182-185
VAN DEN BERGHE S lsquoHet Zeemaneffectrsquo Heelal September 1998 p 228-231
832019 Ew Afgewerkte Final
httpslidepdfcomreaderfullew-afgewerkte-final 5859
58
Webography
BOEN B Birth of a coronal mass ejection Internet
(httpwwwnasagovmission_pagessolar-b solar_005html) 290408
BRAEUNIG R A Glossary Internet (httpwwwbraeunigusspaceglossaryhtm) 2006
CORDIS Researchers reveal why Suns atmosphere is hotter than its surface Internet
(httpcordiseuropaeusearchindexcfmfuseaction=newsdocumentampN_LANG=ENampN_R
CN=30598amppid=0ampq=87F36474805A6BEC0B89404F72D0351Famptype=sim) 20032009
DAY C Alfveacuten waves may heat the Sunrsquos corona Internet
(httpblogsphysicstodayorgupdate200903 alfven-waves-may-heat-the-sunshtml)
310309
ELLERMAN F Solar prominences Internet (httparticlesadsabsharvardedufull
1928ASPL173E 0000074000html) (03042009)
ENCYCLODPEDIA OF SCIENCE Corona hole Internet
(httpwwwdaviddarlinginfoencyclopediaC coronal_holehtml) (04042009)
HATHAWAY D H The sunspot cycle Internet
(httpspacesciencespacerefcomsslpadsolarsunspots htm) 04012000
JANSSENS J The case of the missing solar cycle (published in lsquoheelalrsquo January 2008)
Internet (httpuserstelenetbejjanssensMSCwebEngpdf)
KNISELY D Solar prominences Internet
(httpwwwicstarscomHTMLSolarSectionHAlphaOBSERVINGTHESUNHAlpha3html)
(03042009)
KOPANSKI J Atom Internet (httpknolgooglecomkjan-
kopanskiatom1amrwrct7rvi27) 060209
MARTENS PC and ZWAAN C Origin and evolution of filament-prominence systems
Internet (http wwwioporgEJarticle0004-637X558287253575webpdfrequest-
id=73e38daa-69ae-4e01-b9a6-b4bd0ba071dd) 092001
NASA The corona Internet (httpsolarsciencemsfcnasagovcoronashtml) 180107
NASA The heliosphere Internet (httpheliosgsfcnasagovheliosphhtml) 20012009
OFFICIAL SITE OF STONEHENGE About Stonehenge Internet
(httpwwwstonehengecouk) (03022009)
OTTERSDORF M Astronomy On the sunspot cycle Internet
(httpuserszoominternetnet~matto MCASsunspot_cyclehtmZeemaneffect) 031103
PARIAT E and SCHMIEDER B Magnetic flux emergence Internet(httpwwwscholarpediaorgarticleMagnetic_field_emergence) 18042008
832019 Ew Afgewerkte Final
httpslidepdfcomreaderfullew-afgewerkte-final 5959
59
PRIEST E R Dynamics and Structure of Quiescent Solar Prominences Internet
(httpbooksgooglebe booksid=h599q3jz1w4Campdq=quiescent+prominencesampprintsec=fro
ntcoverampsource=blampots=58b79Qeyabampsig=1eklQ-
WszOIebZZaq7fq7gm6bxAamphl=nlampei=urPtSe7ZCo61-
Qa166jHDwampsa=Xampoi=book_resultampct=result ampresnum=3PPA6M2) 1989
RUSSELL R Rotation of the sun Internet
(httpwwwwindowsucaredutourlink=sunSolar_interior
Sun_layersdifferential_rotationhtml) 16082005
RUSSELL R Sunspots and magnetic fields Internet
(httpwwwwindowsucaredutourlink=sunatmospheresunspot_magnetismhtmlampedu=hig
h) 060908
UNIVERSITY OF GLASGOW Bibliography of Peter Sweet Internet
(httpwwwuniversitystoryglaacuk biographyid=WH2144amptype=P) (10042009)
WIKIPEDIA Orbiting Solar Observatory Internet
(httpenwikipediaorgwikiOrbiting_Solar_Observatory) 24012009
WINDOWS TEAM Maunderrsquos Butterfly Diagram Internet
(httpwwwwindowsucaredutourlink=sun activitybutterflyhtml) 2000
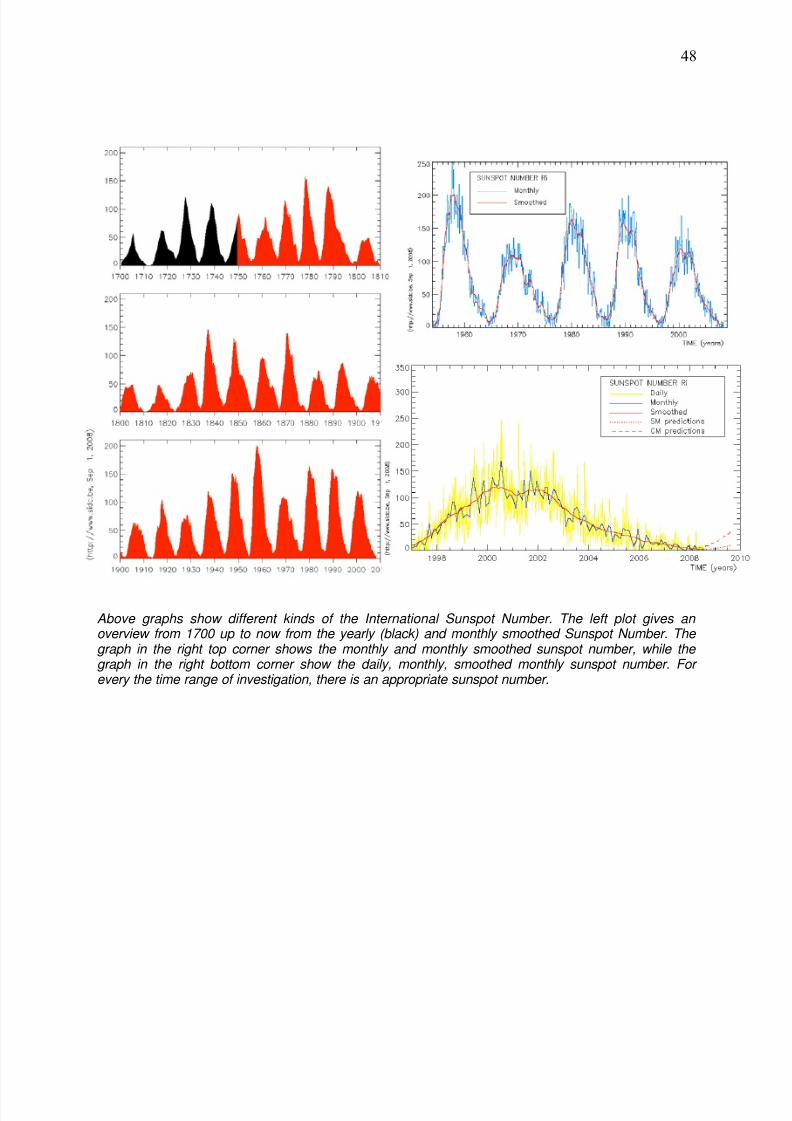
832019 Ew Afgewerkte Final
httpslidepdfcomreaderfullew-afgewerkte-final 4859
48
Above graphs show different kinds of the International Sunspot Number The left plot gives an overview from 1700 up to now from the yearly (black) and monthly smoothed Sunspot Number The graph in the right top corner shows the monthly and monthly smoothed sunspot number while the graph in the right bottom corner show the daily monthly smoothed monthly sunspot number For every the time range of investigation there is an appropriate sunspot number
832019 Ew Afgewerkte Final
httpslidepdfcomreaderfullew-afgewerkte-final 4959
49
Appendix XI Filaments and prominences
httpsohowwwnascomnasagovpickoftheweekold26feb2004
This is a picture taken by SOHO on 26 February 2004
832019 Ew Afgewerkte Final
httpslidepdfcomreaderfullew-afgewerkte-final 5059
50
Appendix XII The reconnection of magnetic loops
httpwwwioporgEJarticle0004-637X558287253575webpdfrequest-id=73e38daa-69ae-4e01-b9a6- b4bd0ba071dd
In (a) sunspot B and C have different polarity and move towards each other The twomagnetic loops will reconnect and form one big magnetic loop showed in (b) This will
happen to other magnetic loops too as can be seen in (c) When G en F are close enough they
will reconnect and so E en H will reconnect too It is possible that the magnetic field line is
trapped around another in this case AD The mass ejected from the sun will be trapped
between the magnetic field lines and form a solar prominence
832019 Ew Afgewerkte Final
httpslidepdfcomreaderfullew-afgewerkte-final 5159
832019 Ew Afgewerkte Final
httpslidepdfcomreaderfullew-afgewerkte-final 5259
52
httptheinvisibleagentwordpresscom20090117amazing-celestial-images
An group of active prominences
httpapodnasagovapodap051109html
httpwhassupinthemilkywayblogspotcom200903cloudy-planhtml
A picture taken by SOHO In the left corner you can see the prominence with twisted
magnetic field lines
832019 Ew Afgewerkte Final
httpslidepdfcomreaderfullew-afgewerkte-final 5359
53
Appendix XIV Polar crown
httpsciencenasagovheadlinesy200817sep_polarcrownhtm
Photograph of a polar crown taken on 13 June 1999 by the Meudon Observatory
832019 Ew Afgewerkte Final
httpslidepdfcomreaderfullew-afgewerkte-final 5459
54
Appendix XV Coronal holes
httpsunearthdaynasagov2007multimediagal_020php
The black segment is a huge coronal hole The bright parts are x-rays from sunspots
832019 Ew Afgewerkte Final
httpslidepdfcomreaderfullew-afgewerkte-final 5559
55
Appendix XVI Coronal mass ejection
httpzuserver2staruclacuk~idhapodap000309html
Picture of a CME taken by SOHO in February 2000
832019 Ew Afgewerkte Final
httpslidepdfcomreaderfullew-afgewerkte-final 5659
56
Bibliography
Books
BEATTY JK PETERSEN CC and CHAIKIN A The new solar system fourth edition
Cambridge University Press Cambridge 1999 421 p
COMINS NF and KAUFMANN III WJ Discovering the universe eighth edition WH
Freeman and Company New York 2008 535 p
DETHIER T Het zonnestelsel Standaard Uitgeverij 1992 415 p
GOLUB L and PASACHOFF JM Nearest star the surprising science of our sun Harvard
university press Harvard 2001 267 p
GREEN SF and JONES M H An introduction to the Sun and Stars The Open University
Cambridge 2004 373 p
HILL S and CARLOWITZ M The sun Abrams New York 2006 239 p
HOLMAN GD lsquoThe mysterious origins of solar flaresrsquo Scientific America April 2006 p
24-31 volume 294 number 4
JANSSENS J Zon en aarde een unieke relatie Garant Antwerpen 2003 254 p
KELLER H-U Van Supernovarsquos tot zwarte gaten Tirion Natuur AH Baarn 2003 169 p
LANG KR Sun earth and sky Springer Germany 1995 282 p
LILENSTEN J and BORNAREL J Sous les feux du soleil EDP Sciences Les Ulis Cedex
A 2001 247 p
832019 Ew Afgewerkte Final
httpslidepdfcomreaderfullew-afgewerkte-final 5759
57
Articles
CUYPERS J and others lsquoLa rechercheacute en heacuteliophysique en Belgiquersquo Space connection
October 2007 20 p
DE KEYSER J lsquoDe magnetopauzersquo Heelal maart 1998 p 66-73
JANSSENS J lsquoHet maximum van de 23ste zonnevlekkencyclus (I)rsquo Heelal Oktober 1998 p
256-263
JANSSENS J lsquohet maximum van de 23ste zonnenvlekkencyclus (II)rsquo Heelal November
1998 p 284-290
JANSSENS J lsquoZonnefakkelsrsquo Heelal Oktober 1994 p 256-261
SMITS F lsquoDe coronarsquo Heelal Februari 1999 p 40-42
SMITS F lsquoProtuberanzenrsquo Heelal Juli 1991 p 182-185
VAN DEN BERGHE S lsquoHet Zeemaneffectrsquo Heelal September 1998 p 228-231
832019 Ew Afgewerkte Final
httpslidepdfcomreaderfullew-afgewerkte-final 5859
58
Webography
BOEN B Birth of a coronal mass ejection Internet
(httpwwwnasagovmission_pagessolar-b solar_005html) 290408
BRAEUNIG R A Glossary Internet (httpwwwbraeunigusspaceglossaryhtm) 2006
CORDIS Researchers reveal why Suns atmosphere is hotter than its surface Internet
(httpcordiseuropaeusearchindexcfmfuseaction=newsdocumentampN_LANG=ENampN_R
CN=30598amppid=0ampq=87F36474805A6BEC0B89404F72D0351Famptype=sim) 20032009
DAY C Alfveacuten waves may heat the Sunrsquos corona Internet
(httpblogsphysicstodayorgupdate200903 alfven-waves-may-heat-the-sunshtml)
310309
ELLERMAN F Solar prominences Internet (httparticlesadsabsharvardedufull
1928ASPL173E 0000074000html) (03042009)
ENCYCLODPEDIA OF SCIENCE Corona hole Internet
(httpwwwdaviddarlinginfoencyclopediaC coronal_holehtml) (04042009)
HATHAWAY D H The sunspot cycle Internet
(httpspacesciencespacerefcomsslpadsolarsunspots htm) 04012000
JANSSENS J The case of the missing solar cycle (published in lsquoheelalrsquo January 2008)
Internet (httpuserstelenetbejjanssensMSCwebEngpdf)
KNISELY D Solar prominences Internet
(httpwwwicstarscomHTMLSolarSectionHAlphaOBSERVINGTHESUNHAlpha3html)
(03042009)
KOPANSKI J Atom Internet (httpknolgooglecomkjan-
kopanskiatom1amrwrct7rvi27) 060209
MARTENS PC and ZWAAN C Origin and evolution of filament-prominence systems
Internet (http wwwioporgEJarticle0004-637X558287253575webpdfrequest-
id=73e38daa-69ae-4e01-b9a6-b4bd0ba071dd) 092001
NASA The corona Internet (httpsolarsciencemsfcnasagovcoronashtml) 180107
NASA The heliosphere Internet (httpheliosgsfcnasagovheliosphhtml) 20012009
OFFICIAL SITE OF STONEHENGE About Stonehenge Internet
(httpwwwstonehengecouk) (03022009)
OTTERSDORF M Astronomy On the sunspot cycle Internet
(httpuserszoominternetnet~matto MCASsunspot_cyclehtmZeemaneffect) 031103
PARIAT E and SCHMIEDER B Magnetic flux emergence Internet(httpwwwscholarpediaorgarticleMagnetic_field_emergence) 18042008
832019 Ew Afgewerkte Final
httpslidepdfcomreaderfullew-afgewerkte-final 5959
59
PRIEST E R Dynamics and Structure of Quiescent Solar Prominences Internet
(httpbooksgooglebe booksid=h599q3jz1w4Campdq=quiescent+prominencesampprintsec=fro
ntcoverampsource=blampots=58b79Qeyabampsig=1eklQ-
WszOIebZZaq7fq7gm6bxAamphl=nlampei=urPtSe7ZCo61-
Qa166jHDwampsa=Xampoi=book_resultampct=result ampresnum=3PPA6M2) 1989
RUSSELL R Rotation of the sun Internet
(httpwwwwindowsucaredutourlink=sunSolar_interior
Sun_layersdifferential_rotationhtml) 16082005
RUSSELL R Sunspots and magnetic fields Internet
(httpwwwwindowsucaredutourlink=sunatmospheresunspot_magnetismhtmlampedu=hig
h) 060908
UNIVERSITY OF GLASGOW Bibliography of Peter Sweet Internet
(httpwwwuniversitystoryglaacuk biographyid=WH2144amptype=P) (10042009)
WIKIPEDIA Orbiting Solar Observatory Internet
(httpenwikipediaorgwikiOrbiting_Solar_Observatory) 24012009
WINDOWS TEAM Maunderrsquos Butterfly Diagram Internet
(httpwwwwindowsucaredutourlink=sun activitybutterflyhtml) 2000
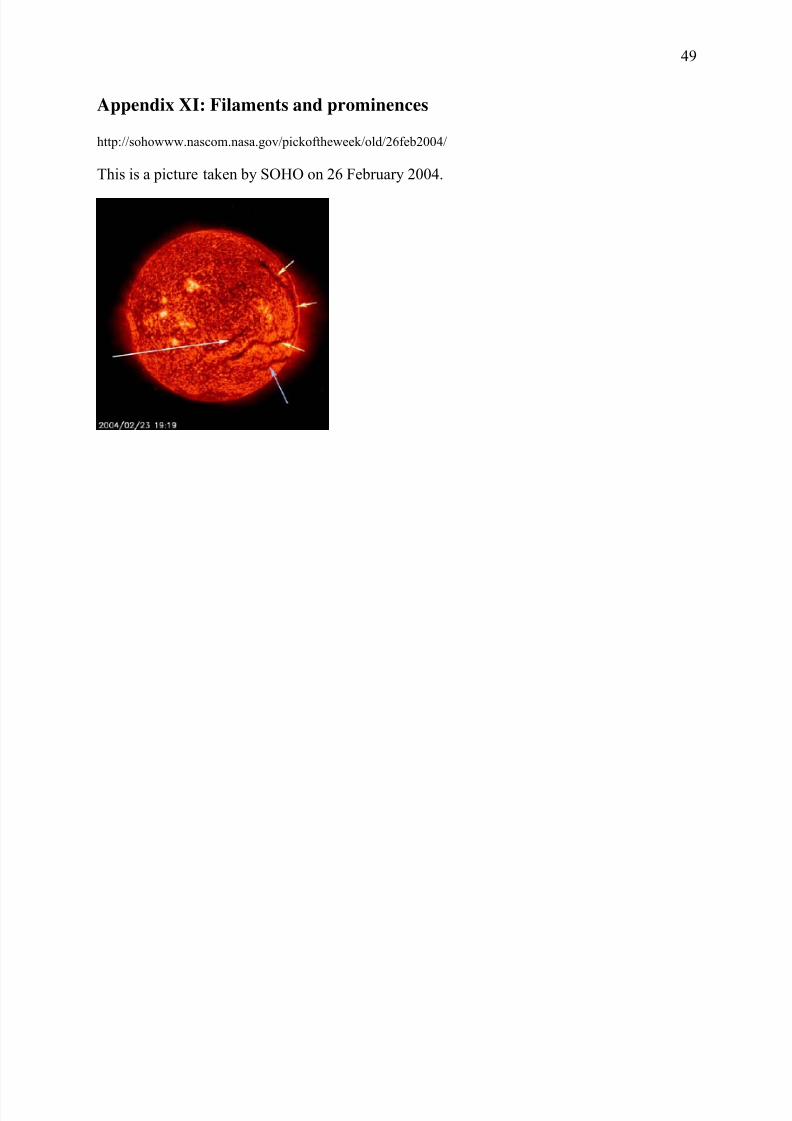
832019 Ew Afgewerkte Final
httpslidepdfcomreaderfullew-afgewerkte-final 4959
49
Appendix XI Filaments and prominences
httpsohowwwnascomnasagovpickoftheweekold26feb2004
This is a picture taken by SOHO on 26 February 2004
832019 Ew Afgewerkte Final
httpslidepdfcomreaderfullew-afgewerkte-final 5059
50
Appendix XII The reconnection of magnetic loops
httpwwwioporgEJarticle0004-637X558287253575webpdfrequest-id=73e38daa-69ae-4e01-b9a6- b4bd0ba071dd
In (a) sunspot B and C have different polarity and move towards each other The twomagnetic loops will reconnect and form one big magnetic loop showed in (b) This will
happen to other magnetic loops too as can be seen in (c) When G en F are close enough they
will reconnect and so E en H will reconnect too It is possible that the magnetic field line is
trapped around another in this case AD The mass ejected from the sun will be trapped
between the magnetic field lines and form a solar prominence
832019 Ew Afgewerkte Final
httpslidepdfcomreaderfullew-afgewerkte-final 5159
832019 Ew Afgewerkte Final
httpslidepdfcomreaderfullew-afgewerkte-final 5259
52
httptheinvisibleagentwordpresscom20090117amazing-celestial-images
An group of active prominences
httpapodnasagovapodap051109html
httpwhassupinthemilkywayblogspotcom200903cloudy-planhtml
A picture taken by SOHO In the left corner you can see the prominence with twisted
magnetic field lines
832019 Ew Afgewerkte Final
httpslidepdfcomreaderfullew-afgewerkte-final 5359
53
Appendix XIV Polar crown
httpsciencenasagovheadlinesy200817sep_polarcrownhtm
Photograph of a polar crown taken on 13 June 1999 by the Meudon Observatory
832019 Ew Afgewerkte Final
httpslidepdfcomreaderfullew-afgewerkte-final 5459
54
Appendix XV Coronal holes
httpsunearthdaynasagov2007multimediagal_020php
The black segment is a huge coronal hole The bright parts are x-rays from sunspots
832019 Ew Afgewerkte Final
httpslidepdfcomreaderfullew-afgewerkte-final 5559
55
Appendix XVI Coronal mass ejection
httpzuserver2staruclacuk~idhapodap000309html
Picture of a CME taken by SOHO in February 2000
832019 Ew Afgewerkte Final
httpslidepdfcomreaderfullew-afgewerkte-final 5659
56
Bibliography
Books
BEATTY JK PETERSEN CC and CHAIKIN A The new solar system fourth edition
Cambridge University Press Cambridge 1999 421 p
COMINS NF and KAUFMANN III WJ Discovering the universe eighth edition WH
Freeman and Company New York 2008 535 p
DETHIER T Het zonnestelsel Standaard Uitgeverij 1992 415 p
GOLUB L and PASACHOFF JM Nearest star the surprising science of our sun Harvard
university press Harvard 2001 267 p
GREEN SF and JONES M H An introduction to the Sun and Stars The Open University
Cambridge 2004 373 p
HILL S and CARLOWITZ M The sun Abrams New York 2006 239 p
HOLMAN GD lsquoThe mysterious origins of solar flaresrsquo Scientific America April 2006 p
24-31 volume 294 number 4
JANSSENS J Zon en aarde een unieke relatie Garant Antwerpen 2003 254 p
KELLER H-U Van Supernovarsquos tot zwarte gaten Tirion Natuur AH Baarn 2003 169 p
LANG KR Sun earth and sky Springer Germany 1995 282 p
LILENSTEN J and BORNAREL J Sous les feux du soleil EDP Sciences Les Ulis Cedex
A 2001 247 p
832019 Ew Afgewerkte Final
httpslidepdfcomreaderfullew-afgewerkte-final 5759
57
Articles
CUYPERS J and others lsquoLa rechercheacute en heacuteliophysique en Belgiquersquo Space connection
October 2007 20 p
DE KEYSER J lsquoDe magnetopauzersquo Heelal maart 1998 p 66-73
JANSSENS J lsquoHet maximum van de 23ste zonnevlekkencyclus (I)rsquo Heelal Oktober 1998 p
256-263
JANSSENS J lsquohet maximum van de 23ste zonnenvlekkencyclus (II)rsquo Heelal November
1998 p 284-290
JANSSENS J lsquoZonnefakkelsrsquo Heelal Oktober 1994 p 256-261
SMITS F lsquoDe coronarsquo Heelal Februari 1999 p 40-42
SMITS F lsquoProtuberanzenrsquo Heelal Juli 1991 p 182-185
VAN DEN BERGHE S lsquoHet Zeemaneffectrsquo Heelal September 1998 p 228-231
832019 Ew Afgewerkte Final
httpslidepdfcomreaderfullew-afgewerkte-final 5859
58
Webography
BOEN B Birth of a coronal mass ejection Internet
(httpwwwnasagovmission_pagessolar-b solar_005html) 290408
BRAEUNIG R A Glossary Internet (httpwwwbraeunigusspaceglossaryhtm) 2006
CORDIS Researchers reveal why Suns atmosphere is hotter than its surface Internet
(httpcordiseuropaeusearchindexcfmfuseaction=newsdocumentampN_LANG=ENampN_R
CN=30598amppid=0ampq=87F36474805A6BEC0B89404F72D0351Famptype=sim) 20032009
DAY C Alfveacuten waves may heat the Sunrsquos corona Internet
(httpblogsphysicstodayorgupdate200903 alfven-waves-may-heat-the-sunshtml)
310309
ELLERMAN F Solar prominences Internet (httparticlesadsabsharvardedufull
1928ASPL173E 0000074000html) (03042009)
ENCYCLODPEDIA OF SCIENCE Corona hole Internet
(httpwwwdaviddarlinginfoencyclopediaC coronal_holehtml) (04042009)
HATHAWAY D H The sunspot cycle Internet
(httpspacesciencespacerefcomsslpadsolarsunspots htm) 04012000
JANSSENS J The case of the missing solar cycle (published in lsquoheelalrsquo January 2008)
Internet (httpuserstelenetbejjanssensMSCwebEngpdf)
KNISELY D Solar prominences Internet
(httpwwwicstarscomHTMLSolarSectionHAlphaOBSERVINGTHESUNHAlpha3html)
(03042009)
KOPANSKI J Atom Internet (httpknolgooglecomkjan-
kopanskiatom1amrwrct7rvi27) 060209
MARTENS PC and ZWAAN C Origin and evolution of filament-prominence systems
Internet (http wwwioporgEJarticle0004-637X558287253575webpdfrequest-
id=73e38daa-69ae-4e01-b9a6-b4bd0ba071dd) 092001
NASA The corona Internet (httpsolarsciencemsfcnasagovcoronashtml) 180107
NASA The heliosphere Internet (httpheliosgsfcnasagovheliosphhtml) 20012009
OFFICIAL SITE OF STONEHENGE About Stonehenge Internet
(httpwwwstonehengecouk) (03022009)
OTTERSDORF M Astronomy On the sunspot cycle Internet
(httpuserszoominternetnet~matto MCASsunspot_cyclehtmZeemaneffect) 031103
PARIAT E and SCHMIEDER B Magnetic flux emergence Internet(httpwwwscholarpediaorgarticleMagnetic_field_emergence) 18042008
832019 Ew Afgewerkte Final
httpslidepdfcomreaderfullew-afgewerkte-final 5959
59
PRIEST E R Dynamics and Structure of Quiescent Solar Prominences Internet
(httpbooksgooglebe booksid=h599q3jz1w4Campdq=quiescent+prominencesampprintsec=fro
ntcoverampsource=blampots=58b79Qeyabampsig=1eklQ-
WszOIebZZaq7fq7gm6bxAamphl=nlampei=urPtSe7ZCo61-
Qa166jHDwampsa=Xampoi=book_resultampct=result ampresnum=3PPA6M2) 1989
RUSSELL R Rotation of the sun Internet
(httpwwwwindowsucaredutourlink=sunSolar_interior
Sun_layersdifferential_rotationhtml) 16082005
RUSSELL R Sunspots and magnetic fields Internet
(httpwwwwindowsucaredutourlink=sunatmospheresunspot_magnetismhtmlampedu=hig
h) 060908
UNIVERSITY OF GLASGOW Bibliography of Peter Sweet Internet
(httpwwwuniversitystoryglaacuk biographyid=WH2144amptype=P) (10042009)
WIKIPEDIA Orbiting Solar Observatory Internet
(httpenwikipediaorgwikiOrbiting_Solar_Observatory) 24012009
WINDOWS TEAM Maunderrsquos Butterfly Diagram Internet
(httpwwwwindowsucaredutourlink=sun activitybutterflyhtml) 2000
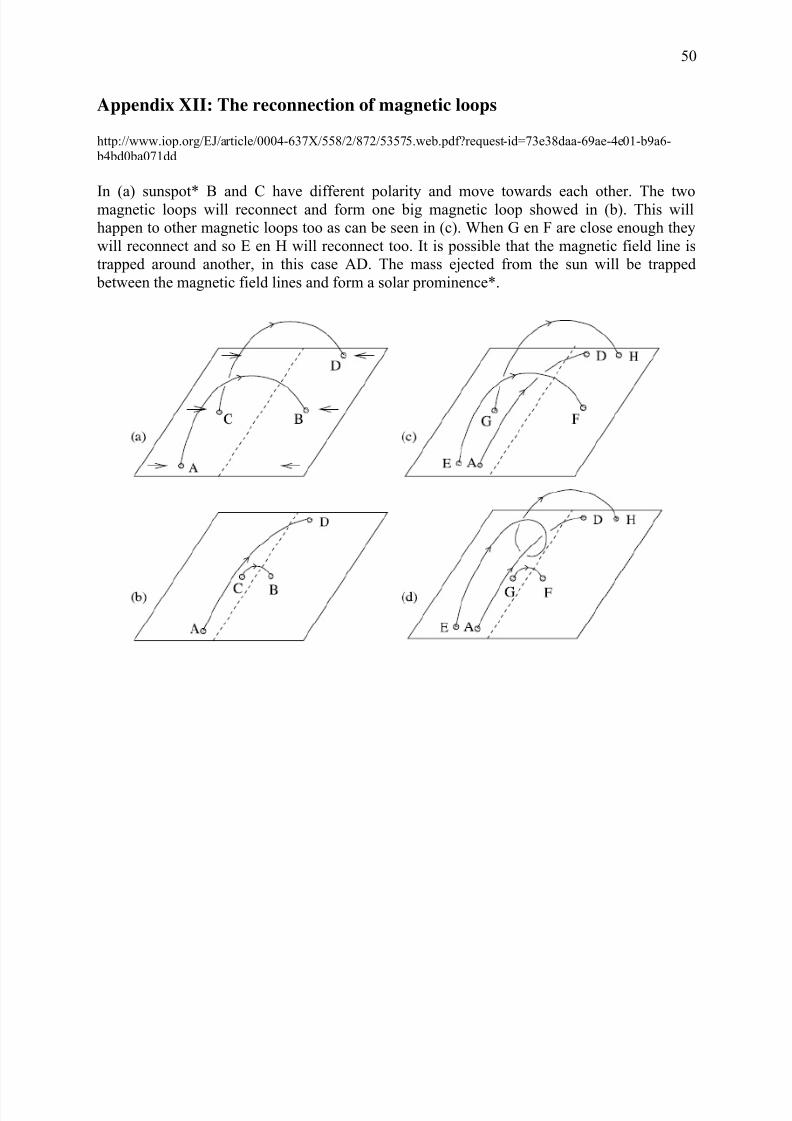
832019 Ew Afgewerkte Final
httpslidepdfcomreaderfullew-afgewerkte-final 5059
50
Appendix XII The reconnection of magnetic loops
httpwwwioporgEJarticle0004-637X558287253575webpdfrequest-id=73e38daa-69ae-4e01-b9a6- b4bd0ba071dd
In (a) sunspot B and C have different polarity and move towards each other The twomagnetic loops will reconnect and form one big magnetic loop showed in (b) This will
happen to other magnetic loops too as can be seen in (c) When G en F are close enough they
will reconnect and so E en H will reconnect too It is possible that the magnetic field line is
trapped around another in this case AD The mass ejected from the sun will be trapped
between the magnetic field lines and form a solar prominence
832019 Ew Afgewerkte Final
httpslidepdfcomreaderfullew-afgewerkte-final 5159
832019 Ew Afgewerkte Final
httpslidepdfcomreaderfullew-afgewerkte-final 5259
52
httptheinvisibleagentwordpresscom20090117amazing-celestial-images
An group of active prominences
httpapodnasagovapodap051109html
httpwhassupinthemilkywayblogspotcom200903cloudy-planhtml
A picture taken by SOHO In the left corner you can see the prominence with twisted
magnetic field lines
832019 Ew Afgewerkte Final
httpslidepdfcomreaderfullew-afgewerkte-final 5359
53
Appendix XIV Polar crown
httpsciencenasagovheadlinesy200817sep_polarcrownhtm
Photograph of a polar crown taken on 13 June 1999 by the Meudon Observatory
832019 Ew Afgewerkte Final
httpslidepdfcomreaderfullew-afgewerkte-final 5459
54
Appendix XV Coronal holes
httpsunearthdaynasagov2007multimediagal_020php
The black segment is a huge coronal hole The bright parts are x-rays from sunspots
832019 Ew Afgewerkte Final
httpslidepdfcomreaderfullew-afgewerkte-final 5559
55
Appendix XVI Coronal mass ejection
httpzuserver2staruclacuk~idhapodap000309html
Picture of a CME taken by SOHO in February 2000
832019 Ew Afgewerkte Final
httpslidepdfcomreaderfullew-afgewerkte-final 5659
56
Bibliography
Books
BEATTY JK PETERSEN CC and CHAIKIN A The new solar system fourth edition
Cambridge University Press Cambridge 1999 421 p
COMINS NF and KAUFMANN III WJ Discovering the universe eighth edition WH
Freeman and Company New York 2008 535 p
DETHIER T Het zonnestelsel Standaard Uitgeverij 1992 415 p
GOLUB L and PASACHOFF JM Nearest star the surprising science of our sun Harvard
university press Harvard 2001 267 p
GREEN SF and JONES M H An introduction to the Sun and Stars The Open University
Cambridge 2004 373 p
HILL S and CARLOWITZ M The sun Abrams New York 2006 239 p
HOLMAN GD lsquoThe mysterious origins of solar flaresrsquo Scientific America April 2006 p
24-31 volume 294 number 4
JANSSENS J Zon en aarde een unieke relatie Garant Antwerpen 2003 254 p
KELLER H-U Van Supernovarsquos tot zwarte gaten Tirion Natuur AH Baarn 2003 169 p
LANG KR Sun earth and sky Springer Germany 1995 282 p
LILENSTEN J and BORNAREL J Sous les feux du soleil EDP Sciences Les Ulis Cedex
A 2001 247 p
832019 Ew Afgewerkte Final
httpslidepdfcomreaderfullew-afgewerkte-final 5759
57
Articles
CUYPERS J and others lsquoLa rechercheacute en heacuteliophysique en Belgiquersquo Space connection
October 2007 20 p
DE KEYSER J lsquoDe magnetopauzersquo Heelal maart 1998 p 66-73
JANSSENS J lsquoHet maximum van de 23ste zonnevlekkencyclus (I)rsquo Heelal Oktober 1998 p
256-263
JANSSENS J lsquohet maximum van de 23ste zonnenvlekkencyclus (II)rsquo Heelal November
1998 p 284-290
JANSSENS J lsquoZonnefakkelsrsquo Heelal Oktober 1994 p 256-261
SMITS F lsquoDe coronarsquo Heelal Februari 1999 p 40-42
SMITS F lsquoProtuberanzenrsquo Heelal Juli 1991 p 182-185
VAN DEN BERGHE S lsquoHet Zeemaneffectrsquo Heelal September 1998 p 228-231
832019 Ew Afgewerkte Final
httpslidepdfcomreaderfullew-afgewerkte-final 5859
58
Webography
BOEN B Birth of a coronal mass ejection Internet
(httpwwwnasagovmission_pagessolar-b solar_005html) 290408
BRAEUNIG R A Glossary Internet (httpwwwbraeunigusspaceglossaryhtm) 2006
CORDIS Researchers reveal why Suns atmosphere is hotter than its surface Internet
(httpcordiseuropaeusearchindexcfmfuseaction=newsdocumentampN_LANG=ENampN_R
CN=30598amppid=0ampq=87F36474805A6BEC0B89404F72D0351Famptype=sim) 20032009
DAY C Alfveacuten waves may heat the Sunrsquos corona Internet
(httpblogsphysicstodayorgupdate200903 alfven-waves-may-heat-the-sunshtml)
310309
ELLERMAN F Solar prominences Internet (httparticlesadsabsharvardedufull
1928ASPL173E 0000074000html) (03042009)
ENCYCLODPEDIA OF SCIENCE Corona hole Internet
(httpwwwdaviddarlinginfoencyclopediaC coronal_holehtml) (04042009)
HATHAWAY D H The sunspot cycle Internet
(httpspacesciencespacerefcomsslpadsolarsunspots htm) 04012000
JANSSENS J The case of the missing solar cycle (published in lsquoheelalrsquo January 2008)
Internet (httpuserstelenetbejjanssensMSCwebEngpdf)
KNISELY D Solar prominences Internet
(httpwwwicstarscomHTMLSolarSectionHAlphaOBSERVINGTHESUNHAlpha3html)
(03042009)
KOPANSKI J Atom Internet (httpknolgooglecomkjan-
kopanskiatom1amrwrct7rvi27) 060209
MARTENS PC and ZWAAN C Origin and evolution of filament-prominence systems
Internet (http wwwioporgEJarticle0004-637X558287253575webpdfrequest-
id=73e38daa-69ae-4e01-b9a6-b4bd0ba071dd) 092001
NASA The corona Internet (httpsolarsciencemsfcnasagovcoronashtml) 180107
NASA The heliosphere Internet (httpheliosgsfcnasagovheliosphhtml) 20012009
OFFICIAL SITE OF STONEHENGE About Stonehenge Internet
(httpwwwstonehengecouk) (03022009)
OTTERSDORF M Astronomy On the sunspot cycle Internet
(httpuserszoominternetnet~matto MCASsunspot_cyclehtmZeemaneffect) 031103
PARIAT E and SCHMIEDER B Magnetic flux emergence Internet(httpwwwscholarpediaorgarticleMagnetic_field_emergence) 18042008
832019 Ew Afgewerkte Final
httpslidepdfcomreaderfullew-afgewerkte-final 5959
59
PRIEST E R Dynamics and Structure of Quiescent Solar Prominences Internet
(httpbooksgooglebe booksid=h599q3jz1w4Campdq=quiescent+prominencesampprintsec=fro
ntcoverampsource=blampots=58b79Qeyabampsig=1eklQ-
WszOIebZZaq7fq7gm6bxAamphl=nlampei=urPtSe7ZCo61-
Qa166jHDwampsa=Xampoi=book_resultampct=result ampresnum=3PPA6M2) 1989
RUSSELL R Rotation of the sun Internet
(httpwwwwindowsucaredutourlink=sunSolar_interior
Sun_layersdifferential_rotationhtml) 16082005
RUSSELL R Sunspots and magnetic fields Internet
(httpwwwwindowsucaredutourlink=sunatmospheresunspot_magnetismhtmlampedu=hig
h) 060908
UNIVERSITY OF GLASGOW Bibliography of Peter Sweet Internet
(httpwwwuniversitystoryglaacuk biographyid=WH2144amptype=P) (10042009)
WIKIPEDIA Orbiting Solar Observatory Internet
(httpenwikipediaorgwikiOrbiting_Solar_Observatory) 24012009
WINDOWS TEAM Maunderrsquos Butterfly Diagram Internet
(httpwwwwindowsucaredutourlink=sun activitybutterflyhtml) 2000
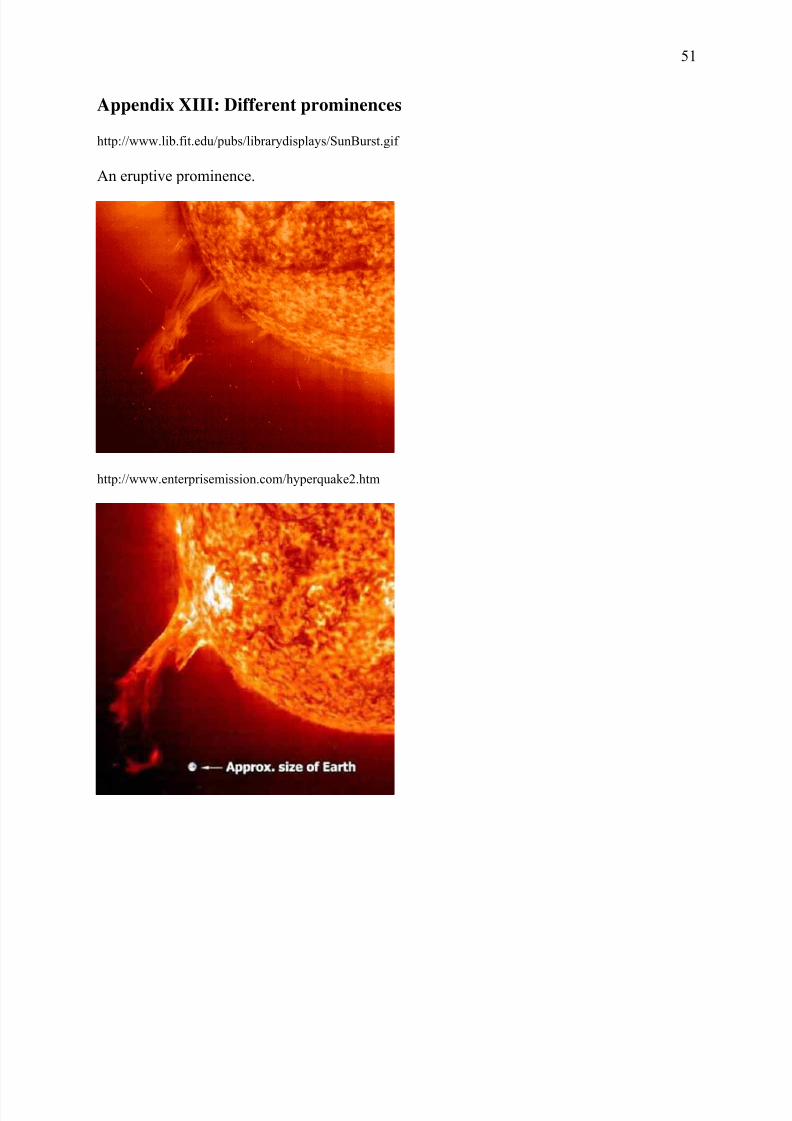
832019 Ew Afgewerkte Final
httpslidepdfcomreaderfullew-afgewerkte-final 5159
832019 Ew Afgewerkte Final
httpslidepdfcomreaderfullew-afgewerkte-final 5259
52
httptheinvisibleagentwordpresscom20090117amazing-celestial-images
An group of active prominences
httpapodnasagovapodap051109html
httpwhassupinthemilkywayblogspotcom200903cloudy-planhtml
A picture taken by SOHO In the left corner you can see the prominence with twisted
magnetic field lines
832019 Ew Afgewerkte Final
httpslidepdfcomreaderfullew-afgewerkte-final 5359
53
Appendix XIV Polar crown
httpsciencenasagovheadlinesy200817sep_polarcrownhtm
Photograph of a polar crown taken on 13 June 1999 by the Meudon Observatory
832019 Ew Afgewerkte Final
httpslidepdfcomreaderfullew-afgewerkte-final 5459
54
Appendix XV Coronal holes
httpsunearthdaynasagov2007multimediagal_020php
The black segment is a huge coronal hole The bright parts are x-rays from sunspots
832019 Ew Afgewerkte Final
httpslidepdfcomreaderfullew-afgewerkte-final 5559
55
Appendix XVI Coronal mass ejection
httpzuserver2staruclacuk~idhapodap000309html
Picture of a CME taken by SOHO in February 2000
832019 Ew Afgewerkte Final
httpslidepdfcomreaderfullew-afgewerkte-final 5659
56
Bibliography
Books
BEATTY JK PETERSEN CC and CHAIKIN A The new solar system fourth edition
Cambridge University Press Cambridge 1999 421 p
COMINS NF and KAUFMANN III WJ Discovering the universe eighth edition WH
Freeman and Company New York 2008 535 p
DETHIER T Het zonnestelsel Standaard Uitgeverij 1992 415 p
GOLUB L and PASACHOFF JM Nearest star the surprising science of our sun Harvard
university press Harvard 2001 267 p
GREEN SF and JONES M H An introduction to the Sun and Stars The Open University
Cambridge 2004 373 p
HILL S and CARLOWITZ M The sun Abrams New York 2006 239 p
HOLMAN GD lsquoThe mysterious origins of solar flaresrsquo Scientific America April 2006 p
24-31 volume 294 number 4
JANSSENS J Zon en aarde een unieke relatie Garant Antwerpen 2003 254 p
KELLER H-U Van Supernovarsquos tot zwarte gaten Tirion Natuur AH Baarn 2003 169 p
LANG KR Sun earth and sky Springer Germany 1995 282 p
LILENSTEN J and BORNAREL J Sous les feux du soleil EDP Sciences Les Ulis Cedex
A 2001 247 p
832019 Ew Afgewerkte Final
httpslidepdfcomreaderfullew-afgewerkte-final 5759
57
Articles
CUYPERS J and others lsquoLa rechercheacute en heacuteliophysique en Belgiquersquo Space connection
October 2007 20 p
DE KEYSER J lsquoDe magnetopauzersquo Heelal maart 1998 p 66-73
JANSSENS J lsquoHet maximum van de 23ste zonnevlekkencyclus (I)rsquo Heelal Oktober 1998 p
256-263
JANSSENS J lsquohet maximum van de 23ste zonnenvlekkencyclus (II)rsquo Heelal November
1998 p 284-290
JANSSENS J lsquoZonnefakkelsrsquo Heelal Oktober 1994 p 256-261
SMITS F lsquoDe coronarsquo Heelal Februari 1999 p 40-42
SMITS F lsquoProtuberanzenrsquo Heelal Juli 1991 p 182-185
VAN DEN BERGHE S lsquoHet Zeemaneffectrsquo Heelal September 1998 p 228-231
832019 Ew Afgewerkte Final
httpslidepdfcomreaderfullew-afgewerkte-final 5859
58
Webography
BOEN B Birth of a coronal mass ejection Internet
(httpwwwnasagovmission_pagessolar-b solar_005html) 290408
BRAEUNIG R A Glossary Internet (httpwwwbraeunigusspaceglossaryhtm) 2006
CORDIS Researchers reveal why Suns atmosphere is hotter than its surface Internet
(httpcordiseuropaeusearchindexcfmfuseaction=newsdocumentampN_LANG=ENampN_R
CN=30598amppid=0ampq=87F36474805A6BEC0B89404F72D0351Famptype=sim) 20032009
DAY C Alfveacuten waves may heat the Sunrsquos corona Internet
(httpblogsphysicstodayorgupdate200903 alfven-waves-may-heat-the-sunshtml)
310309
ELLERMAN F Solar prominences Internet (httparticlesadsabsharvardedufull
1928ASPL173E 0000074000html) (03042009)
ENCYCLODPEDIA OF SCIENCE Corona hole Internet
(httpwwwdaviddarlinginfoencyclopediaC coronal_holehtml) (04042009)
HATHAWAY D H The sunspot cycle Internet
(httpspacesciencespacerefcomsslpadsolarsunspots htm) 04012000
JANSSENS J The case of the missing solar cycle (published in lsquoheelalrsquo January 2008)
Internet (httpuserstelenetbejjanssensMSCwebEngpdf)
KNISELY D Solar prominences Internet
(httpwwwicstarscomHTMLSolarSectionHAlphaOBSERVINGTHESUNHAlpha3html)
(03042009)
KOPANSKI J Atom Internet (httpknolgooglecomkjan-
kopanskiatom1amrwrct7rvi27) 060209
MARTENS PC and ZWAAN C Origin and evolution of filament-prominence systems
Internet (http wwwioporgEJarticle0004-637X558287253575webpdfrequest-
id=73e38daa-69ae-4e01-b9a6-b4bd0ba071dd) 092001
NASA The corona Internet (httpsolarsciencemsfcnasagovcoronashtml) 180107
NASA The heliosphere Internet (httpheliosgsfcnasagovheliosphhtml) 20012009
OFFICIAL SITE OF STONEHENGE About Stonehenge Internet
(httpwwwstonehengecouk) (03022009)
OTTERSDORF M Astronomy On the sunspot cycle Internet
(httpuserszoominternetnet~matto MCASsunspot_cyclehtmZeemaneffect) 031103
PARIAT E and SCHMIEDER B Magnetic flux emergence Internet(httpwwwscholarpediaorgarticleMagnetic_field_emergence) 18042008
832019 Ew Afgewerkte Final
httpslidepdfcomreaderfullew-afgewerkte-final 5959
59
PRIEST E R Dynamics and Structure of Quiescent Solar Prominences Internet
(httpbooksgooglebe booksid=h599q3jz1w4Campdq=quiescent+prominencesampprintsec=fro
ntcoverampsource=blampots=58b79Qeyabampsig=1eklQ-
WszOIebZZaq7fq7gm6bxAamphl=nlampei=urPtSe7ZCo61-
Qa166jHDwampsa=Xampoi=book_resultampct=result ampresnum=3PPA6M2) 1989
RUSSELL R Rotation of the sun Internet
(httpwwwwindowsucaredutourlink=sunSolar_interior
Sun_layersdifferential_rotationhtml) 16082005
RUSSELL R Sunspots and magnetic fields Internet
(httpwwwwindowsucaredutourlink=sunatmospheresunspot_magnetismhtmlampedu=hig
h) 060908
UNIVERSITY OF GLASGOW Bibliography of Peter Sweet Internet
(httpwwwuniversitystoryglaacuk biographyid=WH2144amptype=P) (10042009)
WIKIPEDIA Orbiting Solar Observatory Internet
(httpenwikipediaorgwikiOrbiting_Solar_Observatory) 24012009
WINDOWS TEAM Maunderrsquos Butterfly Diagram Internet
(httpwwwwindowsucaredutourlink=sun activitybutterflyhtml) 2000
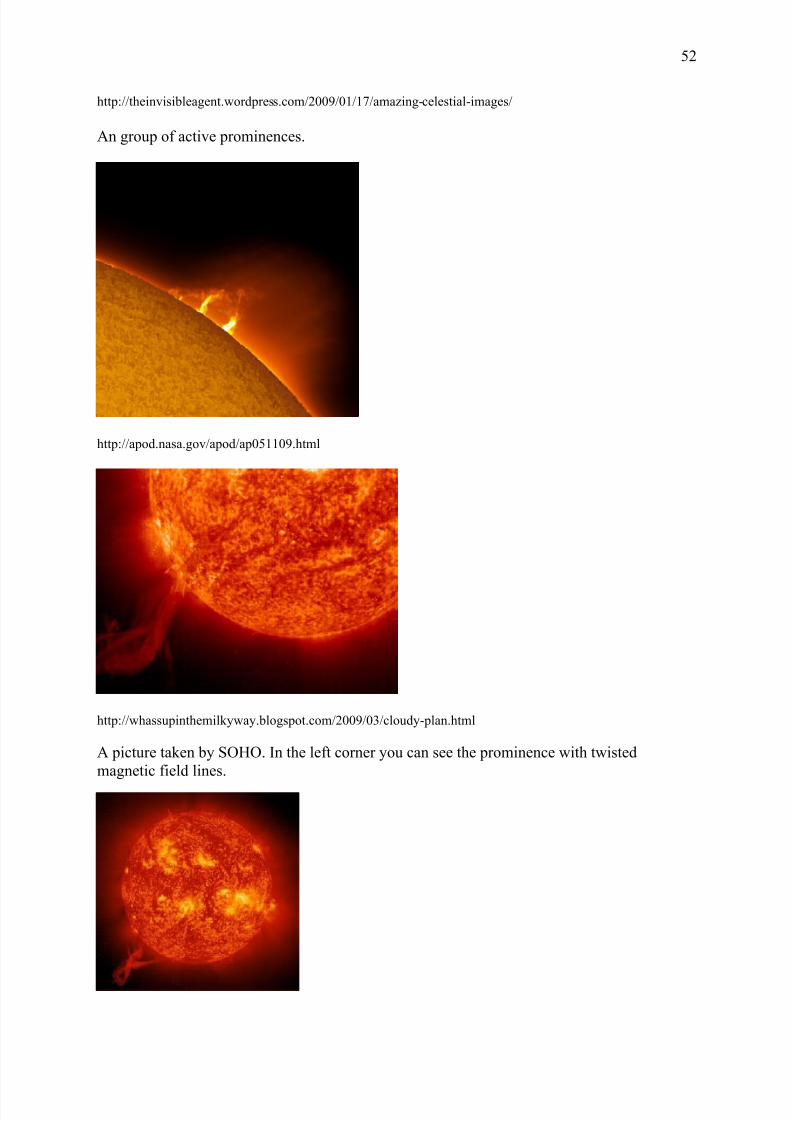
832019 Ew Afgewerkte Final
httpslidepdfcomreaderfullew-afgewerkte-final 5359
53
Appendix XIV Polar crown
httpsciencenasagovheadlinesy200817sep_polarcrownhtm
Photograph of a polar crown taken on 13 June 1999 by the Meudon Observatory
832019 Ew Afgewerkte Final
httpslidepdfcomreaderfullew-afgewerkte-final 5459
54
Appendix XV Coronal holes
httpsunearthdaynasagov2007multimediagal_020php
The black segment is a huge coronal hole The bright parts are x-rays from sunspots
832019 Ew Afgewerkte Final
httpslidepdfcomreaderfullew-afgewerkte-final 5559
55
Appendix XVI Coronal mass ejection
httpzuserver2staruclacuk~idhapodap000309html
Picture of a CME taken by SOHO in February 2000
832019 Ew Afgewerkte Final
httpslidepdfcomreaderfullew-afgewerkte-final 5659
56
Bibliography
Books
BEATTY JK PETERSEN CC and CHAIKIN A The new solar system fourth edition
Cambridge University Press Cambridge 1999 421 p
COMINS NF and KAUFMANN III WJ Discovering the universe eighth edition WH
Freeman and Company New York 2008 535 p
DETHIER T Het zonnestelsel Standaard Uitgeverij 1992 415 p
GOLUB L and PASACHOFF JM Nearest star the surprising science of our sun Harvard
university press Harvard 2001 267 p
GREEN SF and JONES M H An introduction to the Sun and Stars The Open University
Cambridge 2004 373 p
HILL S and CARLOWITZ M The sun Abrams New York 2006 239 p
HOLMAN GD lsquoThe mysterious origins of solar flaresrsquo Scientific America April 2006 p
24-31 volume 294 number 4
JANSSENS J Zon en aarde een unieke relatie Garant Antwerpen 2003 254 p
KELLER H-U Van Supernovarsquos tot zwarte gaten Tirion Natuur AH Baarn 2003 169 p
LANG KR Sun earth and sky Springer Germany 1995 282 p
LILENSTEN J and BORNAREL J Sous les feux du soleil EDP Sciences Les Ulis Cedex
A 2001 247 p
832019 Ew Afgewerkte Final
httpslidepdfcomreaderfullew-afgewerkte-final 5759
57
Articles
CUYPERS J and others lsquoLa rechercheacute en heacuteliophysique en Belgiquersquo Space connection
October 2007 20 p
DE KEYSER J lsquoDe magnetopauzersquo Heelal maart 1998 p 66-73
JANSSENS J lsquoHet maximum van de 23ste zonnevlekkencyclus (I)rsquo Heelal Oktober 1998 p
256-263
JANSSENS J lsquohet maximum van de 23ste zonnenvlekkencyclus (II)rsquo Heelal November
1998 p 284-290
JANSSENS J lsquoZonnefakkelsrsquo Heelal Oktober 1994 p 256-261
SMITS F lsquoDe coronarsquo Heelal Februari 1999 p 40-42
SMITS F lsquoProtuberanzenrsquo Heelal Juli 1991 p 182-185
VAN DEN BERGHE S lsquoHet Zeemaneffectrsquo Heelal September 1998 p 228-231
832019 Ew Afgewerkte Final
httpslidepdfcomreaderfullew-afgewerkte-final 5859
58
Webography
BOEN B Birth of a coronal mass ejection Internet
(httpwwwnasagovmission_pagessolar-b solar_005html) 290408
BRAEUNIG R A Glossary Internet (httpwwwbraeunigusspaceglossaryhtm) 2006
CORDIS Researchers reveal why Suns atmosphere is hotter than its surface Internet
(httpcordiseuropaeusearchindexcfmfuseaction=newsdocumentampN_LANG=ENampN_R
CN=30598amppid=0ampq=87F36474805A6BEC0B89404F72D0351Famptype=sim) 20032009
DAY C Alfveacuten waves may heat the Sunrsquos corona Internet
(httpblogsphysicstodayorgupdate200903 alfven-waves-may-heat-the-sunshtml)
310309
ELLERMAN F Solar prominences Internet (httparticlesadsabsharvardedufull
1928ASPL173E 0000074000html) (03042009)
ENCYCLODPEDIA OF SCIENCE Corona hole Internet
(httpwwwdaviddarlinginfoencyclopediaC coronal_holehtml) (04042009)
HATHAWAY D H The sunspot cycle Internet
(httpspacesciencespacerefcomsslpadsolarsunspots htm) 04012000
JANSSENS J The case of the missing solar cycle (published in lsquoheelalrsquo January 2008)
Internet (httpuserstelenetbejjanssensMSCwebEngpdf)
KNISELY D Solar prominences Internet
(httpwwwicstarscomHTMLSolarSectionHAlphaOBSERVINGTHESUNHAlpha3html)
(03042009)
KOPANSKI J Atom Internet (httpknolgooglecomkjan-
kopanskiatom1amrwrct7rvi27) 060209
MARTENS PC and ZWAAN C Origin and evolution of filament-prominence systems
Internet (http wwwioporgEJarticle0004-637X558287253575webpdfrequest-
id=73e38daa-69ae-4e01-b9a6-b4bd0ba071dd) 092001
NASA The corona Internet (httpsolarsciencemsfcnasagovcoronashtml) 180107
NASA The heliosphere Internet (httpheliosgsfcnasagovheliosphhtml) 20012009
OFFICIAL SITE OF STONEHENGE About Stonehenge Internet
(httpwwwstonehengecouk) (03022009)
OTTERSDORF M Astronomy On the sunspot cycle Internet
(httpuserszoominternetnet~matto MCASsunspot_cyclehtmZeemaneffect) 031103
PARIAT E and SCHMIEDER B Magnetic flux emergence Internet(httpwwwscholarpediaorgarticleMagnetic_field_emergence) 18042008
832019 Ew Afgewerkte Final
httpslidepdfcomreaderfullew-afgewerkte-final 5959
59
PRIEST E R Dynamics and Structure of Quiescent Solar Prominences Internet
(httpbooksgooglebe booksid=h599q3jz1w4Campdq=quiescent+prominencesampprintsec=fro
ntcoverampsource=blampots=58b79Qeyabampsig=1eklQ-
WszOIebZZaq7fq7gm6bxAamphl=nlampei=urPtSe7ZCo61-
Qa166jHDwampsa=Xampoi=book_resultampct=result ampresnum=3PPA6M2) 1989
RUSSELL R Rotation of the sun Internet
(httpwwwwindowsucaredutourlink=sunSolar_interior
Sun_layersdifferential_rotationhtml) 16082005
RUSSELL R Sunspots and magnetic fields Internet
(httpwwwwindowsucaredutourlink=sunatmospheresunspot_magnetismhtmlampedu=hig
h) 060908
UNIVERSITY OF GLASGOW Bibliography of Peter Sweet Internet
(httpwwwuniversitystoryglaacuk biographyid=WH2144amptype=P) (10042009)
WIKIPEDIA Orbiting Solar Observatory Internet
(httpenwikipediaorgwikiOrbiting_Solar_Observatory) 24012009
WINDOWS TEAM Maunderrsquos Butterfly Diagram Internet
(httpwwwwindowsucaredutourlink=sun activitybutterflyhtml) 2000
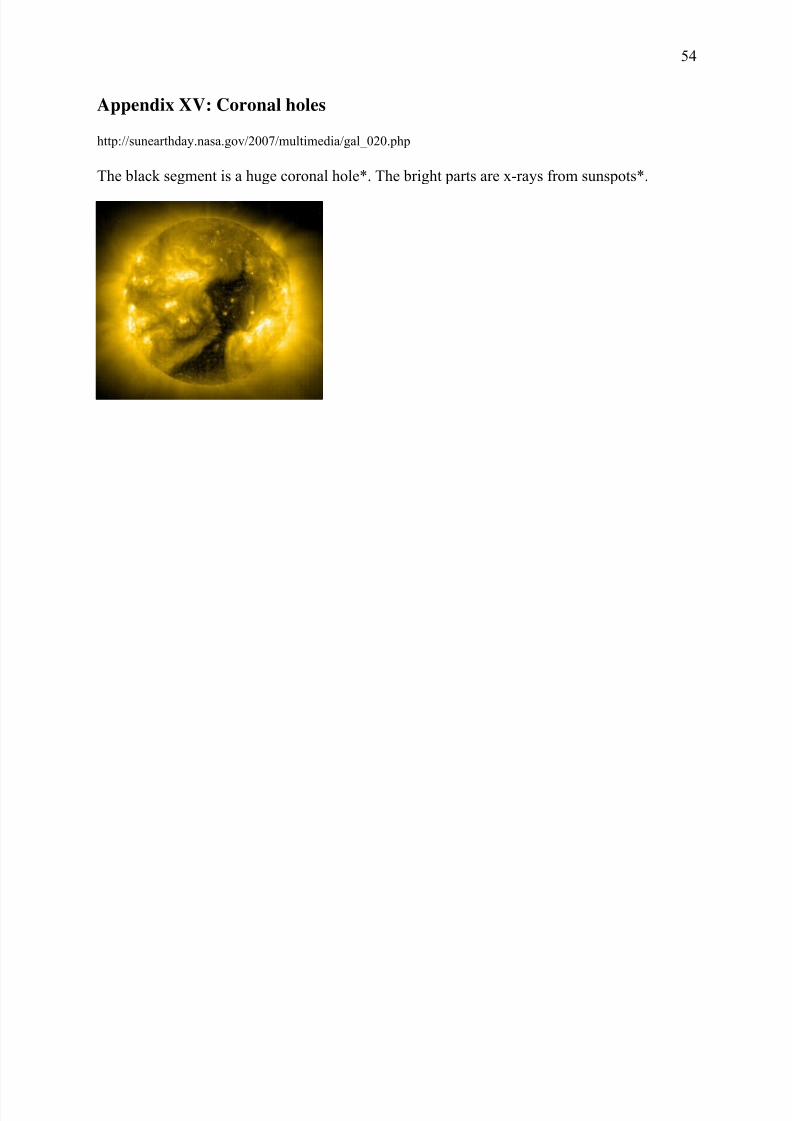
832019 Ew Afgewerkte Final
httpslidepdfcomreaderfullew-afgewerkte-final 5459
54
Appendix XV Coronal holes
httpsunearthdaynasagov2007multimediagal_020php
The black segment is a huge coronal hole The bright parts are x-rays from sunspots
832019 Ew Afgewerkte Final
httpslidepdfcomreaderfullew-afgewerkte-final 5559
55
Appendix XVI Coronal mass ejection
httpzuserver2staruclacuk~idhapodap000309html
Picture of a CME taken by SOHO in February 2000
832019 Ew Afgewerkte Final
httpslidepdfcomreaderfullew-afgewerkte-final 5659
56
Bibliography
Books
BEATTY JK PETERSEN CC and CHAIKIN A The new solar system fourth edition
Cambridge University Press Cambridge 1999 421 p
COMINS NF and KAUFMANN III WJ Discovering the universe eighth edition WH
Freeman and Company New York 2008 535 p
DETHIER T Het zonnestelsel Standaard Uitgeverij 1992 415 p
GOLUB L and PASACHOFF JM Nearest star the surprising science of our sun Harvard
university press Harvard 2001 267 p
GREEN SF and JONES M H An introduction to the Sun and Stars The Open University
Cambridge 2004 373 p
HILL S and CARLOWITZ M The sun Abrams New York 2006 239 p
HOLMAN GD lsquoThe mysterious origins of solar flaresrsquo Scientific America April 2006 p
24-31 volume 294 number 4
JANSSENS J Zon en aarde een unieke relatie Garant Antwerpen 2003 254 p
KELLER H-U Van Supernovarsquos tot zwarte gaten Tirion Natuur AH Baarn 2003 169 p
LANG KR Sun earth and sky Springer Germany 1995 282 p
LILENSTEN J and BORNAREL J Sous les feux du soleil EDP Sciences Les Ulis Cedex
A 2001 247 p
832019 Ew Afgewerkte Final
httpslidepdfcomreaderfullew-afgewerkte-final 5759
57
Articles
CUYPERS J and others lsquoLa rechercheacute en heacuteliophysique en Belgiquersquo Space connection
October 2007 20 p
DE KEYSER J lsquoDe magnetopauzersquo Heelal maart 1998 p 66-73
JANSSENS J lsquoHet maximum van de 23ste zonnevlekkencyclus (I)rsquo Heelal Oktober 1998 p
256-263
JANSSENS J lsquohet maximum van de 23ste zonnenvlekkencyclus (II)rsquo Heelal November
1998 p 284-290
JANSSENS J lsquoZonnefakkelsrsquo Heelal Oktober 1994 p 256-261
SMITS F lsquoDe coronarsquo Heelal Februari 1999 p 40-42
SMITS F lsquoProtuberanzenrsquo Heelal Juli 1991 p 182-185
VAN DEN BERGHE S lsquoHet Zeemaneffectrsquo Heelal September 1998 p 228-231
832019 Ew Afgewerkte Final
httpslidepdfcomreaderfullew-afgewerkte-final 5859
58
Webography
BOEN B Birth of a coronal mass ejection Internet
(httpwwwnasagovmission_pagessolar-b solar_005html) 290408
BRAEUNIG R A Glossary Internet (httpwwwbraeunigusspaceglossaryhtm) 2006
CORDIS Researchers reveal why Suns atmosphere is hotter than its surface Internet
(httpcordiseuropaeusearchindexcfmfuseaction=newsdocumentampN_LANG=ENampN_R
CN=30598amppid=0ampq=87F36474805A6BEC0B89404F72D0351Famptype=sim) 20032009
DAY C Alfveacuten waves may heat the Sunrsquos corona Internet
(httpblogsphysicstodayorgupdate200903 alfven-waves-may-heat-the-sunshtml)
310309
ELLERMAN F Solar prominences Internet (httparticlesadsabsharvardedufull
1928ASPL173E 0000074000html) (03042009)
ENCYCLODPEDIA OF SCIENCE Corona hole Internet
(httpwwwdaviddarlinginfoencyclopediaC coronal_holehtml) (04042009)
HATHAWAY D H The sunspot cycle Internet
(httpspacesciencespacerefcomsslpadsolarsunspots htm) 04012000
JANSSENS J The case of the missing solar cycle (published in lsquoheelalrsquo January 2008)
Internet (httpuserstelenetbejjanssensMSCwebEngpdf)
KNISELY D Solar prominences Internet
(httpwwwicstarscomHTMLSolarSectionHAlphaOBSERVINGTHESUNHAlpha3html)
(03042009)
KOPANSKI J Atom Internet (httpknolgooglecomkjan-
kopanskiatom1amrwrct7rvi27) 060209
MARTENS PC and ZWAAN C Origin and evolution of filament-prominence systems
Internet (http wwwioporgEJarticle0004-637X558287253575webpdfrequest-
id=73e38daa-69ae-4e01-b9a6-b4bd0ba071dd) 092001
NASA The corona Internet (httpsolarsciencemsfcnasagovcoronashtml) 180107
NASA The heliosphere Internet (httpheliosgsfcnasagovheliosphhtml) 20012009
OFFICIAL SITE OF STONEHENGE About Stonehenge Internet
(httpwwwstonehengecouk) (03022009)
OTTERSDORF M Astronomy On the sunspot cycle Internet
(httpuserszoominternetnet~matto MCASsunspot_cyclehtmZeemaneffect) 031103
PARIAT E and SCHMIEDER B Magnetic flux emergence Internet(httpwwwscholarpediaorgarticleMagnetic_field_emergence) 18042008
832019 Ew Afgewerkte Final
httpslidepdfcomreaderfullew-afgewerkte-final 5959
59
PRIEST E R Dynamics and Structure of Quiescent Solar Prominences Internet
(httpbooksgooglebe booksid=h599q3jz1w4Campdq=quiescent+prominencesampprintsec=fro
ntcoverampsource=blampots=58b79Qeyabampsig=1eklQ-
WszOIebZZaq7fq7gm6bxAamphl=nlampei=urPtSe7ZCo61-
Qa166jHDwampsa=Xampoi=book_resultampct=result ampresnum=3PPA6M2) 1989
RUSSELL R Rotation of the sun Internet
(httpwwwwindowsucaredutourlink=sunSolar_interior
Sun_layersdifferential_rotationhtml) 16082005
RUSSELL R Sunspots and magnetic fields Internet
(httpwwwwindowsucaredutourlink=sunatmospheresunspot_magnetismhtmlampedu=hig
h) 060908
UNIVERSITY OF GLASGOW Bibliography of Peter Sweet Internet
(httpwwwuniversitystoryglaacuk biographyid=WH2144amptype=P) (10042009)
WIKIPEDIA Orbiting Solar Observatory Internet
(httpenwikipediaorgwikiOrbiting_Solar_Observatory) 24012009
WINDOWS TEAM Maunderrsquos Butterfly Diagram Internet
(httpwwwwindowsucaredutourlink=sun activitybutterflyhtml) 2000
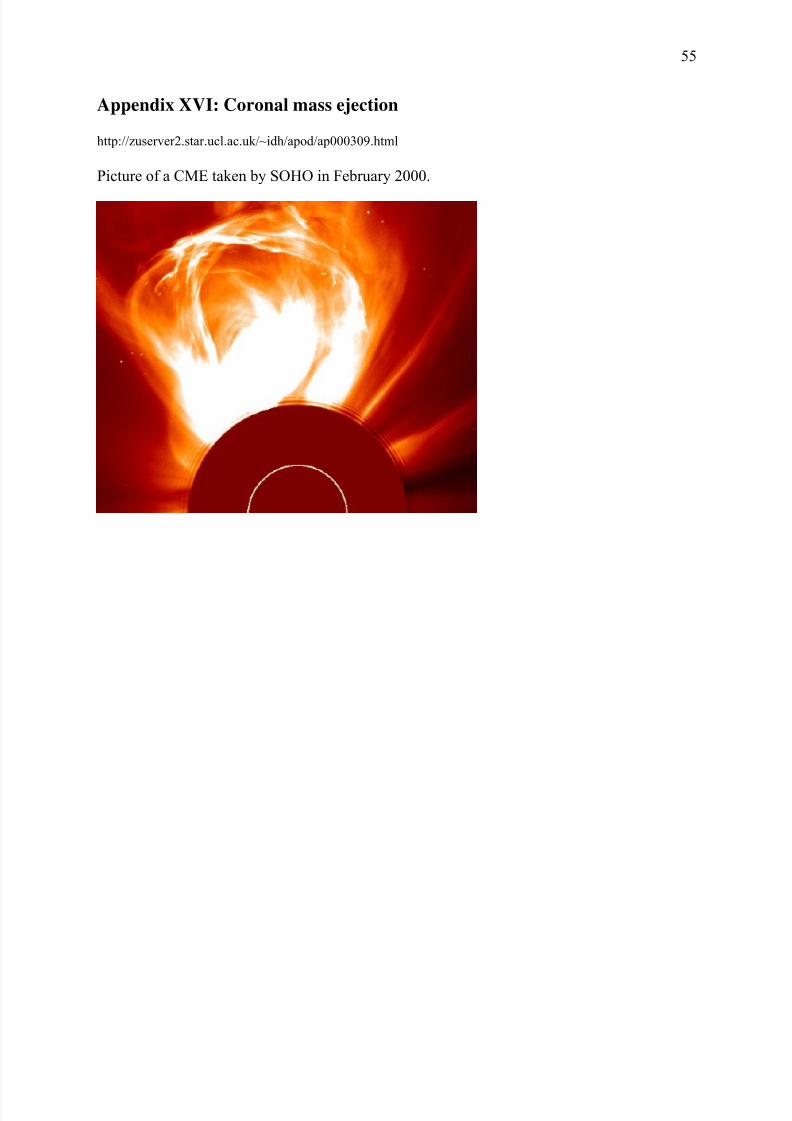
832019 Ew Afgewerkte Final
httpslidepdfcomreaderfullew-afgewerkte-final 5759
57
Articles
CUYPERS J and others lsquoLa rechercheacute en heacuteliophysique en Belgiquersquo Space connection
October 2007 20 p
DE KEYSER J lsquoDe magnetopauzersquo Heelal maart 1998 p 66-73
JANSSENS J lsquoHet maximum van de 23ste zonnevlekkencyclus (I)rsquo Heelal Oktober 1998 p
256-263
JANSSENS J lsquohet maximum van de 23ste zonnenvlekkencyclus (II)rsquo Heelal November
1998 p 284-290
JANSSENS J lsquoZonnefakkelsrsquo Heelal Oktober 1994 p 256-261
SMITS F lsquoDe coronarsquo Heelal Februari 1999 p 40-42
SMITS F lsquoProtuberanzenrsquo Heelal Juli 1991 p 182-185
VAN DEN BERGHE S lsquoHet Zeemaneffectrsquo Heelal September 1998 p 228-231
832019 Ew Afgewerkte Final
httpslidepdfcomreaderfullew-afgewerkte-final 5859
58
Webography
BOEN B Birth of a coronal mass ejection Internet
(httpwwwnasagovmission_pagessolar-b solar_005html) 290408
BRAEUNIG R A Glossary Internet (httpwwwbraeunigusspaceglossaryhtm) 2006
CORDIS Researchers reveal why Suns atmosphere is hotter than its surface Internet
(httpcordiseuropaeusearchindexcfmfuseaction=newsdocumentampN_LANG=ENampN_R
CN=30598amppid=0ampq=87F36474805A6BEC0B89404F72D0351Famptype=sim) 20032009
DAY C Alfveacuten waves may heat the Sunrsquos corona Internet
(httpblogsphysicstodayorgupdate200903 alfven-waves-may-heat-the-sunshtml)
310309
ELLERMAN F Solar prominences Internet (httparticlesadsabsharvardedufull
1928ASPL173E 0000074000html) (03042009)
ENCYCLODPEDIA OF SCIENCE Corona hole Internet
(httpwwwdaviddarlinginfoencyclopediaC coronal_holehtml) (04042009)
HATHAWAY D H The sunspot cycle Internet
(httpspacesciencespacerefcomsslpadsolarsunspots htm) 04012000
JANSSENS J The case of the missing solar cycle (published in lsquoheelalrsquo January 2008)
Internet (httpuserstelenetbejjanssensMSCwebEngpdf)
KNISELY D Solar prominences Internet
(httpwwwicstarscomHTMLSolarSectionHAlphaOBSERVINGTHESUNHAlpha3html)
(03042009)
KOPANSKI J Atom Internet (httpknolgooglecomkjan-
kopanskiatom1amrwrct7rvi27) 060209
MARTENS PC and ZWAAN C Origin and evolution of filament-prominence systems
Internet (http wwwioporgEJarticle0004-637X558287253575webpdfrequest-
id=73e38daa-69ae-4e01-b9a6-b4bd0ba071dd) 092001
NASA The corona Internet (httpsolarsciencemsfcnasagovcoronashtml) 180107
NASA The heliosphere Internet (httpheliosgsfcnasagovheliosphhtml) 20012009
OFFICIAL SITE OF STONEHENGE About Stonehenge Internet
(httpwwwstonehengecouk) (03022009)
OTTERSDORF M Astronomy On the sunspot cycle Internet
(httpuserszoominternetnet~matto MCASsunspot_cyclehtmZeemaneffect) 031103
PARIAT E and SCHMIEDER B Magnetic flux emergence Internet(httpwwwscholarpediaorgarticleMagnetic_field_emergence) 18042008
832019 Ew Afgewerkte Final
httpslidepdfcomreaderfullew-afgewerkte-final 5959
59
PRIEST E R Dynamics and Structure of Quiescent Solar Prominences Internet
(httpbooksgooglebe booksid=h599q3jz1w4Campdq=quiescent+prominencesampprintsec=fro
ntcoverampsource=blampots=58b79Qeyabampsig=1eklQ-
WszOIebZZaq7fq7gm6bxAamphl=nlampei=urPtSe7ZCo61-
Qa166jHDwampsa=Xampoi=book_resultampct=result ampresnum=3PPA6M2) 1989
RUSSELL R Rotation of the sun Internet
(httpwwwwindowsucaredutourlink=sunSolar_interior
Sun_layersdifferential_rotationhtml) 16082005
RUSSELL R Sunspots and magnetic fields Internet
(httpwwwwindowsucaredutourlink=sunatmospheresunspot_magnetismhtmlampedu=hig
h) 060908
UNIVERSITY OF GLASGOW Bibliography of Peter Sweet Internet
(httpwwwuniversitystoryglaacuk biographyid=WH2144amptype=P) (10042009)
WIKIPEDIA Orbiting Solar Observatory Internet
(httpenwikipediaorgwikiOrbiting_Solar_Observatory) 24012009
WINDOWS TEAM Maunderrsquos Butterfly Diagram Internet
(httpwwwwindowsucaredutourlink=sun activitybutterflyhtml) 2000
832019 Ew Afgewerkte Final
httpslidepdfcomreaderfullew-afgewerkte-final 5959
59
PRIEST E R Dynamics and Structure of Quiescent Solar Prominences Internet
(httpbooksgooglebe booksid=h599q3jz1w4Campdq=quiescent+prominencesampprintsec=fro
ntcoverampsource=blampots=58b79Qeyabampsig=1eklQ-
WszOIebZZaq7fq7gm6bxAamphl=nlampei=urPtSe7ZCo61-
Qa166jHDwampsa=Xampoi=book_resultampct=result ampresnum=3PPA6M2) 1989
RUSSELL R Rotation of the sun Internet
(httpwwwwindowsucaredutourlink=sunSolar_interior
Sun_layersdifferential_rotationhtml) 16082005
RUSSELL R Sunspots and magnetic fields Internet
(httpwwwwindowsucaredutourlink=sunatmospheresunspot_magnetismhtmlampedu=hig
h) 060908
UNIVERSITY OF GLASGOW Bibliography of Peter Sweet Internet
(httpwwwuniversitystoryglaacuk biographyid=WH2144amptype=P) (10042009)
WIKIPEDIA Orbiting Solar Observatory Internet
(httpenwikipediaorgwikiOrbiting_Solar_Observatory) 24012009
WINDOWS TEAM Maunderrsquos Butterfly Diagram Internet
(httpwwwwindowsucaredutourlink=sun activitybutterflyhtml) 2000