
Evolving technology and consumer expectations about television - Dean Martin, ACMA
30
Evolving technology and consumer expectations about television Dean Martin Senior Research Analyst, Digital Society Policy and Research Section, Australian Communications and Media Authority
-
Upload
acma-australian-communications-and-media-authority -
Category
Entertainment & Humor
-
view
1.144 -
download
0
Transcript of Evolving technology and consumer expectations about television - Dean Martin, ACMA

Evolving technology and consumer expectations
about television
Dean Martin
Senior Research Analyst, Digital Society Policy and Research
Section, Australian Communications and Media Authority

Television and technical advances
> Pace of change in broadcast television has been relatively slow until relatively recently
> Digitalisation has seen the household entertainment staple – the television set – move
into the age of higher screen resolution, better rendering, the internet, and apps
> A number of significant developments in recent years in technical standards for
broadcasting, mainly because of the move to digital
> Introduction (or trialling, or possible introduction) of technologies to enhance consumers’
viewing experience – including HD, 3D, and ultra HD
> Cost of flat screen LCD/LED and plasma television sets dropping, making newer
technologies more affordable and more common
Why the ACMA is interested
> The ACMA is responsible for technical planning for broadcasting services
> Advances in technical standards allow for increased opportunities to enhance
the viewer experience, e.g., 3D
> Also interested in understanding viewers’ experience with digital television, to
help our planning functions and assist with consideration of technical standards:
> Receivers (television sets, set top boxes and PVRs) and associated
reception equipment (antennas, cabling, connections and signal filters and
amplifiers) are important components in determining viewing experience –
not just broadcast signal strength
> Need to be mindful about the existing household television environment when
looking at technical standards or developing advice to government

Expectations about television equipment
> How have consumers responded to technical advances – the television sets and
other reception equipment they have?
> How long do Australian consumers expect a television set to last for?
> How often do they replace their main set?
> Is this changing as the price of television sets drops and new technology
arrives?
> Are Australian households getting the best out of their televisions sets?
> How adequate are domestic antenna systems?
To find out about household television sets and replacement…
> Omnibus survey conducted nationally by Newspoll with 1,203 respondents aged 18 years
and over
> Respondents were selected via a random sampling process
> Interviews were conducted by phone 27-29 May 2011
> Results were post-weighted to Australian Bureau of Statistics data on age, highest level
of schooling completed, sex and area
> Penrith antenna stock research, involving audits of 302 homes in Penrith, also captured
information about receivers and the main television set in each household
> Research conducted in Bathurst and Orange in 2010 (500 homes) also looked at aspects
of television equipment, such as number of sets and the age of the main set

Number of TV sets in household used in last 6 months (mean 2.2)
27
38
21
10
4
0
5
10
15
20
25
30
35
40
1 2 3 4 5 or more
%

Penrith – Main TV set has a built in digital tuner, by age of TV set (observed)
59
9488
66
14
3
41
612
34
86
97
0
20
40
60
80
100
120
Less than a year old 1-2 years old 2-5 years old 5-10 years old Over 10 years old
Total Age of main TV set
%
Has a built in digital tuner Does not/don't know

Penrith – Main TV with a set top box or other digital device attached, by age of main TV
set
42
35
2830
635958
65
7270
3741
0
10
20
30
40
50
60
70
80
Less than a year old 1-2 years old 2-5 years old 5-10 years old Over 10 years old
Total Age of main TV set
%
Has STB or other digital device No STB or digital device

When was a TV set last purchased? (Mean 3.1 years)
29
41
14
5
2
7
20
<1 year 1-3 yrs 4-5 yrs 6-7 yrs 8-9 yrs 10+ yrs Never Don't know
%

Was new set purchased to replace an existing TV set, if bought less than a year ago?
80
19
1
0
10
20
30
40
50
60
70
80
90
Yes No Don't know
%

Main reasons for buying a new TV set, if last purchase less than a year ago
5
5
9
13
19
27
32
48
59
66
69
To get a 3D TV
To get a TV with parental lock
To connect to the internet or access online content via your TV
To get a TV with a built in recorder
Some other reason
To get a TV with a built in electronic program guide
Old TV stopped working
To get more channels
Because the TV signal is switching to digital
To get a better quality picture
To get a TV with a flat or bigger screen
%

Cost of new TV set – price paid if purchased in last year, and expected cost, if last
purchase more than a year ago
2
16
21
17 17
10
8
45
2
9
17
2122
13
10
4
2
0
5
10
15
20
25
Less than $250 $250-$499 $500-$749 $750-$999 $1,000-$1,499 $1,500-$1,999 $2,000-$2,999 $3,000 or more Don't know
%
Price paid if less than a year ago Amount expect to spend on a new TV, if last purchase more than a year ago

Mean cost of new TV set if purchased less than a year ago, and mean amount expect
to spend, if last purchase more than a year ago, by age group
1,400
1,186
1,031
800
1,131
1,345 1,368
1,244
1,071
1,270
0
200
400
600
800
1,000
1,200
1,400
1,600
18-34 35-49 50-64 65 and over TOTAL
Mean cost ($)
Age group
Mean price paid if less than a year ago Mean amount expect to spend on a new TV, if last purchase more than a year ago
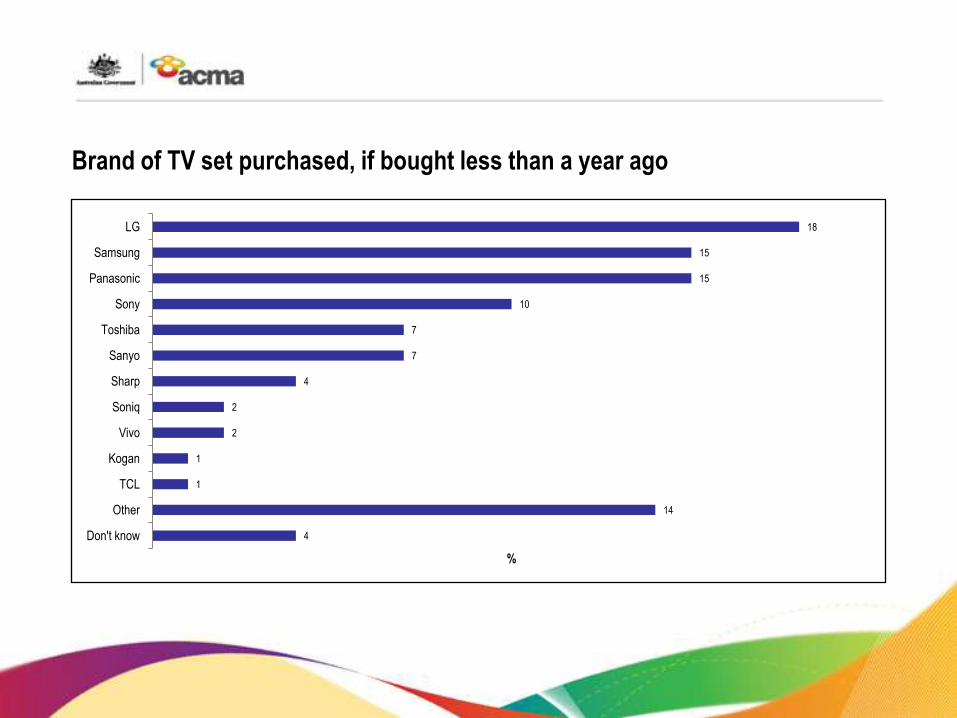
Brand of TV set purchased, if bought less than a year ago
4
14
1
1
2
2
4
7
7
10
15
15
18
Don't know
Other
TCL
Kogan
Vivo
Soniq
Sharp
Sanyo
Toshiba
Sony
Panasonic
Samsung
LG
%

Brand of TV set most likely to buy, if last purchase more than a year ago
7
26
0
0
1
2
2
11
11
19
20
0 5 10 15 20 25 30
Other
Don't know
Kogan
TCL
Toshiba
Sanyo
Sharp
LG
Samsung
Panasonic
Sony
%

Age of TV set that was replaced, if last purchase less than a year ago (mean 8.3 years)
16
2
19
9
33
1
0
5
10
15
20
25
30
35
3 years or less 4-5 years old 6-7 years old 8-9 years old 10 or more years old Don't know
%
Base: Those who have purchased a new set in last year, to replace an existing set, and were involved in decision (n=213)

Mean age of TV set replaced, if new set purchased less than a year ago, by age group
6.8
8.2 8.4
10.4
8.3
0
2
4
6
8
10
12
18-34 35-49 50-64 65 and over TOTAL
Mean age (years)
Age group

What was done with the old TV set?
8
2
2
4
14
18
18
35
0 5 10 15 20 25 30 35 40
Something else
Don't know
Sold
Gave to charity
Threw away or taken to dump
Gave to family or friends
Put in recycling or council collection
Kept
%

Length of time before need to replace current TV set if purchased less than a year ago
(mean 7.4 years)
15
29
18
5
25
7
0
5
10
15
20
25
30
35
3 years or less 4-5 years 6-7 years 8-9 years 10 or more years Don't know
%

How long a new TV set expected to last for if last purchase more than a year ago
(mean 8.7 years)
5
29
22
9
33
2
0
5
10
15
20
25
30
35
3 years or less 4-5 years 6-7 years 8-9 years 10 or more years Don't know
%

How long expect a new TV set to last
5
29
22
9
33
2
15
29
18
5
25
7
16
2019
9
33
1
0
5
10
15
20
25
30
35
3 years or less 4-5 years 6-7 years 8-9 years 10 or more years Don't know
%
If last set purchased more than a year ago (mean 8.7) If last set purchased within the past year (mean 7.4)
Age of TV set replaced if less than a year ago (mean 8.3)

What does this mean?
> There are many different models of television sets currently in people’s homes, and providing advice
specific to a model is difficult
> Most had bought a new set in the last 3 years, so the technical specifications of many existing sets
will be current
> The majority of purchases where to replace an existing set (80 per cent), but many of these were
expected to serve a second life
> To get a better viewing experience was the main reason people gave for buying a new TV set
> The switch to digital, and to get more channels were also significant drivers
> For most, the price paid for a new TV set was lower than what was expected
> Older age groups were more likely to replace a TV set when it was older (10 or more years old) and
pay less for a new one – so the technical specifications of TV equipment in older people’s homes is
likely to be less current
> On average, a new TV set was expected to last 7 to 8 years

Domestic antenna systems and reception
> ACMA has conducted two studies into domestic antenna stock:
> Phone interviews and in-house audits of 500 households in Bathurst and
Orange in 2010
> In-house audits of 302 households in Penrith in 2011
> First study examined different methodologies for collecting data on antenna
stock, in a regional area
> Second study used the preferred methodology and applied it to a fringe
metropolitan area, to understand if there are particular issues in such a location
> Antenna systems are an important but often neglected part of the reception
chain, that ends with the picture displayed on the television screen

Digital households—adequacy of antennas, Bathurst and Orange, 2010

Quality of reception—Penrith, 2011

mySwitch – Penrith coverage http://myswitch.digitalready.gov.au/

Domestic antenna systems

Age of antennas
> In Penrith antennas were typically quite old, with around half being assessed as
being over 10 years old
> In Penrith, 42 per cent had two or more antennas – 11 per cent in Bathurst-
Orange
> In Bathurst and Orange, 46 per cent of antennas were assessed as being less
than 5 years old – this could be because this region is switching over to digital
sooner than Penrith
> Generally, reports by respondents underestimated the age of the antenna, and
over-estimated its condition

Antenna direction in Penrith – Sydney and Illawarra services
> Use of services from adjacent transmission sites was relatively common in
Penrith, mainly for historical reasons
> 95 per cent of households had at least one antenna directed towards Gore
Hill/Willoughby/Artarmon, the main Sydney metro transmitters
> 30 per cent had at least one antenna directed towards Illawarra, the main out of area
service
> 45 per cent of households with an antenna pointed towards Gore Hill/Artarmon with
inadequate or marginal reception had the wrong antenna type – generally one that could
not receive all digital channels (n=106)
> For antennas pointed towards Illawarra, the reasons for inadequate or marginal reception
were more likely to be because of inadequate gain (no or poor masthead amplifier – 62
per cent) or because the antenna direction was incorrect (17 per cent) (n=24)

Conclusions about antenna stock and reception
> Antenna stock research indicated that about 7 per cent of households in Bathurst and
Orange, and also in Penrith, had inadequate digital reception
> Inadequate reception was for many reasons, including the antenna type and condition
> also because of built and natural landscape features
> in Penrith, patchy coverage was also a factor
> Those with inadequate or marginal digital reception may need to look at replacing or
improving their antenna system – as many were originally installed before digital
transmissions started
> Consumer focus is much more on the TV set, and less on the other components of the
reception chain, including antennas, cabling and outlets
> Information from the antenna stock studies will help the ACMA’s engineers with
planning, and help inform advice provided to consumers