Evolutionary population synthesis: models, analysis …evolution, by means of which one can include...
29
arXiv:astro-ph/0410207v2 22 Jun 2005 Mon. Not. R. Astron. Soc. 000, 000–000 (2005) Printed 13 September 2018 (MN L A T E X style file v2.2) Evolutionary population synthesis: models, analysis of the ingredients and application to high-z galaxies Claudia Maraston ⋆ Max-Planck-Institut f¨ ur extraterrestrische Physik, Giessenbachstraße, D-85748 Garching b. M¨ unchen, Germany Accepted 2005 June 8. Received 2005 May 27; in original form 2004 October 5 ABSTRACT Evolutionary population synthesis models for a wide range of metallicities, ages, star for- mation histories, initial mass functions, and Horizontal Branch morphologies, including blue morphologies at high metallicity, are computed. The model output comprises spectral energy distributions, colours, stellar M/L ratios, bolometric corrections, and near-infrared spectral line indices. The energetics of the post Main Sequence evolutionary phases are evaluated with the fuel consumption theorem. The impact on the models of the stellar evolutionary tracks (in particular with and without overshooting) is assessed. We find modest differences in synthetic broad-band colours as induced by the use of different tracks in our code (e.g., Δ(V - K) ∼ 0.08 mag; Δ(B - V ) ∼ 0.03 mag). Noticeably, these differences are sub- stantially smaller than the scatter among other models in the literature, even when the lat- ter adopt the same evolutionary tracks. The models are calibrated with globular cluster data from the Milky Way for old ages, and the Magellanic Clouds plus the merger remnant galaxy NGC 7252, both for young ages of ∼ 0.1 - 2 Gyr, in a large wavelength range from the U -band to the K-band. Particular emphasis is put on the contribution from the Thermally- Pulsing Asymptotic Giant Branch phase. We show that this evolutionary phase is crucial for the modelling of young stellar populations by the direct comparison with observed spectral energy distributions of Magellanic Clouds clusters, which are characterised by relatively high fluxes both blueward and redward the V -band. We find that the combination of the near-IR spectral indices C 2 and H 2 O can be used to determine the metallicity of ∼ 1 Gyr stellar populations. As an illustrative application, we re-analyze the spectral energy distributions of some of the high-z galaxies (2.4 ∼ < z ∼ < 2.9) observed with the Spitzer Space Telescope by Yan et al. (2004). Their high rest-frame near-IR fluxes are reproduced very well with the models including Thermally-Pulsing Asymptotic Giant Branch stars for ages in the range ∼ 0.6 - 1.5 Gyr, suggesting formation redshifts for these objects around z ∼ 3 - 6. Key words: stars: evolution - stars: AGB and post-AGB galaxies: evolution - galaxies: stellar content - cosmology: early universe 1 INTRODUCTION The evolutionary population synthesis (EPS) is the technique to model the spectrophotometric properties of stellar populations, that uses the knowledge of stellar evolution. This approach was pio- neered by B. Tinsley in a series of fundamental papers, that pro- vide the basic concepts still used in present-day computations. The models are used to determine ages, element abundances, stel- lar masses, stellar mass functions, etc., of those stellar popula- tions that are not resolvable in single stars, like galaxies and extra- galactic globular clusters. Due to the ubiquitous astrophysical ap- plications of EPS models, a rich literature has been developed so far ⋆ Current address: University of Oxford, Denys Wilkinson Building, Keble Road, Oxford, OX1 3RH, UK (Bruzual 1983; Renzini & Buzzoni 1986; Chiosi, Bertelli and Bres- san 1988; Buzzoni 1989; Charlot & Bruzual 1991; Bruzual & Char- lot 1993; Worthey 1994; Vazdekis et al. 1996; Tantalo et al. 1996; Fioc & Rocca-Volmerange 1997; Bressan, Granato & Silva 1998; Maraston 1998; Leitherer et al. 1999; Brocato et al. 2000; Thomas, Maraston & Bender 2003; Thomas, Maraston & Korn 2004). In the simplest flavour of an EPS model, called Simple Stel- lar Population (hereafter SSP) by Renzini (1981), it is assumed that all stars are coeval and share the same chemical composition. The advantage of dealing with SSPs is twofold. First, SSPs can be compared directly with globular cluster (GC) data, since these are the “simplest” stellar populations in nature. This offers the advan- tage of calibrating the SSPs with those GCs for which ages and element abundances are independently known, an approach intro- duced in the review by Renzini & Fusi Pecci (1988). This step is
Transcript of Evolutionary population synthesis: models, analysis …evolution, by means of which one can include...

arX
iv:a
stro
-ph/
0410
207v
2 2
2 Ju
n 20
05
Mon. Not. R. Astron. Soc.000, 000–000 (2005) Printed 13 September 2018 (MN LATEX style file v2.2)
Evolutionary population synthesis: models, analysis of theingredients and application to high-z galaxies
Claudia Maraston⋆Max-Planck-Institut fur extraterrestrische Physik, Giessenbachstraße, D-85748 Garching b. Munchen, Germany
Accepted 2005 June 8. Received 2005 May 27; in original form 2004 October 5
ABSTRACTEvolutionary population synthesis models for a wide range of metallicities, ages, star for-mation histories, initial mass functions, and Horizontal Branch morphologies, including bluemorphologies at high metallicity, are computed. The model output comprises spectral energydistributions, colours, stellar M/L ratios, bolometric corrections, and near-infrared spectralline indices. The energetics of the post Main Sequence evolutionary phases are evaluatedwith the fuel consumption theorem. The impact on the models of the stellar evolutionarytracks (in particular with and without overshooting) is assessed. We find modest differencesin synthetic broad-band colours as induced by the use of different tracks in our code (e.g.,∆(V − K) ∼ 0.08 mag; ∆(B − V ) ∼ 0.03 mag). Noticeably, these differences are sub-stantially smaller than the scatter among other models in the literature, even when the lat-ter adopt the same evolutionary tracks. The models are calibrated with globular cluster datafrom the Milky Way for old ages, and the Magellanic Clouds plus the merger remnant galaxyNGC 7252, both for young ages of∼ 0.1 − 2 Gyr, in a large wavelength range from theU -band to theK-band. Particular emphasis is put on the contribution from the Thermally-Pulsing Asymptotic Giant Branch phase. We show that this evolutionary phase is crucial forthe modelling of young stellar populations by the direct comparison with observed spectralenergy distributions of Magellanic Clouds clusters, whichare characterised by relatively highfluxes both blueward and redward theV -band. We find that the combination of the near-IRspectral indicesC2 andH2O can be used to determine the metallicity of∼ 1 Gyr stellarpopulations. As an illustrative application, we re-analyze the spectral energy distributions ofsome of the high-z galaxies (2.4
∼<z
∼< 2.9) observed with the Spitzer Space Telescope by
Yan et al. (2004). Their high rest-frame near-IR fluxes are reproduced very well with themodels including Thermally-Pulsing Asymptotic Giant Branch stars for ages in the range∼ 0.6− 1.5 Gyr, suggesting formation redshifts for these objects aroundz ∼ 3− 6.
Key words: stars: evolution - stars: AGB and post-AGB galaxies: evolution - galaxies: stellarcontent - cosmology: early universe
1 INTRODUCTION
The evolutionary population synthesis (EPS) is the technique tomodel the spectrophotometric properties of stellar populations, thatuses the knowledge of stellar evolution. This approach was pio-neered by B. Tinsley in a series of fundamental papers, that pro-vide the basic concepts still used in present-day computations.The models are used to determine ages, element abundances, stel-lar masses, stellar mass functions, etc., of those stellar popula-tions that are not resolvable in single stars, like galaxiesand extra-galactic globular clusters. Due to the ubiquitous astrophysical ap-plications of EPS models, a rich literature has been developed so far
⋆ Current address: University of Oxford, Denys Wilkinson Building, KebleRoad, Oxford, OX1 3RH, UK
(Bruzual 1983; Renzini & Buzzoni 1986; Chiosi, Bertelli andBres-san 1988; Buzzoni 1989; Charlot & Bruzual 1991; Bruzual & Char-lot 1993; Worthey 1994; Vazdekis et al. 1996; Tantalo et al. 1996;Fioc & Rocca-Volmerange 1997; Bressan, Granato & Silva 1998;Maraston 1998; Leitherer et al. 1999; Brocato et al. 2000; Thomas,Maraston & Bender 2003; Thomas, Maraston & Korn 2004).
In the simplest flavour of an EPS model, calledSimple Stel-lar Population (hereafter SSP) by Renzini (1981), it is assumedthat all stars are coeval and share the same chemical composition.The advantage of dealing with SSPs is twofold. First, SSPs can becompared directly with globular cluster (GC) data, since these arethe “simplest” stellar populations in nature. This offers the advan-tage ofcalibrating the SSPs with those GCs for which ages andelement abundances are independently known, an approach intro-duced in the review by Renzini & Fusi Pecci (1988). This step is
c© 2005 RAS

2 C. Maraston
crucial to fix the parameters that are used to describe that part of themodel “input physics” - convection, mass loss, mixing - thatcan-not be derived from first principles. The calibrated models can beapplied with more confidence to the study of extragalactic stellarpopulations. This step is taken in the models of Maraston (1998)and in their extension presented here. Second, complex stellar sys-tems which are made up by various stellar generations are mod-elled by convolving SSPs with the adopted star formation history(e.g. Tinsley 1972; Arimoto & Yoshii 1986; Rocca-Volmerange &Guiderdoni 1987; Vazdekis et al. 1996; Kodama & Arimoto 1997;Barbaro & Poggianti 1997; Bruzual & Charlot 2003). Therefore thedeep knowledge of the building blocks of complex models is veryimportant.
Two techniques are adopted to compute SSP models, whichdiffer according to the integration variable adopted in thepost-Main Sequence: isochrone synthesis and ‘fuel consumption based’algorithms. With the ‘isochrone synthesis’ (e.g. Chiosi, Bertelli &Bressan 1988; Charlot & Bruzual 1991) the properties of a stel-lar population are calculated by integrating the contributions to theflux in the various passbands of all mass-bins along one isochrone,after assuming an Initial Mass Function (IMF). Usually isochronesare computed up to the end of the Early Asymptotic Giant Branchphase. Later stellar phases like the Thermally-Pulsing AsymptoticGiant Branch are added following individual recipes or are ne-glected.
In the ‘fuel consumption’ approach (Renzini 1981; Renzini &Buzzoni 1986; Buzzoni 1989; Maraston 1998), the integration vari-able in Post Main Sequence is the so-calledfuel, that is the amountof hydrogen and/or helium that is consumed via nuclear burningduring a given post Main Sequence phase. The fuel at a given ageis computed on the stellar evolutionary track of theturnoff mass(i.e., the mass completing the hydrogen-burning phase), therebyneglecting the dispersion of stellar masses in post main sequence.However since a mass difference of only few percent exists be-tween theturnoff mass and the mass at any other post-Main Se-quence phase, this assumption can be made safely, as also shownby Charlot & Bruzual (1991). The advantages of the fuel consump-tion approach are of two kinds. First, the fuel as integration variableis very stable since it is directly proportional to the contributions ofthe various phases to the total luminosity. This is very important inluminous, but short-lived evolutionary stages, e.g. the bright RedGiant Branch phase, where the evolutionary mass practically doesnot change. We note that the problem of the numerical instabilityon the RGB was early recognized by Tinsley & Gunn (1976). Sec-ond, and more important, there are several relevant stellarphases(e.g. blue Horizontal Branch, Thermally Pulsing Asymptotic GiantBranch, very hot old stars etc.) whose theoretical modelingis un-certain because of mass loss and for which complete stellar tracksare not available. The fuel consumption provides useful analyticalrelations that link the Main Sequence to the post Main Sequenceevolution, by means of which one can include into the synthesis theenergy contributions of these uncertain phases using, e.g.observa-tions. The ‘isochrone synthesis’ technique is used in all models inthe literature, with the exception of the models by Buzzoni (1989),Maraston (1998) and those presented here, that adopt the fuel con-sumption theorem.
Besides the method used to compute them, evolutionary pop-ulation synthesis models keep the uncertainties inherent in the stel-lar evolutionary tracks and in the spectral transformations. Charlot,Worthey & Bressan (1996) investigated both classes of uncertain-ties by comparing their EPS models. The analysis is very illustra-tive for the three considered EPS, however does not yield informa-
tion about the sole impact of the stellar tracks. Here we makeadifferent exercise, because we can use the same EPS code and justvary the model ingredients. In this way we can isolate their impacton the final model. To quantify the model uncertainties is indeedvery important since the cosmological inferences that are derivedon the basis of galaxy ages and metallicities rely ultimately on thestellar population models.
Maraston (1998) presents a fuel-consumption-based code forevolutionary population synthesis, and SSP models for solar metal-licity, and ages from 30 Myr to 15 Gyr. Distinct features of thatwork are:
(i) the extension of the fuel consumption theorem to computemodels for young and intermediate-range ages;
(ii) the inclusion of a well-calibrated semi-empirical Thermally-pulsing Asymptotic Giant Branch phase, and the computationofrealistic colors of intermediate-age (t∼< 2 Gyr) stellar populations
(iii) the modular structure of the code, that allows experimentswith the EPS ingredients.
Subsequentely the code has been updated to the computationsofSSP models covering a wide range in metallicities and the modeloutput have been extended to e.g. the spectral energy distributions,spectral indices, redshift evolution, with several applications beingalready published (Maraston & Thomas 2000; Saglia et al. 2000;Maraston et al. 2001; Maraston et al. 2003; Thomas, Maraston& Bender 2003; Thomas, Maraston & Korn 2004; Ferraro etal. 2004). This work is devoted to discuss comprehensively theoverall EPS models and ingredients, in particular, the inclusion ofthe TP-AGB phase in the synthetic spectral energy distributions.
The paper is organized as follows. In Section 2 the proper-ties of the evolutionary population synthesis code are recalled. Themodel ingredients, i.e. the fuel consumptions, the temperature dis-tributions and the model atmospheres, for the various metallici-ties and ages, are described in detail in Section 3. In particular,the recipes for Horizontal Branch and Thermally Pulsing Aymp-totic Giant Branch are presented in Section 3.4. The variousmodeloutput are discussed in Section 4, where the comparisons with ob-servational data and with models from the literatures are also pre-sented. Section 5 deals with the model uncertainties, whileSec-tion 6 presents an high-redshift application of the model SEDs inwhich the TP-AGB has a primary importance. Finally a summaryof the main results is given in Section 7.
2 ALGORITHM
In this section we recall the basic equations that define the algo-rithm of the EPS code by Maraston (1998, hereafter M98). Follow-ing Renzini & Buzzoni (1986, hereafter RB86), the total bolomet-ric luminosity of a SSP of aget and chemical composition[Y, Z],is splitted conveniently into the contributions by Main Sequence(MS) and post Main Sequence (PMS)
Lbol
SSP(t; [Y,Z]) = Lbol
MS(t; [Y,Z]) + Lbol
PMS(t; [Y, Z]). (1)
because the two quantities depend on different ingredients. TheMS light is produced by stars spanning a very wide mass range,while the PMS one is produced by stars of virtually the same mass.ThereforeLbol
MS depends on the adopted mass-luminosity relationL(M, t) and IMF,Ψ(M) = AM−s (A being the scale factor re-lated to the size of the stellar population), whileLbol
PMS depends onthe nuclear fuel burned in the various evolved stellar stages. TheMS luminosities are computed by integrating the contributions by
c© 2005 RAS, MNRAS000, 000–000
Evolutionary population synthesis: models, analysis of the ingredients and application to high-z galaxies 3
each mass bins along a isochrone, from a lower mass limitMinf
(usually0.1 M⊙) to the current turnoff massMTO(t), having as-sumed an IMFΨ(M)
Lbol
MS(t; [Y,Z]) =
∫MTO
Minf
L(M(t; [Y,Z]))ψ(M)dM (2)
The PMS luminosity contributions are computed by means of theFuel Consumption Theorem(RB86)
Lbol
PMS(t; [Y,Z]) = 9.75·1010 ·b(t)·∑J
FuelJ(MTO(t; [Y, Z]))(3)
where theevolutionary fluxb(t; [Y,Z]),
b(t; [Y,Z]) = ψ(MTO(t; [Y,Z]))|MTO| (4)
provides the rate of stars evolving to any PMS phasej at theage t of the stellar population, andFuelJ(MTO(t;Y,Z)) is theamount of stellar mass to be converted in luminosity in each ofthese phases. The multiplicative factor in Eq. 3 stems from ex-pressing the luminosity in solar units, the evolutionary flux b(t)in years and the fuel in solar masses through the Einstein equationE = ∆M · c2, with ∆ = 6.55 · 10−3. The latter is derived byconsidering that the transformation of 1 g of H into He releases∼ 5.9 · 1018 erg. This average value takes into account the depen-dence on whether the CNO cycle or the pp chain is at work andthe different neutrino losses as a function of the temperature of theburning (Renzini 1981).
3 INGREDIENTS
Following M98, the ingredients of evolutionary synthesis modelsare:
(i) The energetics: mass-luminosity relations for the MS andfuel consumptions for PMS phases;
(ii) The surface parameters: the effective temperatures and sur-face gravities of the evolutionary phases;
(iii) The transformations to observables: spectra, or colours andbolometric corrections as functions of gravity and temperature, toconvert the bolometric luminosity into a spectral energy distribu-tion.
The key feature of the code is to have the three ingredients beingallocated in threeindependentsets of matrices. This is very conve-nient as the code can be used to understand the impact of the var-ious inputselectivelyon the final result. We will use this structureto understand the discrepancies between EPS models that arebasedon different stellar evolutionary tracks. The adopted ingredients aredescribed in the next subsections.
3.1 Energetics
The first matrix contains the energetics, i.e. the luminosities of MSstars and the fuel consumptions of PMS phases. In general, bothare taken from stellar evolutionary models, except for those stellarphases that are poorly understood (Section 3.4), for which the en-ergetics are estimated semi-empirically, by means of observationsand with the aid of the fuel consumption theorem.
3.1.1 Stellar models
The bulk of input stellar models (tracks and isochrones) is fromCassisi et al. (1997a,b; 2000; see also Bono et al. 1997). Their
main features are summarized in the following. These arecanoni-cal stellar evolutionary tracks, i.e. the efficiency of the overshoot-ing parameter is assumed to be zero. The actual size of the over-shooting is a matter of debate since several years and work isinprogress to calibrate the overshooting parameter with observationaldata (Bertelli et al. 2003; Woo et al. 2003). These articles favourmoderate amounts of overshooting, but the results on different stel-lar evolutionary tracks are discrepant. The Cassisi tracksare usedto compute what we will refer to asstandardSSP models. Thechoice of these tracks as basis is due to the following reasons: i)extensive calibrations with galactic globular clusters (GCs) havebeen performed (Cassisi & Salaris 1997; Cassisi, Degl’Innocenti,Salaris 1997; De Santi & Cassisi 1999); ii) tracks (isochrones) areprovided with very fine time (mass) spacing (e.g., a typical RedGiant Branch track contains∼ 5000 models) which is essentialto perform good numerical integrations; iii) these tracks are theclosest to the ones (from Castellani, Chieffi & Straniero 1992) thatwere adopted for the solar metallicity models presented in M98.For sake of homogeinity, the M98 models have been re-computedwith the solar metallicity tracks of the Cassisi’s database. Minimaldifferences have been found, that are due to the temperature/colourtransformations rather than to the stellar tracks. The metallicity ofthe Cassisi tracks range fromZ⊙/200, typical of the Milky Wayhalo to2Z⊙, the helium enrichment law being∆Y/∆Z ∼ 2.5. Inorder to extend the metallicity range, we implement a set of trackswith 3.5 solar metallicity, and the same∆Y/∆Z, from the Padovadatabase (see below). The exact values of helium and metals for theSSP grid are tabulated in the section presenting the results.
Most SSP models in the literature are based on the tracks bythe Padova group (Fagotto et al. 1994; Girardi et al. 2000; Salas-nich et al. 2000). Therefore it is interesting to explore theeffectsof other stellar evolutionary tracks, on the ages and metallicitiesinferred for real stellar populations. To this aim several SSPs havebeen computed by means of the Padova stellar models. The variouscomparisons will be shown in Section 5. The issue is a very impor-tant one as at metallicities above solar, i.e. in the range more rele-vant to massive galaxies, the calibration of the tracks is hamperedby the lack of GCs with ages and chemical compositions knownindependently.
Finally the solar metallicity isochrones/tracks of the Genevadatabase (Schaller et al. 1992; Meynet et al. 1994) are adopted inorder to compute very young SSPs (10−3 6 t/Myr < 30).
3.1.2 Main Sequence: Mass Luminosity relations
Isochrones are adopted up to the turnoff, and the MS luminositycontributions are evaluated by means of Equation 2. Therefore theresults depend on the mass-luminosity relations of the isochrones.Figure 1 compares the mass-luminosity relations of the isochronesfrom Cassisi and Padova (solid and dotted lines, respectively) forvarious ages and metallicities. In general, a fairly good agreement isfound for masses∼> 0.5M⊙, independent of the metallicity, whilethe low MS of the Padova tracks with high metallicity (solar andabove) is brighter than that of the Cassisi tracks, by nearlya factor2. However this effect is not important, because the contribution ofthe low MS to the total light is very small, unless the stellarpop-ulation has a very steep IMF (e.g.s∼> 3.5 in the notation in whichthe Salpeter exponent is 2.35, M98), so that its light is dwarf dom-inated. Noticeable is instead the effect of overshooting, because ofwhich the Padova MS has a turnoff mass at given age that islargerthan that of canonical tracks (e.g. at 3 Gyr and solar metallicitythe turnoff masses are1.45M⊙ and1.37M⊙, respectively). Stel-
c© 2005 RAS, MNRAS000, 000–000

4 C. Maraston
Figure 1. The relation between luminosity and mass for the isochronesofCassisi (solid lines) and Padova (dotted lines). The metallicities are labelled.Note that the relations for solar and twice solar metallicities nearly overlap.
lar models with overshooting have more massive convective cores,therefore they run to higher luminosities and live longer than clas-sical models. This effect stems from the higher fuel for given masswhen overshooting is considered, which prolongues the MS life-time. The effect lasts until the mass has a convective core ontheMS, i.e. it disappears forM ∼< 1M⊙.
As to metallicity effects, at given mass a higher metal contentmakes the star fainter, because of the combined effects of the lessamount of hydrogen and the higher opacity. For example, a0.8M⊙
star with 2 Z⊙ metallicity is a factor 3 fainter on the MS than onewith the same mass but metallicityZ⊙/200. Instead, there is nodifference between the solar and twice-solar metallicity MS rela-tions. This comes from the fact that helium increases along withmetallicity in both tracks, according to the helium enrichment law∆Y/∆Z ∼ 2.5. The higher helium at larger metallicity counter-balances the metallicity effects and keeps the star at roughly thesame brightness.
In order to link the PMS evolution of the turnoff mass to itsMS, one needs to know the rate of evolution of turnoff-like starsoff the MS through the later evolutionary stages, as a function ofthe SSP parameters (age, metallicity, IMF). According to RB86this quantity is expressed analytically by the evolutionary flux b(t)(Eq. 4), that is proportional to the time derivative of the relationturnoff mass/age and the adopted IMF. The dependence of the func-tion b(t) on the SSP parameters is shown in Figure 2. The mainpanel focuses on age and chemical composition effects, the smallone on the IMF. Obviouslyb(t) depends mainly on the age of theSSP, as the derivative of the turnoff mass does, while metallicityeffects have a much milder influence. The effect of the IMF onb(t) was discussed in M98. In brief, the flatter the IMF, the slowerΨ(M) increases with time, so that the rapid decrease inMTO dom-inates for flat IMFs. This results in a steeper SSP luminosityevo-lution for flatter IMFs. In the small box in Figure 2 we showb(t)for a Kroupa (2001) IMF, that will be used as alternative choiceto the Salpeter one to compute SSP models. The Kroupa (2001)IMF is described as a multiple-part power law, with exponents: 1.3for 0.1∼<M/M⊙ ∼< 0.5M⊙, 2.3 for larger masses (in the notationin which the Salpeter exponent is 2.35). The Kroupa IMF has arelatively higher fraction of massive stars, which explains why thecorrespondentb(t) is steeper than that referred to the Salpeter IMF(note that theb(t)’s are normalized to1 M⊙ of total mass of theparent SSP and it is the normalization factor that produces the dif-ference).
Figure 2. The evolutionary fluxb(t) (Eq. 4) that measures the rate of evolu-tion off the MS, for various metallicities. Theb(t) are normalized by meansof the IMF scale factorA in such a way as to be referred to 1M⊙. TheIMF dependence is highlighted in the small internal box, where theb(t)for solar metallicity are shown for the Kroupa and the Salpeter IMF. TheKroupa SSP has a∼ 30 per cent higher evolutionary rate with respect to theSalpeter SSP.
3.1.3 Post Main Sequence: Fuel comsumptions
The luminosity contributions of the PMS phases are computedbymeans of the fuel consumption theorem, according to Eq. 3. Thenomenclature of the main PMS evolutionary phases, in order afterthe MS, are: Sub Giant Branch (SGB); Red Giant Branch (RGB);Helium Burning or Horizontal Branch (HB); Early AsymptoticGi-ant Branch (E-AGB); Thermally Pulsing Asymptotic Giant Branch(TP-AGB). The stellar evolutionary phases are highlightedon theobserved colour magnitude diagram of NGC 1851, a metal-poorGC of the Milky Way (data from Piotto et al. 2002).
In order to compute the fuels, evolutionary tracks are adoptedup to the completion of the E-AGB. Complete tracks for the TP-AGB phase are not available. In fact it is difficult to follow thephysics of the stellar interiors during the thermal pulses and stel-lar tracks are actually restricted to envelope models (e.g.Renzini& Voli 1981; Iben & Renzini 1983; Lattanzio 1986; Boothroyd &Sackmann 1988; Bloecker & Schoenberner 1991; Marigo, Bressan& Chiosi 1996; Wagenhuber & Gronewegen 1998; Marigo 2001;Mouhcine & Lancon 2002), and even the latter are uncertain dueto the occurrence of strong mass-loss that aborts the phase (thesu-perwindphase, Iben & Renzini 1983). In the present models theenergetics of the TP-AGB comes from the semi-empirical calibra-tion of M98 (see Section 3.4.3).
The fuel for the evolutionary phasej (until the E-AGB) is com-puted by integrating the product of the evolutionary time and theemergent luminosity along the track appropriate to that phase. Thetracks for the given turnoff masses are obtained from interpolationin log mass. The evolutionary mass for the helium burning phaseMHB is obtained fromMTO after evaluation of the mass loss dur-ing the RGB. This allows to play with various HB morphologies(see Section 3.4). Finally, the separation between HB and E-AGB
c© 2005 RAS, MNRAS000, 000–000

Evolutionary population synthesis: models, analysis of the ingredients and application to high-z galaxies 5
Figure 4. The fuel consumptions (inM⊙) in the various PMS phases, as functions of the turnoff mass,for various metallicities.
is set when the mass of the CO core along the track is differentfromzero. Note that each phase is divided suitably into a certainnum-ber of subphases, in order to map appropriately the spectraltypechanges (M98). The criterion for the subdivision into suphases de-pends on the temperature, therefore is described in Section3.2.
Figure 4 shows the fuels (inM⊙) for the PMS evolutionaryphases, as functions of the turnoff mass, for various metallicities.As already pointed out by RB86, the most relevant PMS phasechanges with the evolutionary mass, i.e. with the age of the stel-lar population, and we find here that the trend does not dependonthe chemical composition.
In massive stars (M ∼> 3M⊙), i.e. those dominatingyoung-t∼< 0.2 Gyr - stellar populations, the dominant PMS phase is theHB, its fuel decreases with the decreasing stellar mass. In low-massstars (M ∼< 2 M⊙), i.e. those dominatingold - t∼> 2 Gyr - stel-lar populations, the RGB phase is the most important PMS phase,when a He-degenerate core is developed (RB86; Sweigart, Greg-gio & Renzini 1989). Stars with masses in the narrow mass rangebetween 3 and 2M⊙, i.e. those dominating0.2∼<t/Gyr∼< 2 oldstellar populations, spend a conspicuos amount of fuel on the TP-AGB phase. The onset of the development of the TP-AGB and RGBphases has been called by RB86 “phase transitions”.
The HB fuel (left-hand upper panel) of massive stars is af-fected by metallicity in the sense of a higher fuel at a lower metalcontent, owing to the higher relative abundance of hydrogen, aneffect similar to what pointed out for the MS luminosity (Sec-tion 3.1.2). For example, at masses∼> 4M⊙, theZ⊙/20 metal-licity has nearly a factor 2 more fuel than the solar one. In the smallmass regime (M ∼< 1.5M⊙, tSSP ∼> 3 Gyr) metallicity effects arenegligible.
The RGB phase (right-hand upper panel) starts to develop at
masses around2 M⊙ almost independent of metallicity in theseclassical (no overshooting) tracks, in excellent agreement with theearly findings by Sweigart, Greggio & Renzini (1990). The RGBfuel is rather insensitive to metallicity untilZ⊙. For reference, a10 Gyr,Z⊙/200 stellar population has0.24M⊙ of RGB fuel anda coeval one with solar metallicity0.23 M⊙. However, at highermetallicities the RGB fuel starts decreasing with increasing metalcontent, and for example a stellar population with3.5 Z⊙ (see Fig-ure 5) has0.15 M⊙ of RGB fuel, nearly 35 per cent less than thesolar chemical composition. This is the effect of the very high he-lium abundance associated to the high metal content becauseof thehelium enrichment law∆Y/∆Z ∼ 2.5, that reduces drasticallythe amount of hydrogen, i.e. the RGB source of fuel. A discussionon the effect of helium abundance on the fuel of PMS phases isfound in Greggio & Renzini (1990).
The TP-AGB fuel (middle upper panel) is one of the mostconspicuous, together with that in HB and RGB, and is a strongfunction of the stellar mass, therefore of the age of the stellar pop-ulation. It reaches a maximum for masses between 3 and 2M⊙
and is negligible for masses outside this narrow intermediate-massrange. Furthermore, the TP-AGB fuel does not depend appreciablyon metallicity (see Section 3.4.3).
Finally the SGB and E-AGB (lower panels) are the least im-portant phases, providing at most∼ 20 per cent and∼ 10 per cent,respectively of the total PMS luminosity (see also Section 4.1).
Figure 5 shows the total fuel consumption in the whole PMS,as a function of age, for the various metallicities. In interpretingthis figure in a stellar population perspective it is useful to remindthat the fuel scales directly with the PMS luminosity of a stellarpopulation.
The effect of the chemical composition that we discussed pre-
c© 2005 RAS, MNRAS000, 000–000

6 C. Maraston
Figure 3. The stellar evolutionary phases indicated on the observedcolour magnitude diagram of the metal-poor Milky Way globular clustersNGC 1851 (data from Piotto et al. 2002). BS stays for ’blue stragglers’, aclass of stars not included in the evolutionary synthesis. No separation ismade between the early and the thermally-pulsing AGB.
viously is evident on the total fuel of stellar populations with agessmaller than∼ 1 Gyr, that is larger the lower the metal contentis. A young metal-poor stellar population withZ = Z⊙/20 has∼20 per cent more fuel to be burned, e.g. is 20 per cent brighterthana coeval one in which the metallicity is twice solar. In olderstellarpopulations metallicity effects become less important, asa conse-quence of the small metallicity dependence of the RGB fuel, thatis the largest source of energy at high ages. An exception is how-ever the very metal-rich stellar population (Z = 3.5 Z⊙, dashed-dotted line), that at old ages has∼ 25 per cent less fuel than allother chemical compositions, for which the fuel scatter around avalue∼ 0.4 M⊙. This is due to the very high abundance of he-lium in these tracks, caused by the assumed helium enrichment law(∆Y/∆Z ∼ 2.5), that implies the abundance of hydrogen to beonly 0.45. This explains the sharp decrease in fuel since hydrogenis its most important source.
The sizable increase of PMS fuel at ages around 0.3 Gyr(log t ∼ 8.47) marks the onset of the AGB phase transition, that isdominated by the TP-AGB (M98, Figure 4). At later ages the RGBphase transition occurs, which is barely visible in Figure 5as asmall bump around 1 Gyr, due to the simulatenous decrease of TP-AGB fuel. Finally, the bumps in the fuels at late ages (t∼> 6 Gyr)reflect the trend of the SGB fuel (Figure 4). After the developmentof the TP-AGB,∼ 70 per cent of the total energy of a stellar pop-ulation comes from PMS stars (Figure 6).
The dependence of MS and PMS energetics on stellar evolu-tionary tracks is illustrated in Figure 7. The transition from a notdegenerate to a degenerate helium core, that marks a well devel-oped RGB phase and a drop in the HB fuel, occurs at later epochsif overshooting is taken into account in the stellar models.This isshown in the top panels of Figure 7, where the fuels obtained withclassical (solid) and overshooting (dotted) tracks as functions of theage of the stellar populations are compared. The RGB phase transi-
Figure 5. The total fuel consumptions (inM⊙) in the whole PMS, as afunction of the age of the SSP, for the various metallicities. Note that thefuel scales directly with luminosity. The very-metal rich SSP of the Padovadatabase (long-dashed/dotted line) sticks out for having avery small amountof fuel. The TP-AGB phase is not included in this SSP.
Figure 6. The luminosity contributions of the PMS (evaluated with Eq.3)for the various metallicities (linestyles as in the previous plots) and SalpeterIMF.
tion occurs at0.7 Gyr in classical models and at1 Gyr in modelswith overshooting.
The age marking the onset of the RGB phase transition wasearly recommended by Barbaro & Pigatto (1984) as a suitableobservational check of the overshooting hypothesis. This test hasbeen recently performed by Ferraro et al. (2004), where deep, VLT-
c© 2005 RAS, MNRAS000, 000–000

Evolutionary population synthesis: models, analysis of the ingredients and application to high-z galaxies 7
classicovershoot
Figure 7. Influence of the stellar tracks. Comparison between the EPS in-gredients obtained with classical (solid line, from Cassisi et al.) and over-shooting tracks (dotted line, from Girardi et al. 2000 and Salasnich et al.2000). From top left to bottom right the various panels show:the total fuelconsumptions (inM⊙) for the various PMS phases, as a function of theage of the SSP; the evolutionary flux; the bolometric luminosity of MS andpost-MS. For both tracks the metallicity is half-solar (Z = 0.008), and onlyages larger than 0.3 Gyr are plotted. The TP-AGB fuel is not considered forthis comparison since it does not depend on the adopted tracks, as explainedin the text.
based,JHK CMDs of LMC GCs allow the quantification of thepopulation ratios between RGB and He-clump, as functions oftheGC age. The comparison with the theoretical predictions of clas-sical and overshooted tracks (the same tracks shown in Figure 7)clearly exclude the latter, in that they predict a substantially laterdevelopment of the RGB (see Figures 8,9 in Ferraro et al. 2004).This result supports our use of classical evolutionary tracks forour standard SSP models. Figure 7 (bottom left-hand panel) alsoshows that the MS luminosity of the tracks with overshootingislarger than that of the classical one, while the trend is reversedfor the PMS (bottom right-hand panel), for the reasons already ex-plained. Note that the evolutionary fluxes are very similar (centralright-hand panel), which is mostly due to the similarity of the timederivative of the turnoff masses. Finally, the SGB phase appearsalso to be a little delayed (central left-hand panel), but its impacton the results is very small.
Because of the earlier RGB phase transition, att ∼ 1 Gyrthe SSPs based on the Cassisi’s tracks are nearly 40 per cent moreluminous than those based on the Padova tracks. An output that isaffected by these variations is obviously theM/L ratio, a key quan-tity used to determine the stellar mass of galaxies (see Section 4.4).
Figure 8. Relation between fuel consumption and temperature subphases.The left-hand panel shows the subphases along the RGB of 12 Gyr SSPswith solar andZ⊙/200 metallicities (circles and triangles, respectively).The right-hand panel shows the subphases along the HB for thesame metal-licities, filled and open symbols refer to blue and red horizontal branch mor-phologies, respectively. In both panels the symbol sizes scale with the fuelconsumptions. The big circles in the left-hand panel correspond to the po-sition of the so-called RGB bump.
3.2 Temperatures
The second matrix contains the distribution of effective tempera-tures and surface gravities of the evolutionary phasesj for the var-ious ages and metallicities. As already mentioned, every evolution-ary phase is split into a certain number of so-calledphotometricsub-phases, inside which the spread in effective temperaturesTeff
is ∼< 100 K. This was found to be appropriate for a good trac-ing of the varying spectral type along a phase1. What is revelant toevolutionary synthesis models is that the fuel consumptionis eval-uated specifically in each subphase. In general the consumption ofenergy is not homogeneous with temperature. This is visualized inFigure 8, where the temperature/gravity subphases for old (12 Gyr)RGBs and HBs are displayed for two metallicities (circles for solar;triangles for[Z/H] = −2.25), with the symbol size being propor-tional to the fuel. The fuel consumption along the RGB of a metal-rich stellar population is enhanced at the so-called RGBbump(bigcircles in the left-hand panel of Figure 8), when the H-burningshell reaches the internal layer that was previously mixed throughthe first convective dredge-up, gets fresh fuel and therefore spendsa longer time in this location (Sweigart, Greggio & Renzini 1989).The RGBbumpis rather close to the He clump. If the total RGBfuel would be assigned homogeneously along the RGB track, theweight of thebumpwould be unappropriately distributed along thewhole track, in particular would be given to the tip, with theeffectof overestimating the near-IR flux of the SSP. The fuel consump-tion approach implemented here where the evolutionary timescaleis considered is an efficient way of taking the bump into account.The bump is predicted to almost disappear at decreasing metallcity(Sweigart, Greggio, Renzini 1989), and indeed the RGB fuel in themetal-poor stellar population results to be rather homogeneouslydistributed (triangles in Figure 8). Note that the significant contri-bution of the RGB tip to the fuel comes from the high luminosityof that subphase.
The right-hand panel of Figure 8 illustrates the effect of theHorizontal Branch morphology on the temperature of the sub-phases. For the same ages and metallicities two options for the HBmorphology are shown, red (open symbols) and blue (filled sym-bols). We remind that blue/red HBs mean that the whole HB life-
1 It should be also noted that model atmospheres are provided with∆Teff ∼ 200 K.
c© 2005 RAS, MNRAS000, 000–000
8 C. Maraston
time is spent on the blue/red side of the RR-Lyrae strip, while in-termediate HB is used to refer to the mixed cases2 In order to traceproperly the HB evolution, we use the evolutionary track forthehelium burning phase of the mass that is obtained after mass-lossis applied to the RGB track (see Section 3.4.2). In the HB phase,most fuel consumption occurs on the so-called Zero Age HeliumBurning (ZAHB) that usually corresponds to a very narrow tem-perature range, the evolution from the tip-RGB to the ZAHB andto the ZAHB to the E-AGB happening on very short timescales(∼ 1 Myr). However in presence of strong mass loss like in thecase of a BHB at highZ (filled circles) the evolutionary timescalecan be significant at various temperature locations.
Stellar effective temperatures depend crucially on the effi-ciency of convective energy transfer, parametrized by the mixinglength parameterα. The latter cannot be derived from first princi-ples, and as far as we know it could be connected to several stellarparameters, such as the stellar mass, the evolutionary status or themetallicity, and its calibration with observational data is certainlyrequired. The use of uncalibrated theoretical effective temperaturesin EPS computations is extremely dangerous, asα is the synchro-nization of the EPS clock (RB86).
The calibration of the mixing-length for the Cassisi’s tracks isdescribed in Salaris & Cassisi (1996). The tracks with solarmetal-licity are computed forα = 2.25, a value that matches the Sun.This same value is kept in the tracks with supersolar metallicities(Bono et al. 1997). At sub-solar metallicities instead the mixing-length parameter is not assumed to be the same, but to vary withZ, such that the temperatures of the RGB tips of Milky Way GCsare reproduced. The values range from 2 to 1.75, with a trend ofdecreasing mixing-length with metallicity (see table 2 in Salaris &Cassisi 1996). In the Girardi et al. (2000) tracks from the Padovadatabase instead the same value of the mixing-length parameter thatis calibrated with the Sun is assumed at all metallicities.
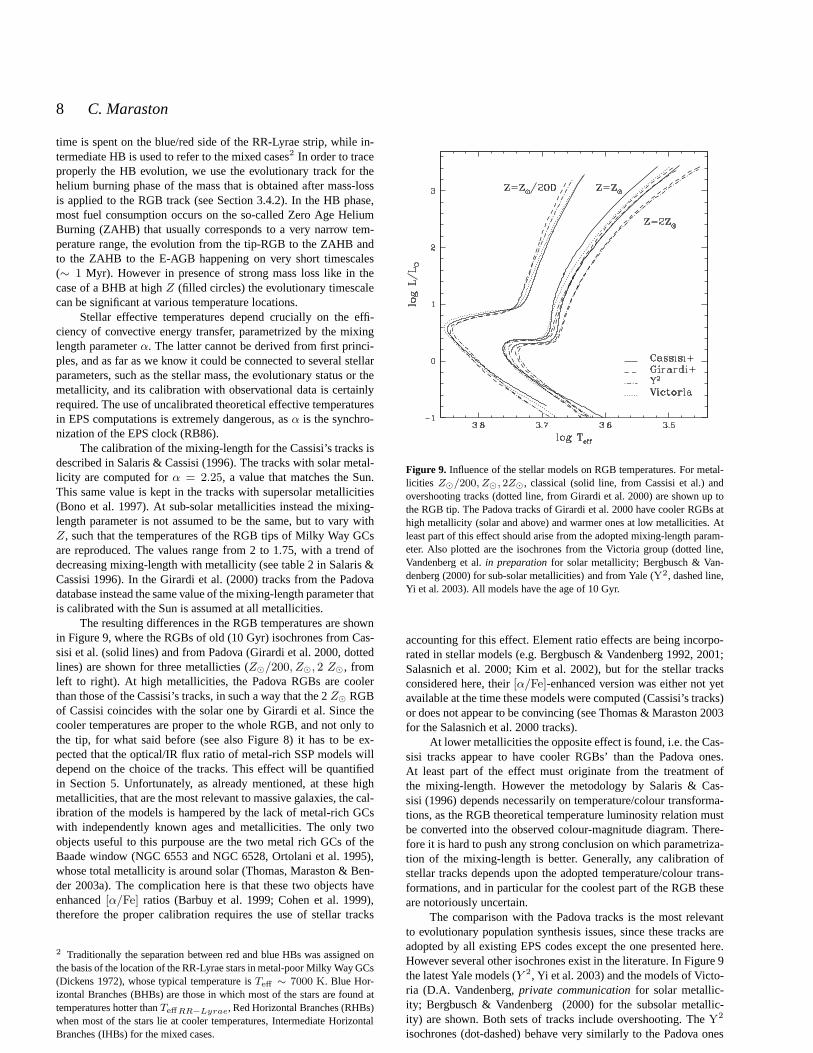
The resulting differences in the RGB temperatures are shownin Figure 9, where the RGBs of old (10 Gyr) isochrones from Cas-sisi et al. (solid lines) and from Padova (Girardi et al. 2000, dottedlines) are shown for three metallicties (Z⊙/200, Z⊙, 2 Z⊙, fromleft to right). At high metallicities, the Padova RGBs are coolerthan those of the Cassisi’s tracks, in such a way that the 2Z⊙ RGBof Cassisi coincides with the solar one by Girardi et al. Since thecooler temperatures are proper to the whole RGB, and not onlytothe tip, for what said before (see also Figure 8) it has to be ex-pected that the optical/IR flux ratio of metal-rich SSP models willdepend on the choice of the tracks. This effect will be quantifiedin Section 5. Unfortunately, as already mentioned, at thesehighmetallicities, that are the most relevant to massive galaxies, the cal-ibration of the models is hampered by the lack of metal-rich GCswith independently known ages and metallicities. The only twoobjects useful to this purpouse are the two metal rich GCs of theBaade window (NGC 6553 and NGC 6528, Ortolani et al. 1995),whose total metallicity is around solar (Thomas, Maraston &Ben-der 2003a). The complication here is that these two objects haveenhanced[α/Fe] ratios (Barbuy et al. 1999; Cohen et al. 1999),therefore the proper calibration requires the use of stellar tracks
2 Traditionally the separation between red and blue HBs was assigned onthe basis of the location of the RR-Lyrae stars in metal-poorMilky Way GCs(Dickens 1972), whose typical temperature isTeff ∼ 7000 K. Blue Hor-izontal Branches (BHBs) are those in which most of the stars are found attemperatures hotter thanTeffRR−Lyrae, Red Horizontal Branches (RHBs)when most of the stars lie at cooler temperatures, Intermediate HorizontalBranches (IHBs) for the mixed cases.
Figure 9. Influence of the stellar models on RGB temperatures. For metal-licities Z⊙/200, Z⊙, 2Z⊙, classical (solid line, from Cassisi et al.) andovershooting tracks (dotted line, from Girardi et al. 2000)are shown up tothe RGB tip. The Padova tracks of Girardi et al. 2000 have cooler RGBs athigh metallicity (solar and above) and warmer ones at low metallicities. Atleast part of this effect should arise from the adopted mixing-length param-eter. Also plotted are the isochrones from the Victoria group (dotted line,Vandenberg et al.in preparation for solar metallicity; Bergbusch & Van-denberg (2000) for sub-solar metallicities) and from Yale (Y2, dashed line,Yi et al. 2003). All models have the age of 10 Gyr.
accounting for this effect. Element ratio effects are beingincorpo-rated in stellar models (e.g. Bergbusch & Vandenberg 1992, 2001;Salasnich et al. 2000; Kim et al. 2002), but for the stellar tracksconsidered here, their[α/Fe]-enhanced version was either not yetavailable at the time these models were computed (Cassisi’stracks)or does not appear to be convincing (see Thomas & Maraston 2003for the Salasnich et al. 2000 tracks).
At lower metallicities the opposite effect is found, i.e. the Cas-sisi tracks appear to have cooler RGBs’ than the Padova ones.At least part of the effect must originate from the treatmentofthe mixing-length. However the metodology by Salaris & Cas-sisi (1996) depends necessarily on temperature/colour transforma-tions, as the RGB theoretical temperature luminosity relation mustbe converted into the observed colour-magnitude diagram. There-fore it is hard to push any strong conclusion on which parametriza-tion of the mixing-length is better. Generally, any calibration ofstellar tracks depends upon the adopted temperature/colour trans-formations, and in particular for the coolest part of the RGBtheseare notoriously uncertain.
The comparison with the Padova tracks is the most relevantto evolutionary population synthesis issues, since these tracks areadopted by all existing EPS codes except the one presented here.However several other isochrones exist in the literature. In Figure 9the latest Yale models (Y 2, Yi et al. 2003) and the models of Victo-ria (D.A. Vandenberg,private communicationfor solar metallic-ity; Bergbusch & Vandenberg (2000) for the subsolar metallic-ity) are shown. Both sets of tracks include overshooting. The Y2
isochrones (dot-dashed) behave very similarly to the Padova ones
c© 2005 RAS, MNRAS000, 000–000

Evolutionary population synthesis: models, analysis of the ingredients and application to high-z galaxies 9
at all metallicities. At solar metalicity the Victoria models (dottedline) agree quite well with the Cassisi’s one till the early portion ofthe RGB, after which the track departs toward cooler temperaturesreaching values around the tip that are more similar to thoseof thePadova or Yale isochrones. Interestingly the metal-poor isochroneof Victoria has a RGB rather similar to that of Cassisi, whichsug-gests that the calibration of the mixing-length is not the whole story.At supersolar metallicities the Victoria isochrones are not available.In Section 5 we will show the impact of the various RGBs’ on theintegrated colours of SSPs.
3.3 Transformations to observables
The third matrix contains the transformations to the observables,used to convert effective temperatures and surface gravities into aspectral energy distribution (SED). The transformations can be ei-ther theoretical or empirical. The models of M98 used a mix bag ofingredients. They rely on the classical Kurucz (1979 and revisions)model atmospheres for3500∼<Teff(K)∼< 35000, complementedwith models for M giants by Bessel et al. (1989) for cooler tem-peratures, and with empirical colours for TP-AGB stars (seeM98for references). The models presented here are partially revised inthis respect because the ingredients of the mixed matrix constructedby M98 have been in the meantime compiled into one library (seeSection 3.3.1), in which border effects between the merged librariesare considered in far more detail than it was done in M98. Alsotheempirical ingredients for TP-AGB stars have been revised, becauseof the availablity of complete SEDs (Section 3.3.2).
3.3.1 Model atmospheres
The synthetic stellar spectra are taken from the spectral librarycompiled by Lejeune, Cuisinier and Buser (1998, in its latest ver-sion as available on the web, hereafter the BaSel library). This li-brary has become widely used in population synthesis studies andwas obtained by merging the Kurucz library of model atmospheres(Teff ∼> 3500 oK) with model atmospheres for cooler stars (for ref-erences and full details see Lejeune et al.). As in M98, a quadraticinterpolation in (Teff , logg) is performed on this library to computethe stellar spectra appropriate to each subphase. The BaSeLlibraryis provided for various iron abundances. We obtain the appropriateone to each set of tracks by interpolating linearly in[Fe/H]. Fi-nally, a blackbody spectrum is assignedTeff ∼> 50, 000 K. The useof the BaSel library allows the computation of model SEDs withlow spectral resolution, i.e. 5-10Aup to the visual region, 20 to100A in the near-IR. Bruzual & Charlot (2003) adopt STELIB (LeBorgne et al. 2003, see also Le Borgne et al. 2004), an empiricalspectral library of stars with metallicity around solar anda muchhigher spectral resolution (3A), to compute a set of SSPs with so-lar metallicity. They compare the integrated coloursB − V andV −K obtained with both BaSel and STELIB. The colour differ-ences as induced by the spectral transformations result to be at mosta few hundreths of magnitude in a wide range of ages.
3.3.2 Empirical spectra for TP-AGB stars
As is well known, current synthetic spectral libraries do not includespectra for Carbon-rich and Oxygen-rich stars populating the TP-AGB phase, although some theoretical computations begin tobeavailable (Lloidl et al. 2001). For the spectra of this type of starswe use the empirical library by Lancon & Mouchine (2002). The
latter is based on the library of individual stellar spectraby Lancon& Wood (2000), that collects observations of C-,O-type stars in theMilky Way and Magellanic Clouds. Since individual stellar spectraof such cool, variable stars are subjected to strong star-to-star orobservation-to-observation variations, Lancon & Mouchine (2002)have constructed mean templates of the Lancon & Wood (2000)library, obtained by averaging observations of individualstars. Inthis work we will use the average templates.
3.4 Recipes for critical stellar phases: TP-AGB and HB
3.4.1 Mass loss in red giants
The stellar temperatures and luminosities during those evolutionaryphases that follow episodes of, or suffer themselves of, stellar massloss, cannot be predicted by stellar tracks. This comes fromthe factthat a theory relating mass loss rates to the basic stellar parametersdoes not exist. Therefore mass loss has to be parametrized and itsefficiency be calibrated with data. Due to such complicationwe callthese stellar phases ‘critical’. The amount of mass loss is usuallyparametrized by means of the Reimers (1977) empirical formuladM = −η·(L/(logg·R))·dt, whereM ,L, logg,R stand for mass,emergent luminosity, surface gravity and radius, respectively, of thestellar configuration in its lifetimedt. The parameterη introducedby Fusi Pecci & Renzini (1976) takes into account the efficiency ofmass-loss. In stars of intermediate mass (2∼<M/M⊙ ∼< 8), massloss influences significantly their post Main Sequence evolution,i.e. the energetics and the temperature, along the TP-AGB (Sec-tion 3.4.3). In low-mass stars (M ∼< 2 M⊙) mass-loss occurs alsoduring the RGB, particularly towards the tip, affecting thesubse-quent HB evolution and hence the HB morphology (Section 3.4.2).
It is important to notice that the efficiencyη cannot dependtoo much on metallicity (Renzini 1981), because the observed HBmorphology of GCs is almost always red at high-metallicity,im-plying that mass-loss does not increase significantly with the metalabundance. Renzini (1981) evaluatesη ∝ Zx, x∼< 0.2.
In the following sections we describe the modelling of HB andTP-AGB.
3.4.2 The Horizontal Branch morphology
The amount of mass loss during the RGB phase is computed by in-tegrating the Reimers formula along the RGB track. The efficiencyη was calibrated by Fusi Pecci & Renzini (1976) by comparing themass of RR-Lyrae in the instability strip of the metal-poor MWGC M13 ([Z/H] ∼ −1.5), with its turnoff mass, and found to be∼ 0.33. This value ofη is by definition appropriate only at thismetallicity and for the RGB tracks used by Fusi Pecci & Ren-zini (1976) and it has to be re-obtained for other chemical com-positions and when other stellar models are used.
The approach followed by Maraston & Thomas (2000) wasto compute the integrated Hβ line, that is very sensitive to the HBmorphology (see also de Freitas Pacheco & Barbuy 1995; Poggianti& Barbaro 1997; Lee et al. 2000) and to compare it with galacticGCs of known ages, metallicities and HB morphologies. The valueof η appropriate to[Z/H] ∼ −2.25 was found to be 0.2.
The procedure of using one value ofη per metallicity (andage) aims at recovering the average trend of a bluer HB morpholo-gies with decreasing metallicity, the latter being the 1-stparame-ter ruling the HB morphology. The trend is easy to understandinterms of stellar evolution. At low metallicity the evolutionary massis smaller at given MS lifetime (because the stars are more compact
c© 2005 RAS, MNRAS000, 000–000

10 C. Maraston
Figure 10. The amount of mass loss along the RGB, expressed as the massdifference between the turnoff mass and the mass at the Helium burningstage, as function of age for two mass loss efficiencyη.
Figure 11. The HB morphology as function of age and metallicity thatresults from having appliedη = 0.2 and 0.33 at[Z/H] = −2.25 and[Z/H] = −1.35, respectively (filled symbols). They-scale gives the per-centage of the total HB fuel that is spent atTeff ∼
> 7000 K. The open sym-bols show the resulting fuel partition when no mass loss is applied duringthe RGB evolution.
and hotter and the nuclear burning more efficient), therefore theproduction of hotter effective temperatures by envelope removal iseasier (helped also by the lower metal content). However, aswellknown a large scatter is found in the HB morphology of GCs withthe same nominal metallicity, a still unexplained fact thatis recalledas the 2-nd parameter effect. The account of all possible HB mor-phologies in a SSP model is not useful, but it is sensible to providemodels with a few choices for the HB morphology, that are abletoencompass the observed average trend and scatter.
The adopted value ofη are η = (0.2; 0.33) at [Z/H] =(−2.25;−1.35). The correspondent amount of mass loss along theRGB is shown in Figure 10, where the mass difference (inM⊙)between the turnoff mass and the mass in the HB phase is shownas function of age for the two adoptedη’s. These values are inremarkable agreement with those computed by Greggio & Ren-zini (1990) using a different set of evolutionary tracks. The result-ing HB morphology is shown in Figure 11 by means of the per-centage of fuel burned atTeff ∼> 7000 K, according to the definitionof BHB given in Footnote 1, Section 3.2. The HB morphology isalmost completely blue (BHB) at[Z/H] = −2.25 andt∼> 10 Gyr,
and at[Z/H] = −1.35 and t∼> 14 Gyr. The morphology is red(RHB) at ages lower than 6 Gyr for[Z/H] = −1.35, interme-diate (IHB) otherwise. At[Z/H] = −2.25, the HB morphologyis never completely red, because the metallicity is so low that theHB track spends a no negligible amount of fuel bluewards the RR-Lyrae strip even without mass-loss (open symbols in Figure 11).The effect of age is such that the higher the age is, the lower isthe stellar mass and the higher is its effective temperaturefor thesame mass loss. Therefore at a givenη the HB morphology getsbluer with increasing age (see also Lee et al. 2000). The SSP mod-els computed with these choices ofη have been proven to give avery good match of the Hβ line and the mid-UV spectra (Maraston& Thomas 2000) and of the higher-order Balmer lines (Maraston etal. 2003) of Milky Way GCs as function of their total metallicities.
At higher metallicities, the HB of Milky Way GCs is found tobe red in almost all cases. However, we know at least two examplesof metal-rich GCs that have extended HB morphologies. Thesearethe Bulge GCs NGC 6441 and GC 6388 (Rich et al. 1997) with[Z/H] ∼ −0.55. As shown in Maraston et al. (2003), the modelsby Maraston & Thomas (2000) were able to reproduce the observedBalmer lines of these two clusters by assuming moderate mass-loss along the RGB, implying 10-15 per cent of fuel to be spentblueward the RR-Lyrae strip. This fraction is consistent with theobserved value.
The finding of Rich et al. (1997) calls for the need of mod-els with BHBs also at high-metallicities. For this purpouseweseek theη value at which the HB fuel is spent (almost) entirelyblueward the RR-Lyrae strip. For the Cassisi tracks we findη =(0.85, 0.45); (1.0, 0.7); (0.94, 0.66) for 10 and 15 Gyr and metal-licities half-solar, solar and twice-solar, respectively. The masses atthe HB phase are then∼ 0.5 ÷ 0.55, whose temperatures reach∼ 9000 K. This amount of mass-loss means to remove nearlyhalf of the initial stellar mass during the RGB. Note finally that bychoosing a largerη, one gets an even bluer HB morphology. TheSSPs with high-Z and BHB are computed for the ages of 10 and 15Gyr.
As a last remark, the variation of the HB fuel between modelswith and without mass-loss is of having less fuel in the models inwhich mass loss is applied, that stems from the lower evolutionarymass (see Figure 4). Such differences amount to roughly 7 percentat [Z/H] = −2.25 , to 15 per cent at[Z/H] = −1.35, to 27 percent at half-solar metallicity, to 40 per cent at solar metallicity andto 54 per cent at2 Z⊙.
3.4.3 The Thermally-Pulsing AGB: inclusion in the integratedspectra
M98 present SSPs in which the TP-AGB phase was included semi-empirically in the models, using a table of theoretical fuelcon-sumptions (from Renzini 1992) and calibrating them with measure-ments of the bolometric contribution of the TP-AGB phase to thetotal light in intermediate age LMC GCs (from Frogel, Mould &Blanco 1990, see Figure 3 in M98). Basically, the observed contri-butions fix the left-hand side member of Eq. 3 written forj =TPAGB, which allows the evaluation of the fuel, using the evolution-ary flux appropriate for the given age. This calibration of the fuelequals to determine empirically the mass-loss efficiency along theTP-AGB phase, which is found to beη ∼ 1/3÷ 2/3.
Maraston et al. (2001) extend the SSP models to half andtwice solar metallicity, introducing an analytical recipethat con-nects the amount of TP-AGB fuel to the envelope mass at the firstthermal pulse (beginning of the TP-AGB phase). Briefly recalling,
c© 2005 RAS, MNRAS000, 000–000

Evolutionary population synthesis: models, analysis of the ingredients and application to high-z galaxies 11
Figure 12. The percentage of the TP-AGB fuel spent in Carbon star modefor the various metallicities, as a function of age.
the fraction of envelope mass that is burned as TP-AGB fuel isde-termined for the turnoff masses at solar metallicity from the fueltable of M98. As a next step, the relations between envelope andtotal masses for the turnoff stars with different chemical composi-tions (taken from the stellar tracks at the termination of the E-AGB)are used to establish which fractions of them goes into TP-AGBfuel as function of metallicity. In this scaling it is assumed that themass-loss efficiency (which is derived from the Magellanic CloudsGCs) does not depend on metallicity. As a result of this assump-tion together with the fact that the turnoff mass is rather insentiveto metallicity, the total TP-AGB fuel does not depend too much onthe chemical composition (Maraston et al. 2001, see Figure 4). Thisis a robust result for two reasons. 1) Mass-loss is not affected sig-nificantly by metallicity, as we discussed in the previous section. 2)The TP-AGB fuel decreases very little with increasing mass-lossefficiency. Renzini & Voli (1981) show that by doublingη from0.33 to 0.66 the fuel of a2M⊙ star with solar metallicity decreasesby only 20 per cent.
Instead the metallicity influences the partition of the total fuelbetween C and M stars, according to the rationale of Renzini &Voli (1981, adopted in both M98 and Maraston et al. 2001). Brieflysummarizing, in metal-poor chemical compositions the abundanceof oxygen in the envelope is lower and a lower amount of carbonhas to be dredged-up in order to reachC/O > 1, hence bindingthe whole oxygen into CO molecules (those with the highest bind-ing energy). The residual carbon is then available to produce CH,CN, C2 molecules and carbon stars are made. Therefore a metal-poor stellar population is expected to have more carbon stars than ametal-rich one. Quantitatively, the fuel in C-stars doubles by halv-ing the metallicity. The adopted recipe is given in Figure 12, wherethe percentage of the TP-AGB fuel that is spent by Carbon-typestars as a function of metallicity is shown. The reference metallic-ity to which the scaling of Renzini & Voli (1981) is applied, is the0.5 Z⊙ metallicity (dotted line), because this is the chemical com-
position of the Magellanic Clouds GCs that are used as calibrators3
Solar and twice solar metallicities (solid and short-dashed line, re-spectively) are assigned halves and one quarter of the fuel in C-starof the0.5 Z⊙ metallicity, respectively4. At [Z/H] ∼ −1.35 (long-dashed line) the fuel in C-star is a factor 10 larger than at0.5 Z⊙,therefore the TP-AGB fuel is almost always spent by C-stars.Fi-nally, at [Z/H] ∼ −2.25 the whole TP-AGB fuel is assigned toC-stars. These numbers can be compared to data of resolved C-stars in galaxies and help constraining the age distribution of thestellar populations. For example, Davidge (2003) finds thatthe C-star component is 10 % of the whole AGB in the dwarf galaxyNGC 205. According to Figure 12 this implies that either a bursthas occurred less than∼ 200 Myr ago (as favoured by Davidge2003) or the stellar population is globally old. Also interesting isthe finding of a conspicuous population of C stars in the arms ofM33 (Block et al. 2004), which could help constraining the starformation history of this galaxy.
Note that the C/M ratio as a function of metallicity by Ren-zini & Voli (1981) is confirmed by the recent TP-AGB models ofMarigo et al. (1999), as inferred from their figures since quantitiesare not tabulated.
Our previous models were restricted to broad-band coloursdue to the unavailability at the time of spectra, either theoreticalor empirical, appropriate to TP-AGB stars. However, in order to beuseful for high redshift studies, the TP-AGB phase has to be in-cluded in the synthetic spectral energy distribution. Thisimprove-ment of the models is performed here. The fuel is distributedamongthe empirical spectra of the individual C-,O-type stars by Lancon &Mouchine (2002). The spectral type that starts the TP-AGB phase ischosen to be close to that of the subphase terminating the E-AGBphase. Spectral types of both O-and C-stars are then included, asdescribed above.
4 RESULTS
The model output are the integrated spectrophotometric propertiesof SSPs, namely spectral energy distributions (SEDs), broad-bandcolours (in Johnson-Cousins, SLOAN, HST filter systems), spectralline indices, mass-to-light ratios, bolometric corrections, etc. Theseare functions of the main parameters of the SSP model: the aget and the chemical compositionX,Y, Z (refereed to as[Z/H]5).Ages and metallicities of the SSP grid are listed in Table 1. Modelsare generally given in time steps of 1 Gyr, for ages larger than 1Gyr, and of 0.1 Gyr for smaller ages. The Table indicates alsothesource for the input stellar tracks/isochrones, accordingto the de-scription and references given in Section 3.1. Model assumptions
3 Frogel, Mould & Blanco (1990) measure also the luminosity contribu-tions of C and M-type stars as functions of the GC age.4 L. Greggio and M. Mouchine pointed out that the percentage offuel spentas C and M stars in Table 4 and Figure 2 of Maraston (1998) is reversed.This mistake concerns only the graphics and not the models. In any case thereader is referred to the present Figure 12 and to the tables provided at themodel WEB page.5 The notation [Z/H] is used to indicate total metallicities,i.e. the totalabundance of heavy elements with respect to hydrogen normalized to thesolar values, i.e.[Z/H] = log(Z/Z⊙) − log(H/H⊙). By [Fe/H] wemean the abundance of iron with respect to hydrogen normalized to the solarvalues, i.e.[Fe/H] = log(Fe/Fe⊙)− log(H/H⊙). If elements have solarproportions then[Fe/H] = [Z/H]. In case ofα-element enhancement, therelation between[Fe/H] and[Z/H] is: [Fe/H] = [Z/H]−0.93∗([α/Fe])(Thomas, Maraston & Bender 2003).
c© 2005 RAS, MNRAS000, 000–000

12 C. Maraston
Figure 13. Luminosity contributions in bolometric,V andK (from top to bottom) of evolutionary phases and their dependences on age and metallicity. Fromleft to right metal-poor, solar metallicity and metal-richSSPs (with a Salpeter IMF) are shown, respectively. Note that they-scale of the bottom panel is notthe same as in the other two panels.
concern the initial mass function (IMF) and the morphology of theHorizontal Branch. The models are computed for two choices ofthe IMF, namely Salpeter (1955) and Kroupa (2001), and are pro-vided for two different assumptions regarding the mass lossalongthe RGB (Section 3.4.2), which result into various HB morpholo-gies. These are indicated in Table 2. In the following subsectionswe discuss the various model output and their comparisons withobservational data and with similar models from the literature.
4.1 Luminosity contributions by stellar phases
Figure 13 shows the contributions from the various evolutionaryphases to the total bolometric,V andK luminosities (from topto bottom) of metal-poor, solar metallicity, and metal-rich SSPs,respectively (from left to right).
As in the solar metallicity SSP already discussed in M98, mostbolometric energy is shared by the three main phases MS, TP-AGB
Table 1. Ages, metallicities and input tracks of the SSP grid
t(Gyr) (Y,Z) [Z/H] Stellar tracks
1–15 0.230, 10−4 −2.25 Cassisi3 · 10−6–15 0.230, 0.001 −1.35 Cassisi + Geneva3 · 10−6–15 0.255, 0.01 −0.33 Cassisi + Geneva3 · 10−6–15 0.289, 0.02 +0.00 Cassisi + Geneva3 · 10−6–15 0.340, 0.04 +0.35 Cassisi + Geneva
1–15 0.390, 0.07 +0.67 Padova
and RGB independent of metallicity (cf. Figure 4). The energeticsof young SSPs (t . 0.3 Gyr) is dominated by MS stars, that ofSSPs witht & 2 Gyr by RGB stars. SSPs with ages in the range
c© 2005 RAS, MNRAS000, 000–000

Evolutionary population synthesis: models, analysis of the ingredients and application to high-z galaxies 13
Table 2. HB morphologies of the SSP grid
[Z/H] Age (Gyr) ηmassloss HB morphology Ref.
-2.25 <= 12 0.00 RHB RI-HB-2.25 > 12 0.00 IHB RI-HB-2.25 < 10 0.20 IHB IB-HB-2.25 >= 10 0.20 BHB IB-HB-1.35 all 0.00 RHB RI-HB-1.35 10 −−13 0.33 IHB IB-HB-1.35 14 −−15 0.33 BHB IB-HB-0.33 all 0.00 RHB RI-HB or IB-HB-0.33 10,15 0.55 BHB high-Z BHB0.00 all 0.00 RHB RI-HB or IB-HB0.00 10,15 0.55 BHB high-Z BHB0.35 all 0.00 RHB RI-HB or IB-HB0.35 10, 15 0.55 BHB high-Z BHB
0.3. t . 2 Gyr are dominated by TP-AGB6 stars except in themetal-poor stellar population, where AGB, MS and HB have simi-lar contributions. For ages older than∼ 6 Gyr, the MS contributionstend to rise. This effect is caused by the MS integrated luminositydecreasing slower thanb(t). As the total fuel keeps nearly constant,the net result is a lower total luminosity as mainly due to a lowerPMS luminosity.
The main contribution to theV -luminosity comes always fromMS stars, except for the metal-poor SSP, where at young ages theHB phase has a relatively larger contribution, and at very old agesthe RGB is the dominant phase for theV -luminosity, which is dueto the warm RGB temperatures at such low metallicity.
Finally, the light in theK-band (and in the near-infrared ingeneral) in the age range 0.3. t . 2 Gyr is dominated by TP-AGBstars at every metallicity, a role taken over by the RGB at old ages.These results demonstrate the importance of including the TP-AGBphase for a correct interpretation of rest-frame near-infrared coloursand luminosities of1 Gyr stellar populations
4.2 Spectral energy distributions with TP-AGB
The synthetic SEDs of old stellar populations, in particular the Hor-izontal Branch morphology, have been compared with IUE dataofGCs in Maraston & Thomas (2000) up to the metallicity of 47 Tu-canae. In this section we focus on the most relevant featuresof thenew model SEDs, namely the inclusion of the spectra of C- andO-type TP-AGB stars. We will compare the SEDs with a sampleof Magellanic Clouds GCs for which data in the whole spectralrange fromU toK are available, and with models from the litera-ture. Further comparisons with both observational data andmodelsusing broad-band colours and spectral indices will find place in fol-lowing sections.
4.2.1 Fingerprints of∼ 1 Gyr populations
The inclusion of the TP-AGB phase in a model SED is substan-tial at ages in the range0.3∼< t/Gyr∼< 2 where the fuel consump-tion in this phase is maximum (cf. Section 3.1.3). This is shownin Figure 14, where two model SEDs of 0.8 Gyr,0.5 Z⊙ with and
6 Note that in the figure the total AGB contribution, i.e. that from E-AGBplus TP-AGB, is plotted, but we know from Section 3.1 that theAGB phaseis dominated by the TP-AGB
Figure 14. The effect of the TP-AGB phase on the spectral energy distri-bution of a 0.8 Gyr stellar population withZ = 0.5 Z⊙ (thick line). Thesame SSP without the TP-AGB phase is shown as a thin line. The inte-gratedB − V andV − K colours obtained on both SEDs are given. Themost important absorption bands typical of C-stars (e.g.C2, CN), O-stars(e.g.H2O, TiO), or both (e.g. CO) are indicated. The relative proportionsof fuel in C and O stars at this metallicity and age is 9:1 (cf. Figure 12).
without the TP-AGB phase are compared. While the optical part ofthe spectra is insensitive to the presence of the cool TP-AGBstars,the near-IR one changes dramatically. Not only the absoluteflux inthe near-IR region increases by nearly a factor 3, also peculiar ab-sorption features appear (e.g. CN,C2 in C-stars andH2O and COin O-stars, see e.g. Lancon & Wood 2000 for more details). Theseabsorption features besides the integrated colors can be used as in-dicators of∼ 1 Gyr stellar populations in the integrated spectraof stellar systems. For example, Mouhcine et al. (2002) detectedCarbon molecules absorptions in the near-IR spectrum of W3,amassive GC of the merger-remnant galaxy NGC 7252 that we pre-viously suggested to be in the AGB phase transition based on itsB, V,K colours (Maraston et al. 2001).
As discussed in section 3.4.3, the relative proportions of C-and O-stars depend on metallicity, for the model of Figure 14theratio being 9:1. The effect of considering other metallicities is dis-played in Figure 15, where 0.4, 1 and 2 Gyr SSPs with chemicalcompositionsZ⊙/20, Z⊙ and2 Z⊙, are shown. The larger totalmetallicity favours the production of O-rich stars over that of C-rich stars. This is evident in the integrated SEDs as the disappearingof the CN andC2 bandheads at1∼<λ/µm∼< 1.5 typical of C-starsin favour of theH2O molecules around1.6 µm. Several line in-dices are defined that trace these spectral features (e.g. Aaronson etal. 1978; Frogel et al. 1978; Alvarez et al. 2000) and can be usedin extragalactic studies. With the new spectra we are in the positionof computing the integrated indices for the SSP models (see alsoLancon et al. 1999).
Figure 16 shows three of these indices. TheC2 index (Alvarezet al. 2000) measures the strength of the bandhead at1.77 µm (Bal-lik & Ramsay 1963) and is defined as the ratio between the fluxesin the regions1.768−1.782 µm and1.752−1.762 µm. The water
c© 2005 RAS, MNRAS000, 000–000

14 C. Maraston
Figure 15. Effect of the metallicity of the TP-AGB stars on the SEDs of 0.4, 1 and 2 Gyr stellar populations. From left to right, the metallicity increases fromZ⊙/20 to 2 Z⊙, and with it the relative importance of Oxygen-rich stars over Carbon-rich stars.
vapour absorption band indexH2O measures the ratio of the fluxdensities at2.04 µm and2.22 µm, based on the HST/NICMOSfilters F204M and F222M, or at1.71 µm and1.80 µm, based onthe HST/NICMOS filters F171M and F180M, and the CO index theflux densities at2.37 µm and2.22 µm, based on HST/NICMOSfilters F237M and F222M. The indices are defined in magnitudesand normalized to Vega7.
TheC2 index is a strong function not only of the age, peaking
7 Using a spectrum of Vega taken with HST and kindly provided byR. Bender, the zeropoints are:C2 = 0.038; H2O1.71 µm = 0.160;
at the time of the AGB phase transition, but especially of thechem-ical composition, its value decreasing with increasing metallicity,following the decrease of the fuel in C-stars. The water vapour israther insensitive to the chemical composition, hence is a good ageindicator for ages between 0.4 and 2 Gyr. The CO index behavessimilarly to theH2O.
The combination of indices that works best to unveil the pres-ence of∼ 1 Gyr stellar populations and their chemical composi-
H2O2 µm = −0.360; CO = 0.263, that have to be subtracted to theindices
c© 2005 RAS, MNRAS000, 000–000

Evolutionary population synthesis: models, analysis of the ingredients and application to high-z galaxies 15
Figure 16. The IR indicesC2, H2O and CO and their dependence on age and metallicity. The defining wavelengths are indicated, indices are expressed inmagnitudes.
Figure 17. Diagnostic index-index diagramsC2 vs. CO (left-hand panel) andC2 vs.H2O (right-hand panel), for stellar populations younger than 2Gyr. Thethick lines are SSPs with various metallicities, the thin line shows the effect of an extended exponentially-decliningstar formation history,SFR ∝ e−t/τ ,with τ = 10 Gyr.
tion is C2 together withH2O, as shown in Figure 17. In fact thisdiagram not only splits very nicely the metallicity effects, but itseparates istantaneous bursts (SSPs, thick lines) from stellar pop-ulations being formed with extended star formation, as shown bythe thin line for an exponentially-declining star formation history,SFR ∝ e−t/τ with τ = 10 Gyr.
4.2.2 Comparison with literature and data
Figure 18 shows our SED of a 1 Gyr,Z = Z⊙ SSP (thick line) andsimilar models from Bruzual & Charlot (2003, hereafter BC03),
from the Pegase code (Fioc & Rocca-Volmerange 1997, version2as available at http://www.iap.fr/pegase, hereafter PEGASE.2 mod-els) and from the latest version of Starburst99 (Vazques & Leitherer2005, long-dashed-short-dashed line). The BC03, PEGASE.2andStarburst99 are very similar one to each other which is due totheiruse of the Padova tracks, and are more consistent with the versionof our models not including the TP-AGB phase than with that inwhich the TP-AGB is accounted for. This result is not easy to un-derstand. In the BC03 models the inclusion of C-stars is accountedfor by means of unpublished theoretical spectra and an unspeci-fied temperature/luminosity relation, therefore it is hardto make a
c© 2005 RAS, MNRAS000, 000–000

16 C. Maraston
Figure 18. Comparison of the 1 Gyr, solar-metallicity SED of this paper(thick line) with other models from the literature, from Bruzual & Char-lot (2003, dotted line), from the Pegase code (PEGASE.2, dashed line) andfrom the latest version of Starburst99 (Vazques & Leitherer 2005, long-dashed-short-dashed line). Our SED without TP-AGB phase isshown as athin solid line
meaningful comparison with our models. In the PEGASE.2 mod-els and in the latest version of the Starburst99 models, the TP-AGBphase is included by adopting theoretical prescriptions for lumi-nosities and lifetimes (Gronewegen & de Jong 1993 and Vassiliadis& Wood 1993, respectively), but the key information concerningthe TP-AGB fuel consumption as a function of mass, its compari-son with the Frogel, Mould & Blanco data, the inclusion of Carbonstars and which spectra are assigned to TP-AGB stars are not spec-ified.
We now compare the model SEDs with Magellanic CloudsGCs, that are the ideal templates in the age range relevant totheTP-AGB. In M98 we used the data available at the time, namelyU,B, V,K. Here we complete the wavelength coverage by addingdata in theR, I-Cousins bands from new observations of a sam-ple of MC GCs in the relevant age range (Goudfrooij et al. 2005,in preparation). For this sample we can perform the SED fittings.These are shown in Figure 19, in which nine out of the 20 objects ofthe Goudfrooij et al. (2005) sample are considered, according to theavailability of all bands and also to reasons of space, sincesome ob-jects display basically the same spectral energy distributions. Theselected GCs span the interesting range in SWB (Searle, Wilkinson& Bagnuolo 1980) types from 3 to 5.5. The SWB scheme is a rank-ing of the MC GCs in terms of age/metallicity, the selected typesreferring to the age range0.1 ∼< t/Gyr∼< 2 Gyr that is relevant tothe model comparison. GCs with greater types are older and moremetal-poor. The type 7, for example, corresponds to Milky Way-like objects, with ages∼ 13 Gyr and[Z/H] ∼ −2. As discussedby Frogel, Mould & Blanco (1990) the exact ranking of some in-dividual clusters might be not so meaningful, but the range from4 to 5.5 corresponds to objects with the largest numbers of AGBstars, that are the only ones in which Carbon stars are detected (seeFig. 3 in M98). Therefore the GCs in this SWB range span averageages between∼ 0.3 and∼ 2 Gyr (cf. Table 3 in Frogel, Mould &Blanco 1990). Indeed, ages determined by various methods agree
generally well with the SWB ranking. For example, in order tofitNGC 1987 we use an SSP with the age and the metallicity as de-termined in the literature (from Girardi et al. 1995 and Ferraro etal. 1995), and the result is very good. However we emphazise thatwith the exercise of Figure 19 we do not aim at deriving preciseages for the objects, but rather at illustrating the effect of the TP-AGB phase. Figure 19 shows that their SEDs can be fit only with aproper inclusion of the TP-AGB energy contributions and thespec-tra of C- and O- stars.
The SSPs have metallicities either half-solar or1/20 Z⊙ (i.e.[Z/H] = −0.33 and [Z/H] = −1.35), with thick lines show-ing our models, and dotted and dashed thin lines those by BC03and PEGASE.2, respectively. For the latter the lower metallicity is[Z/H] ∼ −0.7. For our models we show also the broad-band fluxes(empty circles). Each panel presents an individual GC SED (filledpoints). Starting from the top left, object NGC 265 withSWB = 3is a pre-AGB GC whose SED does not yet display evidences of TP-AGB stars redwards theR-band. The situation changes completelywhen later SWB types are considered and the typical featuresof thecool TP-AGB stars appear in the near-IR spectrum. Theircompletespectral energy distributions are well fit by our models.
The models by BC03 and PEGASE.2 do not reproduce theobserved SEDs with the same SSP parameters, displaying substan-tially less flux redward theR-band. The same comparison holdsfor the Starburst99 models (not shown, see Figure 18). The obvi-ous conclusion is that the recipes for the TP-AGB adopted in thosemodels are not adequate at describing real stellar populations withTP-AGB stars. Further discussions on these models is found in thenext section. There is no combination of age and metallicitythatallows to fit the high fluxes both blueward and redward theV -bandunless the TP-AGB phase is included as shown by the thick solidlines. As we will see in Section 6, in case of galaxies a compos-ite stellar population in which a late burst is superimposedto anold component can fulfill the need for high blue and near-IR fluxes(relative toV ). This option is clearly not viable in case of GCs.
In the next section we will show the comparison with moreobjects by means of broadband colours.
4.3 Broadband colours
Broadband colors are computed for several filter systems (e.g.Johnson-Cousins, SLOAN, HST). In the following subsections wewill compare them with Magellanic Clouds GCs and Milky WayHalo and Bulge GCs, which allows the check of young and in-termediate age models with slightly subsolar metallicities, and oldages for a wide range of metallicities, respectively. Comparisonswill be also made with models from the literature.
4.3.1 TP-AGB-dominated∼ 1 Gyr models
In Figure 20 we perform a comparison similar to that shown inFigure 19 by means of broadband colours which allows us to usea larger data sample. We also include the data of the GCs in themerger remnant galaxy NGC 7252 (Maraston et al. 2001, open tri-angles). The models are selected to have ages smaller than 2 Gyrand half-solar metallicity.
The AGB phase transition among the clusters appears as anenhacement of the IR luminosity with respect to the optical one,that increases with increasing wavelength, with e.g., theV − Kcolour reaching values larger than 3. All bands redwardsR are af-fected. The models of this paper provide a good description of TP-AGB-dominated stellar populations in a large wavelength range. As
c© 2005 RAS, MNRAS000, 000–000

Evolutionary population synthesis: models, analysis of the ingredients and application to high-z galaxies 17
Figure 19. SED fitting of MC GCs data (filled points). In each panel the cluster ID and SWB type (the latter from Frogel, Mould & Blanco 1990) are indicated.Sources of data are: van den Bergh 1981 forU,B, V ; Persson et al. 1983 forJ,H,K; Goudfrooij et al. 2005 forV,R, I. The reddeningE(B − V ) is takeneither from Persson et al. (1983) or from Schlegel et al. (1998). The largest error (on the flux in theB-band) is shown. Lines show ours, the BC03 and thePEGASE.2 models (solid thick, and dotted and dashed thin lines, respectively) and the ages/metallicity of the fits. For our models also the broad-band fluxesare given (empty circles).
already shown in Maraston et al. (2001), the models reproduce verywell also the integrated colours of the young GCs of the mergerremnant galaxy NGC 7252.
The other models considered here, namely those by BC03 andPEGASE.28 do not exhibit the “jump” in the near-IR colours dis-
8 For this comparison we focus on those models for which the TP-AGBis stated to be included. The Worthey (1994), the Vazdekis etal. and theStarburst99 (Leitherer et al. 1999) models do not treat the TP-AGB phase.Mouhcine & Lancon (2002) include the TP-AGB phase in such a way as to
played by the MC GCs, remaining systematically bluer than thedata and evolving slowly towards the red colours produced bytherise of the RGB phase att∼> 1 Gyr. This pattern is equivalent tothe SED comparison discussed in the previous section, againsug-
reproduce theB− V vs.V −K synthetic diagram published by Marastonet al. (2001). However the TP-AGB bolometric contribution in their modelsis up to 20 per cent (Mouhcine et al. 2002), smaller than the observed∼ 40per cent one (Frogel, Mould & Blanco 1990) reproduced by our models(Figure 13).
c© 2005 RAS, MNRAS000, 000–000

18 C. Maraston
Figure 20. Calibration of TP-AGB dominated synthetic broadband colours with data of MC GCs (filled circles). MC data are selected tobelong to SWB typesbetween 3 to 6, appropriate to the age range and the metallicity of the models (sources of data as in Figure 19). Open triangles show the star clusters of themerger remnant galaxy NGC 7252 (V photometry from Miller et al. 1997,K photometry from Maraston et al. 2001). Models have ages lower than 2 Gyr andmetallicities0.5 Z⊙, with solid, dotted and dashed lines referring to this work,BC03 and PEGASE.2.
gesting that the TP-AGB phase is not fully accounted for in thesemodels.
BC03 argue that stochastical fluctuations in the number of TP-AGB stars suffice to explain the full range of observedV − Kcolours of MC GCs. These effects are mimicked by means of astochastic IMF in a∼ 2 · 104M⊙ model star cluster.
From their Figure 8 one sees that the simulations match verywell the colours of the youngest MC GCs, whose near-IR light isdominated by red supergiants with lifetimes∼ 106 yr. The TP-AGB phase instead lasts ten times longer and is therefore less af-fected by stochastical fluctuations. As a consequence the simula-tions are less successful in covering the observed colours of the TP-AGB-dominated MC star clusters. Moreover, the probabilitydistri-butions of the points in their simulations is squewed towards bluercolors. This implies that it would be highly unlikely to observe aGC on the red side of the models if stochastical fluctuations weredominating the distribution of the data. Instead the data scatter ex-actly to the red side of the models.
A further important point is that the importance of stochas-tical fluctuations depends dramatically on the mass of the globu-lar cluster. While the effect is relatively large for massesof theorder 104M⊙ (considered in the BC03 simulations), it is sig-nificantly smaller at105M⊙ and completely negligible around106M⊙. Hence, the stochastical fluctuations, based on a104M⊙
cluster, are not appropriate to describe the colours of the star clus-ters of the merger-remnant galaxy NGC 7252 shown as open trian-gles in Figure 20. Their luminous masses are estimated to be at least
106 M⊙ (Schweizer & Seitzer 1998) ranging up to even∼ 108M⊙
as confirmed dynamically for the most luminous object (Marastonet al. 2004). The expected stochastical fluctuations for such verymassive objects are of the order of a few percent (Maraston etal. 2001) and their colours are not explained by the BC03 modelswithout fluctuations (Figure 20). Instead, their colours are nicelyexplained by a TP-AGB phase like in the MC clusters (Marastonetal. 2001 and Figure 20), a conclusion that is supported by thedirectobservation of Carbon stars in their spectra (Mouhcine et al. 2002with SOFI observations).
To conclude, while we fully agree that stochastical fluctua-tions in the number of stars alongshortevolutionary phases9 scat-ter the near-IR colours of small-mass star clusters, the account ofthese effects should be considered on top of the stellar evolutionaryphases. For example it seems more likely to us that the lack oftheAGB phase transition in the BC models comes from the fact thatthe TP-AGB bolometric contribution never exceeds∼ 10 per cent(Figure 4 in Charlot & Bruzual 1991). This is at variance withthemeasured bolometric contribution of the TP-AGB phase (∼ 40 percent, Figure 3 in M98) which was evaluated by taking stochasticalfluctuations into account.
In the PEGASE.2 models the details of the inclusion of theTP-AGB phase are not specified. However from Figure 2 in Fioc &Rocca-Volmerange (1997) one sees that a jump inV −K of ∼ 0.6
9 e.g. the supergiant phase in stellar populations younger than 0.1 Gyr
c© 2005 RAS, MNRAS000, 000–000

Evolutionary population synthesis: models, analysis of the ingredients and application to high-z galaxies 19
mag (up toV − K ∼ 2.2) occurs att ∼ 0.1 Gyr, after whichthe evolution of this colour is nearly constant. The AGB phase-transition as exhibited by the MC star clusters does not takeplacein their models.
4.3.2 Age and metallicity relations of old models
Milky Way GCs spanning a wide range of metallicities at nearlythe same age are ideal to calibrate the synthetic colours/metallicityrelations. Figure 21 shows a comprehensive comparison of old (13Gyr) models with all available photometry of Milky Way GCs. Dataare plotted towards the [Fe/H] parameter of the Zinn & West (1984)scale, that we show to reflect total metallicities (Thomas, Maraston& Bender 2003). Data for the two metal-rich GCs of the galacticBulge NGC 6528 and NGC 6553 are the open triangles. Modelsare shown for both the Kroupa and the Salpeter IMF (solid anddashed lines, respectively) only for completeness since wefoundthat the optical colors of SSPs are virtually unaffected by plausibleIMF variations (M98). The dotted line shows the BC03 models forthe same age and the Salpeter IMF.
The match between models and data is very good, except fortheB − V colour, that appears to be systematically redder in themodels (of 0.05 mag). We have checked that this feature is commonto all SSP models considered in the paper, namely the BC03, PE-GASE.2, Worthey (1994) and Vazdekis et al. (1996), and was dis-cussed by Worthey (1994) and Charlot, Worthey & Bressan (1996).We now investigate the origin of the offset.
The offset cannot be attributed to HB morphologies. More-over, the blue HB morphology10 of most GCs with metallicitiesbelow−1.3 is already accounted for in our models at 13 Gyr and[Z/H] = −2.25 (cf. Figure 11). At 13 Gyr and[Z/H] = −1.35 theHB morphology is intermediate (cf. Figure 11). A purely blueHB,with Teff up to104 K would make theB − V bluer by 0.03 mag.But the GCs with metallicities∼> − 1. have a red HB and still theirB−V is bluer than the models. The latter data can be better matchwith a younger age, e.g. 8 Gyr, which is perhaps not excluded (e.g.Rosenberg et al. 1999). However this younger age worsens thefittoU − V andU −B.
A more likely explanation is a defect in the colour-temperaturetransformations. This issue is extensively addressed by Vanden-berg & Clem (2003), who provide a set of transformations tocure theB − V problem, which is attributed to deficienciesof the model atmospheres. We have found that theB − Vcolors in their transformations are very close to those of theBaSel library for the turnoff temperatures of the 13 Gyr mod-els (5800∼<Teff/K∼< 6700, logg ∼ 4.5), but arebluer for theRGB base (4900∼<Teff/K∼< 5300, logg ∼ 3), by 0.1 mag at[Z/H] ∼ −2.25;−1.35. Since the RGB contributes∼ 40 percent to theV -luminosity at[Z/H] = −1.35 and below (cf. Fig-ure 13) the use of the Vandenberg & Clem (2003) transformationswould be able to reduce significantly the discrepancy between dataand models. It is intriguing however that the Vazdekis et al.mod-els that adopt an empirical temperature-colour relation instead ofthe theoretical one suffer from the same problem. Also, Bruzual &Charlot (2003) compare the integratedB − V of solar metallic-ity SSPs based on the BaSel and the Pickles empirical library, andfound negligible differences. Though their exercise refers to solarmetallicity, while our comparison focuses on sub-solar chemicalcompositions, it has to be expected that if a fundamental problem
10 as derived from the HBR parameter listed in the Harris (1996)
in the treatment of the opacity would be responsible for the colouroffset, this would be even more serious at higher metallicities.
We are left with one alternative explanation, that is an offset inthe photometric bands, due to the broadband filters. Indeed,two dif-ferent B filters are used, the so-called B2 and B3 (Buser), in orderto computeU − B andB − V , respectively. These are commonlydefined as “standard Johnson B”. The colourU − V is then evalu-ated by addingU −B andB − V 11. It is hard to trace back whichexact filter was used for the data, therefore we vary the B-filter inthe models. The result is that if we use the B2 filter to computetheB−V colour, the latter getsbluerby 0.03 mag., again in the direc-tion of improving the comparison, while leaving theU − V colouralmost unchanged.
To conclude, either a defect of the model atmospheres or afilter mismatch or a combination of both are the most plausiblesources of the discrepancy between data and models inB − V .However since at redshift> 0 one needs the whole spectral energydistribution, the use of spectral libraries like the BaSel one is un-avoidable. Instead, in comparing the models with observed colours,it is safer to take the offset of 0.05 mag. into account.
Back to Figure 21 we see that the BC03 models behave verysimilarly to ours, with the exception of theV −R andV −I colours,that in the BC03 models appear to be too red when compared toour models and to the data. Reducing the age does not improve thecomparison. We cannot explain the reasons for this offset.
4.4 Mass-to-light ratios
The stellar mass-to-light ratiosM∗/L are computed as in M98, bytaking the stellar mass losses into account. The relation betweenliving stars and remnants is from Renzini & Ciotti (1993), wherethe remnant mass as a function of the initial mass is given forthreetypes of stellar remnants, i.e. white dwarfs, neutron starsand blackholes. These relations are used for every metallicity, the depen-dence on the chemical composition entering through the turnoffmass. Figure 22 shows the stellar mass of an evolving stellarpop-ulation with initial mass of1 M⊙, solar metallicity and Salpeteror Kroupa IMFs (solid and dotted line, respectively). In case of aSalpeter IMF the stellar mass decreases by∼ 30 per cent in 15 Gyr,∼ 23 per cent being lost in the first Gyr. The Kroupa IMF with lesspower in low-mass stars has∼ 16 per cent less mass, and corre-spondingly lowerM∗/L’s. The stellar mass of the BC03 models issmaller than that computed in our models.
The basic dependences of theM∗/L’s on the SSP param-eters, ages, metallicities and the IMF are shown in Figure 23.TheM∗/L’s increase with age because the luminosities decrease,an effect independent of the photometric band. An importantex-ception is the occurrence of the AGB phase transition duringwhich the near-IR luminosity increases with age and therefore theM∗/Lnear−IR decreases, by a factor 3-5 with respect to modelsnot including the TP-AGB phase.
Metallicity effects are strongly dependent onλ. TheM∗/L’sgenerally increase with increasing metallicity because the lumi-nosities decrease (which is explained by lower MS and PMS lumi-nosities with increasing metal content, Section 3.1). However in thenear-IR, a transition occurs atλ∼> I-band and theM∗/L’s becomeindependentof metallicity at ages∼> 2 Gyr. The reason for this isthat a highZ SSP produces less light than one with a lower amount
11 We acknowledge a discussion with R. Buser who confirmed this fact tous.
c© 2005 RAS, MNRAS000, 000–000

20 C. Maraston
Figure 21. Comparisons of synthetic broadband colors with data of Milky Way GCs (as compiled in the Harris - 1996 and revisions - catalogue). The data ofthe∼ Z⊙ Bulge GCs NGC 6528 and NGC 6553 are shown as open triangles. Reddening has been subtracted as in Barmby & Huchra (2000). Metallicitiesare on the Zinn & West (1984) scale. Solid lines show SSP models of age 13 Gyr, Kroupa IMF, and blue/intermediate HB morphology at[Z/H]∼< − 1. Thesame models with a Salpeter IMF are shown as dashed lines. Thedotted lines are the BC03 models for the same age.
of metals, but most of the energy is emitted preferentially at longerwavelengths because of the cooler stellar temperatures. Note how-ever that the effect holds until the metallicity is not too large. Thevery metal-rich SSP of our set (Z = 3.5 Z⊙) hasM∗/Lnear−IR
smaller than the others SSPs.The effect of the IMF was amply discussed in M98. The main
result was that theM∗/L of SSPs is minimal for Salpeter and in-creases for both a flattening or a steepening of the IMF. The reasonis that a larger amount of mass in massive remnants or in livingstars is present. This interesting point stems from considering the
evolution of the stellar mass. The models in Figure 23 refer to aKroupa IMF, the effect of having a Salpeter IMF is shown only inthe bolometric (solid thin line), with theM∗/L being larger by afactor∼ 1.5. A similar scaling factor is found at the variousλ′s,almost independent of metallicity.
Finally our models are compared with others in the literaturein Figure 2412. The models by BC03 have a bolometricM/L that
12 During the referee process of this paper A. Vazdekis provided us with a
c© 2005 RAS, MNRAS000, 000–000

Evolutionary population synthesis: models, analysis of the ingredients and application to high-z galaxies 21
Figure 22. The total stellar mass (normalized to1 M⊙) of an evolvingstellar populations in which the stellar mass losses are taken into account.
Figure 23. The dependence of theM∗/L (in solar units) on age andmetallicity. Models refer to the Kroupa IMF, for the bolometric the solar-metallicity models for a Salpeter IMF are shown as thin solidline. Note thatthe 3.5Z⊙ SSP is computed with the Padova tracks and does not containthe TP-AGB phase.
is larger than ours around ages of a few Gyr, because the luminosityof the Padova tracks is smaller due to the delayed development ofthe RGB phase (Figure 7). The effect is partly counterbalanced bya slightly smaller stellar mass (Figure 22). The largest differencesare found in the near-IR. TheM/LK of the BC03 models is higherthan ours around 0.8-1 Gyr due to the lower contribution of theTP-AGB in their models. At old ages it is instead smaller, dueto
new version of his modelM/L in which the values have been revised. Thisexplains why Figure 24 in its final version differs from that of the astro-phsubmitted paper
Figure 24. Comparison between modelM/L in various bands from differ-ent authors (see Footnote 12). All SSPs have solar metallicity and SalpeterIMF.
the cooler RGBs of the Padova tracks (cf. Figure 9). The modelsby Worthey (1994) have smallerM/Lbol andM/LK, due to largerbolometric and near-IR luminosities. This is possibly due to a largernumber of upper RGB stars with respect to that predicted by thePadova isochrones (Charlot, Worthey & Bressan 1996). Note alsothat the Worthey (1994)M/L’s do not take the stellar mass lossesinto account. Finally, the models by Vazdekis et al. (1996) behavein general similarly to the BC03 ones, which is due to the use ofthe Padova tracks in both models. Some differences appear intheK-band, however. Att ∼ 108 yr a dip in the Vazdekis models ispresent that is not found in the BC03 models, therefore it canhardlybe connected to the Padova tracks, unless the two models adopt adifferent releases.
4.5 Lick indices
The Lick indices of SSP models computed by means of the Lickfitting functions (Worthey et al. 1994) have solar-scaled elementabundance ratios at high-metallicities[Z/H]∼> 0.5 Z⊙ (Worthey etal. 1994; Maraston et al. 2003). Therefore they are not adequateto model stellar systems with high-metallicities and enhancedα/Feabundance ratios, like Bulge globular clusters, elliptical galaxiesand bulges of spirals (Maraston et al. 2003). At low metallicities,these models trace element-abundance ratios that are proper to thestars used to compute the fitting functions, which is a mix of solar-scaled and enhanced ratios (Maraston et al. 2003; Thomas, Maras-ton & Bender 2003). Finally, the models do not contain the explicitdependence on the relative elemental proportions, which isinsteada powerful tool to contrain the star formation history of stellar sys-tems (Matteucci 1994; Thomas, Greggio & Bender 1999).
To circumvent the limitations quoted above, we have com-puted new-generation stellar population models of Lick indices thatinclude the dependence of the element ratios. The models allowseveral non standard elemental mixtures, and are checked torepro-duce the Lick indices of Milky Way Halo and Bulge globular clus-ters for their proper element ratios. The models of the classical Lick
c© 2005 RAS, MNRAS000, 000–000

22 C. Maraston
indices are in Thomas, Maraston & Bender (2003) and those of thehigh-order Balmer lines in Thomas, Maraston & Korn (2004).
4.6 The D-4000
The D-4000 break is computed adopting the definition ofBruzual (1983). The main features of this index have been out-lined by several authors (among others Bruzual 1983; Barbaro &Poggianti 1997; Gorgas et al. 1999) and will not be repeated here.What we add are two interesting behaviours.
Figure 25 summarizes the main features of the D-4000 break.Typically used as pure age indicators, the D-4000 is very muchsensitive to metallicity (Figure 25, left-hand panel), andat lowmetallicity is actually completely insensitive to age. Interestinglythe D-4000, unlike the Balmer lines (Maraston & Thomas 2000)is insensitiveto the morphology of the Horizontal Branch at lowmetallicity. This suggests its use as metallicity indicator for low-metallicity extragalactic GCs, since at low metallicity the break isalso completely insensitive to age. In contrast we find the break tobe very sensitive to blue HB at high metallicity. This is alsoshownin Figure 25, left-hand panel, where the arrow indicates thevalueof the break of a 10 Gyr, solar metallicity model with a BHB (seeSection 4.8). The D-4000 break is dimished by∼ 0.6 A. The breakis completely insensitive to the IMF, when modified from Salpeterand Kroupa (Figure 25, central panel), which is obvious becausethe blue spectral region is not sensitive to the percentage of starswith masses lower than∼ 0.5M⊙.
The presence of several metallic lines in the wavelength win-dows defining the D-4000 break makes this index possibly depen-dent on the details of the chemical abundance pattern. Such an ef-fect is likely to occur at metallicities larger than solar, since thesolar-scaled models and the[α/Fe]-enhanced GCs data agree up tosolar metallicity (Figure 25, right-hand panel). This issue is inves-tigated in detail in a forthcoming paper.
4.7 The Ca II triplet index
The equivalent width of the triplet absorption line of calcium at8600 A (CaII) is computed adopting the index definition by Ce-narro et al. (2001a). The indexCaT∗ is given byCaT∗ = CaT −0.93 · PaT, therefore it is decontaminated from the possible con-tribution by the adiacent Paschen lines (described by meansof theindex PaT). The integrated indices of the SSPs are computed byadopting the index calibrations with Milky Way stars (so-called fit-ting functions) by Cenarro et al. (2001b; 2002), following astan-dard procedure to compute absorption line indices by means of fit-ting functions. Like in the case of the Lick indices, also themodelCaT reflects the Ca abundances in Milky Way halo and disk starsby construction.
The dependence of the CaII index on stellar parameters hasbeen discussed by several authors, among the first by Diaz, Diaz& Terlevich (1989) till the recent papers by Molla & Garcia-Vargas (200) and Vazdekis et al. (2003), and by Schiavon, Barbuy& Bruzual (2000), who computed the CaII index on model atrmo-spheres. Briefly recalling the index is very sensitive to gravity, be-ing strong (weak) in cool giants (dwarfs), therefore it is classicallyused to investigate the IMF. The effect of Calcium abundanceisinstead still unexplored. We plan to address this issue in a futurepaper.
The dependence of the indices on the IMF is discussed inSaglia et al. (2002) and Vazdekis et al. (2003) and will not bere-
peated here, where instead we focus on age and metallicity. Fig-ure 26 shows the integrated indicesCaT∗, CaT, PaT of the SSPs asfunctions of age for solar metallicity and as functions of metallicityfor the fixed age of 12 Gyr (upper and lower rows, respectively).The indices are rather insensitive to age att∼> 2 − 3 Gyr, whichstems from the constancy of the giant component of a stellar popu-lation after the RGB phase transition is completed (cf. Figure 13).The very mild decrease of the indices at high ages is due to thelarger contribution of the low-mass MS. Therefore the effect de-pends on the assumed IMF, and disappears for IMFs with flat ex-ponents below0.6 M⊙. In the lower panels we display the strongmetallicity dependences of the indices, caused by the fact that CaTmeasures essentially the RGB population. The saturation ofthe in-dices at highZ is most likely caused by saturation of the CaII linesat highZ. Finally the central lower panel compare the models withGCs data by Armandroff & Zinn (1988, translated into the Cenarroet al. system by Saglia et al. 2002). The models reproduce well theindex-metallicity relation of the Milky Way GCs up to a metallicitynearly solar.
4.8 Effect of blue HBs at high metallicities
The HB at high metallicity is usually red, however the presence ofexotic blue morphologies cannot be excluded. For example, as al-ready mentioned in Section 3.4.2, two rather metal-rich Milky WayGCs were indeed found to contain 10 per cent of blue HB stars(Rich et al. 1997). Since in extra-galactic studies the HB morphol-ogy is not directly accessible, it is useful to evaluate theoreticallythe effect on the SSP models of a BHB at highZ .
Table 3 provides the effects of highZ BHB on various SSPoutput13. The impact is generally expressed as a fractional change,i.e. is the percentage variation as referred to the red HB SSPwith itssign. For example, at[Z/H] = −0.33 LU increases by 60 per cent, while LK decreases by 55 per cent. For the higher-order Balmerlines HδA, HγA, HδF , HγF (Worthey & Ottaviani 1997) whosevalues cross zero when their strengths decrease, the difference (inA) between the value with BHB and RHB is given. For example,at the same metallicity, HδA increases by 5A when a BHB ispresent. The obvious consequence of having a blue HB morphol-ogy is to enhance the strength of the spectro-photometric indicatorsin the blue. From this effect comes the age-metallicity degeneracydue to the Horizontal Branch (e.g. Maraston & Thomas 2000), thatis that an unresolved BHB in an old stellar population can mimica substantially younger age. For example, a 10 Gyr SSP with so-lar metallicity and a BHB would appear as young as 2 Gyr in theBalmer lines. Note that also the metallic indices as well as the D-4000 and the CaII index change consistently and would yield anage of approximately 2 Gyr. The effect on index-index diagrams isshown in Thomas et al. (2004).
In order to break the age-BHB degeneracy the best strategyappears to be a combination of Balmer lines (or blue colours)andTP-AGB sensitive colours likeH − K. Indeed as one sees fromTable 3 the latter is insensitive to the presence of a BHB while itincreases substantially in presence of a real 2 Gyr old populationcontaining TP-AGB stars (Figure 20).
The values provided in Table 3 allow the evaluation of BHBeffects in arbitrary proportions on a stellar population, also when
13 In order to evaluate the effect on several other SSP output the readerscan compare the models with BHB and RHB that are available at the modelweb page.
c© 2005 RAS, MNRAS000, 000–000

Evolutionary population synthesis: models, analysis of the ingredients and application to high-z galaxies 23
Figure 25. The D-4000 break all at once.Left-hand panel. The dependence on age, metallicity and Horizontal Branch.The two lowest metallicity SSPs areshown with both blue and red HBs (thick and thin lines, respectively), and a negligible impact is found. The arrow points to the value of the break when a blueHB is considered in the 10 Gyr, solar metallicity SSP. A sizable decrease of∼ 0.6 A occurs as a consequence of a blue instead of a red HB.Central panel.The dependence of the D-4000 break on the input stellar tracks, shown using the BC03 models and solar metallicity SSPs, isnegligible. The dependence on thestar formation history is highlighted by means of CompositeStellar Population (CSP) models with various exponentially-decreasing star formations (dottedlines, the e-folding times are labelled beside each curve).Right-hand panelComparison of the synthetic D-4000 break of SSPs with various metallicities andthe constant age of 13 Gyr with GC data.
Figure 26. The dependence of the indicesCaT∗, CaT and PaT on age at fixed solar metallicity (upper row), andon metallicity at the fixed age of 12 Gyr(lower row). Solid and dotted lines refer to the models of this paper and of Vazdekis et al. (2003), respectively, both fora Salpeter IMF. In the lower centralpanel the models are compared with Milky Way GC data (from Armandroff & Zinn 1988).
c© 2005 RAS, MNRAS000, 000–000
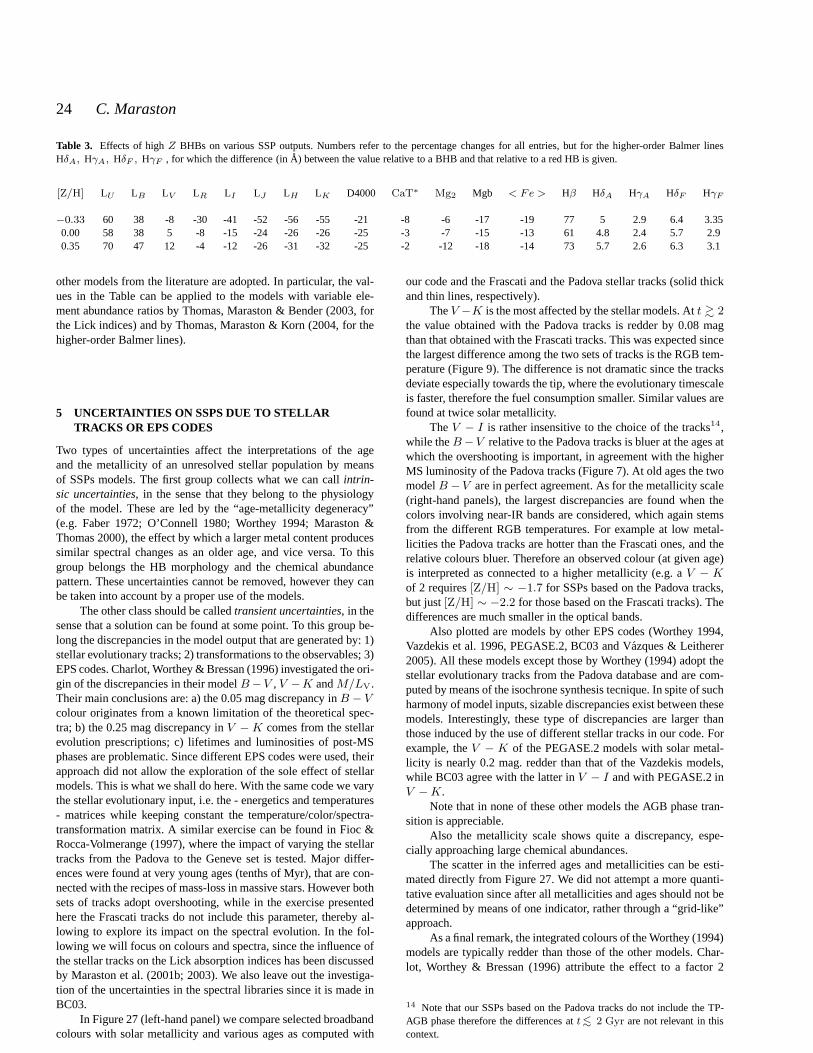
24 C. Maraston
Table 3. Effects of highZ BHBs on various SSP outputs. Numbers refer to the percentagechanges for all entries, but for the higher-order Balmer linesHδA, HγA, HδF , HγF , for which the difference (inA) between the value relative to a BHB and that relative to a red HB is given.
[Z/H] LU LB LV LR LI LJ LH LK D4000 CaT∗ Mg2 Mgb < Fe > Hβ HδA HγA HδF HγF
−0.33 60 38 -8 -30 -41 -52 -56 -55 -21 -8 -6 -17 -19 77 5 2.9 6.4 3.350.00 58 38 5 -8 -15 -24 -26 -26 -25 -3 -7 -15 -13 61 4.8 2.4 5.7 2.90.35 70 47 12 -4 -12 -26 -31 -32 -25 -2 -12 -18 -14 73 5.7 2.6 6.3 3.1
other models from the literature are adopted. In particular, the val-ues in the Table can be applied to the models with variable ele-ment abundance ratios by Thomas, Maraston & Bender (2003, forthe Lick indices) and by Thomas, Maraston & Korn (2004, for thehigher-order Balmer lines).
5 UNCERTAINTIES ON SSPS DUE TO STELLARTRACKS OR EPS CODES
Two types of uncertainties affect the interpretations of the ageand the metallicity of an unresolved stellar population by meansof SSPs models. The first group collects what we can callintrin-sic uncertainties, in the sense that they belong to the physiologyof the model. These are led by the “age-metallicity degeneracy”(e.g. Faber 1972; O’Connell 1980; Worthey 1994; Maraston &Thomas 2000), the effect by which a larger metal content producessimilar spectral changes as an older age, and vice versa. To thisgroup belongs the HB morphology and the chemical abundancepattern. These uncertainties cannot be removed, however they canbe taken into account by a proper use of the models.
The other class should be calledtransient uncertainties, in thesense that a solution can be found at some point. To this groupbe-long the discrepancies in the model output that are generated by: 1)stellar evolutionary tracks; 2) transformations to the observables; 3)EPS codes. Charlot, Worthey & Bressan (1996) investigated the ori-gin of the discrepancies in their modelB−V , V −K andM/LV.Their main conclusions are: a) the 0.05 mag discrepancy inB − Vcolour originates from a known limitation of the theoretical spec-tra; b) the 0.25 mag discrepancy inV −K comes from the stellarevolution prescriptions; c) lifetimes and luminosities ofpost-MSphases are problematic. Since different EPS codes were used, theirapproach did not allow the exploration of the sole effect of stellarmodels. This is what we shall do here. With the same code we varythe stellar evolutionary input, i.e. the - energetics and temperatures- matrices while keeping constant the temperature/color/spectra-transformation matrix. A similar exercise can be found in Fioc &Rocca-Volmerange (1997), where the impact of varying the stellartracks from the Padova to the Geneve set is tested. Major differ-ences were found at very young ages (tenths of Myr), that are con-nected with the recipes of mass-loss in massive stars. However bothsets of tracks adopt overshooting, while in the exercise presentedhere the Frascati tracks do not include this parameter, thereby al-lowing to explore its impact on the spectral evolution. In the fol-lowing we will focus on colours and spectra, since the influence ofthe stellar tracks on the Lick absorption indices has been discussedby Maraston et al. (2001b; 2003). We also leave out the investiga-tion of the uncertainties in the spectral libraries since itis made inBC03.
In Figure 27 (left-hand panel) we compare selected broadbandcolours with solar metallicity and various ages as computedwith
our code and the Frascati and the Padova stellar tracks (solid thickand thin lines, respectively).
TheV −K is the most affected by the stellar models. Att & 2the value obtained with the Padova tracks is redder by 0.08 magthan that obtained with the Frascati tracks. This was expected sincethe largest difference among the two sets of tracks is the RGBtem-perature (Figure 9). The difference is not dramatic since the tracksdeviate especially towards the tip, where the evolutionarytimescaleis faster, therefore the fuel consumption smaller. Similarvalues arefound at twice solar metallicity.
TheV − I is rather insensitive to the choice of the tracks14,while theB−V relative to the Padova tracks is bluer at the ages atwhich the overshooting is important, in agreement with the higherMS luminosity of the Padova tracks (Figure 7). At old ages thetwomodelB −V are in perfect agreement. As for the metallicity scale(right-hand panels), the largest discrepancies are found when thecolors involving near-IR bands are considered, which againstemsfrom the different RGB temperatures. For example at low metal-licities the Padova tracks are hotter than the Frascati ones, and therelative colours bluer. Therefore an observed colour (at given age)is interpreted as connected to a higher metallicity (e.g. aV − Kof 2 requires[Z/H] ∼ −1.7 for SSPs based on the Padova tracks,but just[Z/H] ∼ −2.2 for those based on the Frascati tracks). Thedifferences are much smaller in the optical bands.
Also plotted are models by other EPS codes (Worthey 1994,Vazdekis et al. 1996, PEGASE.2, BC03 and Vazques & Leitherer2005). All these models except those by Worthey (1994) adoptthestellar evolutionary tracks from the Padova database and are com-puted by means of the isochrone synthesis tecnique. In spiteof suchharmony of model inputs, sizable discrepancies exist between thesemodels. Interestingly, these type of discrepancies are larger thanthose induced by the use of different stellar tracks in our code. Forexample, theV − K of the PEGASE.2 models with solar metal-licity is nearly 0.2 mag. redder than that of the Vazdekis models,while BC03 agree with the latter inV − I and with PEGASE.2 inV −K.
Note that in none of these other models the AGB phase tran-sition is appreciable.
Also the metallicity scale shows quite a discrepancy, espe-cially approaching large chemical abundances.
The scatter in the inferred ages and metallicities can be esti-mated directly from Figure 27. We did not attempt a more quanti-tative evaluation since after all metallicities and ages should not bedetermined by means of one indicator, rather through a “grid-like”approach.
As a final remark, the integrated colours of the Worthey (1994)models are typically redder than those of the other models. Char-lot, Worthey & Bressan (1996) attribute the effect to a factor 2
14 Note that our SSPs based on the Padova tracks do not include the TP-AGB phase therefore the differences att∼< 2 Gyr are not relevant in thiscontext.
c© 2005 RAS, MNRAS000, 000–000

Evolutionary population synthesis: models, analysis of the ingredients and application to high-z galaxies 25
Figure 27. Effects of stellar models and EPS codes on colour-age (left-hand panel) and colour-metallicity at fixed (12 Gyr) relations of stellar populationmodels. The thin solid lines are SSP models computed with ourcode and the Padova stellar evolutionary tracks. The effectof the TP-AGB phase (see Sections3.4.3 and 4 and Figures 18, 19 and 20) is highlighted.
more stars on the upper RGBs of G. Worthey isochrones than onthe Padova isochrones used in the other two EPS. The fuel con-sumption approach helps to avoid such uncertainties.
6 A JUMP TO HIGH-Z: TP-AGB STARS IN SPITZERGALAXIES?
As discussed in Section 3.1 the onset and development of the TP-AGB phase occupies a narrow age range in the evolutionary path ofstellar populations, being confined to ages0.3 ∼< t/Gyr∼< 2. Dur-
ing this short epoch the TP-AGB phase is the dominant one in astellar population providing∼ 40 per cent of the bolometric con-tribution, and up to∼ 80 per cent of that in theK-band (Figure 13).Therefore the inclusion of the TP-AGB phase in a stellar popula-tion model is essential for a correct interpretation of galaxies withstellar populations in this age range as discussed in Section 4.2.2.In particular, the TP-AGB phase can be used as an age indicatorof intermediate-age stellar populations and its power is tobe rela-tively robust against the age/metallicity degeneracy. In this direc-tion goes the work by Silva & Bothun (1998), in which the twoAGB-sensitive colours J−H and H−K were used to constrain the
c© 2005 RAS, MNRAS000, 000–000
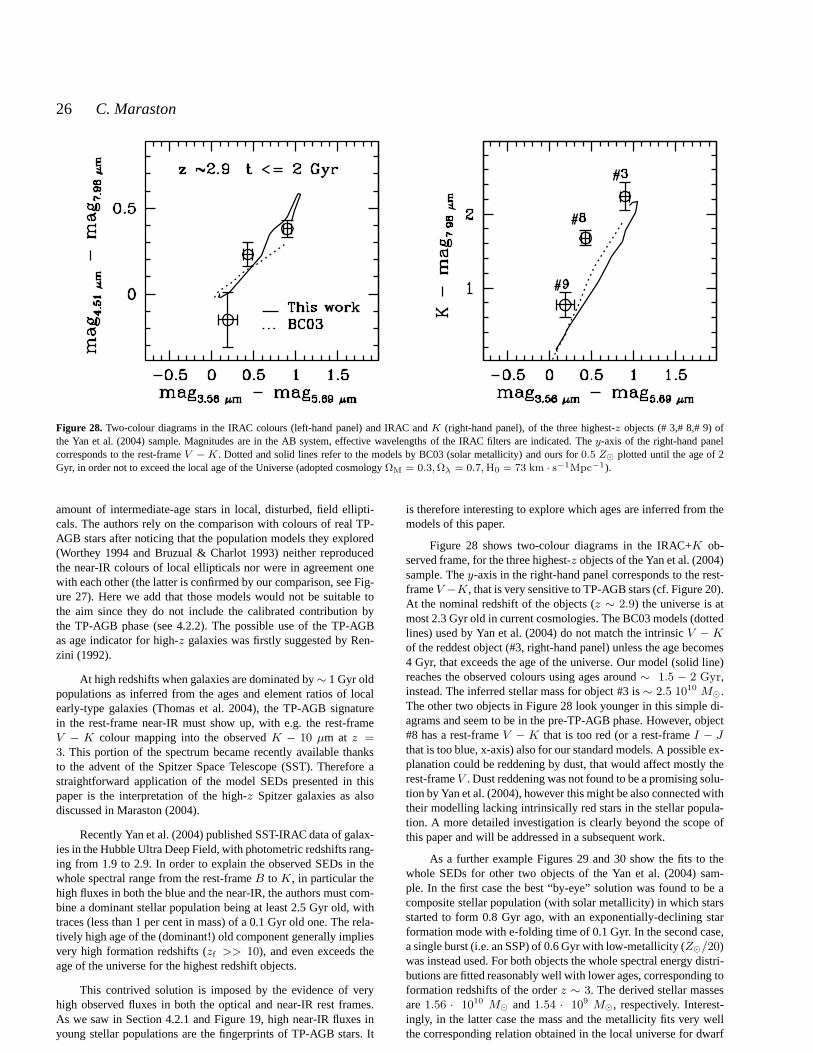
26 C. Maraston
Figure 28. Two-colour diagrams in the IRAC colours (left-hand panel) and IRAC andK (right-hand panel), of the three highest-z objects (# 3,# 8,# 9) ofthe Yan et al. (2004) sample. Magnitudes are in the AB system,effective wavelengths of the IRAC filters are indicated. They-axis of the right-hand panelcorresponds to the rest-frameV − K. Dotted and solid lines refer to the models by BC03 (solar metallicity) and ours for0.5 Z⊙ plotted until the age of 2Gyr, in order not to exceed the local age of the Universe (adopted cosmologyΩM = 0.3,Ωλ = 0.7,H0 = 73 km · s−1Mpc−1).
amount of intermediate-age stars in local, disturbed, fieldellipti-cals. The authors rely on the comparison with colours of realTP-AGB stars after noticing that the population models they explored(Worthey 1994 and Bruzual & Charlot 1993) neither reproducedthe near-IR colours of local ellipticals nor were in agreement onewith each other (the latter is confirmed by our comparison, see Fig-ure 27). Here we add that those models would not be suitable tothe aim since they do not include the calibrated contribution bythe TP-AGB phase (see 4.2.2). The possible use of the TP-AGBas age indicator for high-z galaxies was firstly suggested by Ren-zini (1992).
At high redshifts when galaxies are dominated by∼ 1 Gyr oldpopulations as inferred from the ages and element ratios of localearly-type galaxies (Thomas et al. 2004), the TP-AGB signaturein the rest-frame near-IR must show up, with e.g. the rest-frameV − K colour mapping into the observedK − 10 µm at z =3. This portion of the spectrum became recently available thanksto the advent of the Spitzer Space Telescope (SST). Therefore astraightforward application of the model SEDs presented inthispaper is the interpretation of the high-z Spitzer galaxies as alsodiscussed in Maraston (2004).
Recently Yan et al. (2004) published SST-IRAC data of galax-ies in the Hubble Ultra Deep Field, with photometric redshifts rang-ing from 1.9 to 2.9. In order to explain the observed SEDs in thewhole spectral range from the rest-frameB toK, in particular thehigh fluxes in both the blue and the near-IR, the authors must com-bine a dominant stellar population being at least 2.5 Gyr old, withtraces (less than 1 per cent in mass) of a 0.1 Gyr old one. The rela-tively high age of the (dominant!) old component generally impliesvery high formation redshifts (zf >> 10), and even exceeds theage of the universe for the highest redshift objects.
This contrived solution is imposed by the evidence of veryhigh observed fluxes in both the optical and near-IR rest frames.As we saw in Section 4.2.1 and Figure 19, high near-IR fluxes inyoung stellar populations are the fingerprints of TP-AGB stars. It
is therefore interesting to explore which ages are inferredfrom themodels of this paper.
Figure 28 shows two-colour diagrams in the IRAC+K ob-served frame, for the three highest-z objects of the Yan et al. (2004)sample. They-axis in the right-hand panel corresponds to the rest-frameV −K, that is very sensitive to TP-AGB stars (cf. Figure 20).At the nominal redshift of the objects (z ∼ 2.9) the universe is atmost 2.3 Gyr old in current cosmologies. The BC03 models (dottedlines) used by Yan et al. (2004) do not match the intrinsicV −Kof the reddest object (#3, right-hand panel) unless the age becomes4 Gyr, that exceeds the age of the universe. Our model (solid line)reaches the observed colours using ages around∼ 1.5 − 2 Gyr,instead. The inferred stellar mass for object #3 is∼ 2.5 1010 M⊙.The other two objects in Figure 28 look younger in this simpledi-agrams and seem to be in the pre-TP-AGB phase. However, object#8 has a rest-frameV − K that is too red (or a rest-frameI − Jthat is too blue, x-axis) also for our standard models. A possible ex-planation could be reddening by dust, that would affect mostly therest-frameV . Dust reddening was not found to be a promising solu-tion by Yan et al. (2004), however this might be also connected withtheir modelling lacking intrinsically red stars in the stellar popula-tion. A more detailed investigation is clearly beyond the scope ofthis paper and will be addressed in a subsequent work.
As a further example Figures 29 and 30 show the fits to thewhole SEDs for other two objects of the Yan et al. (2004) sam-ple. In the first case the best “by-eye” solution was found to be acomposite stellar population (with solar metallicity) in which starsstarted to form 0.8 Gyr ago, with an exponentially-declining starformation mode with e-folding time of 0.1 Gyr. In the second case,a single burst (i.e. an SSP) of 0.6 Gyr with low-metallicity (Z⊙/20)was instead used. For both objects the whole spectral energydistri-butions are fitted reasonably well with lower ages, corresponding toformation redshifts of the orderz ∼ 3. The derived stellar massesare1.56 · 1010 M⊙ and1.54 · 109 M⊙, respectively. Interest-ingly, in the latter case the mass and the metallicity fits very wellthe corresponding relation obtained in the local universe for dwarf
c© 2005 RAS, MNRAS000, 000–000

Evolutionary population synthesis: models, analysis of the ingredients and application to high-z galaxies 27
Figure 29. Comparison between the observed narrow-band fluxes of ob-ject #11 from Yan et al. (2004) and those of a 0.8 Gyr old stellar popu-lation model with solar metallicity in which the stars are forming with anexponentially-declining star formation rate with e-folding time of 0.1 Gyr.
Figure 30. Comparison between the observed narrow-band fluxes of object#15 from Yan et al. (2004) and those of a 0.6 Gyr old metal-poorsimplestellar population.
early-type galaxies (Thomas et al. 2003b). This example opens thepossibility that at least part of the very red galaxies couldbe objectscaugth during the full development of the TP-AGB phase.
The fits shown in Figures 29 and 30 are quite rudimentary andare meant to illustrate the application of the new models to high-zdata. The ‘best’ solution was searched only “by eye”, without thehelp of statistical tools, which would go far beyond the scope of the
paper. However the match is encorauging and we will analyse moreobjects and in a more precise way in a future work.
7 SUMMARY
Evolutionary population synthesis models with various ages, metal-licities, star formation histories, Horizontal Branch morphologies,are presented. The evolutionary code is based on the fuel consump-tion theorem (Renzini & Buzzoni 1986) for the evaluation of the en-ergetics of the post Main Sequence evolutionary phases. Thecodewas introduced in our previous work (Maraston 1998) in whichstellar population models complete in all main stellar evolutionaryphases, but only for solar metallicity were computed. The presentpaper provides the extension of the modelling to a wider range ofstellar population parameters. The most important features of themodels are: i) the inclusion of the energetics and the spectra ofTP-AGB stars and their calibrations with observations; ii)the al-lowance for various Horizontal Branch morphologies, in particularblue morphologies at high metallicities. We will come back to bothpoints below.
In the first part of the paper we perform a comprehensive anal-ysis of the model ingredients, focusing in particular on: i)the metal-licity effects on energetics and temperatures; ii) the impact of dif-ferent stellar evolutionary tracks. The most relevant results can besummarized as follows.
The energetics of stellar populations are higher at lower metal-licity because of the greater hydrogen abundance. The most af-fected stellar phases are the main sequence and the helium burn-ing phase. The differences become smaller at ages later thantheRGB phase-transition (t∼> 1 Gyr) when the RGB phase becomesthe most important contributor to the total bolometric. This is dueto the RGB fuel consumption being not affected dramaticallybythe chemical abundance, a result consistent with previous findings(Sweigart, Greggio & Renzini 1989).
The impact of stellar evolutionary tracks is evaluated by com-paring energetics and temperatures of two different stellar models,namely the set of Frascati tracks by Cassisi and collaborators, thatare classical tracks without overshooting, with those by the Padovaschool, that include the effects of overhsooting. We find that themass- luminosity relations for MS stars are rather similar amongthe explored tracks, which is explained by the modest amountofovershooting included in recent computations. Instead, major dif-ferences are found in post-MS phases, which involve both theener-getics and the temperatures of the Red Giant Branch. In the Padovatracks the onset and development of the RGB is delayed with re-spect to the Frascati tracks, an effect of overshooting. Forexample,a∼ 0.8 Gyr stellar population model based on the Padova trackshas∼ 30 per cent less light than one based on the Frascati tracks,a result influencing the integrated output, especially theM/L. Itshould be noticed that a recent comparison of the onset age oftheRGB with what is observed in MC GCs favours the earlier RGBdevelopment of the Frascati tracks (Ferraro et al. 2004).
The temperatures of the RGB, especially towards the tip arecooler in the Padova tracks, at solar metallicity and above,a featurealso found in the Yale tracks of Yi et al. (2003). The RGB tem-perature is the ingredient having the largest influence on the SSPoutput. For example, the integratedV − K colours of old, metal-rich, stellar populations change by∆V−K ∼ 0.08mag. The RGBtemperatures are connected to the mixing-length and the underlyingstellar models. The calibration of these effects is difficult since thecomparisons with data require the adoption of temperature-colors
c© 2005 RAS, MNRAS000, 000–000
28 C. Maraston
transformations, that are uncertain as well. In spite of this, it wouldbe highly valuable to understand the origin of such discrepancies atleast theoretically.
Relevant to evolutionary population synthesis models is thefollowing result. The differences induced by the use of variousstellar tracks in our code are substantially smaller than the scat-ter among stellar population models in the literature that adopt thesame stellar tracks.
In the second part of the paper we describe in detail the recipesfor the stellar phases that are affected by mass-loss and there-fore not described sufficiently by stellar evolutionary tracks. Theseare the Horizontal Branch (HB) in old stellar populations and theThermally-Pulsing Asymptotic Giant Branch (TP-AGB) in stellarpopulations with ages between 0.2 and 2 Gyr. For the HB we ap-ply mass-loss to the RGB tracks such that we obtain a good matchto stellar population spectrophotometric indicators thatare sensi-tive to the HB morphology (e.g. the Balmer lines). We thereforecalibrate the amount of mass-loss with MW GCs of known HBmorphology. In order to account for the observed scatter in theHB properties at a fixed metallicity, we provide the models witha couple of choices for the HB morphology. In particular, we alsocompute blue HB at highZ and show how much blue indicatorslike e.g. the Balmer lines and theU,B, V magnitudes are affected.The effects of BHBs at highZ are quantified in a form that can beeasily used also when other evolutionary population synthesis areadopted.
A result interesting for extra-galactic GC studies is that the D-4000A break, unlike the Balmer lines is insensitive not only to agebut also to the Horizontal Branch morphology at low metallicity([Z/H]∼< − 1). Therefore this colour can be used as metallicityindicator in the metal-poor regime.
The energetic of the TP-AGB phase was calibrated with Mag-ellanic Clouds GCs data in Maraston (1998). It was shown thatthisphase is the dominant one in stellar populations with ages between0.3 and 2 Gyr, providing 40 per cent of the bolometric and up to80 per cent of the luminosity in the near-IR. Here we make a stepforward by including the spectra of TP-AGB stars in the syntheticspectral energy distributions (SEDs) of the stellar population mod-els, using available empirical spectra of TP-AGB C-rich andO-rich stars. We compare the resulting model SEDs with the observedSEDs of a sample of MC GCs with data fromU toK. The modelsprovide a very good fit to the data in the whole age range relevantto the TP-AGB, a success that is entirely due to the proper inclu-sion of the phase in the models. We further compute the integratedspectral indicesC2,H2O,CO in the near-IR (1.7 ∼<λ/µm∼< 2.4),that are effective tracers of C and O stars. We find that the combi-nation ofC2 andH2O can be used to determine the metallicity of∼ 1 Gyr stellar populations, independently of the star formationhistory.
The model SEDs presented here can be applied to the analysisof high-z galaxies extending the concept of TP-AGB as age indi-cator for∼ 1 Gyr stellar populations to primeval objects in theearly universe. As an illustrative application we re-analyze somehigh-z (2.4∼<z∼< 2.9) galaxies recently observed with the SpitzerSpace Telescope (Yan et al. 2004). The distinctive featuresof theseobjects is to have strong fluxes in both the rest-frames blue andnear-IR relative to the flux in theV -band. This is what character-izes TP-AGB dominated stellar populations. We show that thedatacan be explained by stellar populations with ages in the range 0.6 to1.5 Gyr. These ages are comfortable given the age of the universe at
those redshifts (∼ 2 Gyr) and imply formation redshifts between3 and 6.
Models are available at www-astro.physics.ox.ac.uk/∼maraston.
ACKNOWLEDGMENTS
In the list of acknowledgments the pole position is clearly gained bySantino Cassisi, for his constant availability to satisfy the most ex-otic requests in terms of evolutionary computations. Many thanksgo to Laura Greggio, Alvio Renzini, and Daniel Thomas for thecareful reading of the manuscript, and their very constructive com-ments. I would also like to thank Paul Goudfrooij for providing theglobular cluster data before publication. Furthermore I amgrate-ful to Don Vandenberg for very useful comments on tempera-ture/colors transformations and for having provided some of hismodels in advance of publication.
REFERENCES
Aaronson, M., Frogel J. A., Persson, S.E. 1978, ApJ, 220, 442Alvarez, R., Lancon, A., Plez, B., et al. 2000, A&A, 353, 322Armandroff, T.E., Zinn, R. 1988, AJ, 96, 92Arimoto, N., Yoshii, Y. 1986, A&A, 164, 260Barbaro, G., Pigatto, L., A&A, 136, 335Barbaro, G., Poggianti, B.M. 1997, A&A, 324, 490Ballik, E.A., Ramsay, D.A. 1963, ApJ, 137, 61Barbuy, B., Renzini, A., Ortolani, S., Bica, E., & Guarnieri, M. D. 1999,
A&A, 341, 539Barmby, P., Huchra, J.P. 2000, AJ, 119, 727Bertelli, G., Nasi, E., Girardi, L., et al. 2003, AJ, 125, 770Bergbusch, P.A., Vandenberg, D.A. 1992, ApJS, 81, 163Bergbusch, P.A., Vandenberg, D.A. 2001, ApJ, 556, 322Bessel, M.S., Brett, J.M., Scholz, M., et al. 1989, A&AS, 77,1Block, D.L., Freeman, K.C., Jarrett, T.H., et al. 2004, A&A,425, L37Bloecker, T., Schoenberner, D. 1991, A&A, 244, L43Bono, G., Caputo, F., Cassisi, S. et al. 1997, ApJ 489, 822Boothroyd, A.I., Sackmann, I.J. 1988, ApJ, 328, 632Bressan, A., Granato, G.L., Silva, L. 1998, A&A, 332, 135Brocato, E., Castellani, V., Poli, F.M. et al. 2000, A&AS, 146, 91Bruzual G. A. 1983, ApJ, 273, 105Bruzual G. A., Charlot S. 1993, ApJ, 405, 538Bruzual G. A., Charlot S. 2003, MNRAS, 344, 1000Buzzoni A. 1989, ApJS, 71, 817Cassisi, S., Castellani, M., Castellani, V. 1997a, A&A, 317, 108Cassisi, S., Degl’Innocenti, S., Salaris, M. 1997b, MNRAS,290, 515Cassisi, S., Salaris, M. 1997, MNRAS, 285, 593Cassisi, S., Castellani, V., Ciarcielluti, P. et al. 2000 MNRAS, 315, 679Castellani V., Chieffi A., Straniero O. 1992, ApJS, 78, 517Cenarro A.J., Cardiel N., Gorgas J., et al. 2001a, MNRAS, 326, 959Cenarro A.J., Gorgas J., Cardiel N., et al. 2001b, MNRAS, 326, 981Cenarro A.J., Gorgas J., Cardiel N., et al. 2002, MNRAS, 329,863Charlot, S. Bruzual, G. 1991, ApJ, 367, 126Charlot S., Worthey G., Bressan A. 1996, ApJ, 457, 625Chiosi C., Bertelli G., Bressan A. 1988, A&A, 196, 84Cohen, J. G., Carretta, E., Gratton, R.G., & Behr, B.B.. 1999, AJ, 122, 1469de Freitas Pacheco, J. A., & Barbuy, B. 1995, A&A, 302, 718De Santi, R. & Cassisi S. 1999, MNRAS 308, 9Diaz, A.I, Terlevich, E. Terlevich, R. 1989, MNRAS, 239, 325Dickens, R.,J., 1972, MNRAS, 157, 281Faber, S.M. 1972, A&A, 20, 361Fagotto, F., Bressan, A., Bertelli, G., Chiosi, C. 1994, A&AS, 105, 29Ferraro F., Fusi Pecci F., Testa V., et al. 1995, MNRAS, 272, 391Ferraro F., Origlia L., Testa V., et al. 2004, ApJ, 608, 772
c© 2005 RAS, MNRAS000, 000–000

Evolutionary population synthesis: models, analysis of the ingredients and application to high-z galaxies 29
Fioc, M., Rocca-Volmerange, B. 1997, A&A, 326, 950, PEGASE.2Frogel J. A., Persson, S.E., Aaronson, M., et al. 1978, ApJ, 220, 75Frogel J. A., Mould J. R., Blanco V. M., 1990, ApJ, 352, 96Fusi Pecci, F., Renzini, A. 1976, A&A, 46, 447Girardi, L., Chiosi, C., Bertelli, G., et al. 1995, A&A, 298,87Gorgas, J., Cardiel, N., Pedras, S., Gonzales, J.J. 1999, A&AS, 139, 29Greggio, L. 1997, MNRAS, 301, 166Greggio, L., Renzini, A. 1990, ApJ, 364, 35Goudfrooij, P., Kissler-Patig, M., Maraston, C., Karakla,D. 2005, AJ,in
preparationHarris W. E., Catalogue of Parameters For Milky Way GlobularClusters,
McMaster University, revision 1 April 1996Iben, I., Jr., Renzini, A. 1983, ARA&A, 21, 271Kim, Y-C., Demarque, P., Yi, S.K., et al. 2002, ApJS, 143, 499Kodama, T., Arimoto, N. 1997, A&A, 320, 41Kroupa, P. 2001, MNRAS, 322, 231Kurucz R., L. 1979, ApJS, 40, 1Yan, H., Dickinson, M., Eisenhardt, P.R.M., et al. 2004, ApJ, 616, 63Lancon, A., Mouhcine, M., Fioc, M., et al. 1999, A&A, 344, L21Lancon, A., Wood, P.R. 2000, A&AS, 146, 217Lancon, A., Mouhcine, M. 2000, A&A, 393, 67Lattanzio, J.C. 1986, ApJ, 311, 708Le Borgne, J. F., Bruzual, G., Pello’, R., et al. 2003, A&A, 402, 433Le Borgne, D., Rocca-Volmerange, B., Prugniel, P., et al. 2004, A&A, 425,
4Lee, H., Yoon, S.J., Lee, Y.W. 2000, AJ, 120, 998Leitherer, C. et al. 1999, ApJS, 123, 40Lejeune, T., Cuisinier, F., Buser, R. 1998, A&AS 130, 65Lloidl, R., Lancon, A., Jorgensen, U.G. 2001, A&A, 371, 1065Maraston, C. 1998, MNRAS, 300, 872Maraston, C. 2004, in “Multiwavelength mapping of galaxy evolution”,
proceedings of the II Venice conference, eds. A. Renzini & R.BenderMaraston, C., Thomas, D., 2000, ApJ, 541, 126Maraston, C., Kissler-Patig, M., Brodie, J., Barmby, P., Huchra, J.P. 2001a,
A&A, 370, 176Maraston, C., Greggio, L., and Thomas, D. 2001b, Ap&SS, 276,893Maraston, C., Greggio, L., Renzini, A., et al. 2003, A&A, 400, 823Maraston, C., Bastian, N., Saglia, R.P., et al. 2004, A&A, 416, 467Marigo, P. 2001, A&A, 370, 194Marigo, P., Bressan, A., Chiosi, C. 1996, A&A, 313, 545Marigo, P., Bressan, A., Chiosi, C. 1999, A&A, 344, 123Matteucci, F. 1994, A&A, 288, 57Miller B.W., Whitmore B.C., Schweizer F., Fall, S.M. 1997, AJ 114, 2381Molla, M., Garcia-Vargas, M.L. 2000, A&A, 359, 18Meynet, G., Maeder, A., Schaller, G. et al. 1994, A&AS, 103, 97Michaud, G., et al. 2004, ApJ, 606, 452Mouhcine, M., Lancon, A. 2002, A&A, 393, 149O’Connell, R.W. 1980, ApJ, 236, 430Ortolani, S., Renzini, A., Gilmozzi, R., Marconi, G., Barbuy, B., Bica, E.,
Rich, M., 1995a, Nature, 377, 701.Persson, S.E., Aaronson, M., Cohen, J.G., et al. 1983, ApJ, 266, 105Piotto, G. et al. 2002, A&A, 391, 945Reimers, D. 1977, A&A, 61, 217Renzini A. 1981, in “Galaxy Formation”, ed. J. Silk and N. Vittorio, (Ams-
terdam: North Holland), p. 303Renzini A. 1992, in B. Barbuy and A. Renzini, Dordrecht, Kluwer, 1992.
IAU Symp. 149, The Stellar Populations of Galaxies, p. 325Renzini, A. 1994, A&A, 285, L5Renzini A., 1994, in “Galaxy Formation”, ed. J. Silk and N. Vittorio, (Am-
sterdam: North Holland), p. 303Renzini A., and Voli M. 1981, A&A 94, 175Renzini A., Buzzoni A. 1986 in Spectral Evolution of Galaxies, C. Chiosi
and A. Renzini (eds.), Dordecht, Reidel, p.195Renzini, A., Fusi Pecci, F. 1988, ARA&A, 26, 199Renzini A., Ciotti, L. 1993, ApJ, 416, L49Rich, M., Sosin, C., Djorgovski, S.G., et al. 1997, ApJL, 484, 25Rocca-Volmerange, B., Guiderdoni, B. 1987, A&A, 175, 15Saglia, R.P., Maraston, C., Greggio, L., et al. 2000, A&A, 360, 91
Saglia, R.P., Maraston, C., Thomas, D., et al. 2002, ApJL, 444, 111Salaris, M. & Cassisi, S. 1996, A&A, 305, 858Salasnich, B., Girardi, L., Weiss, A., et al. 2000, A&A 361, 1023Schaller, G., Schaerer, D., Meynet, G., et al. 1992, A&AS, 96, 269Schlegel, D.A., Finkbeiner, D.P., Davis, M. 1998, ApJ, 500,525Schiavon, R.P., Barbuy, B., Bruzual, G. 2000, ApJ, 532, 453Schweizer F., Seitzer P., 1998, AJ 116, 2206Searle, L., Wilkinson, A., Bagnuolo, W.G. 1980, ApJ, 239, 803Silva, D.R., Bothun, G.D. 1998, ApJ, 116, 85Sweigart A. V., Greggio L., Renzini A. 1989, ApJS, 69, 911Sweigart A. V., Greggio L., Renzini A. 1990, ApJ, 364, 527Tantalo, R., Chiosi, C., Bressan, A., et al. 1996, A&A, 311, 361Tinsley, B.M. 1972, A&A, 20, 383Tinsley, B.M., Gunn, J.E. 1976, ApJ, 203, 52Thomas, D., Greggio, L., & Bender, R. 1999, MNRAS, 302, 537Thomas, D., Maraston, C. 2003, A&A, 311, 361Thomas, D., Maraston, C., Bender, R. 2003a, MNRAS, 311, 361Thomas, D., Bender, R., Hopp, U., et al. 2003b, Ap&SS, 284, 599Thomas, D., Maraston, C., Korn, A. 2004, MNRAS, 351, L19Thomas, D., Maraston, C., Bender, R., Mendes de Oliveira, C.2004, ApJ,
621, 673Tinsley, B. M. 1980, ApJ, 241, 41VandenBerg, D. A., Clem, J.L. 2003, AJ, 126, 802van den Bergh, S. 1981, A&AS, 46, 79Vassiliadis, E., Wood, P.R. 1993, 413, 641Vazdekis, A., Casuso, E., Peletier, R.F., Beckmann, J.E. 1996, ApJS, 103,
307Vazdekis, A., Cenarro, A.J., Gorgas, J., et al. 2003, MNRAS,340, 1317Vazques, G.A., Leitherer, C. 2005, ApJ, 621, 717Wagenhuber, J, Groenewegen, M.A.T. 1998, A&A, 340, 183Woo, J-H., Gallart, C., Demarque, P., et al. 2003, AJ, 125, 754Worthey, G. 1994, ApJS, 95, 107Worthey, G., Faber, S. M., Gonzalez, J. J., & Burstein, D. 1994, ApJS, 94,
687Worthey, G., & Ottaviani, D.L. 1997, ApJS, 111, 377Yi, S.K., Kim, Y-C.., Demarque, P. 2003, ApJS, 144, 259Zinn, R., & West, M.J. 1984, ApJS, 55, 45
c© 2005 RAS, MNRAS000, 000–000