Evolutionary history of the OmpR/IIIA family of signal transduction two component systems in...
15
RESEARCH ARTICLE Open Access Evolutionary history of the OmpR/IIIA family of signal transduction two component systems in Lactobacillaceae and Leuconostocaceae Manuel Zúñiga 1* , Ciara Luna Gómez-Escoín 2 , Fernando González-Candelas 2,3 Abstract Background: Two component systems (TCS) are signal transduction pathways which typically consist of a sensor histidine kinase (HK) and a response regulator (RR). In this study, we have analyzed the evolution of TCS of the OmpR/IIIA family in Lactobacillaceae and Leuconostocaceae, two families belonging to the group of lactic acid bacteria (LAB). LAB colonize nutrient-rich environments such as foodstuffs, plant materials and the gastrointestinal tract of animals thus driving the study of this group of both basic and applied interest. Results: The genomes of 19 strains belonging to 16 different species have been analyzed. The number of TCS encoded by the strains considered in this study varied between 4 in Lactobacillus helveticus and 17 in Lactobacillus casei. The OmpR/IIIA family was the most prevalent in Lactobacillaceae accounting for 71% of the TCS present in this group. The phylogenetic analysis shows that no new TCS of this family has recently evolved in these Lactobacillaceae by either lineage-specific gene expansion or domain shuffling. Furthermore, no clear evidence of non-orthologous replacements of either RR or HK partners has been obtained, thus indicating that coevolution of cognate RR and HKs has been prevalent in Lactobacillaceae. Conclusions: The results obtained suggest that vertical inheritance of TCS present in the last common ancestor and lineage-specific gene losses appear as the main evolutionary forces involved in their evolution in Lactobacillaceae, although some HGT events cannot be ruled out. This would agree with the genomic analyses of Lactobacillales which show that gene losses have been a major trend in the evolution of this group. Background Two component systems (TCS) are widespread signal transduction pathways mainly found in bacteria where they play a major role in adaptation to changing envir- onmental conditions. Nevertheless, they can also be found in some eukaryotes and archaea. Numerous stu- dies have shown the involvement of TCS in a broad range of adaptive processes such as sporulation, nitrogen regulation, phosphate regulation, cell envelope stress response, pathogenicity, motility, etc. [1]. TCS typically consist of a sensor histidine kinase (HK), usually mem- brane-bound, and a cytoplasmic response regulator (RR). HKs and RRs are modular proteins containing homologous and heterologous domains [2,3]. The homologous domains, kinase domain and H-box in HKs and receptor domain in RR, are involved in the phos- photransfer reaction whereas the heterologous domains, sensor (HKs) and effector (RR) domains, are involved in the reception of a specific stimulus and the correspond- ing response, respectively. In the most basic scheme, upon detection of a stimu- lus, the HK autophosphorylates in a conserved His resi- due at the H-box and subsequently transfers the phosphate group to a conserved aspartyl residue at the receptor domain of the RR. Phosphorylation of the RR modulates its activity and in most cases it functions as a transcriptional regulator [1]. In addition, more complex phosphotransfer relays also exist which involve multiple phosphotransfer reactions among domains that can be found on separate polypeptides or as part of multi- domain proteins [4-6]. Furthermore, some HKs also * Correspondence: [email protected] 1 Departamento de Biotecnología de Alimentos, Instituto de Agroquímica y Tecnología de Alimentos, Consejo Superior de Investigaciones Científicas (CSIC), PO Box 73, 46100 Burjassot, Valencia, Spain Full list of author information is available at the end of the article Zúñiga et al. BMC Evolutionary Biology 2011, 11:34 http://www.biomedcentral.com/1471-2148/11/34 © 2011 Zúñiga et al; licensee BioMed Central Ltd. This is an Open Access article distributed under the terms of the Creative Commons Attribution License (http://creativecommons.org/licenses/by/2.0), which permits unrestricted use, distribution, and reproduction in any medium, provided the original work is properly cited.
-
Upload
manuel-zuniga -
Category
Documents
-
view
213 -
download
0
Transcript of Evolutionary history of the OmpR/IIIA family of signal transduction two component systems in...

RESEARCH ARTICLE Open Access
Evolutionary history of the OmpR/IIIA family ofsignal transduction two component systems inLactobacillaceae and LeuconostocaceaeManuel Zúñiga1*, Ciara Luna Gómez-Escoín2, Fernando González-Candelas2,3
Abstract
Background: Two component systems (TCS) are signal transduction pathways which typically consist of a sensorhistidine kinase (HK) and a response regulator (RR). In this study, we have analyzed the evolution of TCS of theOmpR/IIIA family in Lactobacillaceae and Leuconostocaceae, two families belonging to the group of lactic acidbacteria (LAB). LAB colonize nutrient-rich environments such as foodstuffs, plant materials and the gastrointestinaltract of animals thus driving the study of this group of both basic and applied interest.
Results: The genomes of 19 strains belonging to 16 different species have been analyzed. The number of TCSencoded by the strains considered in this study varied between 4 in Lactobacillus helveticus and 17 in Lactobacilluscasei. The OmpR/IIIA family was the most prevalent in Lactobacillaceae accounting for 71% of the TCS present inthis group. The phylogenetic analysis shows that no new TCS of this family has recently evolved in theseLactobacillaceae by either lineage-specific gene expansion or domain shuffling. Furthermore, no clear evidence ofnon-orthologous replacements of either RR or HK partners has been obtained, thus indicating that coevolution ofcognate RR and HKs has been prevalent in Lactobacillaceae.
Conclusions: The results obtained suggest that vertical inheritance of TCS present in the last common ancestorand lineage-specific gene losses appear as the main evolutionary forces involved in their evolution inLactobacillaceae, although some HGT events cannot be ruled out. This would agree with the genomic analyses ofLactobacillales which show that gene losses have been a major trend in the evolution of this group.
BackgroundTwo component systems (TCS) are widespread signaltransduction pathways mainly found in bacteria wherethey play a major role in adaptation to changing envir-onmental conditions. Nevertheless, they can also befound in some eukaryotes and archaea. Numerous stu-dies have shown the involvement of TCS in a broadrange of adaptive processes such as sporulation, nitrogenregulation, phosphate regulation, cell envelope stressresponse, pathogenicity, motility, etc. [1]. TCS typicallyconsist of a sensor histidine kinase (HK), usually mem-brane-bound, and a cytoplasmic response regulator(RR). HKs and RRs are modular proteins containing
homologous and heterologous domains [2,3]. Thehomologous domains, kinase domain and H-box in HKsand receptor domain in RR, are involved in the phos-photransfer reaction whereas the heterologous domains,sensor (HKs) and effector (RR) domains, are involved inthe reception of a specific stimulus and the correspond-ing response, respectively.In the most basic scheme, upon detection of a stimu-
lus, the HK autophosphorylates in a conserved His resi-due at the H-box and subsequently transfers thephosphate group to a conserved aspartyl residue at thereceptor domain of the RR. Phosphorylation of the RRmodulates its activity and in most cases it functions as atranscriptional regulator [1]. In addition, more complexphosphotransfer relays also exist which involve multiplephosphotransfer reactions among domains that can befound on separate polypeptides or as part of multi-domain proteins [4-6]. Furthermore, some HKs also
* Correspondence: [email protected] de Biotecnología de Alimentos, Instituto de Agroquímica yTecnología de Alimentos, Consejo Superior de Investigaciones Científicas(CSIC), PO Box 73, 46100 Burjassot, Valencia, SpainFull list of author information is available at the end of the article
Zúñiga et al. BMC Evolutionary Biology 2011, 11:34http://www.biomedcentral.com/1471-2148/11/34
© 2011 Zúñiga et al; licensee BioMed Central Ltd. This is an Open Access article distributed under the terms of the Creative CommonsAttribution License (http://creativecommons.org/licenses/by/2.0), which permits unrestricted use, distribution, and reproduction inany medium, provided the original work is properly cited.
contain PAS (Per-Arnt-Sim) domains [7], possiblyinvolved in sensing redox potential, HAMP domains(Histidine kinases, Adenylyl cyclases, Methyl bindingproteins, Phosphatases) which have been proposed totransmit the stimulus from the sensor domain to theH-box and kinase domains [8] or a second type ofHis-domain termed HPt which functions as an inter-mediate phosphate receiver and donor in complex phos-phorelays [1]. In some cases, TCS also include auxiliaryproteins that regulate the activities of the HK or thatinfluence the stability of RR phosphorylation [9].TCS are found in varying numbers in bacteria
although, generally, bacteria with larger genomes encodemore TCS [10,11]. In addition, free-living bacteriausually harbour more TCS than pathogenic bacteria [4],suggesting a correlation between metabolic versatilityand number of TCS [10]. Data from complete genomesequencing projects have shown that TCS-specificdomains rank among the most common proteindomains found in bacteria. This has led to the develop-ment of specialised databases such as MiST [12] orP2CS [13] and to the proposal of a number of classifica-tion schemes. Some researchers have based TCS classifi-cations on phylogenetic reconstructions of conserveddomains [4,14-16]. A second approach has made use ofthe domain composition of TCS proteins [17,18]. Not-withstanding, the results of most classifications agree toa considerable extent and have shown that the majorityof TCS proteins belong to a limited number of familieswhich share common ancestry and domain structure[19]. Furthermore, TCS are usually encoded by adjacentgenes (although orphan genes can also be found) andare arranged in the same order and orientation [4].The evolutionary history of TCS has also been the
subject of a number of studies [19]. Koretke et al. [4]studied the TCS proteins encoded in 18 genomes (12bacteria, 4 archaea and 2 eukaryotes). From their phylo-genetic analyses they concluded that TCS systems origi-nated in bacteria and were acquired by archaea andeukaryotes by multiple horizontal gene transfer (HGT)events. They also concluded that coevolution of cognateHKs and RRs has been prevalent, although some exam-ples of recruitment were also detected, mostly in hybridHKs. Furthermore, coevolution is also prevalent at thedomain level, so that domain shuffling or swapping havebeen relatively rare events [4,20]. A subsequent studyfocused on HKs present in 207 genomes modified tosome extent this view [21]. The analysis of this datasetrevealed that many bacteria carry a large repertoire ofrecently evolved HKs as a result of lineage-specific geneexpansion (LSE) or HGT and species-specific preferencefor either of these two modes of acquisition of newTCS. For example, genomes with large numbers of HKsrelative to their genome size tended to accumulate HKs
by LSE. In addition, whereas TCS acquired by HGTtended to be organized in operons, those arising fromLSE were much more likely to show as “orphans” sepa-rated from their cognate RRs [21]. The origin of TCSalso correlated with the frequency of subsequent generearrangements. For instance, whereas 47.4% of HGT-acquired HKs conserved the same domain composition,only 29.1% of LSE-acquired HKs retained the samedomain structure as their closest paralogs [21].Other studies have focused on TCS systems present in
particular bacterial groups [18,22-25]. These studieshave not shown great discrepancies with the conclusionsfrom general studies although they have provided amore detailed picture of the corresponding evolutionaryscenarios. For example, the study of TCS systems inPseudomonas has shown a significant contribution ofgene recruitment in the evolution of the NarL-group ofTCS whereas coevolution was prevalent in the OmpR-group [24]. In summary, the results obtained so far indi-cate that all TCS share a common ancestor from whichmajor families have evolved by duplication and diver-gence. This process has continued during bacterial evo-lution with the acquisition of new sensor or effectorcapabilities via domain shuffling [19].Lactic acid bacteria (LAB) constitute a group of obli-
gate fermentative microorganisms that produce lacticacid as the main product of sugar degradation. Thischaracteristic has been exploited to produce a variety offermented products since the acidification and enzy-matic processes associated to their growth prevent theproliferation of detrimental organisms and pathogensand confer the characteristic flavor and texture of theseproducts. Furthermore, some strains, especially lactoba-cilli that colonize the gastrointestinal tract of humansand animals, are considered as probiotics [26,27]. LABhave been isolated from a wide range of sources includ-ing a variety of foodstuffs, beverages, plants and the gas-trointestinal tract of animals. Taxonomically, LAB areclassified within the order Lactobacillales which encom-passes the families Aerococcaceae, Carnobacteriaceae,Enterococcaceae, Lactobacillaceae, Leuconostocaceae andStreptococcaceae. However, phylogenetic analyses do notsupport the distinction between Leuconostocaceae andLactobacillaceae [28]. For this reason, throughout thisstudy the term Lactobacillaceae will be used to refer tospecies currently classified within the families Lactoba-cillaceae and Leuconostocaceae. The genome sequencesof a number of Lactobacillaceae species from differentecological niches are currently available thus enablingcomparative genomics and evolutionary analyses. Animportant conclusion from these studies is that lineage-specific gene loss has been extensive in the evolution ofLactobacillales [29]. However, no study on the evolutionof TCS in this bacterial group has been carried out yet.
Zúñiga et al. BMC Evolutionary Biology 2011, 11:34http://www.biomedcentral.com/1471-2148/11/34
Page 2 of 15

A number of physiological studies have dealt with thefunctional role of TCS in LAB. These studies haveshown the involvement of some TCS in quorum sensingand production of bacteriocins [30-33], the stressresponse in some species of this group [34-36] andmalic acid metabolism in Lactobacillus casei [37]. Theseresults suggest that TCS may have played a role in theadaptation of LAB to the different ecological niches thatthey occupy. Therefore, the phylogenetic analysis ofTCS present in LAB may provide insight into the evolu-tionary processes involved in the adaptation of LAB tothe different habitats they colonize and into the func-tional role of as yet uncharacterized TCS. The aim ofthis work is thus to explore the evolution of TCS inLactobacillaceae. To this end we have focused in theOmpR/IIIA family since they are the most widely dis-tributed in this bacterial group. The prototypic Escheri-chia coli OmpR EnvZ system was originally identified asregulating the expression of the porin-encoding genesompF and ompC in response to medium osmolarity[38]. Later studies have shown the involvement of mem-bers of this family in varied physiological processes. Toput some examples, OmpR/IIIA TCSs are involved innitrogen metabolism in Streptomyces coelicolor [39] orphosphate metabolism in E. coli [40]and Bacillus subtilis[41]. Furthermore, some orthologous systems controldifferent processes in different bacteria, such as theYycFG TCS which has been involved in cell division,
cell wall biosynthesis or virulence factor expression,among other functions [42].
Results and discussionNumber, distribution and classification of TCS present inLactobacillaceaeThe number of TCS-encoding genes harbored by thestrains considered in this study varied between 8, in Lacto-bacillus helveticus DPC 4571, and 33 in Lactobacillus caseiBL23 and L. casei ATCC 334 (Table 1). Taking the Bac-teria domain as a whole, a correlation between genomesize and the number of encoded TCS was observed [17].The genomes of the Lactobacillaceae strains consideredhere have very similar genome sizes with an average ofabout 2 Mb, except L. casei and Lactobacillus plantarum(Table 1). Hence, this correlation cannot be observedalthough the strains with the largest genomes encode thehighest numbers of TCS genes (Figure 1A). Additionally,no correlation was observed between the main habitat ofthe strains and the number of TCS genes in their genomes(Figure 1B). Several authors have observed that specieswith complex lifestyles, colonizing varied environments orpossessing numerous alternative metabolic pathways tendto encode larger complements of signal-transducingproteins [10,21]. The lack of differences between Lactoba-cillaceae isolated from distinct environments likely reflectsthe low metabolic diversity within this group and theirsimilar lifestyles and it also suggests that they do not have
Table 1 Genome size and number of TCS genes encoded by the strains used in this study
Strain Genome size (Mb)1 TCS genes2 Origin
Lactobacillus acidophilus NCFM 1.99 16 Human isolate [61]
L. brevis ATCC 367 2.35 21 Fermented plant material [62]
L. casei BL23 3.08 33 Uncertain origin [63]
L. casei ATCC 334 2.95 33 Cheese (ATCC3)
L. delbrueckii subsp. bulgaricus ATCC 11842 1.86 12 Yogurt (ATCC)
L. delbrueckii subsp. bulgaricus ATCC BAA-365 1.86 14 French starter culture (ATCC)
L. fermentum IFO 3956 2.10 12 Fermented plant material [64]
L. gasseri ATCC 33323 1.89 10 Human isolate (DSMZ4)
L. helveticus DPC 4571 2.08 8 Swiss cheese isolate [65]
L. johnsonii NCC533 1.99 18 Human isolate [66]
L. plantarum WCFS1 3.34 28 Human saliva isolate [67]
L. reuteri DSM 20016 2.00 17 Human intestinal isolate (DSMZ)
L. reuteri JCM 1112 2.04 19 Human fecal isolate [64]
L. sakei 23 K 1.88 18 Meat isolate [68]
L. salivarius UCC118 2.13 16 Human ileal-caecal isolate [69]
Leuconostoc citreum KM20 1.9 13 Kimchi [70]
Lc. mesenteroides subsp. mesenteroides ATCC 8293 2.07 19 Olive fermentation (ATCC)
Oenococcus oeni PSU-1 1.78 12 Wine isolate [71]
Pediococcus pentosaceus ATCC 25745 1.83 17 Fermented plant material [72]1 Values calculated including plasmids.2 Number of genes encoding either a RR or a HK (putative pseudogenes are not considered).3 American Type Culture Collection.4 Deutsche Sammlung von Mikroorganismen und Zellkulturen.
Zúñiga et al. BMC Evolutionary Biology 2011, 11:34http://www.biomedcentral.com/1471-2148/11/34
Page 3 of 15

to cope with significantly different levels of environmentalchallenges.No hybrid HKs were encoded by any strain included
in this study. The genes encoding HKs and their corre-sponding RR partners were organized in operons (not
shown). In a few cases, one of the partners was a pseu-dogene (Table 2 and additional file 1). In addition, sometrue orphan genes were also detected although theyaccounted for a very small fraction of the total (10genes out of 173 TCS; Table 2 and additional file 1).
0 1 2 3 4
Genome size (Mb)
Nº
TC
Sg
en
es
A B
Plant Human Dairy0
5
10
15
20
25
30
35
Origin
Nº
TC
Sgenes
0
5
10
15
20
25
30
35
Figure 1 Number of TCS-encoding genes versus genome size or habitat. A. Number of TCS genes versus genome size in the 19Lactobacillaceae strains analized. B. Number of TCS genes versus the main habitat of the corresponding strain. The upper and lower boundariesof the boxes indicate the 75th and 25th percentile, respectively. The line within the box marks the median. The whiskers indicate the maximumand minimum values of each data series.
Table 2 Number of TCS genes in different families encoded by Lactobacillaceae
Strain Families
AraC CitB NarL LytR LytR OmpR YcbB
I IV II I HPK10 IIIA IV
L. acidophilus NCFM 0 0 0 0 4 12 0
L. brevis ATCC 367 0 2 0 0 31 14 2
L. casei BL23 0 2 4 0 32 24 0
L. casei ATCC 334 0 2 4 0 32 24 0
L. delbrueckii subsp. bulgaricus ATCC 11842 0 0 0 0 12 112 0
L. delbrueckii subsp. bulgaricus ATCC BAA-365 0 0 0 0 2 12 0
L. fermentum IFO 3956 0 0 2 0 0 93 13
L. gasseri ATCC 33323 0 0 0 0 0 10 0
L. helveticus DPC 4571 0 0 0 0 0 8 0
L. johnsonii NCC533 0 0 2 0 4 12 0
L. plantarum WCFS1 2 0 4 0 103,4 12 0
L. reuteri DSM 20016 0 0 13 2 0 133 13
L. reuteri JCM 1112 0 0 33 2 0 133 13
L. sakei 23 K 0 0 32 0 32 12 0
L. salivarius UCC118 0 0 2 0 4 10 0
Leuconostoc citreum KM20 0 0 0 0 12 12 0
Lc. mesenteroides subsp. mesenteroides ATCC 8293 0 0 2 0 4 132 0
Oenococcus oeni PSU-1 0 0 0 2 0 10 0
Pediococcus pentosaceus ATCC 25745 0 0 2 2 2 10 13
Total 2 6 29 8 44 241 61 Gene cluster containing one RR and two HKs.2 One incomplete TCS (pseudogene).3 One incomplete TCS (orphan).4 One gene cluster containing two RR and one HK.
Zúñiga et al. BMC Evolutionary Biology 2011, 11:34http://www.biomedcentral.com/1471-2148/11/34
Page 4 of 15
The TCS present in Lactobacillaceae were classifiedaccording to the schemes of Fabret et al. [15] for HKs andGalperin [17] for RRs. The classification of HKs is basedon the comparison of the amino-acid sequence of theregion around the phosphorylatable histidine [15]. Thisanalysis divided the HKs present in B. subtilis into fiveclasses (I, II, IIIA, IIIB and IV). The classification of RRs isbased primarily on their domain architectures and struc-tures of the constituent domains [17]. Most HKs and RRscould be accommodated within these classificationschemes. The only exceptions corresponded to a group ofHKs associated to LytR RRs, which correspond to theHPK10 family of the classification of Grebe and Stock [14],and a group of RRs homologous to the E. coli CitB notincluded in Galperin’s classification [17]. A strong correla-tion in the association of families of HKs and RR wasobserved in Lactobacillaceae, for example, IIIA HKs areinvariably associated to OmpR RRs. This correlation hasbeen previously pointed out as a common feature of TCS[4,14,15] and led to Grebe and Stock to propose that manyHKs and their cognate RRs have evolved as integral units[14], a view in agreement with the coevolution model [4].A summary of the types of TCS found in each strain
is shown in Table 2 and detailed lists of TCS identifiedin each strain are provided in the additional file 1. Byfar, the OmpR/IIIA family was the most prevalent inLactobacillaceae, accounting for 71% of the TCS presentin this group (Table 2). Furthermore, this is the onlyfamily present in all the strains included in this study.
For these reasons, we focused our attention in thisfamily for subsequent analyses.
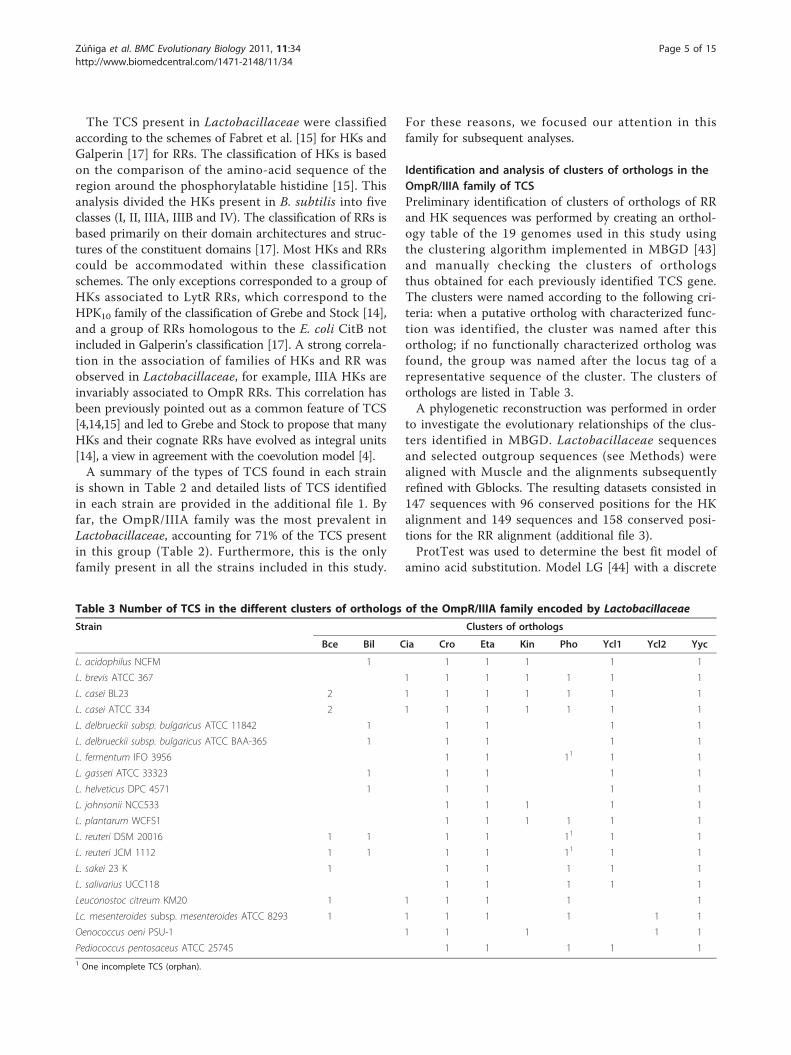
Identification and analysis of clusters of orthologs in theOmpR/IIIA family of TCSPreliminary identification of clusters of orthologs of RRand HK sequences was performed by creating an orthol-ogy table of the 19 genomes used in this study usingthe clustering algorithm implemented in MBGD [43]and manually checking the clusters of orthologsthus obtained for each previously identified TCS gene.The clusters were named according to the following cri-teria: when a putative ortholog with characterized func-tion was identified, the cluster was named after thisortholog; if no functionally characterized ortholog wasfound, the group was named after the locus tag of arepresentative sequence of the cluster. The clusters oforthologs are listed in Table 3.A phylogenetic reconstruction was performed in order
to investigate the evolutionary relationships of the clus-ters identified in MBGD. Lactobacillaceae sequencesand selected outgroup sequences (see Methods) werealigned with Muscle and the alignments subsequentlyrefined with Gblocks. The resulting datasets consisted in147 sequences with 96 conserved positions for the HKalignment and 149 sequences and 158 conserved posi-tions for the RR alignment (additional file 3).ProtTest was used to determine the best fit model of
amino acid substitution. Model LG [44] with a discrete
Table 3 Number of TCS in the different clusters of orthologs of the OmpR/IIIA family encoded by Lactobacillaceae
Strain Clusters of orthologs
Bce Bil Cia Cro Eta Kin Pho Ycl1 Ycl2 Yyc
L. acidophilus NCFM 1 1 1 1 1 1
L. brevis ATCC 367 1 1 1 1 1 1 1
L. casei BL23 2 1 1 1 1 1 1 1
L. casei ATCC 334 2 1 1 1 1 1 1 1
L. delbrueckii subsp. bulgaricus ATCC 11842 1 1 1 1 1
L. delbrueckii subsp. bulgaricus ATCC BAA-365 1 1 1 1 1
L. fermentum IFO 3956 1 1 11 1 1
L. gasseri ATCC 33323 1 1 1 1 1
L. helveticus DPC 4571 1 1 1 1 1
L. johnsonii NCC533 1 1 1 1 1
L. plantarum WCFS1 1 1 1 1 1 1
L. reuteri DSM 20016 1 1 1 1 11 1 1
L. reuteri JCM 1112 1 1 1 1 11 1 1
L. sakei 23 K 1 1 1 1 1 1
L. salivarius UCC118 1 1 1 1 1
Leuconostoc citreum KM20 1 1 1 1 1 1
Lc. mesenteroides subsp. mesenteroides ATCC 8293 1 1 1 1 1 1 1
Oenococcus oeni PSU-1 1 1 1 1 1
Pediococcus pentosaceus ATCC 25745 1 1 1 1 11 One incomplete TCS (orphan).
Zúñiga et al. BMC Evolutionary Biology 2011, 11:34http://www.biomedcentral.com/1471-2148/11/34
Page 5 of 15

gamma distribution to account for heterogeneity in evo-lutionary rates among sites, an estimation of the propor-tion of invariant sites and the empirical frequencies ofamino acids (LG+G+I+F) was identified as the best fitmodel for both datasets. The phylogenetic informationcontent of the datasets was then evaluated by using like-lihood mapping. Briefly, this analysis enables to estimatethe suitability for phylogenetic reconstruction of a dataset from the proportion of unresolved quartets in amaximum likelihood analysis. The analysis was carriedout using TreePuzzle with the WAG [45] model of sub-stitution (the second best model selected by ProtTest)since the LG model is not implemented in this program.On the basis of ProtTest results, the datasets were ana-lysed with a discrete gamma distribution and theempirical amino acids frequencies (WAG+G+F). Thelikelihood mapping showed that both datasets containedrelatively low phylogenetic information, with only 68.2%and 77.7% fully resolved quartets in HKs and RRs,respectively (Fig. S1 in additional file 3).The phylogenetic reconstructions were performed with
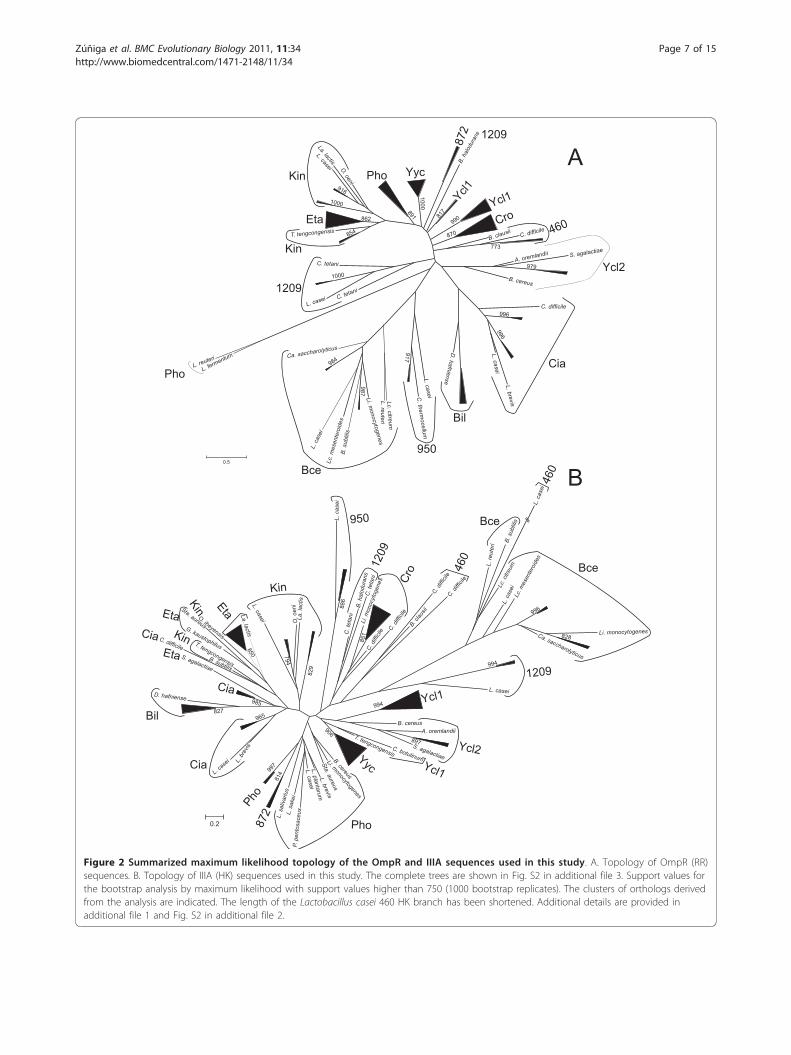
PhyML using the LG+G+I+F model (Figure 2 and Fig. S2in additional file 3). In accordance with the results of thelikelihood mapping, very few nodes had bootstrap sup-port values higher than 75%. Most clusters of orthologsidentified in MBGD could be distinguished in the RRtree, although some of them were not supported (clusters950, Bce, Cia and Ycl2), and in other groups some out-group sequences did not cluster with their correspondingLactobacillaceae counterparts (clusters 1209, Kin andYcl1; see Figure 2 and Fig. S2 in additional file 2).Furthermore, the orphan RRs Lreu_1569 and LAF_1230encoded by Lactobacillus reuteri and Lactobacillus fer-mentum, respectively, constituted a separate cluster (Fig-ure 2 and Fig. S2 in additional file 2). However, thesegenes were located next to a gene cluster encoding aputative phosphate uptake system homologous to thoselocated next to Pho TCS (Fig. S3 in additional file 2).The HK tree was less resolved, as expected from the
likelihood mapping result, and in many cases outgroupsequences did not cluster with their corresponding Lac-tobacillaceae counterparts. Furthermore, some clusterswere not observed in the HK phylogenetic reconstruc-tion. HKs belonging to clusters Pho and 872 constitutedone cluster (although with low support in their basalnodes; Figure 2). HKs belonging to clusters Ycl1 andYcl2 were identified by MBGD as belonging to the samecluster of orthologs and the phylogenetic analysis alsosuggested a relationship between these two clusters.However, the phylogenetic reconstruction and MBGDclustering indicated that Ycl1 and Ycl2 RRs constitutedseparate clusters of orthologs.In order to determine whether the above mentioned
incongruent cases were due to the low resolution of the
trees or they indicated wrong assignments of clusters oforthologs, detailed analyses of Ycl1 and Ycl2 HKs, Phoand 872 RRs and HKs, and Eta and Kin RRs and HKswere carried out.HK sequences belonging to groups Ycl1 and Ycl2 were
aligned, resulting in a dataset of 233 sites after trimmingthe initial alignment with Gblocks (additional file 3).The best fit model for this dataset was LG+G+I+F. Thelikelihood mapping (using again WAG+G+F) showed anincrease in phylogenetic signal compared to the com-plete HK dataset (89% resolved quartets; Fig. S4 in addi-tional file 2). The phylogenetic analysis of Ycl1 and Ycl2HKs showed that Ycl1 and Ycl2 formed separate clusterswith strong support that included their correspondingoutgroup sequences (Figure 3) with the exception of theputative Ycl1 sequences of Clostridium botulinum andThermoanaerobacter tengcongensis. This result confirmsthat they constitute two different clusters of orthologs.Pho and 872 RRs and HKs were aligned and trimmed,
resulting in 193 and 239 site datasets, respectively (addi-tional file 3). ProtTest analysis also selected LG+G+I+F asthe best fit model for both datasets. Likelihood mappinganalysis also showed an increase in phylogenetic signal inthe HK dataset (85.5% resolved quartets; Fig. S4 in addi-tional file 2) but the phylogenetic signal in the RR datasetwas slightly lower than in the complete OmpR dataset(73.3% resolved quartets for Pho and 872 vs. 77.7% for theOmpR dataset; Fig. S4 in additional file 2). The phyloge-netic reconstruction of Pho and 872 HKs (Figure 4) sepa-rated both groups, thus confirming that they constituteseparate clusters of orthologs. The phylogenetic recon-struction of Pho RR also showed the separation betweenPho and 872 clusters. Furthermore, the orphan genesLreu_1569 and LAF_1230 appeared in a long branchwithin the other Pho sequences (Figure 4). Although thebasal nodes were not supported in the maximum likeli-hood reconstruction, the position of these two sequencesin the phylogenetic tree and the analysis of their genomiccontext (Fig. S3 in additional file 2) strongly suggest thatthey belong to the Pho cluster of orthologs.Eta and Kin sequences were also identified as separate
clusters of orthologs; however, the phylogenetic recon-structions of RR and HKs suggested that they mightconstitute a cluster of orthologs. In order to ascertainthis point a detailed analysis of these groups was alsocarried out. The trimmed alignments of the correspond-ing HK and RR sequences consisted of 262 and 203conserved sites, respectively (additional file 3). ProtTestselected LG+G+I+F for the HK dataset and LG+G forthe RR dataset. The likelihood mapping analysis (usingWAG+G+F) showed an increase in phylogenetic signalfor both datasets (85% and 89.1% resolved quartets forHK and RRs, respectively; Fig. S4 in additional file 2).The ML reconstruction showed that Eta and Kin
Zúñiga et al. BMC Evolutionary Biology 2011, 11:34http://www.biomedcentral.com/1471-2148/11/34
Page 6 of 15
0.5
L.casei
L.bre
vis
C. difficile
996
996
Cia
979A. oremlandii S. agalactiae
B. cereus
Ycl2
D.hafn
iense
Bil
L.caseiC
.th
erm
ocellu
m
950
Lc.citre
um
Lc.m
esente
roid
es
L.re
ute
ri
Li.
monocyto
genes
917
B.subtilis
L.casei
987
984Ca. saccharolyticus
Bce
L. reuteri
L. fermentum
Pho
1000
L. casei C. tetani
C. tetani
B.halo
dura
ns
1209
1209
872
T. tengcongensis854
Kin
L. casei
La. lactis
O.oeni
Eta
1000
916
Kin Pho Yyc
862
891
1000
817
990
Ycl1
Ycl1
C. difficile
B. clausii
Cro
460
773
0.2
D. hafniense
827Bil
L. case
i L.bre
vis
965
Cia
Cia985
S. agalactiae
Eta
C. difficile
Cia
B. subtilis
T. tengcongensis
KinG. kaustophilus
Sta. aureus
O. iheyensis
Eta
Eta
Kin
850
La.la
ctis
L.ca
sei
829
794
La.la
ctis
O.oeni
Kin
L.
ca
se
i886
950
Pho
997
814
872
C.te
tani
C.te
tani
B.halo
dura
ns
1209
Li.
monocyto
genes
C.diff
icile
C.diff
icile
Cro
C.diff
icile
C. d
ifficile
B. c
laus
ii
460
B.subtilis
L.re
ute
ri
L.casei
Lc.
citreum
460
L.casei
Lc.
mese
nte
roid
es
Li. monocytogenesCa. saccharolyticus
851
996
828
Bce
Bce
L. casei
994
1209
994Ycl1
B. cereus
A. oremlandii
897S. agalactiae
Ycl2C. botulinum
T. tengcongensis
Ycl1
Yyc
906
B. cereus
Li. monocytogenes
Sta
.aure
us
L.saliv
arius
L.sakei
P.pento
saceus
L.casei
L.pla
nta
rum
L.bre
vis
Pho
870
A
B
Figure 2 Summarized maximum likelihood topology of the OmpR and IIIA sequences used in this study. A. Topology of OmpR (RR)sequences. B. Topology of IIIA (HK) sequences used in this study. The complete trees are shown in Fig. S2 in additional file 3. Support values forthe bootstrap analysis by maximum likelihood with support values higher than 750 (1000 bootstrap replicates). The clusters of orthologs derivedfrom the analysis are indicated. The length of the Lactobacillus casei 460 HK branch has been shortened. Additional details are provided inadditional file 1 and Fig. S2 in additional file 2.
Zúñiga et al. BMC Evolutionary Biology 2011, 11:34http://www.biomedcentral.com/1471-2148/11/34
Page 7 of 15

sequences were clearly separated with strong support,thus demonstrating that they constitute separate clustersof orthologs (Figure 5).In summary, the phylogenetic reconstructions of
OmpR RRs and IIIA HKs showed the clustering of theLactobacillaceae orthologous sequences with their cor-responding outgroup sequences thus indicating that theTCS systems present in Lactobacillaceae have notresulted from duplications (lineage-specific gene expan-sion) after the differentiation of this taxonomical group.This result suggests that these systems either were pre-sent in the last common ancestor of the group or thatthey were acquired by HGT during the evolution of thisgroup.
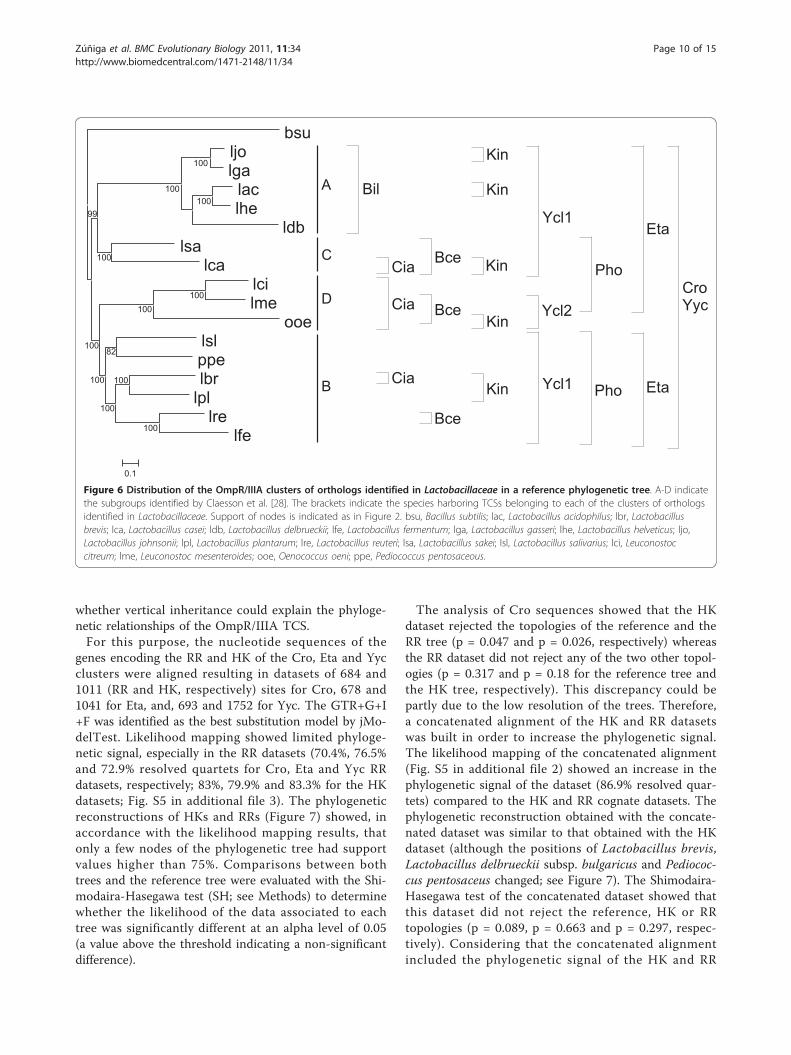
Distribution of clusters of orthologs in the reference treeIn order to gain insight on the origin of the OmprR/IIIATCS present in Lactobacillaceae, we compared their dis-tribution with a concatenated reference species tree(Figure 6). The reference tree was derived from a139204 sites dataset obtained from the Gblocks-trimmed
concatenated alignments of 141 genes (see Methods).The tree was obtained by maximum likelihood using the(GTR+G+I+F) nucleotide substitution model [46]selected with jModelTest. The topology of the tree wasessentially the same as that obtained by Claesson et al.[28] and the four groups identified by these authorswere also identified in this phylogenetic reconstruction(Figure 6).Clusters of orthologs with only one Lactobacillaceae
sequence were not considered, as this analysis cannotprovide clues about their origin. The widespread distri-bution of clusters Cro, Eta (only absent in Oenococcusoeni), and Yyc strongly suggests that they were presentin the last common ancestor of Lactobacillaceae. Simi-larly, the distribution of Pho can be explained by line-age-specific gene losses in the last common ancestor ofgroup A and in O. oeni. Alternative scenarios wouldrequire three independent HGT events in the last com-mon ancestor of group B, the last common ancestor ofgroup C, and the last common ancestor of Leuconostocmesenteroides and Leuconostoc citreum or two HGTevents in the last common ancestors of group C andgroups B and D and a subsequent lineage-specific geneloss in O. oeni. The distribution of the Ycl1 cluster alsopoints to its presence in the last common ancestor ofLactobacillaceae, with a subsequent lineage-specificgene loss in group D. The origin of other clusters ismore controversial: the distribution of Kin sequencescould be explained by five HGT events or seven lineage-specific gene losses; the distribution of Cia by threeHGT events or six lineage-specific gene losses; the dis-tribution of Bce by four HGT events or five lineage-specific gene losses, and, the distribution of Bil by oneHGT or two lineage-specific gene losses. Althoughfuture analyses with more sequences may shed light onthe phylogenetic history of these clusters, it is worthmentioning that if they had resulted from HGT eventsthese must have occurred long ago, because clearlyorthologous genes are shared by distantly related strainswithin the Lactobacillaceae.
Phylogenetic analyses of Cro, Eta and Yyc clusters oforthologsAs we have just seen, most TCS of the OmpR/IIIAfamily have a limited distribution in Lactobacillaceae(Table 3) making it difficult to obtain reliable informa-tion about their evolutionary history. Only two systems,Cro and Yyc are present in all the strains used in thisstudy. In addition, Eta TCS is also present in all thestrains except O. oeni. Hence, we selected these threesystems to further analyze two points. Firstly, we wereinterested on the relative roles of coevolution and generecruitment in the evolution of the OmpR/IIIA family inLactobacillaceae. Secondly, we wanted to determine
941
1000
961
999
989
972
749
1000
987
911
802
1000
0.5
BC1957Bacillus cereus
Clos_1203Alkaliphilus oremlandii
LEUM_0957Lc. mesenteroides
OEOE_1772O. oeni
CKL_0561Clostridium kluyveri
SAG0124Streptococcus agalactiae
Ycl2
PEPE_1353P. pentosaceus
lsl_1160L. salivarius
LSEI_1042L. casei
lsa1214L. sakei
lvis_1315L. brevis
laf_0398L. fermentum
LREU_0417L. reuteri
lp_2505L. plantarum
LBUL_0622L. delbrueckii
LGAS_1260L. gasseri
lj0919L. johnsonii
lba0747L. acidophilus
lhv_0791L. helveticus
lmo1508Listeria monocytogenes
BSU03760Bacillus subtilis
Ycl1
CBO3542Clostridium botulinum
TTE2569Thermoanaerobacter tengcongensis
Figure 3 Maximum likelihood topology of the Ycl1 and Ycl2HK sequences used in this study. The tree is arbitrarily rootedwith the Ycl2 cluster. The species and the locus tags of thecorresponding genes are indicated. The brackets indicate theclusters of orthologs. Support of nodes is indicated as in Figure 2.
Zúñiga et al. BMC Evolutionary Biology 2011, 11:34http://www.biomedcentral.com/1471-2148/11/34
Page 8 of 15

lvis_0632L. brevis
lp_0744L. plantarum
LSEI_0935L. casei
lsa0501L. sakei
lsl_1181L. salivarius
SAG1960Streptococcus agalactiae
LBUL_0873L. delbrueckii
Cthe_1599Clostridium thermocellum
LCK_01261Lc. citreum
LEUM_0588Lc. mesenteroides
BC4588Bacillus cereus
lmo2500Listeria monocytogenes
SE1368Staphylococcus epidermidis
Pho
872
942
830
1000
748
777
831
1000
0.2
PEPE_0432P. pentosaceus
LBUL_0872L. delbrueckii
SAG1961Streptococcus agalactiae
Cthe_1600Clostridium thermocellum872
LVIS_0631L. brevis
LCK_01263Lc. citreum
LEUM_0585Lc. mesenteroides
lp_0743L. plantarum
LSL_1182L. salivarius
lsa0500L. sakei
LSEI_0934L. casei
PEPE_0431P. pentosaceus
BC4589Bacillus cereus
SE1369Staphylococcus epidermidis
LMO2501L. monocytogenes
1000
983
1000
0.5
1000 LAF_1230L. fermentum
Lreu_1569L. reuteri
Pho
RR HK
Figure 4 Maximum likelihood topologies of the Pho and 872 sequences used in this study. The trees are arbitrarily rooted with the 872cluster. The species and the locus tags of the corresponding genes are indicated. The brackets indicate the clusters of orthologs. Support ofnodes is indicated as in Figure 2.
940
775
781
993
890
1000
903
978
1000
805
996
996
0.2
980
988
793
850
1000
982
997
872
1000
998902
828
928
845
1000
868
0.5
RR HK
LBA1659L. acidophilus
LJ1132L. johnsonii
lp_0283L. plantarum
lvis_0317L. brevis
LSEI_2681L. casei
llmg_1520Lactococcus lactis
OEOE_0488O. oeni
Kin
SAG1625S. agalactiae
llmg_0908Lactococcus lactis
lck_00401Lc. citreum
LEUM_1732Lc. mesenteroides
LJ1631L. johnsonii
lgas1398L. gasseri
LBUL_1389L. delbrueckii
LBA1525L. acidophilus
lhv_1588L. helveticus
lvis_1018L. brevis
lsa1384L. sakei
LSEI_1679L. casei
LP_1544L. plantarum
lsl_0522L. salivarius
PEPE0714P. pentosaceus
laf_1298L. fermentum
Lreu_1228L. reuteri
Eta
gk2157Geobacillus kaustophilus
SAV1415Staphylococcus aureus
OB0594Oceanobacillus iheyensis
BSU13250Bacillus subtilis
TTE1016Thermoanaerobacter tengcongensis
LSEI_2680L. casei
lp_0282L. plantarum
OEOE_0489O. oeni
Lactococcus lactis llmg_1518
lba1660L. acidophilus
lj1133L. johnsonii
Kin
lvis_0316L. brevis
laf_1297L. fermentum
lck_00402Lc. citreum
LEUM_1731Lc. mesenteroides
lreu_1227L. reuteri
PEPE_0715P. pentosaceus
lsl_0523L. salivarius
lp_1545L. plantarum
lvis_1017L. brevis
lba1524L. acidophilus
lhv_1587L. helveticus
lj1630L. johnsonii
LGAS_1397L. gasseri
LBUL_1388L. delbrueckii
lsa1383L. sakei
LSEI_1678L. casei
llmg_0909Lactococcus lactis
Eta
BSU13260Bacillus subtilis
TTE1017Thermoanaerobacter tengcongensis
gk2156Geobacillus kaustophilus
SAV1414Staphylococcus aureus
OB0595Oceanobacillus iheyensis
SAG1624Streptococcus agalactiae
Figure 5 Maximum likelihood topologies of the Eta and Kin sequences used in this study. The trees are arbitrarily rooted with the Kincluster. The species and the locus tags of the corresponding genes are indicated. The brackets indicate the clusters of orthologs. Support ofnodes is indicated as in Figure 2.
Zúñiga et al. BMC Evolutionary Biology 2011, 11:34http://www.biomedcentral.com/1471-2148/11/34
Page 9 of 15
whether vertical inheritance could explain the phyloge-netic relationships of the OmpR/IIIA TCS.For this purpose, the nucleotide sequences of the
genes encoding the RR and HK of the Cro, Eta and Yycclusters were aligned resulting in datasets of 684 and1011 (RR and HK, respectively) sites for Cro, 678 and1041 for Eta, and, 693 and 1752 for Yyc. The GTR+G+I+F was identified as the best substitution model by jMo-delTest. Likelihood mapping showed limited phyloge-netic signal, especially in the RR datasets (70.4%, 76.5%and 72.9% resolved quartets for Cro, Eta and Yyc RRdatasets, respectively; 83%, 79.9% and 83.3% for the HKdatasets; Fig. S5 in additional file 3). The phylogeneticreconstructions of HKs and RRs (Figure 7) showed, inaccordance with the likelihood mapping results, thatonly a few nodes of the phylogenetic tree had supportvalues higher than 75%. Comparisons between bothtrees and the reference tree were evaluated with the Shi-modaira-Hasegawa test (SH; see Methods) to determinewhether the likelihood of the data associated to eachtree was significantly different at an alpha level of 0.05(a value above the threshold indicating a non-significantdifference).
The analysis of Cro sequences showed that the HKdataset rejected the topologies of the reference and theRR tree (p = 0.047 and p = 0.026, respectively) whereasthe RR dataset did not reject any of the two other topol-ogies (p = 0.317 and p = 0.18 for the reference tree andthe HK tree, respectively). This discrepancy could bepartly due to the low resolution of the trees. Therefore,a concatenated alignment of the HK and RR datasetswas built in order to increase the phylogenetic signal.The likelihood mapping of the concatenated alignment(Fig. S5 in additional file 2) showed an increase in thephylogenetic signal of the dataset (86.9% resolved quar-tets) compared to the HK and RR cognate datasets. Thephylogenetic reconstruction obtained with the concate-nated dataset was similar to that obtained with the HKdataset (although the positions of Lactobacillus brevis,Lactobacillus delbrueckii subsp. bulgaricus and Pediococ-cus pentosaceus changed; see Figure 7). The Shimodaira-Hasegawa test of the concatenated dataset showed thatthis dataset did not reject the reference, HK or RRtopologies (p = 0.089, p = 0.663 and p = 0.297, respec-tively). Considering that the concatenated alignmentincluded the phylogenetic signal of the HK and RR
Bil
bsuljolga
laclhe
ldblsa
lcalcilme
ooelslppelbr
lpllre
lfe
100
100
100
100
100
100
100
82
100
100
99
100
0.1
Cia
Cia
Cia
Bce
Bce
Bce
Kin
Kin
Kin
Kin
Kin
Ycl1
Ycl1
Ycl2
Pho
Pho
Eta
Eta
CroYyc
A
C
D
B
100
Figure 6 Distribution of the OmpR/IIIA clusters of orthologs identified in Lactobacillaceae in a reference phylogenetic tree. A-D indicatethe subgroups identified by Claesson et al. [28]. The brackets indicate the species harboring TCSs belonging to each of the clusters of orthologsidentified in Lactobacillaceae. Support of nodes is indicated as in Figure 2. bsu, Bacillus subtilis; lac, Lactobacillus acidophilus; lbr, Lactobacillusbrevis; lca, Lactobacillus casei; ldb, Lactobacillus delbrueckii; lfe, Lactobacillus fermentum; lga, Lactobacillus gasseri; lhe, Lactobacillus helveticus; ljo,Lactobacillus johnsonii; lpl, Lactobacillus plantarum; lre, Lactobacillus reuteri; lsa, Lactobacillus sakei; lsl, Lactobacillus salivarius; lci, Leuconostoccitreum; lme, Leuconostoc mesenteroides; ooe, Oenococcus oeni; ppe, Pediococcus pentosaceous.
Zúñiga et al. BMC Evolutionary Biology 2011, 11:34http://www.biomedcentral.com/1471-2148/11/34
Page 10 of 15

lcalsalsl
lpllci
lmeooe
lbrlfe
lreppe
ljolga
ldblhelac
987
978
819
999
1000
0.1
Yyc RRlca
lsalsl
ppelpl
lbrlfe
lrelcilme
ooeljolga
ldblhe
lac
998
1000
1000
865
947
1000
1000
994
974
0.1
lcalsl
ppelfe
lrelme
lcilbr
lpllsaljolga
ldblhe
lac
1000
993
811
1000
787
1000
0.2
Eta HKlca
lsalsl
ppelpl
lfelre
lbrlci
lmeljolga
ldblac
lhe
845
1000
928
1000
0.2
Eta RR
LcaLsa
LslPpe
LplLbr
LfeLre
LmeLci
OoeLjoLga
LdbLhe
Lac
967
949
767
1000
948
999
940
1000
0.2
Cro HKLca
LsaPpe
LplLbrLre
LfeLsl
LmeLci
OoeLga
LjoLdb
LacLhe
751
1000
907
872
0.2
Cro RRLca
LsaLsl
LbrLpl
PpeLfe
LreLmeLci
OoeLheLac
LdbLgaLjo
1000
970
1000
945
997
909
1000
0.2
1000
Cro concatenate
bsuljolga
laclhe
ldblsa
lcalcilme
ooelslppelbr
lpllre
lfe
100
100
100
100
100
100
100
82
100
100
99
100
0.1
100
Yyc HK
Reference tree
Figure 7 Maximum likelihood topologies of the Cro, Eta, Yyc and the concatenated reference sequences used in this study. The treesare arbitrarily rooted with the A subgroup of Lactobacillaceae species. Support of nodes is indicated as in Figure 2. Abbreviations of bacterialnames are used as indicated in Figure 6.
Zúñiga et al. BMC Evolutionary Biology 2011, 11:34http://www.biomedcentral.com/1471-2148/11/34
Page 11 of 15

datasets and that both topologies were not rejected bythe SH test, we concluded that both genes share thesame evolutionary history in Lactobacillaceae and, giventhat the reference topology was not rejected either, thatvertical inheritance can explain the evolution of thisTCS within this group.The analyses of the Eta datasets showed that the HK
dataset rejected the RR topology but not the referencetopology (p = 0.041 and p = 0.386, respectively). On thecontrary the RR dataset rejected both the referencetopology and the HK (p = 0.014 and p = 0.008). A moredetailed examination of the two topologies revealed thatgroup A in the reference tree (Figure 6) was also foundin the HK and RR trees for the Eta datasets, where itwas recovered with 100% bootstrap support (Figure 7).However, the relationships among the other threegroups changed quite dramatically. Group D stillappeared in the two trees, but it was no longer a sistergroup to group B for the HK sequences and it clusteredwithin them. This makes group B to be paraphyletic forHK. Furthermore, group C sequences did not group inthe HK tree and appeared at the base of a B/D clade. Asimilar case occurred for the RR tree, in which group Bwas paraphyletic due to the inclusion of group Csequences. Since the RR dataset rejected both the HKand the reference topologies, it can be hypothesized thatsome evolutionary events, apart from vertical inheri-tance, occurred during the evolutionary history of thiscluster. However, the possibility that these sequences donot hold enough phylogenetic signal for deriving theirtrue relationships cannot be ruled out and in order toderive reliable conclusions more sequences will benecessary.For Yyc sequences, the comparison of the HK dataset
with the RR and the reference tree showed that whereasthe topology of the RR tree was rejected (p = 0.000) thetopology of the reference tree was not significantly dif-ferent (p = 0.466). On the other hand, the RR datasetdid not reject the HK topology (p = 0.064) nor that ofthe reference tree (p = 0.111). Taking into account thelow resolution of the RR tree the results of these testsindicate that there are no significant differences betweenthe topologies obtained with the two datasets and thatthese topologies are not significantly different to thatobtained with the reference tree. We conclude thereforethat both genes share the same evolutionary history andthat vertical inheritance explains the phylogenetic rela-tionships between the different sequences.In summary, the analyses of the evolutionary history
of these three TCS in this bacterial group do not pro-vide evidence against a parallel evolution of the twogenes, with no signs of gene recruitment and a verticalsignal explaining their evolution. Therefore, and takinginto account the results obtained from the analysis of
the distribution of these systems, our results indicatethat Cro and Yyc systems (and possibly also Eta) werepresent in the last common ancestor of Lactobacillaceaeand have been conserved during the evolution of thisgroup.
ConclusionsThe phylogenetic analysis of the OmpR/IIIA systems inLactobacillaceae shows that no new TCS of this family hasrecently evolved in this group by either lineage-specificgene expansion or domain shuffling. Furthermore, noclear evidence for non-orthologous replacements of eitherRR or HK partners has been obtained. Therefore, ourresults strongly suggest that coevolution of cognate RRand HKs has been prevalent in Lactobacillaceae. Further-more, no evidence of recent HGT events has been foundfor the systems present in more than one species of thegroup. The detailed analysis of three systems present inmost strains used in this study indicates that verticalinheritance has been prevalent in the evolution of thesesystems. However, a different picture might emerge fromthe analysis of the other 6 TCS included in this work.Their non-universal distribution in the group of Lactoba-cillaceae species considered can be explained by differen-tial gains and/or losses, which at present cannot beresolved. For this purpose, more complete genomesequences of Lactobacillaceae strains and species arenecessary.The picture that emerges from the study of the
OmpR/IIIA TCS is that evolution of Lactobacillaceaefrom their last common ancestor and the adaptationprocess to the habitats that they currently occupy didnot require the development of new TCS from systemspreviously present. Instead, vertical inheritance of TCSpresent in the last common ancestor and lineage-specificgene losses appear as the main evolutionary forcesinvolved. Although HGT cannot be ruled out, it isworth mentioning that no evidence of recent HGTevents have been obtained. This view would agree withthe genomic analyses of Lactobacillales [29,47] whichshow that gene losses have been a major trend in theevolution of this group.
MethodsSequences, alignments and phylogenetic informationanalysisTCS-encoding genes corresponding to 19 completelysequence genomes of Lactobacillaceae/Leuconostocaceae(Table 1) were identified by using the tools provided bythe Microbial Genome Database for Comparative Analy-sis (MBGD; http://mbgd.genome.ad.jp/) [43]. Briefly, anorthology table of all genes present in the 19 genomeswas obtained using the clustering algorithm implemen-ted in MBGD. The orthology table was queried for
Zúñiga et al. BMC Evolutionary Biology 2011, 11:34http://www.biomedcentral.com/1471-2148/11/34
Page 12 of 15
response regulators and histidine kinases in order toretrieve the corresponding genes. The genes were con-firmed as RRs or HKs by checking the presence of typi-cal conserved domains. Due to the low similarity at thenucleotide level observed in both datasets, amino acidsequences were used for subsequent analyses. In orderto obtain additional sequences that might have beenbypassed in the first search, similarity searches were per-formed with BLASTP [48] with the genomic BLAST ser-vice provided by the National Center for BiotechnologyInformation (NCBI; http://www.ncbi.nlm.nih.gov/sutils/genom_table.cgi) against the 19 genomes using a repre-sentative sequence of each cluster of orthologs pre-viously identified. In order to obtain putative outgroupsequences for each cluster of orthologs identified, arepresentative sequence of each cluster was used toquery the non-redundant protein sequence database atthe NCBI using BLASTP. Sequences not belonging toLactobacillaceae that scored the lowest E-values wereselected and checked to belong to the same orthologygroup than the corresponding query sequence inMBGD. At least two sequences were used as putativeoutgroup sequences for each cluster of orthologs.Detailed information on the sequences used in theseanalyses is provided in additional file 1. Multiple align-ments were obtained with Muscle [49]. Gaps and posi-tions of doubtful homology were removed usingGblocks [50]. The final multiple alignments used for theanalyses are available in additional file 3.
Phylogenetic reconstructionIn order to obtain accurate phylogenies, the best fit modelof amino acid substitution was selected using ProtTest[51]. The AIC, which allows for a comparison of likeli-hoods from non-nested models, was adopted to select thebest models [52]. The phylogenetic signal contained in thedifferent data sets was assessed by likelihood mapping [53]using Tree-Puzzle 5.2 [54]. The models selected by Prot-Test were implemented in PhyML [55] to obtain maxi-mum likelihood trees for the different alignments.Bootstrap support values were obtained from 1,000 pseu-dorandom replicates. Congruence among topologies forTCS genes and/or the reference species tree (see below)was evaluated using Shimodaira-Hasegawa’s test [56]implemented in TreePuzzle 5.2 [54] and, when necessary,represented graphically using TreeMap [57].
Construction of a reference treeThe 141 core proteins identified by Claesson et al. [28]were used to obtain a reference phylogenetic tree for the19 strains considered in the analysis. The nucleotidesequences were retrieved from MBGD. The sequenceswere translated into amino acids, aligned with ClustalWand the corresponding nucleotide sequences realigned on
the basis of the amino acid alignment using MEGA 4 [58].Gaps and positions of doubtful homology were removedusing Gblocks [50] with default parameters. The resultingmultiple alignments were concatenated using the toolavailable in the Phylemon suite [59]. The best fit model ofnucleotide substitution was selected using jModelTest ver.0.1.1 [60] with the AIC criterion. The phylogenetic recon-struction by maximum likelihood was obtained withPhyML using the previously selected evolutionary model.
Additional material
Additional file 1: Supplementary tables. Supplementary Tables list thegenes encoding TCS identified in each of the 19 genomes included inthis study.
Additional file 2: Alignments. A zip file containing the alignments usedin this study in either FASTA or Phylip format. Details of the sequencesused in this study and the tags used to identify them in the alignmentfiles can be found in the files IIIA-seqs.doc and OmpR-seqs.doc (MSWord). A detailed list of the alignments can be found in the file readme.doc (MS Word).
Additional file 3: Supplementary figures. Fig. S1: likelihood mappinganalysis of OmpR and IIIA sequence alignments. Fig. S2: maximumlikelihood phylogenetic trees for OmpR and IIIA sequences. Fig. S3: Phogene clusters of Lactobacillaceae. Fig. S4: likelihood mapping analysis ofthe sequence alignments of Ycl1 and Ycl2, Pho and 872 RR and Eta andKin clusters. Fig. S5: likelihood mapping analysis of the sequencealignments of Cro, Eta and Yyc RR and HK encoding genes ofLactobacillaceae.
AcknowledgementsThis work was financed by funds of the AGL2007-60975/ALI, BFU2008-03000and Consolider Fun-C-Food CSD2007-00063 from the Spanish Ministry ofScience and Innovation and ACOMP/2009/240 and ACOMP/2010/148 fromConselleria d’Educació (Generalitat Valenciana).
Author details1Departamento de Biotecnología de Alimentos, Instituto de Agroquímica yTecnología de Alimentos, Consejo Superior de Investigaciones Científicas(CSIC), PO Box 73, 46100 Burjassot, Valencia, Spain. 2Instituto Cavanilles deBiodiversidad y Biología Evolutiva, Universidad de Valencia, Valencia, Spain.3Area de Genómica y Salud, Centro Superior de Investigación en SaludPública, Valencia. Spain.
Authors’ contributionsMZ conceived of the study, participated in the molecular phylogeneticanalyses, participated in design and coordination of the study and draftedthe manuscript. CLGE carried out the compilation of sequences andparticipated in the molecular phylogenetic analyses. FGC participated in thedesign of the study, supervised the molecular phylogenetic studies andhelped to draft the manuscript. All authors read and approved the finalmanuscript.
Received: 15 November 2010 Accepted: 1 February 2011Published: 1 February 2011
References1. Stock AM, Robinson VL, Goudreau PN: Two-component signal
transduction. Annu Rev Biochem 2000, 69:183-215.2. Stock JB, Ninfa AJ, Stock AM: Protein phosphorylation and regulation of
adaptive responses in bacteria. Microbiol Rev 1989, 53:450-490.3. Parkinson JS, Kofoid EC: Communication modules in bacterial signaling
proteins. Annu Rev Genet 1992, 26:71-112.4. Koretke KK, Lupas AN, Warren PV, Rosenberg M, Brown JR: Evolution of
two-component signal transduction. Mol Biol Evol 2000, 17:1956-1970.
Zúñiga et al. BMC Evolutionary Biology 2011, 11:34http://www.biomedcentral.com/1471-2148/11/34
Page 13 of 15

5. Zhang W, Shi L: Distribution and evolution of multiple-step phosphorelayin prokaryotes: lateral domain recruitment involved in the formation ofhybrid-type histidine kinases. Microbiology 2005, 151:2159-2173.
6. Appleby JL, Parkinson JS, Bourret RB: Signal transduction via the multi-step phosphorelay: not necessarily a road less traveled. Cell 1996,86:845-848.
7. Zhulin IB, Taylor BL, Dixon R: PAS domain S-boxes in archaea, bacteriaand sensors for oxygen and redox. Trends Biochem Sci 1997, 22:331-333.
8. Zhou Q, Ames P, Parkinson JS: Mutational analyses of HAMP helicessuggest a dynamic bundle model of input-output signalling inchemoreceptors. Mol Microbiol 2009, 73:801-814.
9. Gao R, Stock AM: Biological insights from structures of two-componentproteins. Annu Rev Microbiol 2009, 63:133-154.
10. Galperin MY: A census of membrane-bound and intracellular signaltransduction proteins in bacteria: bacterial IQ, extroverts and introverts.BMC Microbiol 2005, 5:35.
11. Ulrich LE, Koonin EV, Zhulin IB: One-component systems dominate signaltransduction in prokaryotes. Trends Microbiol 2005, 13:52-56.
12. Ulrich LE, Zhulin IB: MiST: a microbial signal transduction database.Nucleic Acids Res 2007, 35:D386-D390.
13. Barakat M, Ortet P, Jourlin-Castelli C, Ansaldi M, Mejean V, Whitworth DE:P2CS: a two-component system resource for prokaryotic signaltransduction research. BMC Genomics 2009, 10:315.
14. Grebe TW, Stock JB: The histidine protein kinase superfamily. Adv MicrobPhysiol 1999, 41:139-227.
15. Fabret C, Feher VA, Hoch JA: Two-component signal transduction inBacillus subtilis: how one organism sees its world. J Bacteriol 1999,181:1975-1983.
16. Kim D, Forst S: Genomic analysis of the histidine kinase family in bacteriaand archaea. Microbiology 2001, 147:1197-1212.
17. Galperin MY: Structural classification of bacterial response regulators:diversity of output domains and domain combinations. J Bacteriol 2006,188:4169-4182.
18. Whitworth DE, Cock PJ: Two-component systems of the myxobacteria:structure, diversity and evolutionary relationships. Microbiology 2008,154:360-372.
19. Whitworth DE, Cock PJ: Evolution of prokaryotic two-component systems:insights from comparative genomics. Amino Acids 2009, 37:459-466.
20. Pao GM, Saier MH Jr: Response regulators of bacterial signal transductionsystems: selective domain shuffling during evolution. J Mol Evol 1995,40:136-154.
21. Alm E, Huang K, Arkin A: The evolution of two-component systems inbacteria reveals different strategies for niche adaptation. PLoS ComputBiol 2006, 2:e143.
22. Qi M, Sun FJ, Caetano-Anolles G, Zhao Y: Comparative Genomic andPhylogenetic Analyses Reveal the Evolution of the Core Two-ComponentSignal Transduction Systems in Enterobacteria. J Mol Evol 2010.
23. Qian W, Han ZJ, He C: Two-component signal transduction systems ofXanthomonas spp.: a lesson from genomics. Mol Plant Microbe Interact2008, 21:151-161.
24. Chen YT, Chang HY, Lu CL, Peng HL: Evolutionary analysis of the two-component systems in Pseudomonas aeruginosa PAO1. J Mol Evol 2004,59:725-737.
25. Ashby MK, Houmard J: Cyanobacterial two-component proteins:structure, diversity, distribution, and evolution. Microbiol Mol Biol Rev2006, 70:472-509.
26. Dunne C, Murphy L, Flynn S, O’Mahony L, O’Halloran S, Feeney M,Morrissey D, Thornton G, Fitzgerald G, Daly C, et al: Probiotics: frommyth to reality. Demonstration of functionality in animal models ofdisease and in human clinical trials. Antonie Van Leeuwenhoek 1999,76:279-292.
27. Ouwehand AC, Salminen S, Isolauri E: Probiotics: an overview of beneficialeffects. Antonie Van Leeuwenhoek 2002, 82:279-289.
28. Claesson MJ, van Sinderen D, O’Toole PW: Lactobacillus phylogenomics–towards a reclassification of the genus. Int J Syst Evol Microbiol 2008,58:2945-2954.
29. Makarova KS, Koonin EV: Evolutionary genomics of lactic acid bacteria. JBacteriol 2007, 189:1199-1208.
30. Fujii T, Ingham C, Nakayama J, Beerthuyzen M, Kunuki R, Molenaar D,Sturme M, Vaughan E, Kleerebezem M, De Vos WM: Two homologous Agr-like quorum-sensing systems cooperatively control adherence, cell
morphology, and cell viability properties in Lactobacillus plantarumWCFS1. J Bacteriol 2008, 190:7655-7665.
31. Risoen PA, Havarstein LS, Diep DB, Nes IF: Identification of the DNA-binding sites for two response regulators involved in control ofbacteriocin synthesis in Lactobacillus plantarum C11. Mol Gen Genet 1998,259:224-232.
32. Sturme MH, Francke C, Siezen RJ, De Vos WM, Kleerebezem M: Makingsense of quorum sensing in lactobacilli: a special focus on Lactobacillusplantarum WCFS1. Microbiology 2007, 153:3939-3947.
33. Maldonado-Barragán A, Ruiz-Barba JL, Jiménez-Díaz R: Knockout of three-component regulatory systems reveals that the apparently constitutiveplantaricin-production phenotype shown by Lactobacillus plantarum onsolid medium is regulated via quorum sensing. Int J Food Microbiol 2009,130:35-42.
34. Morel-Deville F, Fauvel F, Morel P: Two-component signal-transducingsystems involved in stress responses and vancomycin susceptibility inLactobacillus sakei. Microbiology 1998, 144:2873-2883.
35. Pfeiler EA, Azcárate-Peril MA, Klaenhammer TR: Characterization of a novelbile-inducible operon encoding a two-component regulatory system inLactobacillus acidophilus. J Bacteriol 2007, 189:4624-4634.
36. Azcárate-Peril MA, McAuliffe O, Altermann E, Lick S, Russell WM,Klaenhammer TR: Microarray analysis of a two-component regulatorysystem involved in acid resistance and proteolytic activity inLactobacillus acidophilus. Appl Environ Microbiol 2005, 71:5794-5804.
37. Landete JM, García-Haro L, Blasco A, Manzanares P, Berbegal C,Monedero V, Zúñiga M: Requirement of the Lactobacillus casei MaeKRtwo-component system for L-malic acid utilization via a malic enzymepathway. Appl Environ Microbiol 2010, 76:84-95.
38. Taylor RK, Hall MN, Enquist L, Silhavy TJ: Identification of OmpR: a positiveregulatory protein controlling expression of the major outer membranematrix porin proteins of Escherichia coli K-12. J Bacteriol 1981,147:255-258.
39. Reuther J, Wohlleben W: Nitrogen metabolism in Streptomyces coelicolor:transcriptional and post-translational regulation. J Mol MicrobiolBiotechnol 2007, 12:139-146.
40. Hsieh YJ, Wanner BL: Global regulation by the seven-component Pisignaling system. Curr Opin Microbiol 2010, 13:198-203.
41. Hulett FM: The signal-transduction network for Pho regulation in Bacillussubtilis. Mol Microbiol 1996, 19:933-939.
42. Winkler ME, Hoch JA: Essentiality, bypass, and targeting of the YycFG(VicRK) two-component regulatory system in gram-positive bacteria. JBacteriol 2008, 190:2645-2648.
43. Uchiyama I: MBGD: a platform for microbial comparative genomicsbased on the automated construction of orthologous groups. Nucl AcidsRes 2007, 35:D343-D346.
44. Le SQ, Gascuel O: An improved general amino acid replacement matrix.Mol Biol Evol 2008, 25:1307-1320.
45. Jones DT, Taylor WR, Thornton JM: The rapid generation of mutation datamatrices from protein sequences. Comput Appl Biosci 1992, 8:275-282.
46. Lanave C, Preparata G, Saccone C, Serio G: A new method for calculatingevolutionary substitution rates. J Mol Evol 1984, 20:86-93.
47. Makarova K, Slesarev A, Wolf Y, Sorokin A, Mirkin B, Koonin E, Pavlov A,Pavlova N, Karamychev V, Polouchine N, et al: Comparative genomicsof the lactic acid bacteria. Proc Natl Acad Sci USA 2006,103:15611-15616.
48. Altschul SF, Gish W, Miller W, Myers EW, Lipman DJ: Basic local alignmentsearch tool. J Mol Biol 1990, 215:403-410.
49. Edgar RC: MUSCLE: multiple sequence alignment with high accuracy andhigh throughput. Nucleic Acids Res 2004, 32:1792-1797.
50. Castresana J: Selection of conserved blocks from multiple alignments fortheir use in phylogenetic analysis. Mol Biol Evol 2000, 17:540-552.
51. Abascal F, Zardoya R, Posada D: ProtTest: selection of best-fit models ofprotein evolution. Bioinformatics 2005, 21:2104-2105.
52. Akaike H: A new look at the statistical model identification. IEEE TransAutomat Contr 1974, AC-19:716-723.
53. Strimmer K, von Haeseler A: Likelihood-mapping: a simple method tovisualize phylogenetic content of a sequence alignment. Proc Natl AcadSci 1997, 94:6815-6819.
54. Schmidt HA, Strimmer K, Vingron M, von Haeseler A: TREE-PUZZLE:maximum likelihood phylogenetic analysis using quartets and parallelcomputing. Bioinformatics 2002, 18:502-504.
Zúñiga et al. BMC Evolutionary Biology 2011, 11:34http://www.biomedcentral.com/1471-2148/11/34
Page 14 of 15
55. Guindon S, Gascuel O: A simple, fast, and accurate algorithm to estimatelarge phylogenies by maximum likelihood. Syst Biol 2003, 52:696-704.
56. Shimodaira H, Hasegawa M: Multiple comparisons of log-likelihoods withapplications to phylogenetic inference. Mol Biol Evol 1999, 16:1114-1116.
57. Page RDM: Parallel Phylogenies - Reconstructing the History of Host-Parasite Assemblages. Cladistics-the International Journal of the Willi HennigSociety 1994, 10:155-173.
58. Tamura K, Dudley J, Nei M, Kumar S: MEGA4: Molecular EvolutionaryGenetics Analysis (MEGA) software version 4.0. Mol Biol Evol 2007,24:1596-1599.
59. Tárraga J, Medina I, Arbiza L, Huerta-Cepas J, Gabaldón T, Dopazo J,Dopazo H: Phylemon: a suite of web tools for molecular evolution,phylogenetics and phylogenomics. Nucleic Acids Res 2007, 35:W38-W42.
60. Posada D: jModelTest: phylogenetic model averaging. Mol Biol Evol 2008,25:1253-1256.
61. Gilliland SE, Speck ML, Morgan CG: Detection of Lactobacillus acidophilusin feces of humans, pigs, and chickens. Appl Microbiol 1975, 30:541-545.
62. Fred EB, Peterson WH, Davenport A: Acid fermentation of xylose. J BiolChem 1919, 39:347-383.
63. Mazé A, Boël G, Zúñiga M, Bourand A, Loup V, Yebra MJ, Monedero V,Korreia K, Jacques M, Beaufils S, et al: Complete genome sequence of theprobiotic Lactobacillus casei strain BL23. J Bacteriol 2010, 192(10):2647-8.
64. Morita H, Toh H, Fukuda S, Horikawa H, Oshima K, Suzuki T, Murakami M,Hisamatsu S, Kato Y, Takizawa T, et al: Comparative genome analysis ofLactobacillus reuteri and Lactobacillus fermentum reveal a genomic islandfor reuterin and cobalamin production. DNA Res 2008, 15:151-161.
65. Callanan M, Kaleta P, O’Callaghan J, O’Sullivan O, Jordan K, McAuliffe O,Sangrador-Vegas A, Slattery L, Fitzgerald GF, Beresford T, et al: Genomesequence of Lactobacillus helveticus, an organism distinguished byselective gene loss and insertion sequence element expansion. JBacteriol 2008, 190:727-735.
66. Pridmore RD, Berger B, Desiere F, Vilanova D, Barretto C, Pittet AC,Zwahlen MC, Rouvet M, Altermann E, Barrangou R, et al: The genomesequence of the probiotic intestinal bacterium Lactobacillus johnsoniiNCC 533. Proc Natl Acad Sci USA 2004, 101:2512-2517.
67. Kleerebezem M, Boekhorst J, van Kranenburg R, Molenaar D, Kuipers OP,Leer R, Tarchini R, Peters SA, Sandbrink HM, Fiers MW, et al: Completegenome sequence of Lactobacillus plantarum WCFS1. Proc Natl Acad SciUSA 2003, 100:1990-1995.
68. Lauret R, Morel-Deville F, Berthier F, Champomier-Vergès M, Postma P,Ehrlich SD, Zagorec M: Carbohydrate utilization in Lactobacillus sake. ApplEnviron Microbiol 1996, 62:1922-1927.
69. Claesson MJ, Li Y, Leahy S, Canchaya C, van Pijkeren JP, Cerdeño-Tárraga AM, Parkhill J, Flynn S, O’Sullivan GC, Collins JK, et al: Multireplicongenome architecture of Lactobacillus salivarius. Proc Natl Acad Sci USA2006, 103:6718-6723.
70. Kim JF, Jeong H, Lee JS, Choi SH, Ha M, Hur CG, Kim JS, Lee S, Park HS,Park YH, et al: Complete genome sequence of Leuconostoc citreum KM20.J Bacteriol 2008, 190:3093-3094.
71. Beelman RB, Gavin A, Keen RM: New strain of Leuconostoc oenos forinduced malo-lactic fermentation in Eastern wines. Am J Enol Vitic 1977,28:159-165.
72. Mundt JO, Beattie WG, Wieland FR: Pediococci residing on plants. JBacteriol 1969, 98:938-942.
doi:10.1186/1471-2148-11-34Cite this article as: Zúñiga et al.: Evolutionary history of the OmpR/IIIAfamily of signal transduction two component systems inLactobacillaceae and Leuconostocaceae. BMC Evolutionary Biology 201111:34.
Submit your next manuscript to BioMed Centraland take full advantage of:
• Convenient online submission
• Thorough peer review
• No space constraints or color figure charges
• Immediate publication on acceptance
• Inclusion in PubMed, CAS, Scopus and Google Scholar
• Research which is freely available for redistribution
Submit your manuscript at www.biomedcentral.com/submit
Zúñiga et al. BMC Evolutionary Biology 2011, 11:34http://www.biomedcentral.com/1471-2148/11/34
Page 15 of 15