EvolutionandtheGrowthProcess:NaturalSelectionof Entrepreneurial Traits · ·...
29
Evolution and the Growth Process: Natural Selection of Entrepreneurial Traits ∗ Oded Galor † Brown University Stelios Michalopoulos Tufts University and the Institute for Advanced Study, Princeton April 14, 2011 Abstract This research suggests that the evolution of entrepreneurial spirit played a significant role in the process of economic development and the dynamics of inequality within and across societies. The study argues that entrepreneurial spirit evolved non-monotonically in the course of human history. In early stages of development, risk-tolerant, growth promoting traits generated an evolutionary advantage and their increased representation accelerated the pace of technological progress and the process of economic development. In mature stages of development, however, risk-averse traits gained an evolutionary advantage, di- minishing the growth potential of advanced economies and contributing to convergence in economic growth across countries. Keywords: Risk Aversion, Growth, Technological Progress, Evolution, Natural Selection JEL classification Numbers: O11, O14, O33, O40, J11, J13. ∗ The authors wish to thank an associate editor, 3 referees, Peter Howitt, Ashley Lester, Ross Levine, Miles Kimball, Yona Rubinstein and seminar participants at the Max Planck Institute, Warwick University, Athens University of Economics and Business, Crete Conference, the Minerva - DEGIT XI conference and AEA Meetings for helpful discussions and useful comments. † Corresponding author. Department of Economics, Brown University, 64 Water- man St., Providence, RI 02912, USA. Phone: +401 863-2117, Fax: +401 863 1970. E-mail addresses: [email protected], [email protected] 0
Transcript of EvolutionandtheGrowthProcess:NaturalSelectionof Entrepreneurial Traits · ·...
Evolution and the Growth Process: Natural Selection of
Entrepreneurial Traits∗
Oded Galor†
Brown University
Stelios Michalopoulos
Tufts University and the Institute for Advanced Study, Princeton
April 14, 2011
Abstract
This research suggests that the evolution of entrepreneurial spirit played a significant
role in the process of economic development and the dynamics of inequality within and
across societies. The study argues that entrepreneurial spirit evolved non-monotonically in
the course of human history. In early stages of development, risk-tolerant, growth promoting
traits generated an evolutionary advantage and their increased representation accelerated
the pace of technological progress and the process of economic development. In mature
stages of development, however, risk-averse traits gained an evolutionary advantage, di-
minishing the growth potential of advanced economies and contributing to convergence in
economic growth across countries.
Keywords: Risk Aversion, Growth, Technological Progress, Evolution, Natural Selection
JEL classification Numbers: O11, O14, O33, O40, J11, J13.
∗The authors wish to thank an associate editor, 3 referees, Peter Howitt, Ashley Lester, Ross Levine, MilesKimball, Yona Rubinstein and seminar participants at the Max Planck Institute, Warwick University, Athens
University of Economics and Business, Crete Conference, the Minerva - DEGIT XI conference and AEA Meetings
for helpful discussions and useful comments.†Corresponding author. Department of Economics, Brown University, 64 Water-
man St., Providence, RI 02912, USA. Phone: +401 863-2117, Fax: +401 863 1970.
E-mail addresses: [email protected], [email protected]
0
1 Introduction
This research advances the hypothesis that the evolution of entrepreneurial spirit played a sig-
nificant role in the process of economic development and the time path of inequality within
and across societies. The theory suggests that the prevalence of entrepreneurial traits evolved
non-monotonically in the course of human history. In the early stages of development risk-
tolerant, growth promoting traits generated an evolutionary advantage and their increased
representation accelerated the pace of technological advancements, contributing significantly
to the process of development and the transition from stagnation to growth. As economies
matured, however, this evolutionary pattern was reversed. Risk-averse traits gained an evolu-
tionary advantage, diminishing the growth potential of advanced economies and contributing
to convergence in economic growth across countries.
Unlike the commonly emphasized forces for economic convergence (i.e., higher returns to
investments in human capital, physical capital, and technological adoption for laggard coun-
tries), the research proposes that a higher prevalence of growth-promoting entrepreneurial
traits in developing economies contributed to economic convergence. Historical variations in
geographical, institutional and cultural factors which affected the pace of this evolutionary
process and the prevalence of growth-promoting entrepreneurial traits across economies, con-
tributed to contemporary differences in productivity and income per-capita across countries.
The predictions of the proposed theory provide further understanding of the path of
income inequality within a society over time. The study suggests that as economies mature,
inequality subsides due to higher representation of entrepreneurial traits among lower income
individuals. In particular, this prediction is consistent with the class origin of entrepreneurs
during the industrial revolution. The failure of the landed aristocracy to lead the innovative
process of industrialization could be attributed to the low representation of growth promoting
entrepreneurial traits within the landed gentry, and their prevalence among the middle and the
lower classes.
This study develops an evolutionary growth theory that underlines the importance of the
evolution of entrepreneurial spirit in the transition from stagnation to growth. It constructs
an overlapping-generations economy that due to the forces of natural selection evolves endoge-
nously from a Malthusian epoch into a state of sustained economic growth. The growth process
is fueled by technological progress that is affected positively by the level of income per worker
as well as by the prevalence of entrepreneurial traits in the economy.1
1The theory is perfectly applicable to either social or genetic intergenerational transmission of entrepreneurial
traits. Allowing preferences to be transmitted both via vertical and horizontal transmission processes might affect
the speed of selection of entrepreneurial spirit in the process of development (Bisin and Verdier [4], Cavalli-Sforza
et al. [8], and Boyd et al. [7]).
1
The theory rests upon two fundamental building blocks. First, technological change is
affected positively by the frequency of risk-tolerant traits in the population. The intensity of
entrepreneurial spirit affects the contemporaneous production choices and advances the tech-
nological frontier available to subsequent generations.2 The second central building block is the
heritability of such traits across generations. Consistent with the supposition that entrepre-
neurial spirit is heritable, evidence described in section 1.2, suggests that the trait of “novelty
seeking” has been subjected to a selection process in the recent past. More generally, evidence
suggests that evolutionary processes in the composition of existing genetic traits may be rather
rapid, and major evolutionary changes have occurred in the human population over the time
period that is the focus of this study.3
Variations in entrepreneurial spirit among individuals are modeled as differences in the
degree of risk aversion with respect to consumption which in the proposed formulation also re-
flect differences in the elasticity of substitution between consumption and fertility. It captures
the sensitivity of individuals to changes in relative prices, reflecting their alertness to arbitrage
opportunities.4 Differences in the degree of risk aversion across individuals affect their repro-
ductive success and are transmitted across generations, either genetically or culturally. In early
stages of development risk aversion has an adverse effect on fertility and reproductive success,
raising the frequency of risk-tolerant, growth promoting traits in the economy and stimulat-
ing the growth process. However, as economies mature, risk aversion has a beneficial effect on
reproductive success, diminishing the growth potential of the economy.
The reversal in the evolutionary advantage of the risk-tolerant traits stems from the
effect of the level of income on the relative cost of consumption and child rearing. As the
economy progresses and income per capita increases, the opportunity cost of child rearing
(indexed to the level of income per capita) increases relative to consumption. At sufficiently
2The positive association between the frequency of the entrepreneurial individuals in the population and the
rate of technological growth is well documented in the literature, and is at the foundation of the Schumpeterian
viewpoint (e.g., Schumpeter [38], Aghion and Howitt [2]), where the role of entrepreneurs is instrumental in the
process of innovations.3Voight et al. [40] detected about 700 regions of the human genome where genes appear to have been reshaped
by natural selection within the last 5,000 to 15,000 years. Moreover, a study by Mekel-Bobrov [31] reports that
a variant of the gene ASPM (a specific regulator of brain size in the lineage leading to Homo sapiens) arose in
humans merely about 5800 years ago and has since swept to high frequency under strong positive selection. Other
notable evidence suggests that lactose tolerance was developed among European and Near Easterners since the
domestication of dairy animals in the course of the Neolithic revolution, whereas in regions that were exposed
to dairy animals in later stages, a larger proportion of the adult population suffers from lactose intolerance.
Furthermore, genetic immunity to malaria provided by the sickle cell trait is prevalent among descendents of
Africans whose engagement in agriculture improved the breeding ground for mosquitoes and thereby raised the
incidence of malaria, whereas this trait is absent among descendents of nearby populations that have not made
the transition to agriculture (Livingstone [28], Wiesenfeld [45] and Durham [14]).4There is large literature in economics that has historically linked entrepreneurial propensity to personal
traits. Hayek [23] and Kirzner [24], for example, have invariably stressed the importance of entrepreneurs’
responsiveness to incentives and changes in relative prices.
2
low levels of income the cost of children is lower relative to the cost of consumption. Risk-
tolerant individuals, whose choices are more responsive to the relative prices than risk-averse
individuals, optimally allocate more resources towards child rearing and the representation
of their type increases in the population over time. As the economy develops and income per
capita increases, the cost of raising children increases relative to the cost of consumption. Risk-
tolerant individuals optimally allocate more resources towards consumption and less towards
children and the prevalence of entrepreneurial spirit declines over time.
Interestingly, the forces of natural selection are critical for the escape from an epoch of
stagnation. In their absence the economy may remain indefinitely in a Malthusian equilib-
rium. Namely, if entrepreneurial traits are not hereditary and the distribution of types remains
unchanged over time, the level of income per worker may be stationary and fertility will be
at replacement level. Technological advancement will be counterbalanced by an increase in
population growth, whereas adverse technological shocks will be offset by population decline.
The predictions of the theory regarding the reversal in the evolutionary advantage of
entrepreneurial risk-tolerant individuals in more advanced stages of development could be ex-
amined based on the effect of the degree of risk aversion on fertility choices in contemporary
developed and less developed economies. Existing evidence is consistent with the proposed
hypothesis suggesting that risk tolerance is positively associated with the number of children
in less developed economies and negatively in developed economies.5
1.1 Related Literature
The transition from stagnation to growth and the associated phenomenon of the great diver-
gence have been the subject of intensive research in the growth literature in recent years.6 It has
been increasingly recognized that the understanding of the contemporary growth process would
be fragile and incomplete unless growth theory could be based on proper micro-foundations
that would reflect the various qualitative aspects of the growth process and their central driving
forces. Moreover, it has become apparent that a comprehensive understanding of the hurdles
faced by less developed economies in reaching a state of sustained economic growth would be
futile unless the factors that prompted the transition of the currently developed economies
into a state of sustained economic growth could be identified and their implications would be
modified to account for the differences in the growth structure of less developed economies in
an interdependent world.
The exploration of the interaction between human evolution and the process of economic
5See Finkelman and Finkelstein [15]; Miyata [32]; Dohmen et al. [13].6See e.g., Galor and Weil [19, 20], Galor and Moav [18], Galor [16], Hansen and Prescott [21] and Lucas [29].
3
development was pioneered by Galor and Moav [17].7 They advance the hypothesis that during
the Malthusian epoch, when the subsistence-consumption constraint affected the vast majority
of the population, the forces of natural selection operated relentlessly and the survival of the
fittest complemented the growth process, and contributed to the process of industrialization
and the transition of the world economy from stagnation to growth. In particular, they argue
that Neolithic revolution and the subsequent epoch of Malthusian stagnation triggered a se-
lection of traits of higher valuation for offspring quality, that played a significant role in the
process of industrialization and the demographic transition.8. The proposed theory highlights
an alternative channel via which the forces of natural selection may have contributed to the
transition from stagnation to growth, underlying the selection of entrepreneurial traits in the
process of development.
The implications of the proposed theory for the class origin of entrepreneurs during the
Industrial Revolution are complementary to those of Doepke and Zilibotti [11, 12]. Their the-
ory suggests that a new class of entrepreneurs rising from the middle classes, imbued with
ethics emphasizing patience and savings, proved most capable of profiting from new economic
opportunities, and eventually surpassed the pre-industrial elite. Similarly, the propose theory
suggests that the failure of the landed aristocracy to lead the innovative process of indus-
trialization could be attributed to the effect of natural selection on the lower prevalence of
entrepreneurial spirit among the landed gentry, and a higher prevalence among the middle and
the lower classes. Moreover, the existence of primogeniture in preindustrial Europe limited
social and income mobility between the landed gentry and the other classes Bertocchi [3], al-
lowing the forces of natural selection to differentially affect the evolution of entrepreneurial
spirit across classes, leading to the observed variations in the involvement of the upper and the
middle class in the Industrial Revolution.
7Lagerlöf [27] examines the interaction between the evolution of body size and the process of development
since the emergence of the Homo sapiens. Spolaore and Wacziarg [39] examine the effect of differences in human
characteristics that are transmitted across generations on the diffusion of development across countries over the
very long run. Other studies have abstracted from the reciprocal interaction between human evolution and the
process of development and have focused on the effect of the economic environment on the evolution of human
characteristics. Ofek [34] and Saint-Paul [37] examine the effect of the emergence of markets on the evolution of
heterogeneity in the human population. Galor and Moav [18] study the effect of the Neolithic Revolution and
the associated rise in population density on the evolution of life expectancy, and Borghans et al. [5] explore the
effect of human cooperation on the evolution of Major Histocompatibility Complex (MHC).8The evolution of preferences, in a given economic environment, has been explored in the economic literature,
as surveyed by Weibull [41] and Bowles [6], and is explored more recently by Weibull and Salomonsson [42].
Welch and Bernardo [43] establish that overconfident entrepreneurs are evolutionarily optimal in an environment
characterized by poor aggregation of information and herding behavior. Overconfident entrepreneurs provide a
positive information externality to the group they belong to by revealing their own information. Palacios-Huerta
and Santos [35] examine the effect of market incompleteness on the formation of risk aversion, demonstrating that
if the formation of lower risk aversion is costly market completeness and greater risk aversion are complements.
4
1.2 Genetic Evidence About the Evolution of Novelty Seeking
Evidence from twin studies strongly suggests that a substantial component of the observed
variation in degrees of novelty seeking — a trait closely associated with the notion of entrepre-
neurial spirit — may be attributed to genetic variation (Rodgers et al. [36] and Kohler et al.
[25]).9 In particular, the dopamine receptor D4 (D4DR) gene has been studied extensively in
the biological literature as a potential candidate for moderating novelty-seeking behavior. Al-
though the evidence is still inconclusive, a positive association between a certain polymorphism
in the D4DR (the 7R allele) and novelty-seeking behavior is most widely documented. Fur-
thermore, Ding et al. [10] studying a worldwide population sample, proposed that the 7R allele
originated as a rare mutational event about 40,000 years ago that increased to high frequency
in human populations by positive selection. To the extent that the 7R allele is associated with
novelty-seeking behavior, these findings are consistent with the basic prediction of the model.
At early stages of economic development risk-tolerant individuals have an evolutionary advan-
tage, and the introduction of such traits in an environment characterized by very low income
levels should have led to an appreciable increase in their representation in the population.
Moreover, complementary evidence suggests that entrepreneurial propensity is heredi-
tary. White et al. [44] examine empirically how entrepreneurial activity is associated with
a heritable biological trait, that of testosterone levels and they find that higher testosterone
levels are significantly associated with prior new venture start-up experience. Increased testos-
terone levels increase the probability of entrepreneurial activity both directly and indirectly via
the propensity towards risk. This finding coupled with studies from endocrinology (Meikle et
al. [30] and Harris et al.[22] ), which show that production of testosterone levels is heritable,
substantiate the assumption regarding a genetic heritability of entrepreneurial propensity.10
2 The Basic Structure of the Model
Consider an overlapping-generations economy in which economic activity extends over infinite
discrete time. In every period the economy produces a single homogeneous good using land
and labor as inputs in the production process. The supply of land is exogenous and fixed over
9Cloninger [9] proposed four genetically homogeneous and independent dimensions of personality: novelty
seeking, harm avoidance, reward dependence, and persistence that are hypothesized to be based on distinct
neurochemical and genetic substrates. As elaborated by Kose [26], “Individuals exhibiting high novelty seeking
are enthusiastic, curious, and are quick to engage with whatever is new and unfamiliar, which leads to exploration
of potential rewards. Furthermore, they get excited about new ideas and activities easily thus they may be
described as unconventional or innovative." Several studies have shown that a large component of the observed
variation in these behavioral traits can be attributed to genetic differences.10Nielsen et al. [33] find that within the group of genes that shows the strongest evidence for positive selection
in humans there are also genes that are involved in spermatogenesis that directly influence testosterone levels.
5
time whereas the supply of labor is determined by the size of the population.
2.1 Production of Final Output
Production occurs according to a constant-returns-to-scale technology that is subject to en-
dogenous technological progress. The aggregate output produced at time is:
= ()1− ; ∈ (0 1) (1)
where is the labor employed in period is the land used in production in every period,
is the average technological level in period and is therefore the “effective resources”
available during the period.
Suppose that there are no property rights over land.11 The return to land in every period
is therefore zero and output per worker produced at time is given by:
= [()] (2)
where () is the level of effective resources per worker in period .
2.2 Preferences and Constraints
In every period a generation that consists of a continuum of individuals of mass joins the
labor force. Each individual has a single parent. Members of generation (those who join the
labor force in period ) live for two periods. In the first period of life (childhood), individual
is economically idle. In the second period of life (parenthood) individual of generation is
endowed with 1 unit of time. The individual works and generates income,
Every generation consists of two types of individuals, 1 and 2, distinguished by the
degree of risk aversion with respect to consumption. Preferences are transmitted without
alteration from generation to generation within a dynasty either genetically or culturally. The
distribution of types within each period evolves over time due to the effect of natural selection
on the reproductive success of each type.
The utility function of individual in period is defined over consumption, and
11The modeling of the production side is based upon two simplifying assumptions. First, capital is not an
input in the production function, and second the return to land is zero. Alternatively it could have been assumed
that the economy is small and open to a world capital market in which the interest rate is constant. In this
case, the quantity of capital will equalize its marginal product to the interest rate, while the price of land will
follow a path such that the total return on land (rent plus net price appreciation) will be equal to the interest
rate. Allowing for capital accumulation and property rights over land would complicate the model to the point
of intractability, but would not affect the qualitative results.
6
children, in period 12
=
⎧⎪⎨⎪⎩ + ; 1 = 1
()1−
1− + ; 1, 1 = 2
(3)
where is the degree of risk aversion which also governs the elasticity of substitution. The
higher is the more risk-averse is type 2.13 Differences in the risk attitude are the only source
of heterogeneity within a generation and the distribution of types changes therefore due to the
effect of natural selection.
Individuals allocate their income, , between consumption, and expenditure on child
rearing. The cost of raising a child is assumed to be a fraction 12 of the level of output
per worker in the economy, .14 Hence, individual 0s budget constraint is
+ ≤ (4)
where is the cost of raising
children in period
2.3 Innovations
In each period individual can be engaged in either safe or risky production. Individual
can use a safe production mode in period that reflects the successful modes of production
of the previous period. Individual that operates under this safe production mode generates
income = [()] Alternatively, individual may choose to experiment with a risky
technology. If the experimentation is successful the individual will operate with a superior
production technology, and will generate a higher income
= [(
)]
However, if the experimentation is unsuccessful the individual will operate with an inferior
production technology, and will generate a lower income,
= [(
)]
Let be the probability of successful experimentation. Suppose that the expected return
associated with the risky production mode is equal to the one associated with the safe mode
of production. Namely,15
+ (1− )
= (5)
12For simplicity, the analysis abstracts from child mortality risk. Alternatively one can interpret the preferences
such that parents derive utility from the expected number of surviving offspring and the cost of child rearing is
associated only with surviving children.13The linearity of the utility function with respect to the number of children, reflects the fact that as shown
in Section 5 risk neutrality with respect to children is the trait that will be selected in the long-run. Moreover,allowing for 0 ≤ 1 will not effect the qualitative results. However, 0 1 will result in the undesirableextinction of the population in the long run, and = 1 will add an additional case to be considered without anyadditional insights.14Thus, the cost of child rearing is indexed to the income of the average person in each generation.15The assumption imposed on the returns to innovation is deliberately chosen to abstract from lifetime income
heterogeneity across types. Allowing for entrepreneurial activity to generate higher income, in an era in which
the latter is converted into larger number of surviving offspring, would accentuate the evolutionary advantage of
7
Individual will be engaged in the risky production mode as long as expected utility from
the risky production mode is at least as large as the utility from the safe one. Thus it follows
from (5) that risk-averse — type 2 — individuals will choose the safe mode of production, reflecting
the fact that the (non-compensated) variance of the expected income deters experimentation
with risky productive methods. Consequently, individuals of type 2 will generate income equal
to the average income in the economy in period , i.e.,
2 = (6)
Risk-neutral individuals — type 1 —, on the other hand, because of their constant marginal
utility with respect to consumption and fertility, undertake the risky production mode. Hence,
a fraction of the risk-neutral individuals will generate higher income than the risk-averse
type, whereas a fraction (1− ) will generate lower income. In particular,
1 =
⎧⎨⎩1 with probability
1 with probability 1−
(7)
It follows from (5) that the average income across the two types will be the same in
each period . Nevertheless, the engagement of the risk-neutral type in risky technological
innovations affects the technology that is available to the next generation. In particular, new
productive knowledge will be generated by a fraction of risk-neutral individuals and sub-
sequent generations reap the technological benefits of this experimentation. Thus, societies
dominated by risk-averse individuals are associated with lower degree of experimentation, pas-
sively transmitting the existing productive knowledge from one generation to the next.
2.4 Optimization
2.4.1 The Risk-Averse Type
The risk-averse type — type 2 — in generation chooses the number of children, and therefore his
own consumption, so as to maximize his utility function (3), subject to the budget constraint
(4). Namely:
2 =
((2 )
(1−)
1− + 2
) (8)
subject to:2 = (1− 2 ) ≥ 0;2 ≥ 0
the growth-promoting type. Moreover, as it will become apparent, in advanced stages of economic development
higher income would not have a positive effect on fertility for the risk-neutral type and thus the selection of
entrepreneurial traits would not be affected.
8
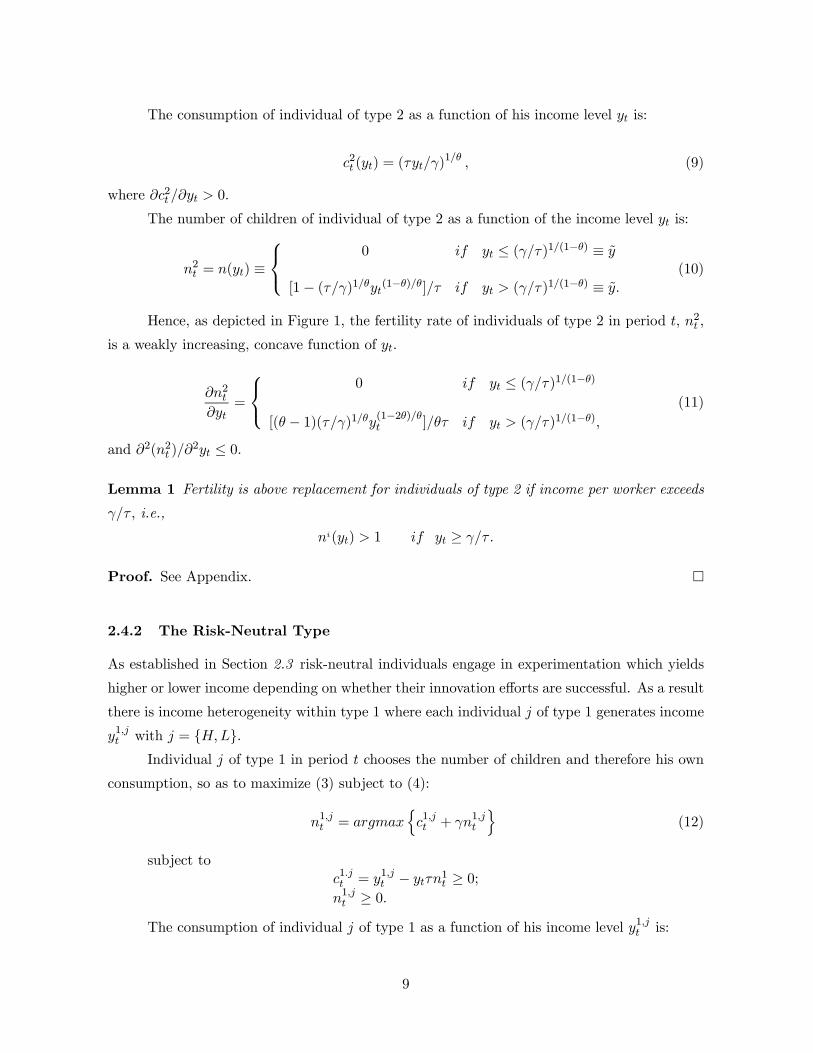
The consumption of individual of type 2 as a function of his income level is:
2 () = ()1 (9)
where 2 0.
The number of children of individual of type 2 as a function of the income level is:
2 = () ≡⎧⎨⎩
0 ≤ ()1(1−) ≡
[1− ()1(1−)] ()1(1−) ≡
(10)
Hence, as depicted in Figure 1, the fertility rate of individuals of type 2 in period , 2
is a weakly increasing, concave function of
2
=
⎧⎨⎩0 ≤ ()1(1−)
[( − 1)()1(1−2) ] ()1(1−)
(11)
and 2(2 )2 ≤ 0
Lemma 1 Fertility is above replacement for individuals of type 2 if income per worker exceeds
i.e.,
() 1 ≥
Proof. See Appendix. ¤
2.4.2 The Risk-Neutral Type
As established in Section 2.3 risk-neutral individuals engage in experimentation which yields
higher or lower income depending on whether their innovation efforts are successful. As a result
there is income heterogeneity within type 1 where each individual of type 1 generates income
1 with = .Individual of type 1 in period chooses the number of children and therefore his own
consumption, so as to maximize (3) subject to (4):
1 = n1 + 1
o(12)
subject to
1 = 1 − 1 ≥ 0;
1 ≥ 0The consumption of individual of type 1 as a function of his income level 1 is:
9
1 = (1 ; ) ≡
⎧⎨⎩0 if 0 ≤
1 if
(13)
where 1 1 ≥ 0The number of children of an individual of type 1 as a function of his income level 1
is:
1 = (1 ) ≡⎧⎨⎩ (1 ) if 0 ≤
0 if
(14)
The income expansion path is vertical as long as average income, , is less or equal than
and becomes horizontal at 1 = 0 above this threshold. At low stages of development,
when average income is sufficiently low (i.e., ) the relative cost of raising a child,
is lower than (i.e., the marginal rate of substitution between consumption and fertility) and
risk-neutral individuals allocate all resources to children. As the economy develops and average
income increases, the relative cost of raising a child increases. Thus, at sufficiently high stages
of development (i.e., ) the relative cost of raising a child, is higher than and
risk-neutral individuals allocate all resources towards own consumption.
The fertility rate of individual of type 1 in period , 1 is a non-negative, non-
decreasing function of the income, 1 In particular,
1
1
=
⎧⎨⎩1 if 0 ≤
0 if , (15)
and 21 21 = 0
3 The Process of Development
The process of development is governed by the time path of the level of technology, income per
worker and the composition of the risk attitudes in the population.
3.1 The Evolution in the Composition of Types
Suppose that at time 0 the economy consists of a continuum of individuals of mass of 0 where
represents the fraction of type 1 in the population.
In accordance with the historical pattern of fertility, income per worker is assumed to be
sufficiently high in every period, so as to assure that fertility rates are positive for both types
in the population. Hence in light of (10) it is assumed that income per-worker in period 0 is
10
sufficient to allow the risk-averse type to allocate positive resources towards child-rearing, i.e.
0
The evolution of the fraction of the risk-neutral traits in the population over time is
determined by the average fertility rates of the two types of individuals. As derived in (10),
since there is no income heterogeneity across individuals of type 2 fertility of each individual
of type 2 is 2 However, income and thus fertility decisions differ across successful and non-
successful individuals of type 1. In particular, the average fertility across individuals of type 1
in each period is:
1 = 1 + (1− )1 (16)
where 1 and 1 are given in (14).
Lemma 2 The average fertility of a risk-neutral individual — type 1 — in the process of devel-
opment is:
1 = 1 () ≡⎧⎨⎩1 0 ≤
0
Proof. Follows from (14) and (16). ¤The subsequent corollary follows from (10) and Lemma 2.
Corollary 1 For a given level of average income in period
1 () =
⎧⎨⎩ 2 () 0 ≤
2 ()
Hence, as depicted in Figure 1, in early stages of development (i.e., 0 ≤ )
the entrepreneurial types — type 1 — have an evolutionary advantage, whereas as soon as the
economy progresses sufficiently (i.e., ) the risk-averse individuals —type 2 — gain the
11
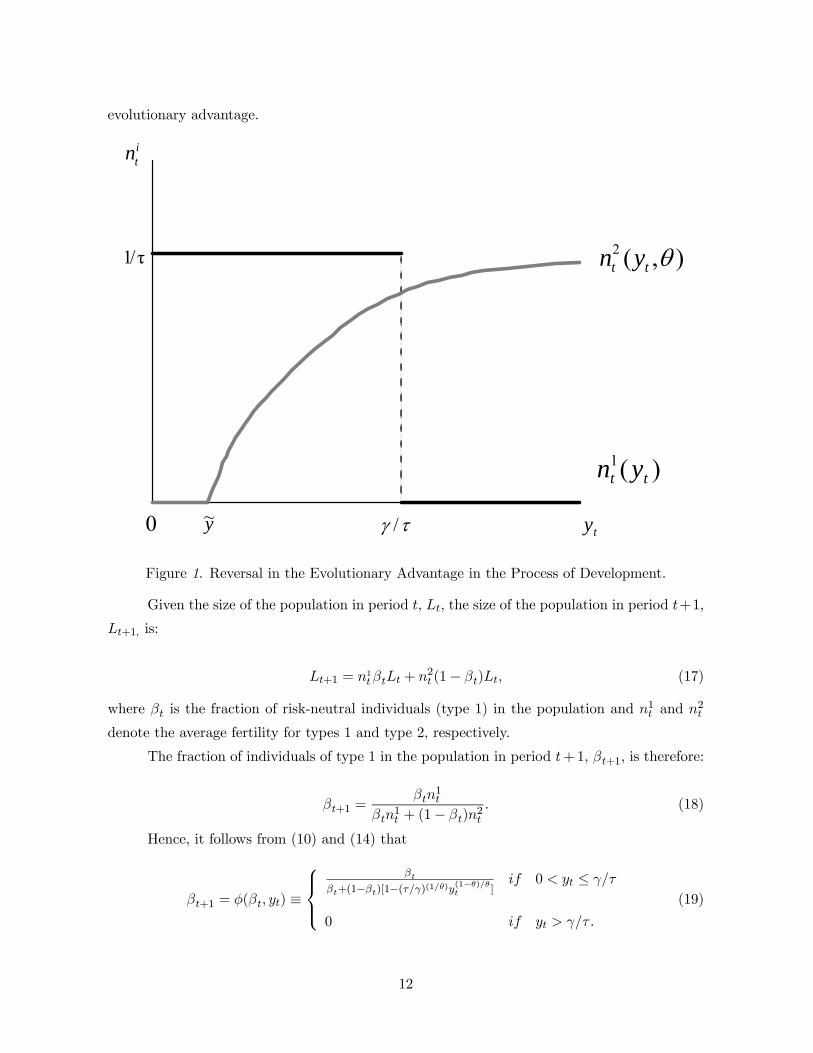
evolutionary advantage.
itn
ty0
τ/1
)(1 tt yn
),(2 tt yn
/y~
Figure 1. Reversal in the Evolutionary Advantage in the Process of Development.
Given the size of the population in period the size of the population in period +1
+1 is:
+1 = 1 + 2 (1− ) (17)
where is the fraction of risk-neutral individuals (type 1) in the population and 1 and 2
denote the average fertility for types 1 and type 2 respectively.
The fraction of individuals of type 1 in the population in period +1 +1 is therefore:
+1 =
1
1 + (1− )
2
(18)
Hence, it follows from (10) and (14) that
+1 = ( ) ≡
⎧⎪⎨⎪⎩
+(1−)[1−()(1)(1−) ] 0 ≤
0
(19)
12
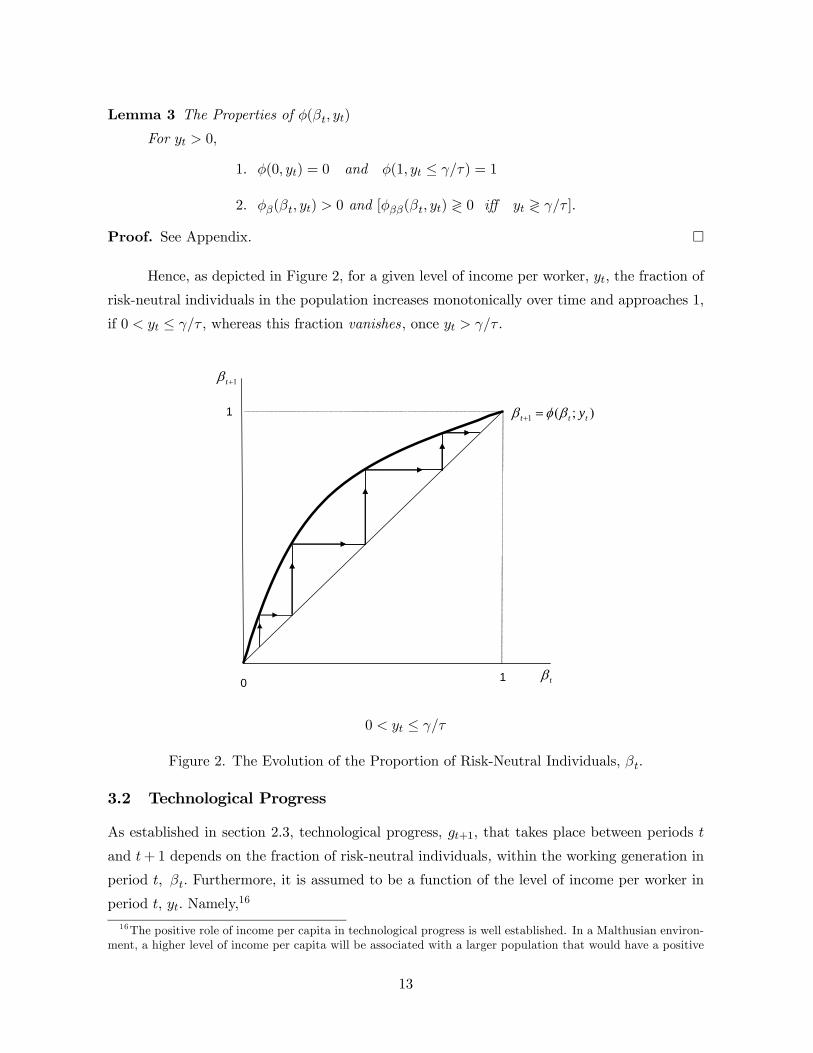
Lemma 3 The Properties of ( )
For 0
1 (0 ) = 0 and (1 ≤ ) = 1
2 ( ) 0 and [( ) ≷ 0 iff ≷ ]
Proof. See Appendix. ¤
Hence, as depicted in Figure 2, for a given level of income per worker, the fraction of
risk-neutral individuals in the population increases monotonically over time and approaches 1
if 0 ≤ whereas this fraction vanishes once
0 1
);(1 ttt y
t
1t
1
0 ≤
Figure 2. The Evolution of the Proportion of Risk-Neutral Individuals,
3.2 Technological Progress
As established in section 2.3, technological progress, +1 that takes place between periods
and + 1 depends on the fraction of risk-neutral individuals, within the working generation in
period Furthermore, it is assumed to be a function of the level of income per worker in
period , Namely,16
16The positive role of income per capita in technological progress is well established. In a Malthusian environ-
ment, a higher level of income per capita will be associated with a larger population that would have a positive
13
+1 ≡ +1 −
= ( ) (20)
Suppose the rate of technological progress between period and + 1 is a (weakly)
positive, (weakly) increasing, concave function of the fraction of entrepreneurial individuals
among the working generation at time and the level of income per-worker, i.e.,
( ) ≥ 0 and ( ) ≤ 0 ∀ ∈ [0 1] and ∀ 0( ) ≥ 0 and
( ) ≤ 0 ∀ ∈ [0 1) and ∀ 0 ((A1))
The time path of the level of technology is given therefore by:
+1 = (1 + +1) (21)
where the level of technology at time 0 is given at a level 0
3.3 The Time Path of Income Per Worker
As follows from (2), (17), (20) and (21) income per worker in period + 1 is:
+1 =
µ+1
+1
¶
=
µ
¶µ [1 + ( )]
1 + (1− )
2
¶
(22)
Thus,
+1 =
µ[1 + ( )]
1 + (1− )
2 )
¶
(23)
Hence, it follows from (21) that the income per worker in period + 1 is determined by
the level of income per worker in period and the fraction of entrepreneurial individuals in
the adult population,
+1 = ( ) (24)
where
( ) ≡
⎧⎪⎪⎪⎪⎨⎪⎪⎪⎪⎩
∙[1+()]
+(1−)[1−()1(1−) ]
¸ 0 ≤
∙[1+(0)]
[1−()1(1−) ]
¸
(25)
An increase in the fraction of the entrepreneurial individuals, has unambiguously
positive effects on the level of income per worker in period +1 +1 = (+1+1) in an
environment where risk neutrality is conducive to individuals reproducing at lower rates, (i.e.,
effect on the supply, the demand and the diffusion of knowledge. Moreover, it will foster specialization and trade
and will therefore enhance technological progress. In the industrial world higher income per capita will support
a more educated population that is more likely to implement new technologies, and will generate a wider tax
base that would permit extensive investment in infrastructure, education and research.
14
when ) It raises the level of technology in period + 1 and reduces the population
growth rate between periods and +1. However, when ≤ and thus the entrepreneurial
type reproduces at a higher rate, an increase in the fraction of these individuals (type 1) in
period has an ambiguous effect on output per-worker in + 1 since it has a positive effect on
both the level of technology and population in period + 1
An increase in output per worker, has ambiguous effects on the level of income per
worker in period +1 On the one hand, it increases the level of technology in the next period,
+1 positively affecting output per worker, but on the other hand, it increases fertility rates
in period and thus the size of the population in period + 1 adversely affecting income per
worker.
4 The Dynamical System
The evolution of the economy is fully determined by the evolution of the fraction of risk-neutral
individuals, and the level of output per worker, It is given by the sequence ∞=0that is governed by the two-dimensional non-linear discrete dynamical system:
+1 = ( )
+1 = ( )(26)
where (0 0) is given.
The analysis of this two-dimensional dynamical system will require the derivation of its
phase diagram, based on the characterization of the locus under which is in a steady-
state, the locus under which is in a steady-state, and the forces that operate on the system
when the variables are not in a steady-state equilibrium.
4.1 The locus
The locus is the geometric locus of all pairs ( ) such that is in a steady state.
≡ ( ) : +1 − = 0
As follows from (19), along the locus
( )− = 0 (27)
Lemma 4 The properties of the locus:
+1 −
⎧⎨⎩ 0 0 ≤ & (0 1)= 0 [ = 0] or [ = 1 & ≤ ] 0 & (0 1]
15
Proof : As follows from (18)
+1 − =(1− )[
1()− 2()]
1() + (1− )
2()
Hence, as follows from Corollary 1:
+1−
⎧⎪⎪⎪⎪⎨⎪⎪⎪⎪⎩ 0 1() 2()
0 ≤ & (0 1)
= 0 [ = 0] or [ = 1 & ≤ ]
0 1() 2() & (0 1]
¤As depicted in Figure 3, the fraction of risk-neutral individuals, is in a steady state
if:
() = 0 i.e., there are only individuals of type 2 in the population and thus there are
only individuals of type 2 in all future periods.
() = 1 i.e., there are only individuals of type 1 in the population and average income
in the population is less than .
4.2 The Replacement Locus - yy
The replacement frontier , as depicted in Figure 3, is the geometric locus of all pairs ( )
such that the average level of fertility is at replacement level, i.e.,
≡ ( ) : 1() + (1− )2() = 1 (28)
Lemma 5 The properties of the replacement locus - yy
1. There exists a continuous single-valued function, () such that given ( ()) the
average fertility level is at replacement, i.e.,
( ()) ∈ ∀ ∈ [0 ]
where
() =
() ∀ ∈ [0 ]
16
2. The level of income that corresponds to replacement fertility, () is monotonically
decreasing in the fraction of entrepreneurial individuals, i.e.,
()
¯
0 ∀ ∈ [0 ]
3. The average level of fertility is below replacement if and only if () and above
replacement if and only if () i.e.,
1() + (1− )
2() 1 ()1() + (1− )2() 1 ()
Proof. See Appendix. ¤
The replacement locus, depicted in Figure 3, is downward sloping.17 As established
in Corollary 1, for an income below as the fraction of the risk-neutral individuals,
increases, fertility increases and thus the level of income that is needed to support replacement
fertility, () is lower.
4.3 The locus
The locus is the geometric locus of all pairs ( ) such that is in a steady state,
≡ ( ) : +1 − = 0
As follows from (23) and (25), along the locus
( )− =
∙µ(1 + ( ))
1() + (1− )2()
¶
− 1¸= 0 (29)
Hence,
+1 − R 0⇔ 1 + ( ) R [1() + (1− )2()] (30)
In order to simplify the exposition and to assure that the economy may escape from the
Malthusian trap, few boundary conditions are imposed on the function ( )
( ) 1()− 2() ∈ (0 ] if and only if ∈ [0 ];
( ) 1 ()
+ (1− )2 ()
if and only if ∈ (0 ];
( ) =
⎧⎨⎩= 0
0if and only if
≤ ()
()
((A2))
where ∈ (0 ) and = () ∈ (() )
17Without loss of generality, Figure 3 is drawn under the assumption that the locus is convex. Note,
however that as long as the locus is downward sloping the qualitative analysis remains intact.
17

Lemma 6 The properties of the locus.
Under (A1) and (A2)
1. There exists a continuous single-valued function, () such that
( ()) ∈ ∀ ∈ [0 ]
2. There exists a decreasing continuous, single-valued function () ∈ (() ) suchthat
( ()) ∈ and 0() 0 ∀ ∈ [0 )
where lim→() = (), (0) ∈ ( ), and ∈ [ )
3.
+1 −
⎧⎨⎩ 0 () () and ∈ [0 )
0
Proof. See Appendix. ¤
The locus is depicted in Figure 3. The locus consists of two downward sloping
segments: (i) the replacement locus, and (ii) a single valued function () that intersects
the locus at and the locus at (0 (0))
4.4 Steady-State Equilibria
Steady-state equilibria of the dynamical system are pairs ( ) such that:
= ( ) = ( )
Hence a steady-state equilibrium is characterized by an intersection of the locus and the
locus. As depicted in Figure 3, the system is characterized by two steady-state equilibria.
Lemma 7 The dynamical system has two steady-state equilibria:
( ) = (0 (0)) (0 (0))
The steady-state equilibria: (0 (0)) is unstable, whereas (0 (0)) is a saddle, where
lim→∞( ) = (0
(0)) if and only if 0 = 0 & (0)
Proof. The lemma follows from the properties of the locus and the locus as established
in Lemmas 4 and 6, and as depicted in Figure 3. ¤
18
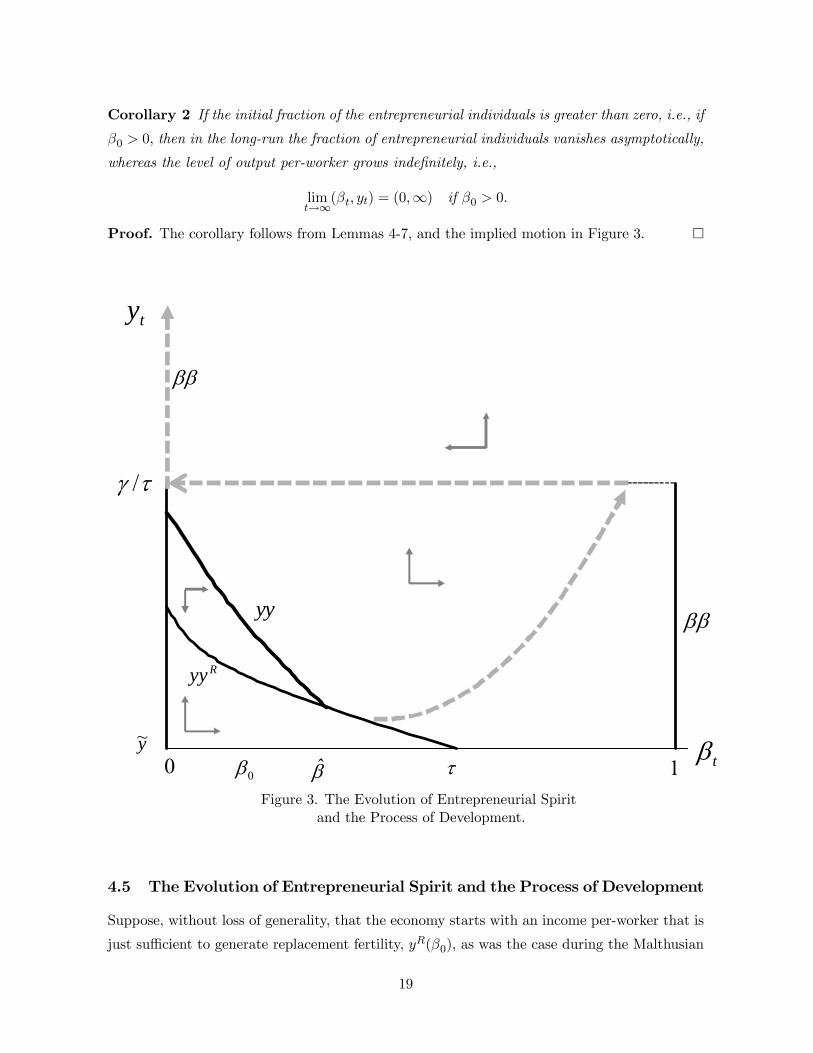
Corollary 2 If the initial fraction of the entrepreneurial individuals is greater than zero, i.e., if
0 0 then in the long-run the fraction of entrepreneurial individuals vanishes asymptotically,
whereas the level of output per-worker grows indefinitely, i.e.,
lim→∞( ) = (0∞) if 0 0
Proof. The corollary follows from Lemmas 4-7, and the implied motion in Figure 3. ¤
y~
/
t0
yy
10
ty
Ryy
Figure 3. The Evolution of Entrepreneurial Spiritand the Process of Development.
4.5 The Evolution of Entrepreneurial Spirit and the Process of Development
Suppose, without loss of generality, that the economy starts with an income per-worker that is
just sufficient to generate replacement fertility, (0) as was the case during the Malthusian
19
epoch. That is, the economy starts on the locus. Suppose further that there is a small
fraction of risk-neutral individuals in the economy, 0 . As depicted in Figure 3, the forces
of natural selection will increase the representation of these risk-neutral growth promoting
individual in society, and once this fraction will exceed the critical level income will increase
monotonically along with the fraction of the risk-neutral entrepreneurial traits. Once the level of
income per-worker increases above the threshold level of income the evolutionary advantage
is reversed. Risk-averse individuals generate an evolutionary advantage and vanishes to 0
It should be noted that in the absence of the forces of natural selection the economy
will remain indefinitely in a Malthusian equilibrium. That is, if entrepreneurial traits are not
hereditary and the distribution of types remains unchanged over time, the level of income per
worker will remain at a level (0) where fertility is at replacement. This will constitute a
stable Malthusian equilibrium.
5 Robustness
5.1 Variations in the Risk Attitude Towards Children
This section demonstrates that risk neutrality with respect to children is the type of behavior
that would be selected in populations that have been expanding over time, and thus the utility
function that is adopted in the main analysis is the appropriate one.
Suppose that preferences of individuals are represented by a utility function with con-
stant relative risk aversion with respect to consumption, and (heterogeneous) risk attitudes
with respect to children,
=()
1−
1− +
¡¢1−
1− ; ≥ 0 (31)
Members of generation choose the number of children, and therefore own consumption
to maximize the utility function (31) subject to the budget constraint. Thus, the optimization
problem of a member of generation is:
=
(()
1−
1− +
¡¢1−
1−
) (32)
Subject to:
= (1− ) ≥ 0 ≥ 0
The solution of the optimization problem is interior. It is given by the implicit function:
z¡
¢=
¡¢− − [(1− )]
− ≡ 0 (33)
20
As established in the following Lemma, as long as fertility rates are above replacement
the more risk tolerant type in terms of children has the evolutionary advantage. If fertility
rates are below replacement (and the population therefore vanishes over time), the type that
is more risk-averse with respect to children gains an evolutionary advantage.
Lemma 8 The effect of risk aversion with respect to fertility on reproductive success is negative
as long as fertility is above replacement and is positive as long as fertility is below replacement.
⎧⎪⎪⎪⎪⎨⎪⎪⎪⎪⎩ 0 iff
© 1
= 0 iff© = 1
0 iff© 1
Proof. Using the Implicit Function Theorem, it follows from (33) that:
= −z¡
¢
z¡
¢
= − − ¡¢− ln− ¡¢−−1 − ()
2 [¡1−
¢]−−1
(34)
where,z()
½ 0 1 0 1
z()
0
(35)
Hence,
∙
¸=
"z
¡
¢
#½ 0 1 0 1
(36)
Hence the lemma follows from (36). ¤
Since the human population has not become extinct, fertility has not been below re-
placement and the distribution of risk attitudes with respect to children will converge towards
risk-neutrality in the long-run.18
Corollary 3 Risk neutrality with respect to children, i.e., = 0 will be selected in the long-
run.
Hence, risk neutrality with respect to children, = 0 that was imposed on our utility
function in the main part of the paper, is the trait that will be selected in the long-run.
18Segments of the human population that have been shrinking over time, but have not become extinct, would
compose of more risk averse individuals with respect to fertility.
21
6 Concluding Remarks
This research suggests that a Darwinian evolution of entrepreneurial spirit played a signifi-
cant role in the process of economic development and the evolution of inequality within and
across societies. The study argues that entrepreneurial spirit evolved non-monotonically in the
course of human history. In early stages of development, risk-tolerant, growth promoting traits
generated an evolutionary advantage and their increased representation accelerated the pace
of technological advancements and the process of economic development. In mature stages of
development, however, risk-averse individuals gained an evolutionary advantage diminishing
the growth potential of advanced economies.
The research identifies a novel force that operates towards a convergence of developing
economies to the richer ones. Unlike the commonly underlined forces of economic convergence,
the research suggests that convergence is triggered by the higher prevalence of individuals with
entrepreneurial traits in lower income economies.
The prediction of the theory regarding the evolution of inequality and entrepreneurial
activities within a society is consistent with the pattern observed in England during the course
of the Industrial Revolution. In particular the theory suggests that the failure of the landed
aristocracy to lead the innovative process of industrialization could be attributed to the low
representation of entrepreneurial individuals within this group, and the prevalence of individuals
with entrepreneurial traits among the middle and the lower classes. The rise in inequality that
characterized the early stages of the Industrial Revolution was therefore reversed and inequality
started to decline.
Country-specific characteristics that have affected the intensity of the pivotal interaction
between the rate of technological progress and the composition of the entrepreneurial traits
within the population have generated variations in the transition from stagnation to growth and
contributed to the disparity in income per capita across countries. Variations in institutional
and cultural characteristics across societies may affect the evolutionary process stimulating
the pace of the transition from stagnation to growth (Acemoglu et al. [1]). In particular:
(a) The level of protection of intellectual property rights may have an ambiguous effect on
entrepreneurial activities, reflecting the trade-off between the positive effect of intellectual
property rights on the incentive to innovate and its adverse effect on the proliferation of existing
knowledge. (b) The stock of knowledge in a society and its rate of creation and diffusion may
create a platform on which faster technological innovations can emerge. (c) The composition
of cultural and religious groups in a society and their attitude toward knowledge creation and
diffusion may affect the incentives to innovate. (d) The composition of interest groups in society
may affect the incentives to block or promote technological innovation.
22
7 Appendix
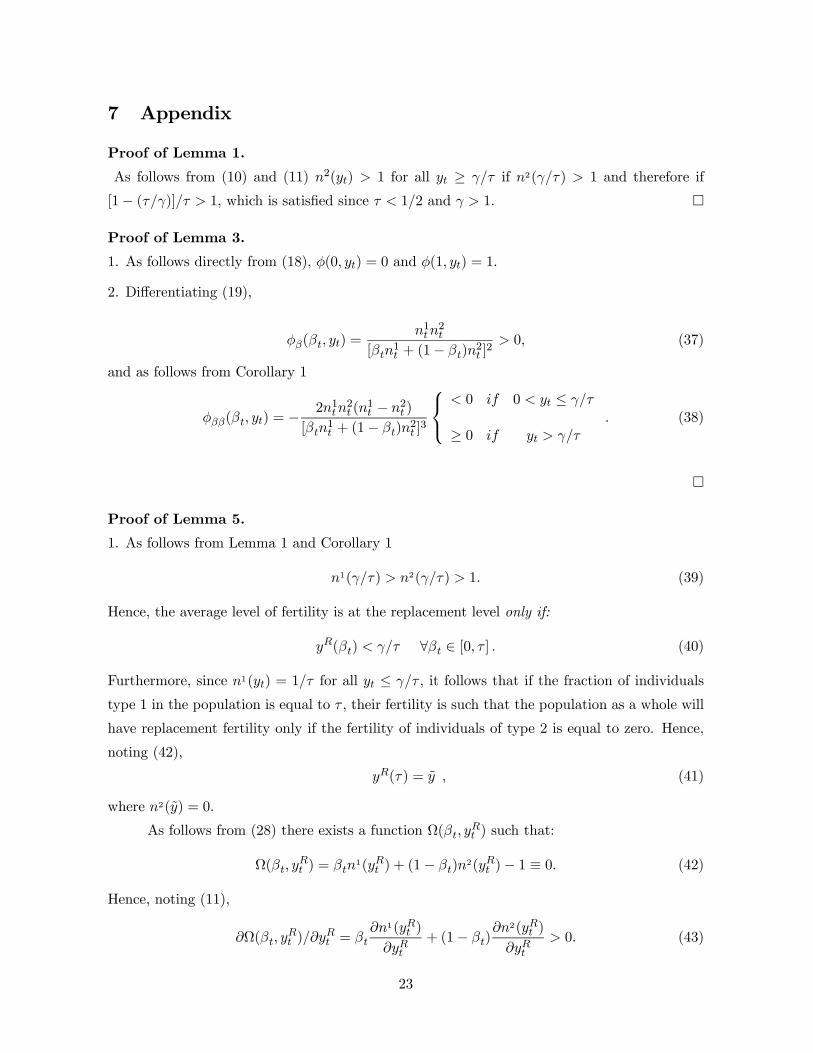
Proof of Lemma 1.
As follows from (10) and (11) 2() 1 for all ≥ if 2() 1 and therefore if
[1− ()] 1 which is satisfied since 12 and 1. ¤
Proof of Lemma 3.
1. As follows directly from (18), (0 ) = 0 and (1 ) = 1
2. Differentiating (19),
( ) =1
2
[1 + (1− )
2 ]2 0 (37)
and as follows from Corollary 1
( ) = −21
2 (
1 − 2 )
[1 + (1− )
2 ]3
⎧⎨⎩ 0 0 ≤
≥ 0 (38)
¤
Proof of Lemma 5.
1. As follows from Lemma 1 and Corollary 1
1() 2() 1 (39)
Hence, the average level of fertility is at the replacement level only if:
() ∀ ∈ [0 ] (40)
Furthermore, since 1() = 1 for all ≤ it follows that if the fraction of individuals
type 1 in the population is equal to , their fertility is such that the population as a whole will
have replacement fertility only if the fertility of individuals of type 2 is equal to zero. Hence,
noting (42),
() = (41)
where 2() = 0
As follows from (28) there exists a function Ω( ) such that:
Ω( ) =
1( ) + (1− )2( )− 1 ≡ 0 (42)
Hence, noting (11),
Ω( )
=
1( )
+ (1− )
2( )
0 (43)
23
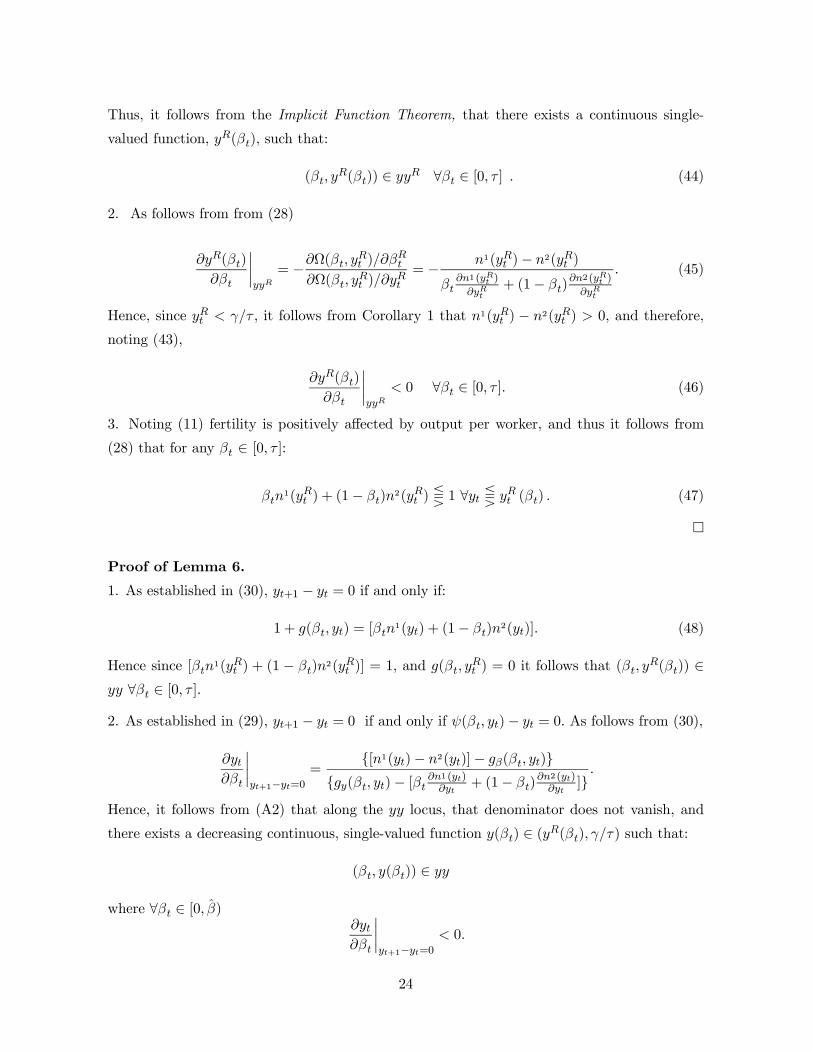
Thus, it follows from the Implicit Function Theorem, that there exists a continuous single-
valued function, () such that:
( ()) ∈ ∀ ∈ [0 ] (44)
2. As follows from from (28)
()
¯
= −Ω( )
Ω( )
= − 1( )− 2( )
1 ( )
+ (1− )
2( )
(45)
Hence, since it follows from Corollary 1 that 1( ) − 2( ) 0 and therefore,
noting (43),
()
¯
0 ∀ ∈ [0 ] (46)
3. Noting (11) fertility is positively affected by output per worker, and thus it follows from
(28) that for any ∈ [0 ]:
1( ) + (1− )
2( ) S 1 ∀ S () . (47)
¤
Proof of Lemma 6.
1. As established in (30), +1 − = 0 if and only if:
1 + ( ) = [1() + (1− )
2()] (48)
Hence since [1( ) + (1 − )
2( )] = 1 and ( ) = 0 it follows that (
()) ∈ ∀ ∈ [0 ]2. As established in (29), +1 − = 0 if and only if ( )− = 0 As follows from (30),
¯+1−=0
=[1()− 2()]− ( )
( )− [ 1 ()+ (1− )
2 ()
]
Hence, it follows from (A2) that along the locus, that denominator does not vanish, and
there exists a decreasing continuous, single-valued function () ∈ (() ) such that:
( ()) ∈
where ∀ ∈ [0 )
¯+1−=0
0.
24
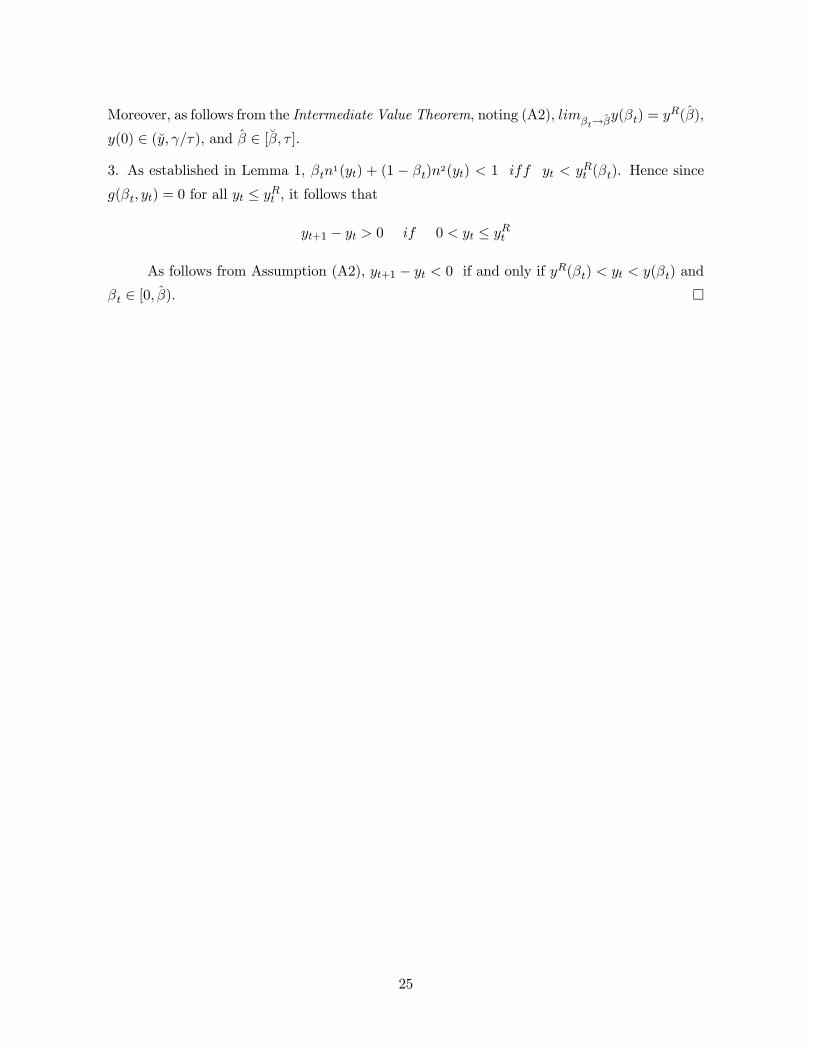
Moreover, as follows from the Intermediate Value Theorem, noting (A2), →() = (),
(0) ∈ ( ), and ∈ [ ]
3. As established in Lemma 1, 1() + (1 − )2() 1 (). Hence since
( ) = 0 for all ≤ it follows that
+1 − 0 0 ≤
As follows from Assumption (A2), +1 − 0 if and only if () () and
∈ [0 ) ¤
25
References
[1] D. Acemoglu, D., S. Johnson, J. A. Robinson, Institutions as a Fundamental Cause ofLong-Run Growth, in: Handbook of Economic Growth, Ed. by P. Aghion, S. N. Durlauf,Elsevier North-Holland, Amsterdam, The Netherlands, 2005, pp. 109—139.
[2] P. Aghion, P. Howitt, A model of growth through creative destruction, Econometrica 60(1992) 323-351.
[3] G. Bertocchi, The law of primogeniture and the transition from landed aristocracy toindustrial democracy, J. of Econ. Growth 11 (2006) 41—68.
[4] A. Bisin, T. Verdier, Beyond the melting pot: cultural transmission, marriage, and theevolution of ethnic and religious traits, Quart. J. of Econ. 115 (2000) 955—988.
[5] J. Borghans, L. Borghans, B. ter Weel, Is there a link between economic outcomes andgenetic evolution? Cross-country evidence from the major histocompatibility complex,Working Paper, Department of Economics, Maastricht University, 2005.
[6] S. Bowles, Endogenous preferences: the cultural consequences of markets and other eco-nomic institutions, J. of Econ. Lit. 36 (1998) 75—111.
[7] R. Boyd, P. J. Richerson, Culture and the Evolutionary Process, University of ChicagoPress, Chicago, IL, 1985.
[8] L. L. Cavalli-Sforza, M. W. Feldman, Cultural Transmission and Evolution: A Quantita-tive Approach, Princeton University Press, Princeton, NJ, 1981.
[9] C. R. Cloninger, A systematic method for clinical description and classification of person-ality variants: a proposal, Arch. of Gen. Psych. 44 (1987) 573—588.
[10] Y.-C. Ding, H.-C. Chi, D. L. Grady, A. Morishima, J. R. Kidd, K. K. Kidd, M. A. S.Pamela Flodman, S. Schuck, J. M. Swanson, Y.-P. Zhang, and R. K. Moyzis, Evidence ofpositive selection acting at the human dopamine receptor D4 gene locus, Proc. of the Nat.Ac. of Sci. of the Uni. Sta. of Amer., 99 (2002) 309—314.
[11] M. Doepke, F. Zilibotti, Social Class and the Spirit of Capitalism, J. of the Eur. Econ.Assoc., 3 (2005) 516—524.
[12] M. Doepke, F. Zilibotti, Occupational choice and the spirit of capitalism, Quart. J. ofEcon., 2 (2008) 747—793.
[13] T. Dohmen, A. Falk, D. Huffman, U. Sunde, J. Schupp, G. G. Wagner, Individual riskattitudes: new evidence from a large, representative, experimentally validated survey,Discussion Paper No. 1730, IZA, 2005.
[14] W. H. Durham, Interaction of genetic and cultural evolution: models and examples, Hu-man Ecol., 10 (1982) 289—323.
[15] E. Finkelman, I. Finkelstein, Introducing socioeconomic characteristics into productionanalysis under risk, Agr. Econ., 13 (1996) 149—161.
[16] O. Galor, From stagnation to growth: unified growth theory, in Handbook of EconomicGrowth, Ed. by P. Aghion, and S. Durlauf, Elsevier, Holland, 2005.
[17] O. Galor, O. Moav, Natural selection and the origin of economic growth, Quart. J. ofEcon., 117 (2002) 1133—1191.
26

[18] O. Galor, O. Moav, The neolithic revolution and contemporary variations in life ex-pectancy, Working Paper, Department of Economics, Brown University, 2007
[19] O. Galor, D. N. Weil, From Malthusian stagnation to modern growth, Amer. Econ. Rev.,89 (1999) 150—154.
[20] O. Galor, D. N. Weil, Population, technology, and growth: from Malthusian stagnation tothe demographic transition and beyond, Amer. Econ. Rev., 90 (2000) 806—828.
[21] G. D. Hansen, E. C. Prescott, Malthus to Solow, Amer. Econ. Rev., 92 (2002) 1205—1217.
[22] J. A. Harris, P. A. Vernon, D. I. Boomsma, The heritability of testosterone: a study ofDutch adolescent twins and their parents, Behav. Genet., 28 (1998) 165—171.
[23] F. A. Hayek, Individualism and Economic Order, University of Chicago Press, Chicago,IL, 1948.
[24] I. Kirzner, Competition and Entrepreneurship, University of Chicago Press, IL, Chicago,1973.
[25] H.-P. Kohler, J. L. Rodgers, K. Christensen, Is fertility behavior in our genes? Findingsfrom a Danish twin study, Pop. and Dev. Rev., 25 (1999) 253—288.
[26] S. Kose, A psychobiological model of temperament and character, TCI Yeni Symposium,41 (2003) 86—97.
[27] N.-P. Lagerlöf, Long-run trends in human body mass, Macroec. Dyn. 11 (2007) 367—387.
[28] F. B. Livingstone, Anthropological implications of sickle cell distribution in west Africa,Amer. Anthropol., 60 (1958) 533—562.
[29] R. Lucas, The Industrial Revolution: Past and Future. Harvard University Press, Cam-bridge, MA, 2002.
[30] A. Meikle, J. Stringham, D. Bishop, D. West, Quantitating genetic and nongenetic factorsinfluencing androgen production and clearance rates in men, J. of Clinic. Endocrin. andMetab., 67 (1988) 104—109.
[31] N. Mekel-Bobrov, S. L. Gilbert, P. D. Evans, E. J. Vallender, J. R. Anderson, R. R.Hudson, S. A. Tishkoff, B. T. Lahn, Ongoing adaptive evolution of ASPM, a brain sizedeterminant in Homo sapiens, Science, 309 (2005) 1720—1722.
[32] S. Miyata, Household’s risk attitudes in Indonesian villages, Appl. Econ., 35 (2003) 573—583.
[33] R. Nielsen, C. Bustamante, A. G. Clark, S. Glanowski et al., A scan for positively selectedgenes in the genomes of humans and chimpanzees, PLos Biology, 3 (2005) e170.
[34] H. Ofek, Second Nature: Economic Origin of Human Evolution. Cambridge UniversityPress, Cambridge, UK, 2001.
[35] I. Palacios-Huerta, T. J. Santos, A theory of markets, institutions, and endogenous pref-erences, J. of Pub. Econ., 88 (2004) 601—627.
[36] J. L. Rodgers, H.-P. Kohler, K. O. Kyvik, K. Christensen, Behavior genetic modeling ofhuman fertility: findings from a contemporary Danish twin study, Demography, 38 (2001)29—42.
27
[37] G. Saint-Paul, On market forces and human evolution, J. of Theoret. Biol., 247 (2007)397—412.
[38] J. A. Schumpeter, The Theory of Economic Development, Harvard University Press, Cam-bridge, MA, 1934.
[39] E. Spolaore, R. Wacziarg, The diffusion of development, Quart. J. of Econ., 124 (2009)469-529.
[40] B. F. Voight, S. Kudaravalli, X. Wen, J. K. Pritchard, A map of recent positive selectionin the human genome, PLos Biology, 4 (2006) e72.
[41] J. Weibull, Evolutionary Game Theory. MIT Press, Cambridge, MA, 1995.
[42] J. Weibull, M. Salomonsson, Natural selection and social preferences, J. of Theoret. Biol.,239 (2006) 79—92.
[43] Y. Welch, A. Bernardo, On the evolution of overconfidence and entrepreneurs, J. of Econ.and Manag. Strat., 10 (2001), 301—330.
[44] R. E.White, S. Thornhill, E. Hampson, Entrepreneurs and evolutionary biology: the Re-lationship between testosterone and new venture creation, Organiz. Behav. and HumanDecision Processes, 100 (2006), 21—34.
[45] S. L. Wiesenfeld, Sickle cell trait in human biological and cultural evolution, Science, 157(1967), 1135—1140.
28