Evolution of security transaction tax in India - Munich Personal
22
Munich Personal RePEc Archive Evolution of Security Transaction Tax in India Sinha, Pankaj and Mathur, Kritika Faculty of Management Studies, University of Delhi 30 June 2012 Online at https://mpra.ub.uni-muenchen.de/40165/ MPRA Paper No. 40165, posted 19 Jul 2012 13:31 UTC
Transcript of Evolution of security transaction tax in India - Munich Personal

Munich Personal RePEc Archive
Evolution of Security Transaction Tax in
India
Sinha, Pankaj and Mathur, Kritika
Faculty of Management Studies, University of Delhi
30 June 2012
Online at https://mpra.ub.uni-muenchen.de/40165/
MPRA Paper No. 40165, posted 19 Jul 2012 13:31 UTC

Evolution of Security Transaction Tax in India
Pankaj Sinha and Kritika Mathur
Faculty of Management Studies
University of Delhi
Abstract
Securities Transaction Taxes have received much attention over the last few years with countries
and global organizations trying to control the level of speculations, especially since the Global
Financial Crisis. This study examines the impact of an increase in the level of securities
transaction tax on traded quantity of shares and time series behaviour of stock returns using data
from two prominent national stock exchanges of India. We find that when the tax on equity
transactions increases from 0.1% to 0.125%, the quantity of traded shares (volume) decreases by
more than twenty five percent. Since the volatility of returns on stocks is not constant through
time, conditional heteroscedasticity models are used to estimate the volatility of stock returns.
The impact of tax on volatility of return on indices is insignificant.
Keywords: securities transaction taxes, stock market, returns
JEL Codes: G14, G18, H10
1. Introduction
The recent Global Financial Crisis has triggered policy makers to reform policies so as to avoid a
replay of events and improve the financial sector. It has been felt that there is a need to make the
financial sector contribute to the financing of the crisis. In the European Union, the European
Commission has proposed a Financial Transaction Tax to generate revenues and help to ensure
greater stability of financial markets. In contrast to this debate, however, there is little literature
on the impact of Financial Transaction Taxation referred to as Securities Transaction Taxation in
India.

Security Transaction Tax is a tax payable on the purchase and sale of securities, irrespective of
the transaction resulting in a profit or loss. STTs have been a policy tool throughout the world.
They have been operational in major financial markets including UK, USA, and Australia and
many developing economies, such as, China, India and Malaysia. Table 1 shows STT in various
economies of the world.
Table 1: Security Transaction Taxes in the world
Argentina Federal stamp duty on share transfer abolished in 2001
Australia State-level taxes may apply to shares
Brazil 1.5 per cent tax on equity issued abroad as DR (reduced from 3 per cent 2008)
China 0.1 per cent of principal
France 15-30 bps tax abolished in 2008
Hong Kong 10 bps
India 0.125 per cent on delivery and 0.025 per cent on intraday
Indonesia 0.1 per cent on value of shares, local stamp duty may also apply
Italy 0.01-0.14 per cent of shares traded off exchanges
Singapore 20 bps
South Africa 0.25 per cent of value, new share issues excluded
South Korea 0.5 per cent on value of shares in corporations or partnerships
Switzerland 15 bps on domestic and 30 bps on foreign shares
Taiwan 31 bps
Turkey Initial margin 0.15 and annual maintenance charge 0.025 per cent
UK Stamp duty 0.5 per cent on secondary sale of shares
USA SEC fees 0.0013 per cent (volume), NY state tax $0.05 per share up to $350 per trade
Source: SEBI Bulletin, March 2012
Securities Transaction Tax in India
Security Transaction Tax (STT) was introduced in India in the Union Budget 2004-05. STT was
proposed to abolish the tax on long-term capital gains and to reduce the short-term capital gains
tax to 10 per cent from 33 per cent. The stock exchanges and mutual funds collect STT on all
transactions and remit the same to the Government of India account. The rate of STT has varied
over the years. Table 2 shows the structure of Security Transaction Taxation in India.
Currently STT is levied on the transaction value at the following applicable rates:
• In a sale of equity shares, which is settled by actual delivery, STT is levied at the rate of
0.125 percent on both the buyer and the seller
• For a sale of equity shares settled other than the way of actual deliveries or transfer, STT
is levied at the rate of 0.025 per cent on the seller of equity shares
• A seller of derivatives on a recognized stock exchange is subject to STT of 0.017 per cent

In the latest Union Budget 2012-2013, it has been proposed to reduce STT on cash delivery
transactions by 20 per cent from 0.125 per cent to 0.1 per cent to be effective from July 1, 2012.
Table 2: Structure of STT in India
Purchase of
Equity Shares,
Units of Equity
Oriented
Mutual Fund
delivery based)
Sales of Equity
Shares, Units
of Equity
Oriented
Mutual Fund
delivery based)
Sales of Equity
Shares, Units
of Equity
Oriented
Mutual Fund
(non-delivery
based)
Sale of
Derivatives Sale of Unit
of an Equity
Oriented Fund
to the Mutual
Fund
October 1,2004
to May 31,2005 0.075% 0.075% 0.015% 0.01% 0.15%
June 1,2005 to
May 31,2006 0.1% 0.1% 0.02% 0.0133% 0.2%
June 1,2006 to
May 31,2008 0.125% 0.125% 0.025% 0.017% 0.25%
June 1,2008
onwards 0.125% 0.125%
0.025% 0.017% of option
premium in the case of
sale of option, 0.125% of settlement price in the case of sale of an option where option is exercised,
0.017% of the price in the
case of sale of futures
0.25%
July 1,2012
onwards
(proposed)
0.1% 0.1% 0.025% Same as above 0.25%
Source: SEBI Bulletin, March 2012
As per the Union Budget 2012-13, revised estimates of the revenues from Securities Transaction
Tax collected touched Rs.5,200 crore in the financial year 2011-12. The maximum collection of
STT revenue was received from cash deliverable transactions. Till September 2011, total revenue
collection at BSE and NSE was Rs.1,749 crores from imposition of STT on cash deliverable
transactions. Table 3 represents the STT revenue collection at BSE and NSE.

Table 3: STT revenue collection at BSE and NSE (in Rupees crore)
Calendar
Year
Cash
Deliverable
Cash Non
Deliverable
Equity
Futures
Options
Premium
Exercised
Options
Total
2004-05 316 56 127
0
17
516
2005-06 1,738 249 573
0
69
2,628
2006-07 2,814 362 1,185
0
168
4,529
2007-08 5,178 626 1,974
0
293
8,071
2008-09 3,510 502 1,201
67
64
5,344
2009-10 4,871 758 1,552
24
97
7,301
2010-11 4,653 602 1,675
36
98 7,064
2011-12 (till
September
2011)
1,749 193 656 22 32 2,652
Source: SEBI Bulletin, March 2012
Against this background, this paper attempts to provide an analysis of the impact of Security
Transaction Tax on Indian stock market. The paper is organized as follows. Section 2 reviews
the literature. Section 3 presents an introduction to the data and the methodology which are used
to investigate the relationship. Section 4 reports the empirical findings and Section 5 concludes
the paper.
2. Review of Literature
One of the earliest proponents of taxing financial sector transactions was Keynes (1936) who
believes the introduction of a tax on transactions would mitigate the predominance of speculation
over the enterprise in the United States. Keynes argues that STT will increase welfare and reduce
wastage of resources, market volatility and asset pricing. In line with Keynes argument is Tobin
(1978) who proposes a tax on all foreign exchange transactions to be levied multilaterally to
decrease the speculative capital inflows. Summers and Summers (1989) examine the desirability

and feasibility of implementation of a Securities Transfer Excise Tax in US. They argue that
imposition of such a tax would reduce speculation and raise revenues.
Stiglitz (1989) discusses that the imposition of a turnover tax can reduce price volatility. He
argues that a tax on turnover is likely to lead to lower speculation in the stock market by
discouraging noise traders and arbitrageurs. Habermier and Kirilenko (2003) assess the impact of
securities transaction tax on financial markets and conclude that transaction taxes have a
negative effect on price discovery, volatility, liquidity and lead to reduction in market efficiency.
Umlauf (1993) studies the effect of transaction taxes on the behavior of equity returns of Sweden
for the period 1980-1987. He uses daily and weekly Swedish All-Share equity index returns and
calculates variance ratios. He finds the presence of a rise in volatility in response to the
imposition of a transaction tax with a movement of traded volume of Swedish stocks to London.
Campbell and Froot (1993) study the international experience with securities transaction taxes
using the Swedish and British systems as case studies. They report that due to imposition of
transaction taxes, investors can change the location of trade, moving transactions off-exchange or
abroad. They conclude that the impact of imposition of tax in Sweden is offshore trading and
trading of untaxed local substitutes. In Britain, the authors observe that STT cannot be avoided, it
can stimulate trading in untaxed securities and reduce total trading volume. Hayashida and Ono
(2011) quantitatively examine the effect on the Tokyo stock market volume for the period from
April 1995 to March 2003. The study concludes that the increased transaction cost due to
imposition of tax significantly reduces the trading volume.
Baltagi et al (2006) examine the impact of an increase in stamp tax rate on stock market behavior
in China. The authors use daily observations of Shanghai A Share Index and Shenzhen A Share
Index over the period from November 11, 1996 to November 10, 1997. The study proves that
trading volume significantly changes after the tax rate increases and also leads to lower market
efficiency.
Phylaktis and Aristidou (2007) describe the effects of security transaction tax on volatility of
stock market returns in the Athens Stock Exchange for All Share Index and large cap index
FTSE/ASE 20 Index. The study uses different versions of GARCH-M/EGARCH-M models to

investigate the relationship between transaction tax and the conditional mean and variance during
bull, normal and bear periods of daily stock returns for the period from September 24, 1997 to
December 31, 2003. The study concludes that transaction tax increases volatility during the bull
periods and decreases volatility during bear periods.
Kupiec (1995) reports that a transactions tax can impede the information efficiency of markets
by discouraging the volume of information motivated trading. The author concludes that the tax
is likely to cause risky assets to trade further from their underlying economic values. In another
study, Kupiec (1996) analyses the effects of STT in the context of a general equilibrium model
and argues that it can reduce the volatility of risky assets price and a decline in the risky assets
price leading to rise in volatility of risky assets return.
Roll (1989) examines the stock market volatility for twenty three countries for the period from
January 1987 to March 1989. He studies the impact of transaction taxes, price limits and margin
requirements on stock market volatility around the 1987 Wall Street Crash. He compares the
experience of countries which had a transaction tax with those which didn’t impose a transaction
tax (Canada, Mexico, New Zealand and United States). He reports transaction taxes are inversely
but insignificantly correlated with volatility across countries.
Saporta and Kan (1997) discuss the effect of the UK stamp duty on the level and volatility of
equity prices. The authors study the response of equity markets to changes in stamp duty rates
and compare the prices of assets identical in all respects. This is done via comparing the prices of
a sample of underlying shares of UK-listed companies (subjected to stamp duty) with the price of
their US-listed ADRs. The authors perform the comparison empirically using univariate GARCH
models and conclude that the stamp duty has no effect on volatility.
Chou and Wang (2006) study the impact of a reduction in transaction tax on the market quality
of futures contracts of the Taiwan Stock Exchange in a structural equation framework. The
authors measure market quality by trading volume, bid-ask spread and price volatility. The time
period chosen for the study is from May 1999 to April 2001. They report that a decrease in
transaction tax has a positive impact on trading volume in the index futures market and reduces
the bid ask spread. The authors do not find a significant relationship between transaction taxes

and return volatility and argue that an increase or decrease in transaction tax does not result in
the same percentage increase or decrease in the tax revenues.
Pomeranets and Weaver (2011) examine the changes in New York State Securities Transaction
Tax for the time period between 1932 and 1981. The study uses three measures of market quality
including volatility, spread width and volume. They conclude that an imposition of STT leads to
wider bid ask spreads, lower volumes and find no consistent relationship between tax and
volatility.
Liu (2007) investigates the effect of transaction taxes on the efficiency of Tokyo Stock Exchange
price discovery process. The author uses daily data from April 1, 1987 to March 31, 1991 and
empirically checks the effects through switching first order autocorrelation model. He suggests
that tax event of 1989 results in lower STT related transaction costs and higher informational
efficiency in the Tokyo Stock Exchange. The study also estimates the marginal impact on overall
trading volume using a switching regression analysis and claims that the tax reform has a
positive price impact on Japanese stocks without any effect on the prices for their respective
ADRs. Thus the study demonstrates that a reduction in transaction costs improves the efficiency
of the price discovery process.
Su (2010) discusses the impact of a change in securities transaction tax on the local A shares in
the Shanghai and Shenzhen market over the period from April 1991 to August 2008. The author
uses the Switching Generalized Autoregressive Conditional Heteroskedasticity methodology to
test whether there are changes in market efficiency due to changes in STT. To examine the
impact of STT changes on trading volume the author performs bootstrap testing and reports
lower taxes can lead to increase in trading volume. The author concludes that a reduction in the
level of STT rate increases return volatility and reduces market efficiency.
While some studies point to a reduction in volatility as a result of imposition of security
transaction tax, others suggest the opposite. Our objective is to examine the effect of securities
transaction tax on Indian stock market.

3. Data and Methodology
In India, there are two significant stock exchanges in for trading, namely Bombay Stock
Exchange (BSE) and National Stock Exchange (NSE). The Bombay Stock Exchange was
established in 1875 and has the largest number of listed companies in the world. As of March
2012, there were over 5,133 listed Indian companies and over 8,196 scrips being traded on the
stock exchange. In 1986, BSE came out with the stock index– SENSEX, which has become one
of the most significant indicators of the Indian stock market.The BSE SENSEX is calculated
using data of thirty component stocks representing large, well-established and financially sound
companies across key sectorsby the Market Capitalization-Weighted methodology. The base
year of SENSEX is 1978-79. SENSEX is calculated on a free-float market capitalization
methodology, since September 2003.
The National Stock Exchange was set up in 1991 on the recommendation of Pherwani
Committee. NSE’s key index is the S&P CNX Nifty, it is commonly known as NSE NIFTY
(National Stock Exchange Fifty). NIFTY is an index of fifty major stocks weighted by market
capitalisation. Our analysis is based on the change brought about on June 1, 2006, when the
percentage of Security Transaction Tax on equity trading was increased from 0.1% to 0.125%.
Data
3.1.1 Effect on Traded Quantity
To examine the impact of change in security transaction taxes, we have used daily traded
quantity in terms of number of shares at the Bombay Stock Exchange and National Stock
Exchange. The data ranges for a period of one year before June 1, 2006 and one year after June
1, 2006, i.e. from June 1, 2005 to May 31, 2007. The data has been collected from the official
websites of BSE and NSE. The traded quantity data is measured in crores. The summary
statistics of the data for traded quantity are given in Table 4.

Table 4: Summary Statistics of Traded Quantity (crores)
Statistics
Pre Event
(June 1, 2005 to
May 31, 2006)
Post Event
(June 2, 2006 to
May 31, 2007)
Whole Sample
(June 1, 2005 to
May 31, 2007)
Panel A : BSE
Number of observations 249 249 498
Maximum 67.15 47.1 67.15
Minimum 6.01 3.08 3.08
Mean 27.87 22.28 25.08
Standard Deviation 10.73 7.07 9.50
Panel B – NSE
Number of observations 249 249 498
Maximum 71.24 59.79 71.24
Minimum 7.82 4.50 4.50
Mean 36.34 34.50 35.42
Standard Deviation 8.89 9.76 9.37
3.1.2 Effect on Return of Indices
To study the effect of change in security transaction taxes, the BSE SENSEX and NSE NIFTY
indices are used. The data in this study cover the period from June 1, 2005 to May 31, 2007.
There are 498 observations for closing price of BSE SENSEX and NSE NIFTY, respectively.
The data of daily closing price for both the indices was retrieved from Reserve Bank of India
website. The daily returns were calculated based on the closing prices by Return, Rt =
ln(Pt+1/Pt), where Pt represents the value of index at time t and Pt+1 represents the value of index
at time t+1. There are 496 observations for daily returns of BSE SENSEX and NSE NIFTY,
respectively Table 5 gives the summary statistics of the daily returns of the two indices SENSEX
and NIFTY.
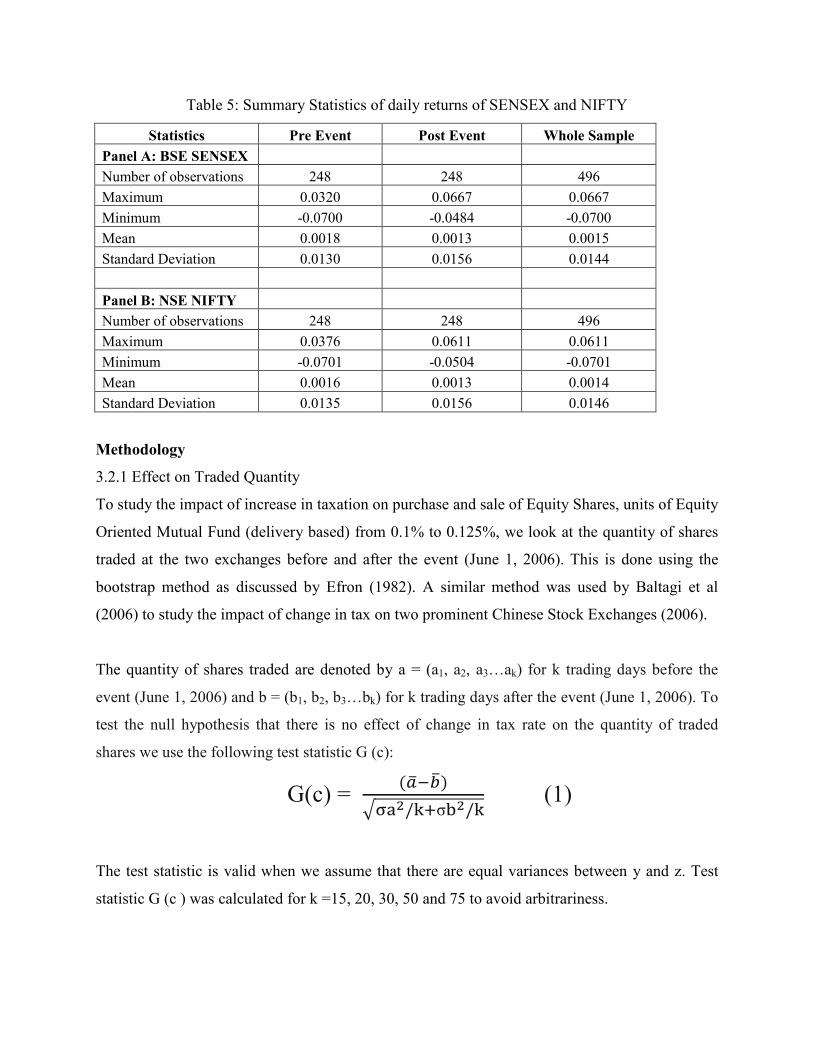
Table 5: Summary Statistics of daily returns of SENSEX and NIFTY
Statistics Pre Event Post Event Whole Sample
Panel A: BSE SENSEX
Number of observations 248 248 496
Maximum 0.0320 0.0667 0.0667
Minimum -0.0700 -0.0484 -0.0700
Mean 0.0018 0.0013 0.0015
Standard Deviation 0.0130 0.0156 0.0144
Panel B: NSE NIFTY
Number of observations 248 248 496
Maximum 0.0376 0.0611 0.0611
Minimum -0.0701 -0.0504 -0.0701
Mean 0.0016 0.0013 0.0014
Standard Deviation 0.0135 0.0156 0.0146
Methodology
3.2.1 Effect on Traded Quantity
To study the impact of increase in taxation on purchase and sale of Equity Shares, units of Equity
Oriented Mutual Fund (delivery based) from 0.1% to 0.125%, we look at the quantity of shares
traded at the two exchanges before and after the event (June 1, 2006). This is done using the
bootstrap method as discussed by Efron (1982). A similar method was used by Baltagi et al
(2006) to study the impact of change in tax on two prominent Chinese Stock Exchanges (2006).
The quantity of shares traded are denoted by a = (a1, a2, a3…ak) for k trading days before the
event (June 1, 2006) and b = (b1, b2, b3…bk) for k trading days after the event (June 1, 2006). To
test the null hypothesis that there is no effect of change in tax rate on the quantity of traded
shares we use the following test statistic G (c):
G(c) = (�����)
��/� σ�/� (1)
The test statistic is valid when we assume that there are equal variances between y and z. Test
statistic G (c ) was calculated for k =15, 20, 30, 50 and 75 to avoid arbitrariness.

Before choosing bootstrap samples, we performed transformations. ^
ia = ai- ��- � ̅(where ��and
�̅means of k samples pre the event and total samples of both pre and post the event respectively)
and ^
ib = bi - ��- �̅(where����and � ̅are means of k samples post the event and total samples of
both pre and post the event respectively). Bootstrap samples were chosen from (^ ^ ^
1 2, ,..., ka a a ) and
(^ ^ ^
1 2, ,..., kb b b ). We developed a program in MATLAB (see Appendix) to choose a random sample
of k items with replacement from pre event group (containing k values) and a random sample of
k items with replacement from post event group (containing k values). Samples were drawn
10,000 times and G*(c*) statistic was calculated on each time for k =15, 20, 30, 50 and 75.
G*(c*) = ^ ^
2 2
a b
a b
k k
σ σ−
+)
$
(2)
For each value of k, a bootstrap distribution of G*(c*) using the 10,000 values of G*(c*) statistic
to find out the critical values of the test statistic. The critical values derived are given in Table
A.1 of the Appendix.
3.2.2 Effect on Return of Indices
In this section, we test whether the return on indices (SENSEX and NIFTY) changes due to the
increase in tax rate. Traditional homoskedastic models are not suitable when using the stock
prices to calculate return due to the presence of conditional heteroskedasticity (Baillie &
Bollerslev, 1990). The volatility of returns is not constant through time and exhibit clustering,
which makes periods of relatively low volatility and periods of relatively high volatility grouped
together. Thus, the returns can be characterised by Autoregressive Conditional
Heteroskedasticity (ARCH), and its extensions, Generalised Autoregressive Conditional
Heteroskedasticity (GARCH) Model. We use the ARCH and GARCH models to study the
impact of increase in transaction tax on return.
The Standard GARCH model that was proposed by Bollerslev(1986) is
Mean Equation: ht = j0+ εt …………… (3)
Variance Equation: var(εt| Lt-1) = σt2= s0 + s1 ε
2t-1+ s2 σ
2t-1……………..( 4)

In the equation above Lt-1 denotes the information set up to period t-1.
As suggested by Baltagi et al (2006), to understand whether the change in securities transaction
tax in June 2006, we include a dummy variable in the Standard GARCH Model resulting in a
Modified version of GARCH. The model with dummy variable used in the study is
ht = j0+j1 Dt+ εt……….(5)
var(εt,|Lt-1) = σt2= s0 + s1 ε
2t-1+ s2 σ
2t-1 + s3Dt…………(6)
where Dt= 0 before the event (before June 1, 2006) and Dt= 1 after the event(after June 1, 2006).
The impact of the change in tax will be observed if the dummy coefficients will be significant.
4. Empirical Results
4.1 Effect on Traded Quantity
We test whether the quantity of traded shares at both the stock exchanges changed after the
increase in tax rate. All the test statistics (G(c)) are significant at 5% level in both the Bombay
Stock Exchange and the National Stock Exchange for the five sample lengths (k=15,20,30,50
and 75).
Thus suggesting the traded quantity significantly changed due to increase in taxes on equity
trading from 0.1% to 0.125% on June 1, 2006. The results are given in Table 6. The sample
length indicates the length of trading used in the calculation of the G(c) statistic. The ratio is the
ratio of Mean value after the event (June 1, 2006) to the mean value before the event. The
formula used to calculate G(c) is given in Section 3.2.1. The significance level was assessed
using the confidence interval obtained from the bootstrapping distributions using code developed
on MATLAB.

Table 6: Traded Quantity in shares
±15 ±20 ±30 ±50 ±75
BSE
Mean before the event 23.682 26.157 26.065 27.066 26.426
Mean after the event 16.714 16.009 14.707 14.024 15.513
Ratio (mean value after the event/before the event) 0.706 0.612 0.564 0.518 0.587
Test statistic G (c ) 3.827
(0.000) 5.565
(0.000) 8.144
(0.000) 29.939 (0.000)
14.391 (0.000)
NSE
Mean before the event 41.768 43.304 42.250 41.716 39.444
Mean after the event 31.118 28.956 26.738 25.099 26.267
Ratio (mean value after the event/before the event) 0.745 0.669 0.633 0.602 0.666
Test statistic G (c ) 3.330
(0.000) 5.066
(0.000) 7.053
(0.000) 11.119 (0.000)
11.376 (0.000)
As can be seen from Table 6, the number of shares traded fell by 29-48% in BSE whereas the
volume of shares fell by 25-39% in NSE. Thus clearly showing with a rise in tax there has been
a fall in quantity of shares traded on both the stock exchanges. This indicates that the market
responded to the increase in securities transaction tax by a large reduction in quantity of traded
shares. This is in line with the basic principle of public finance, is that as tax rate increases, the
tax base shrinks.
4.2 Effect on Returns of Indices
In this section, we examine the impact on return of indices due to the change in security
transaction tax rate by modified version of GARCH Model. Both the Standard GARCH(1,1)
model defined in the equations (3) and equation (4) and the modified GARCH in the equations
(5) and (6) are estimated for the two indices. Table 7 provides the results of the GARCH Model
and the Modified version of GARCH.

Table 7: Results of Standard GARCH and Modified Version of GARCH
jo j1 s0 s1 s2 s3 L
Panel A- BSE
Standard
GARCH
0.002261 (0.0001)
1.16E-05 (0.0001)
0.155597 (0.0000)
0.783848 (0.0000)
1467.47
Modified
GARCH
0.002445 ( 0.0015)
(-)0.000364 ( 0.7534)
1.23E-05 ( 0.0003)
0.154575 (0.0000)
0.785109 ( 0.0000)
(-)1.51E-06 (0.5877)
1467.64
Panel B-NSE
Standard
GARCH
0.002115 (0.0003)
1.10E-05 (0.0002)
0.146536 (0.0000)
0.797666 (0.0000)
1461.38
Modified
GARCH
0.002206 (0.0057)
(-)0.000212 ( 0.8593)
1.11E-05 (0.0004)
0.144253 ( 0.0000)
0.800765 ( 0.0000)
(-)6.55E-07 (0.7997)
1461.43
The standard GARCH Model is: ht = j0+ εt and var(εt| Lt-1) = σt2= s0 + s1 ε
2t-1+ s2 σ
2t-1
The modified GARCH Model is ht = j0+j1 Dt+ εt and var(εt,|Lt-1) = σt2= s0 + s1 ε
2t-1+ s2 σ
2t-1 + s3Dt
As we can observe from Table 7, for both the indices, BSE and NSE, the coefficient of the
dummy variable (j1) in the mean equation of Modified GARCH (Equation 5) is negative though
the coefficient is not significant. Thus indicating that an increase in tax has a negative impact on
the rate of return. The coefficient of the dummy variable (s3) in the variance equation (Equation
6) is insignificant. Thus we do not find a significant relationship between increase in STT and
return volatility of the two indices as was expected by the imposition of increase in securities
transaction tax by the proponents of STT.
5. Concluding Observations
Financial market volatility has always remained a concern for regulators. In recent years,
governments and global organisations are involved in proposing and adopting various
regulations to control the level of speculations. One of the popular mechanisms is Securities
Transaction Tax. The proponents argue that imposition of STT discourages noise traders from
trading, reducing unproductive speculations. Whereas the opponents are of the view that
increased tax can lead to lower value of securities, increase volatility, and decrease stock market
efficiency.

This paper throws light on the effect of STT on the quantity traded and returns of Indian stock
markets. The effect of the increase in tax level leads to a fall in the traded volume of shares in the
BSE and NSE Stock exchanges by more than twenty five percent. This is in line with the
arguments given by Hayashida and Ono (2011), Chou and Wang (2006) and Baltagi et al (2006).
With a rise in transaction tax leading to fall in quantity of shares traded, the changes proposed in
the Budget 2012-13 to reduce STT on cash delivery transactions by 20 per cent from 0.125 per
cent to 0.1 per cent to be effective from July 1, 2012 is justified.
Having estimated the returns, we study the volatility of the returns in the stock market. Our
empirical analysis reveals that an increase in Securities Transaction Taxes does not lead to a
significant change in return volatility in the stock market. Similar arguments were given by
Pomeranets and Weaver (2011) and Su (2010) in their respective studies on the impact of change
in tax on return volatility. Our results provide useful evidence for the ongoing Security
Transaction tax debates across the world.

References
Baillie, R.T. and T. Bollerslev (1990). A multivariate generalized ARCH approach to modeling risk premia in forward foreign exchange rate markets, Journal of International Money and
Finance, 9, 309–324.
Baltagi B., D. Li., and Q. Li(2006).Transaction tax and stock market behavior: evidence from an emerging market, Empirical Economics, Vol. 31(2), 393-408.
Bollerslev, T. (1986). Generalized autoregressive conditional heteroskedasticity, Journal of
Econometrics, Volume 31, Issue 3, April 1986, 307–327.
Campbell, J. and K. Froot (1993).International Experience with Securities Transaction Taxes, NBER Working Paper 4587.
Chou, R. K. and G. H. K. Wang (2006).Transaction tax and market quality of the Taiwan stock index futures, Journal of Futures Market, 26: 1195–1216.
Efron, B. (1982). The jackknife, the bootstrap and other resampling plans, Philadelphia: Society
for Industrial and Applied MathematicsCBMS-NSF Monographs, 38.
Habermier, K. and A.Kirilenko (2003).Securities Transaction Taxes and Financial Markets, IMF Staff Papers, Volume 50.
Hayashida M. and H. Ono (2011).Turnover tax, transaction cost and stock trading volume revisited: investigation of the Japanese case, Applied Financial Economics, 2011, 21, 1809–18.
Keynes, J. M. (1936). General Theory of Employment, Interest Rates and Money (New York:Harcourt Brace & World).
Kupiec, P. H. (1995).A Securities Transactions Tax and Capital Market Efficiency, Contemporary Economic Policy, 13: 101–112
Kupiec, P. H. (1996). Noise Traders, Excess Volatility, and a Securities Transactions Tax, Journal of Financial Services Research, Volume 10, Number 2 (1996), 115-129.
Liu, S.(2007). Securities Transaction Tax and Market Efficiency: Evidence from the Japanese Experience, Journal of Financial Services Research, Vol. 32(3), 161-176.
Phylaktis K. and A.Aristidou (2007). Security transaction taxes and financial volatility: Athens stock exchange, Applied Financial Economics, 17:18, 1455-1467.
Pomeranets, A. and, D.G. Weaver (2011). Security Transaction Taxes and Market Quality, Bank of Canada, Working Paper, 2011-26.
Pore, L. (2012). Analysis of Securities Transaction Tax, SEBI Bulletin, March 2012, Volume 10, Number 3.
Roll, R. (1989). Price Volatility, International Market Links and Their Implication for Regulatory Policies, Journal of Financial Services Research, 3(2-3), 211–46.
Saporta, V. and K.Kan (1997). Effects of Stamp Duty on the Level and Volatility of UK Equity Prices, Working Paper, Bank of England, London.
Stiglitz, J. E. (1989). Using Tax Policy to Curb Speculative Short-Term Trading, Journal of
Financial Services Research, Vol. 3, 101–15.

Su, Y. (2010). The impact of the securities transaction taxes on the Chinese stock market, MPRA Paper 22695, University Library of Munich, Germany
Summers, L and V. Summers (1989). When Financial Markets Work Too Well: A Cautious Case for a Securities Transaction Tax, Journal of Financial Services Research, 3. 261–86.
Tobin, J. (1978). A Proposal for International Monetary Reform, Eastern Economic Journal 4(3–4), 153–59.
Umlauf, S.R. (1993). Transaction taxes and the behavior of the Swedish stock market, Journal
Financial Economics, 33, (1993), 227-240.

Appendix
MATLAB Program for implementing Bootstrap Method
a= [Enter pre event values];
b= [Enter post event values];
c= [Enter value of k];
result=zeros(length(c),10000);
for i=1:length(c)
for j=1:10000
temp=floor((c(i)-1)*rand(1,c(i)))+1;
bb=b(temp);
aa=a(temp);
result(i,j)=(mean(aa)-mean(bb))/sqrt((std(aa)^2)/c(i)+(std(bb)^2)/c(i));
end
end
p=(result(1,:));
mini=min(p);
maxi=max(p);
interval=(maxi-mini)/100;
l=zeros(1,100);
for i=1:length(p)
for j=1:100
if(p(i)>=mini+interval*(j-1) && p(i)<mini+interval*j)
l(1,j)=l(1,j)+1;
end
end
end
l=l/length(p);
m=[1:1:100];
m=mini+interval*(m-1);
ll=cumsum(l);
for i=1:100
if(ll(i)>0.025)
break;
end
end
lower=(m(i)+m(i+1))/2
temp=[100:-1:1];
ll=l(temp);
m=m(temp);
ll=cumsum(ll);
for i=1:100
if(ll(i)>0.025)
break;
end
end
upper=(m(i)+m(i-1))/2
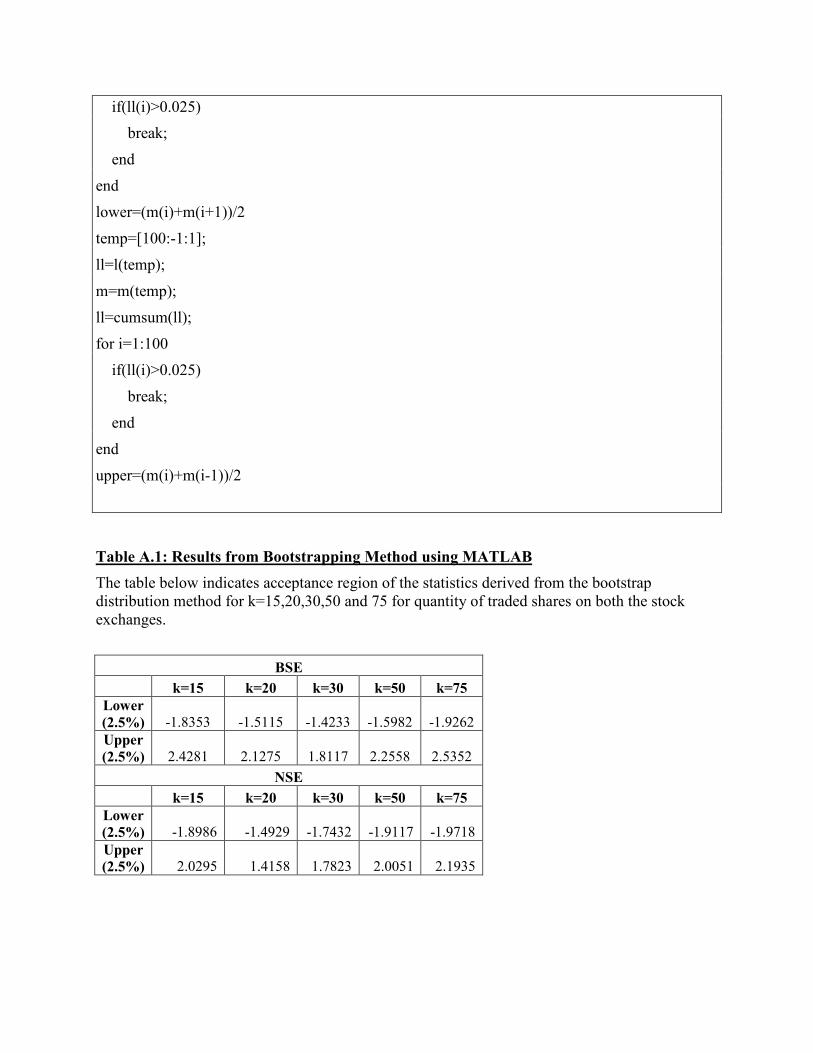
Table A.1: Results from Bootstrapping Method using MATLAB
The table below indicates acceptance region of the statistics derived from the bootstrap distribution method for k=15,20,30,50 and 75 for quantity of traded shares on both the stock exchanges.
BSE
k=15 k=20 k=30 k=50 k=75
Lower
(2.5%) -1.8353 -1.5115 -1.4233 -1.5982 -1.9262
Upper
(2.5%) 2.4281 2.1275 1.8117 2.2558 2.5352
NSE
k=15 k=20 k=30 k=50 k=75
Lower
(2.5%) -1.8986 -1.4929 -1.7432 -1.9117 -1.9718
Upper
(2.5%) 2.0295 1.4158 1.7823 2.0051 2.1935

Table A.2: Results from Standard GARCH run using EVIEWS - BSE SENSEX
Dependent Variable: R Method: ML – ARCH Date: 30/06/12 Time: 10:06 Sample: 1 496 Included observations: 496 Convergence achieved after 12 iterations
Coefficient Std. Error z-Statistic Prob.
C 0.002261 0.000571 3.955785 0.0001
Variance Equation
C 1.16E-05 3.06E-06 3.796645 0.0001 ARCH(1) 0.155597 0.032309 4.815873 0.0000
GARCH(1) 0.783848 0.039961 19.61544 0.0000
R-squared -0.002495 Mean dependent var 0.001544 Adjusted R-squared -0.008608 S.D. dependent var 0.014369 S.E. of regression 0.014431 Akaike info criterion -5.901090 Sum squared resid 0.102463 Schwarz criterion -5.867166 Log likelihood 1467.470 Durbin-Watson stat 1.845761
Table A.3: Results from Modified GARCH run using EVIEWS – BSE SENSEX Dependent Variable: R Method: ML – ARCH Date: 30/06/12 Time: 10:07 Sample: 1 496 Included observations: 496 Convergence achieved after 15 iterations
Coefficient Std. Error z-Statistic Prob.
C 0.002445 0.000771 3.172596 0.0015 DUMMY -0.000364 0.001158 -0.314096 0.7534
Variance Equation
C 1.23E-05 3.42E-06 3.580090 0.0003 ARCH(1) 0.154575 0.032200 4.800537 0.0000
GARCH(1) 0.785109 0.039337 19.95866 0.0000 DUMMY -1.51E-06 2.79E-06 -0.542176 0.5877
R-squared -0.002300 Mean dependent var 0.001544 Adjusted R-squared -0.012527 S.D. dependent var 0.014369 S.E. of regression 0.014459 Akaike info criterion -5.893714 Sum squared resid 0.102443 Schwarz criterion -5.842828 Log likelihood 1467.641 Durbin-Watson stat 1.846219

Table A.4: Results from Standard GARCH run using EVIEWS – NSE NIFTY Dependent Variable: R Method: ML – ARCH Date: 30/06/12 Time: 10:10 Sample: 1 496 Included observations: 496 Convergence achieved after 14 iterations
Coefficient Std. Error z-Statistic Prob.
C 0.002115 0.000588 3.599429 0.0003
Variance Equation
C 1.10E-05 2.91E-06 3.767850 0.0002 ARCH(1) 0.146536 0.030448 4.812630 0.0000
GARCH(1) 0.797666 0.036974 21.57365 0.0000
R-squared -0.002139 Mean dependent var 0.001441 Adjusted R-squared -0.008249 S.D. dependent var 0.014581 S.E. of regression 0.014641 Akaike info criterion -5.876528 Sum squared resid 0.105471 Schwarz criterion -5.842604 Log likelihood 1461.379 Durbin-Watson stat 1.874485
Table A.5: Results from Modified GARCH run using EVIEWS – NSE NIFTY Dependent Variable: R Method: ML – ARCH Date: 30/06/12 Time: 10:11 Sample: 1 496 Included observations: 496 Convergence achieved after 21 iterations
Coefficient Std. Error z-Statistic Prob.
C 0.002206 0.000798 2.766169 0.0057 DUMMY -0.000212 0.001198 -0.177209 0.8593
Variance Equation
C 1.11E-05 3.15E-06 3.513329 0.0004 ARCH(1) 0.144253 0.030214 4.774335 0.0000
GARCH(1) 0.800765 0.036900 21.70102 0.0000 DUMMY -6.55E-07 2.58E-06 -0.253685 0.7997
R-squared -0.001982 Mean dependent var 0.001441 Adjusted R-squared -0.012206 S.D. dependent var 0.014581 S.E. of regression 0.014670 Akaike info criterion -5.868649 Sum squared resid 0.105455 Schwarz criterion -5.817763 Log likelihood 1461.425 Durbin-Watson stat 1.874827