Evolution of reanalysis at ECMWF
6
Evolution of reanalysis at ECMWF Sakari Uppala 1 , Dick Dee 1 , Shinya Kobayashi 1,2 and Adrian Simmons 1 1 European Centre for Medium-Range Weather Forecasts, United Kingdom 2 Japan Meteorological Agency, Japan Correspondence: [email protected] INTRODUCTION Reanalysis has come to be seen as an iterative process, where developments in modelling, data-analysis techniques and computing power are used together with new data rescue efforts and experience from other reanalyses to produce a succession of reanalyses of increasing quality. Currently ECMWF is producing its 3 rd generation reanalysis, ERA-Interim, which benefits from the analysis and model developments since ERA-40, in particular in the assimilation of satellite radiances. Through three decades of NWP development and feedback from the scientific community reanalyses have achieved partly the qualities required for climate change studies. The components of hydrological cycle, surface fluxes and surface analyses together with the boundary layer quantities have improved also over the sensitive and data sparse polar areas. Comparisons with stratospheric datasets show that we can now have a good confidence on reanalyses up to 10hPa level through the years of satellite observations. The stratospheric circulation and low frequency variability also agree well with independent observational time series. Future reanalyses will further benefit from the ongoing work on the use of cloudy radiances. Equally, during the data sparse historical periods the modern analysis schemes such as 4D-Var have demonstrated their capabilities, when properly tuned, to transfer information from data-dense to data-sparse areas. FGGE “reanalyses” at ECMWF and GFDL After the International Geophysical Year (IGY) 1958, the observing system started to develop towards an integrated global system, including polar areas. In support of this, several measurement campaigns and experiments, including satellite and conventional observations, were carried out, one of them GATE (the GARP Atlantic Tropical Experiment) in 1974. It was the first major experiment of the Global Atmospheric Research Programme, whose goal was to understand the predictability of the atmosphere and extend the time range of daily weather forecasts to over two weeks. After a careful assessment of the results from GATE the requirements for the global observing system were specified and the First GARP Global Experiment was implemented from December 1978 to November 1979, with two Special Observation Periods in January/ February and May/ June. The first “reanalyses” of the FGGE year, the Main Level IIIb analyses, were carried out at ECMWF, Bengtsson et al. (1982), and simultaneously at GFDL, Ploshay et al. (1983). At that time, global data assimilation (e.g Lorenc, 1981), was improving rapidly, and with it forecast quality. The initial aim then was to learn how to use the new global observing systems and special observations deployed. Observing system experiments clearly demonstrated the value of each component, e.g. Uppala et al. (1985). Atmospheric Motion Vectors were proven important for the analysis over tropical regions, whereas retrieved satellite temperature profiles were of paramount importance for the extra-tropical analyses over ocean areas. Aircraft data were an invaluable addition to the global observing system. The drifting buoy data in the southern ocean provided good quality pressure observations with high frequency over data sparse areas. The FGGE reanalysis was later repeated, the Final Level IIIb analyses, with an improved analysis system and improved observation collection and quality at ECMWF , Uppala (1987), and at GFDL, Ploshay et al. (1991).
Transcript of Evolution of reanalysis at ECMWF
Evolution of reanalysis at ECMWF
Sakari Uppala1, Dick Dee1, Shinya Kobayashi1,2 and Adrian Simmons1
1European Centre for Medium-Range Weather Forecasts, United Kingdom2Japan Meteorological Agency, Japan
Correspondence: [email protected]
INTRODUCTION
Reanalysis has come to be seen as an iterative process, where developments in modelling, data-analysis techniques and computing power are used together with new data rescue efforts and experience from other reanalyses to produce a succession of reanalyses of increasing quality. Currently ECMWF is producing its 3rd
generation reanalysis, ERA-Interim, which benefits from the analysis and model developments since ERA-40, in particular in the assimilation of satellite radiances. Through three decades of NWP development and feedback from the scientific community reanalyses have achieved partly the qualities required for climate change studies. The components of hydrological cycle, surface fluxes and surface analyses together with the boundary layerquantities have improved also over the sensitive and data sparse polar areas. Comparisons with stratospheric datasets show that we can now have a good confidence on reanalyses up to 10hPa level through the years of satellite observations. The stratospheric circulation and low frequency variability also agree well with independent observational time series. Future reanalyses will further benefit from the ongoing work on the use of cloudy radiances. Equally, during the data sparse historical periods the modern analysis schemes such as 4D-Var have demonstrated their capabilities, when properly tuned, to transfer information from data-dense to data-sparse areas.
FGGE “reanalyses” at ECMWF and GFDL
After the International Geophysical Year (IGY) 1958, the observing system started to develop towards an integrated global system, including polar areas. In support of this, several measurement campaigns and experiments, including satellite and conventional observations, were carried out, one of them GATE (the GARP Atlantic Tropical Experiment) in 1974. It was the first major experiment of the Global Atmospheric Research Programme, whose goal was to understand the predictability of the atmosphere and extend the time range of daily weather forecasts to over two weeks. After a careful assessment of the results from GATE the requirements for the global observing system were specified and the First GARP Global Experiment was implemented from December 1978 to November 1979, with two Special Observation Periods in January/ February and May/ June.
The first “reanalyses” of the FGGE year, the Main Level IIIb analyses, were carried out at ECMWF, Bengtsson et al. (1982), and simultaneously at GFDL, Ploshay et al. (1983). At that time, global data assimilation (e.g Lorenc, 1981), was improving rapidly, and with it forecast quality. The initial aim then was to learn how to use the new global observing systems and special observations deployed. Observing system experiments clearly demonstrated the value of each component, e.g. Uppala et al. (1985). Atmospheric Motion Vectors were proven important for the analysis over tropical regions, whereas retrieved satellite temperature profiles were of paramount importance for the extra-tropical analyses over ocean areas. Aircraft data were an invaluable addition to the global observing system. The drifting buoy data in the southern ocean provided good quality pressure observations with high frequency over data sparse areas. The FGGE reanalysis was later repeated, the Final Level IIIb analyses, with animproved analysis system and improved observation collection and quality at ECMWF , Uppala (1987), and at GFDL, Ploshay et al. (1991).

FGGE reanalyses, through worldwide distribution by the World Data Centers A and B are in many ways the precursors of todays reanalyses, the same logistics apply. Careful preparation, collection and quality control of the input observations together with the validation of the analysis products by numereous scientists have lead to improvements in the assimilation of data and therefore to improved operational and reanalysis products and their applications.
ERA-15 reanalysis of 1979-1993
The FGGE, and later operational analyses, were for several years inspiration in atmospheric research. Soon it was realized that this is not enough, and reanalysis of longer periods was suggested. In parallel with NCEP’sreanalysis activity, Kalnay et al. (1996), ECMWF embarked on its first long reanalysis ERA-15 in collaboration with PCMDI, JMA, WCRP, COLA, NCAR and NCEP. The project had several validation partners and was performed during 1994-1996, (Gibson et al. 1997).
The Optimum Interpolation analysis and the assimilating model at ECMWF had undergone several refinementsand the model resolution of T106L31 was adopted. New input observations were acquired in addition to the ECMWF’s operational archives: NESDIS Cloud Cleared Radiances, FGGE, COADS, ALPEX, JMA, PAOBS and TOGA COARE datasets. New updated boundary forcing fields, monthly GISST until October 1981 and NCEP OI weekly sea surface analyses from then on. The sea ice was determined from SMMR and SSM/I data (Nomura, 1995). ERA-15 assimilated temperature and humidity profiles, which were generated by a 1D-Var physical retrieval of pre-processed HIRS and MSU radiances.
The hydrological cycle was studied in detail and weaknesses were identified. ERA-15 was performing better than NCEP and NASA reanalyses in the extra tropics, but all reanalyses showed excessive precipitation in the tropics. None of the reanalyses had a closed hydrological budget. Due to ERA-15 model spinup the 12 to 24 hour forecast gave the most consistent picture especially in winter over land. Also there was an incorrect southward shift in the ITCZ over Africa in 1987 most likely due to the assimilation and bias correction of satellite data. Despite these deficiencies ERA-15 offered the best available dataset to study daily variability. The signal from El Chichon and Pinatubo eruptions in the lower stratospheric temperature anomaly was well captured from the satellite radiances, while the near surface temperature trends were not considered useful.
ERA-40 reanalysis of 1957-2002
The new variational analysis technique (Courtier et al., 1996) became available soon after completion of ERA-15. A new project, ERA-40 reanalysis of the period 1957-2002 Uppala et al (2005), applied the First Guess at Appropriate Time version of the variational 3D-Var analysis method with a T159L60 model and madecomprehensive use of historical conventional and satellite data, most of them provided by NCAR.
The principal change from ERA-15 in ERA-40’s use of satellite data was its direct variational assimilation of raw radiances, in which basic model variables were adjusted to improve jointly the fits of simulated ‘model equivalent’ radiances to measured radiances, and the fits of the model to other types of observation. Radiances from the VTPR, HIRS, MSU, SSU and AMSU-A instruments were assimilated in this way, following the approach implemented operationally for assimilation of data from AMSU-A, MSU and a small number of HIRS channels. AMSU-A provides microwave temperature-sounding data with greater vertical resolution than MSU, but has been flown only since 1998. This was the first time the VTPR and SSUradiances had been used in multivariate data assimilation. The use of the additional HIRS data also compensated for the absence of microwave humidity data prior to the launch of SSM/I in 1987. In ERA-15 new satellite bias adjustments were calculated on a monthly basis. In ERA-40, the bias tuning for each channel was much more stable. In most cases a single bias adjustment was applied for the lifetime of a

satellite. From August 1987 onwards ERA-40, unlike ERA-15, also assimilated 1D-Var retrievals of TCWV and surface wind speed over sea from SSM/I radiances and surface winds over sea from the scatterometerson the ERS-1 and ERS-2 satellites from 1993 onwards. Altimeter data from the ERS satellites were used in ERA-40’s ocean wave analysis and analysis of ozone was based on SBUV and TOMS ozone retrievals. Inpreparation for ERA-40 EUMETSAT initiated a project to reprocess satellite image data from Meteosat-2 and Meteosat-3 in order to generate meteorological products using their latest algorithms.
The quality of both analyses and observations can be inferred from the comprehensive statistics of observation-minus-background and observation-minus-analysis differences, Figure 1. The background fit in the Northern Hemisphere is closer, more confined and more stable than in the Southern Hemisphere. A general improvement in the fit occurs over the period of ERA-40. The improvement in the background fit at the end of 1978 is a consequence of the major improvement of the overall observing system mentioned before. It is particularly marked in the southern hemisphere, where a distinct improvement can be seen also at the beginning of 1973 when satellite sounder data (VTPR) were first used. The data fits improve gradually from 1979 onwards, more so for the southern than for the northern hemisphere, and become similar for the two hemispheres by the end of the period. These and other results presented in Uppala et al. (2005) indicate a general improvement over time of the post-FGGE observing system, especially for the southern hemisphere.
Figure 1 Daily values of the root-mean-square background (red) and analysis (blue) fits to 12UTC SYNOP and SHIP measurements of surface pressure (hPa) over the extratropical northern and southern hemispheres.
ERA-Interim reanalysis 1989 onwards
After completion of ERA-40 effort was devoted to development of a new reanalysis system derived from the latest version of the operational ECMWF system. In 2006 a new reanalysis was started from January 1989, to produce an interim reanalysis (ERA-Interim) for the data-rich 1990s and 2000s, to be continued as an ECMWF Climate Data Assimilation System (ECDAS) until superseded by a new extended reanalysis. The main advances of the ERA-Interim data assimilation over the ERA-40 system are: 12 hour 4D-Var, T255 horizontal resolution,better formulation of background error constraint, new humidity analysis, improved model physics, quality controlof data drawing on experience from ERA-40 and JRA-25, variational bias correction of satellite radiance data,improvements in radiosonde temperature and surface pressure bias handling, more extensive use of radiances, improved fast radiative transfer model and assimilation of rain affected SSM/I radiances through 1D-Var.ERA-Interim uses mostly the observations prepared for ERA-40 supplemented by data for later years from ECMWF’s operational archive. Boundary forcing fields are taken from ERA-40 until 2001, and from ECMWF operations for later dates. However a few new datasets have been acquired: a uniform ERS altimeter wave-height

dataset from ESA, reprocessed winds and clear-sky radiances from EUMETSAT, reprocessed ozone profiles fromGOME data from the Rutherford Appleton Laboratory from 1995 onwards and CHAMP GPS radio occultation measurements, reprocessed by UCAR. Subsequent occultation data from the constellation of CHAMP, GRACE and COSMIC receivers will be used from ECMWF’s operational archive.
Figure 2 Time series of monthly mean total precipitation rate averaged over Tropical Oceans from the ERA-40, ERA-Interim and JRA-25 reanalyses, from SSM/I retrievals and from GPCP. Units: mm day-1.
Several of the problems experienced in ERA-40 have been eliminated or significantly reduced in ERA-Interim, most notably a too-strong tropical oceanic precipitation that was marked from the early 1990s onwards, Figure 2. Precipitation, which is higher in both ERA-Interim and ERA-40 than in the Global Precipitation Climatology Project (GPCP) over the tropical oceans, is closer to GPCP in ERA-Interim. ERA-40 and ERA-Interim are nevertheless in closer agreement with each other than either is to the GPCP estimate. Total column water vapour from ERA-Interim is significantly lower than from ERA-40 (not shown), and closer to the SSM/I product by Remote Sensing Systems. The excess of precipitation over evaporation seen in ERA-40 is much reduced in ERA-Interim. Precipitation remains higher than evaporation, however, consistent with the indications that rainfall over the tropical oceans is still somewhat too high, notwithstanding uncertainties in the accuracy of the observation-based estimates. ERA-40 also suffers from a too-strong Brewer-Dobson circulation in the stratosphere. The studies of “age of air” in the preparatory assimilations show that ERA-Interim provides a much improved dataset for driving models of stratospheric chemical transport and stratosphere/ troposphere exchange.
Ten-day forecasts were run 12-hourly from both the ERA-40 and ERA-Interim analyses. We can see a substantial improvement in forecast skill of ERA-40 over ECMWF operations for 1989-1990. ERA-Interim in turn improves substantially on ERA-40, especially in the southern hemisphere. The use of 4D-Var in ERA-Interim is likely to be a key factor behind the larger improvement in the southern hemisphere, where a more sophisticated assimilation technique is able to use the satellite data more effectively. Even during 1999-2001 when operations already used 4D-Var and a higher resolution T511 assimilating model ERA-Interim forecasts perform better than operations and more so again in the Southern Hemisphere. Other improvements to the model and the analysis together with the variational radiance bias correction contribute to this. By comparing the performance between 1989-1990 and 1999-2001 on both hemispheres we can conclude that ERA-Interim forecasts have a more uniform quality in time and space than forecasts from the ERA-40, implying a more homogeneous analysis and product quality in ERA-Interim.
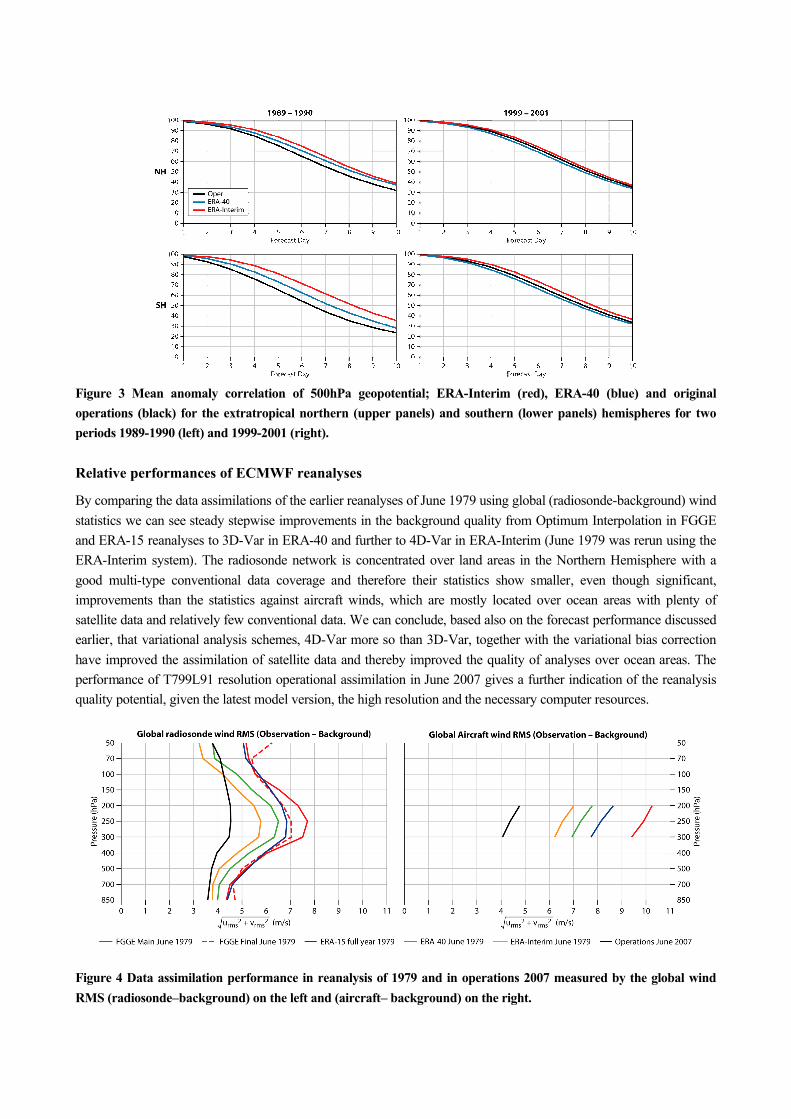
Figure 3 Mean anomaly correlation of 500hPa geopotential; ERA-Interim (red), ERA-40 (blue) and original operations (black) for the extratropical northern (upper panels) and southern (lower panels) hemispheres for two periods 1989-1990 (left) and 1999-2001 (right).
Relative performances of ECMWF reanalyses
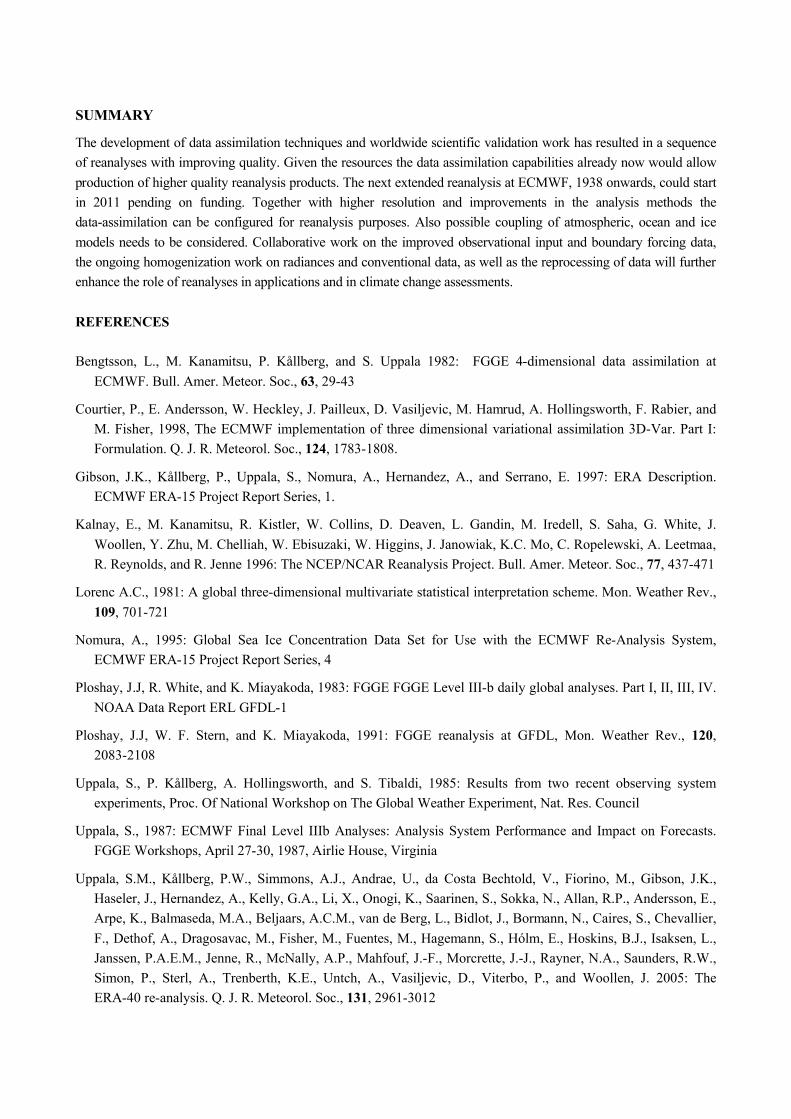
By comparing the data assimilations of the earlier reanalyses of June 1979 using global (radiosonde-background) wind statistics we can see steady stepwise improvements in the background quality from Optimum Interpolation in FGGE and ERA-15 reanalyses to 3D-Var in ERA-40 and further to 4D-Var in ERA-Interim (June 1979 was rerun using the ERA-Interim system). The radiosonde network is concentrated over land areas in the Northern Hemisphere with a good multi-type conventional data coverage and therefore their statistics show smaller, even though significant, improvements than the statistics against aircraft winds, which are mostly located over ocean areas with plenty of satellite data and relatively few conventional data. We can conclude, based also on the forecast performance discussed earlier, that variational analysis schemes, 4D-Var more so than 3D-Var, together with the variational bias correctionhave improved the assimilation of satellite data and thereby improved the quality of analyses over ocean areas. Theperformance of T799L91 resolution operational assimilation in June 2007 gives a further indication of the reanalysis quality potential, given the latest model version, the high resolution and the necessary computer resources.
Figure 4 Data assimilation performance in reanalysis of 1979 and in operations 2007 measured by the global windRMS (radiosonde–background) on the left and (aircraft– background) on the right.
SUMMARY
The development of data assimilation techniques and worldwide scientific validation work has resulted in a sequence of reanalyses with improving quality. Given the resources the data assimilation capabilities already now would allow production of higher quality reanalysis products. The next extended reanalysis at ECMWF, 1938 onwards, could start in 2011 pending on funding. Together with higher resolution and improvements in the analysis methods the data-assimilation can be configured for reanalysis purposes. Also possible coupling of atmospheric, ocean and ice models needs to be considered. Collaborative work on the improved observational input and boundary forcing data,the ongoing homogenization work on radiances and conventional data, as well as the reprocessing of data will further enhance the role of reanalyses in applications and in climate change assessments.
REFERENCES
Bengtsson, L., M. Kanamitsu, P. Kållberg, and S. Uppala 1982: FGGE 4-dimensional data assimilation at ECMWF. Bull. Amer. Meteor. Soc., 63, 29-43
Courtier, P., E. Andersson, W. Heckley, J. Pailleux, D. Vasiljevic, M. Hamrud, A. Hollingsworth, F. Rabier, and M. Fisher, 1998, The ECMWF implementation of three dimensional variational assimilation 3D-Var. Part I: Formulation. Q. J. R. Meteorol. Soc., 124, 1783-1808.
Gibson, J.K., Kållberg, P., Uppala, S., Nomura, A., Hernandez, A., and Serrano, E. 1997: ERA Description. ECMWF ERA-15 Project Report Series, 1.
Kalnay, E., M. Kanamitsu, R. Kistler, W. Collins, D. Deaven, L. Gandin, M. Iredell, S. Saha, G. White, J. Woollen, Y. Zhu, M. Chelliah, W. Ebisuzaki, W. Higgins, J. Janowiak, K.C. Mo, C. Ropelewski, A. Leetmaa, R. Reynolds, and R. Jenne 1996: The NCEP/NCAR Reanalysis Project. Bull. Amer. Meteor. Soc., 77, 437-471
Lorenc A.C., 1981: A global three-dimensional multivariate statistical interpretation scheme. Mon. Weather Rev., 109, 701-721
Nomura, A., 1995: Global Sea Ice Concentration Data Set for Use with the ECMWF Re-Analysis System, ECMWF ERA-15 Project Report Series, 4
Ploshay, J.J, R. White, and K. Miayakoda, 1983: FGGE FGGE Level III-b daily global analyses. Part I, II, III, IV. NOAA Data Report ERL GFDL-1
Ploshay, J.J, W. F. Stern, and K. Miayakoda, 1991: FGGE reanalysis at GFDL, Mon. Weather Rev., 120, 2083-2108
Uppala, S., P. Kållberg, A. Hollingsworth, and S. Tibaldi, 1985: Results from two recent observing system experiments, Proc. Of National Workshop on The Global Weather Experiment, Nat. Res. Council
Uppala, S., 1987: ECMWF Final Level IIIb Analyses: Analysis System Performance and Impact on Forecasts. FGGE Workshops, April 27-30, 1987, Airlie House, Virginia
Uppala, S.M., Kållberg, P.W., Simmons, A.J., Andrae, U., da Costa Bechtold, V., Fiorino, M., Gibson, J.K., Haseler, J., Hernandez, A., Kelly, G.A., Li, X., Onogi, K., Saarinen, S., Sokka, N., Allan, R.P., Andersson, E., Arpe, K., Balmaseda, M.A., Beljaars, A.C.M., van de Berg, L., Bidlot, J., Bormann, N., Caires, S., Chevallier, F., Dethof, A., Dragosavac, M., Fisher, M., Fuentes, M., Hagemann, S., Hólm, E., Hoskins, B.J., Isaksen, L., Janssen, P.A.E.M., Jenne, R., McNally, A.P., Mahfouf, J.-F., Morcrette, J.-J., Rayner, N.A., Saunders, R.W., Simon, P., Sterl, A., Trenberth, K.E., Untch, A., Vasiljevic, D., Viterbo, P., and Woollen, J. 2005: The ERA-40 re-analysis. Q. J. R. Meteorol. Soc., 131, 2961-3012