Evolution of particle size distribution in suspension ...
241
•
Transcript of Evolution of particle size distribution in suspension ...

Loughborough UniversityInstitutional Repository
Evolution of particle sizedistribution in suspensionpolymerisation reactions
This item was submitted to Loughborough University's Institutional Repositoryby the/an author.
Additional Information:
• A Doctoral Thesis. Submitted in partial ful�llment of the requirementsfor the award of Doctor of Philosophy of Loughborough University
Metadata Record: https://dspace.lboro.ac.uk/2134/10300
Publisher: c© Fatemeh Jahanzad
Please cite the published version.

This item was submitted to Loughborough University as a PhD thesis by the author and is made available in the Institutional Repository
(https://dspace.lboro.ac.uk/) under the following Creative Commons Licence conditions.
For the full text of this licence, please go to: http://creativecommons.org/licenses/by-nc-nd/2.5/

University Library
El 11 Loughborough ., University
AuthorlFiling Title ........... JA~:7:~.$? ......................... .
-r Class Mark .................................................................... .
Please note that fines are charged on ALL overdue items.
0402940431
~IIIIIIIIIIIII ~ 11 11111111111 ~I~


--------------------------------------------_.--.
BRITISH·THESIS SERVICE
DX236631
Awarding Body : Loughborough
Thesis By : JAHANZAD Fatemeh
Thesis Title : EVOLUTION OF PARTICLE SIZE DISTRIBUTION IN SUSPENSION POLYMERISATION REACTIONS
We have assigned this thesis the number given at the top of this sheet.
THE BRITISH LIBRARY DOCUMENT SUPPLY CENTRE

EVOLUTION OF PARTICLE SIZE DISTRIBUTION IN
SUSPENSION POLYMERISATION REACTIONS
By
Fatemeh Jahanzad
A Doctoral Thesis
Submitted in partial fulfilment of the requirements for the award of the
Doctor of Philosophy of the Loughborough University
o ,. "" ., • ' .1' ,. "", .
May 2004 "'''''~' . '.' ", . ~'" .~., ".
© by Fatemeh Jahanzad, 2004

~-----,---------~

to my great fami{y ...
specia[(y to my fius6antf, sfiafiriar, for fiis rove, jriemfsfiip, support ani patience
ani to my parents for tfieir rove, support ani encouragement tfirougfiout my stucfies

ACKNOWLEDGEMENTS
I wish to express my sincere gratitude to my supervisor, Professor B.W. Brooks, for his
valuable help and guidance. I would also like to offer my sincerest thanks and
appreciation to my husband, Dr Shahriar Sajjadi, for his support, help, and consultation.
Grateful appreciation is extended to Professor Wakeman, Head of the Department of
Chemical Engineering, and to Professor Rielly my director of research.
It is pleasing to acknowledge the help of Mr A. Milne the laboratory technician and Mr
Frank Page the operator of scanning electron microscope.
I also value the provision given to me by Loughborough University in funding my
studentship.

TABLE OF CONTENTS
ABSTRACT 1
INTRODUCTION 3
CHAPTER ONE LITERATURE REVIEW
Introduction 4
1.1 Liquid-liquid Dispersion 6
1.1.1 Turbulent flow 7
1.1.3 Drop break up 8
1.1.4 Drop coalescence 10
1.1.5 Evolution of drop size average and distribution 13
1.1.6 Stabilisation and stabilisers 18
1.2 Suspension Polymerisation 20
1.2.1 Kinetics of free-radical polymerisation 21
1.2.2 Diffusion-controlled reactions 23
1.2.3 Heterogeneous nature of suspension polymerisation 25
1.2.4 Particle size average and distribution 26
1.2.5 New developments 28
1.3 Modelling of Suspension Polymerisation 29
1.3.1 Free-radical polymerisation 31
1.3.2 Particle size distribution 35
1.3.3 Conclusions 41
OUTLINE OF THE RESEARCH 42
CHAPTER Two EXPERIMENTAL PROCEDURES
2.1 Materials 43

2.2 Experimental
2.3 Measurements
2.3.1 Conversion
2.3.2 Drop/Particle size distribution
2.3.3 Interfacial Tension
2.3.4 Aqueous-phase monomer concentration
CHAP'IER THREE EXPERIMENTAL RESULTS AND DISCUSSION
Introduction
3.1 Effect of PV A Concentration
3.2 Effect ofLPO and n-DDM Concentration
3.3 Effect of Inhibition
3.4 Effect of Temperature
3.5 Effect of Agitation Speed
3.6 Effect of MMA Hold up
CHAP'IER FOUR MATHEMATICAL MODELLING
43
44
45
45
53
53
55
56
85
98
114
128
139
Introduction 153
4.1 Population Balance Modelling 154
4.1.1 Break up 155
4.1.2 Satellite Droplets 157
4.1.3 Coalescence 157
4.1.4 Number of Particles and Mean Particle Size 159
4.2 Modelling of Free-Radical Polymerisation 160
4.2.1 Kinetics 160
4.2.2 Polymer Molecular Weights 162
4.2.3 Diffusion-Controlled Propagation and Termination 162
4.2.4 Rheological Properties 163
4.3 Modelling of Stabiliser Partitioning 163
4.4 Modelling of Monomer Partitioning 163

4.5 Numerical Solution of the Model
4.6 Model Implementation
4.7 Model Validation
4.8 Application of the Model
4.2.1 Numerical Parameters
4.8.2 Model Predictions: Kinetics of Polymerisation
4.8.3 Model Predictions: DroplParticle Size average and
Distribution
4.9 Conclusions
GENERAL CONCLUSIONS
RECOMMENDATIONS FOR FuRTIIER WORK
NOMENCLATURE
REFERENCES
ApPENDICES
Appendix A. Experimental Reproducibility
Appendix B. Malvern Particle Sizer
Appendix C. Du Nouy Ring Tensiometry
Appendix D. Gas-Liquid Chromatography
Appendix E. Suspension Polymerisation of Styrene
Appendix F. Micrographs
Appendix G. "On the Evolution of Particle Size Average and Size
Distribution in Suspension Polymerization Processes"
165
166
167
169
169
172
176
184
185
189
190
193
207
209
210
211
212
216

ABSTRACT
ABSTRACT
Suspension polymerisation processes are commercially important for the production of
polymer beads having wide applications. Polymers produced by suspension
polymerisation can be directly used for particular applications such as chromatographic
separations and ion-exchange resins. Particle Size Distribution (PSD) may appreciably
influence the performance of the final product. Therefore, the evolution of PSD is a
major concern in the design of a suspension polymerisation process.
In this research, methyl methacrylate (MMA) has been used as a model monomer. A
comparative study of MMA suspension polymerisation and MMNwater dispersion was
carried out, for the first time, to elaborate the evolution of mean particle size and
distribution. Polyvinyl alcohol (PVA) and Lauroyl Peroxide (LPO) have been used as
stabiliser and initiator, respectively. Polymerisation experiments were carried out using
a 1-litre jacketed glass reactor equipped with a turbine impeller and a condenser. The
stabiliser, initiator and chain transfer concentrations, inhibitor concentration and type,
reaction temperature, impeller speed, and monomer hold up were used as variables. A
mathematical model was developed to predict the kinetics of polymerisation as well as
the evolution of PSD by population balance modelling. The experimental results were
compared with the model predictions.
From the comprehensive experimental results, the characteristic intervals of a typical
suspension polymerisation were realised as:
1) Transition stage during which PSD narrows dramatically and drop size decreases
exponentially due to higher rate of drop break up in comparison with drop coalescence
. _ until a steady state is reached. The importance, and even the existence, of the transition
stage have been totally ignored in the literature. The results indicate that increasing the
impeller speed, and PV A concentration will lead to a shorter transition period. Also
increasing the rate of reaction, via increasing initiator concentration, and reaction
temperature will shorten this period.

ABSTRACT
2) Quasi steady-state stage during which the rate of drop break up and drop coalescence
are almost balanced leading to a steady-state drop size and distribution. The occurrence
of this stage is conditional. Low impeller speed and PV A concentration may remove the
quasi steady-state stage completely and drops may start growing considerably after a
sharp decrease in size during the transition stage.
3) Growth stage during which the rate of drop break up considerably falls below the
rate of drop coalescence due to the viscosity build up in drops leading to drop
enlargement and PSD broadening. Results show that the onset of the growth stage may
not be fixed and it depends on the balance of the forces acting on drops. The onset of
the growth stage in terms of time was advanced with decreasing stirring speed and PV A
concentration and increasing monomer hold up. Under a static steady state, which is
formed when a high concentration of PV A is used, there is almost no growth.
4) Identification stage during which a solid-liquid suspension is attained and the PSD
and mean particle size remain unchanged afterwards. The onset of this stage appears to
be fairly constant for different formulations.
The developed model could fairly predict the rate of polymerisation. It was also capable
of predicting the evolution of particle size average and distribution qualitatively in the
course of polymerisation. The results can be used as a guideline for the control of
particle size and distribution in suspension polymerisation reactors. A more quantitative
exploitation of the model has been left for a future research.
2

IN1RODUCTION
INTRODUCTION
Suspension polymerisation is widely used in industry to produce polymer beads for a
variety of applications such as vinyl chloride homo- and copolymers, styrene
homopolymers including general purpose, expandable, and, high impact polystyrene
and co- or ter-polymers (such as poly(styrene-acrylonitrile), and poly(acrylonitrile
butadiene-styrene), and methyl methacrylate homo- and coplymers. Apart from these
commodity products, there are "high value added" products, such as high surface area
polystyrene and polyacrylate-based beads with applications in chromatographic
separation media as ion exchange resins and as supports for enzyme immobilisation.
With the increasing growth of biotechnology, and the increasing importance of
immobilised substrates, demands are steadily growing for the large-scale production of
base support materials.
For many applications beads with consistent quality and a size distribution as narrow as
possible are required. Despite the fact that suspension polymerisation is a rather old
technology, much was not known about this process until the 1990s when the
importance of this process for production of polymer bead supports was realised. There
are thus considerable incentives for understanding suspension polymerisation processes.
The literature related to the suspension polymerisation is not vast, and several
controversial issues are still being studied, and universally accepted conclusions are
scarce. A major property of the suspension resulting from a suspension polymerisation
is the size of particles. Control of the bead particle size, which is the key to guarantee
the quality of bead products, is becoming of great industrial importance, as the
production of an increasing number of products involves suspension polymerisation
processes. The qualitative understanding of the quantities, which control both the
average particle size and the PSD, is quite important. The objective of this research
work is to investigate the effect of various reaction and mixing parameters on the
evolution of particle size and size distribution in suspension polymerisation reactors.
3

CHAPTER ONE LITERATURE REVIEW
CHAPTER ONE
LITERATURE REVIEW
INTRODUCTION
The term "suspension polymerisation" describes a process in which monomer is
dispersed in the water phase, with the aid of mixing and suspending agents (stabilisers),
and transformed to polymer "bead" or "pearl" particles. Suspension polymerisation
produces polymer beads, typically with the diameter in the range of iO Jlffi to 5 mm.
Suspension polymerisation has the following advantages compared with the other free
radical polymerisation processes (bulk, solution, and emulsion): easy heat removal and
temperature control; low dispersion viscosity; low levels of impurities in the polymer
product (compared with emulsion polymerisation); low separation costs (compared with
emulsion polymerisation); and final product in particle form. On the other hand, among
the disadvantages of suspension polymerisation one may refer to lower productivity for
the same reactor capacity (compared with bulk); wastewater problems; polymer build
up on the reactor wall, baffles, agitators, and other surfaces; no commercial continuous
process operability yet; and difficulty in producing homogenous copolymer
composition with suspension versus emulsion polymerisation because of the lower
interfacial area (particle/water).
Traditionally, a number of important commercial resins are manufactured by this
process, including poly(vinyl chloride) (PVC) and copolymers, styrene resins (general
purpose polystyrene, expandable polystyrene (EPS), high impact polystyrene (HIPS),
poly(styrene-acrylonitrile) (SAN), poly(acrylonitrile-butadiene-styrene) (ABS), styrenic
ion-exchange resins, poly(methyl methacrylate) (PMMA) and copolymers, poly(vinyl
acetate), etc.
High surface area polystyrene and polyacrylate-based beads have become increasingly
important in chromatographic separation media (e.g.; as ion exchange resins and as
4

CHAP1ERONE LITERATURE REVIEW
supports for enzyme immobilisation) as sorbents both for liquid and gas phase streams
and have found a wide demand in the areas of interpenetrating polymer networks,
thermally and chemically resistant materials and optical materials. With the increasing
growth of biotechnology, and the increasing importance of immobilised substrates,
demands are steadily growing for the large-scale production of base support materials.
For such applications beads with consistent quality and a size distribution as narrow as
possible are required. Despite the fact that the first suspension polymerisation reaction
was carried out some 80 years ago, much was not known about this process until the
1990s when the importance of this process for production of polymer bead supports was
realised.
Inverse (or reversed-phase) suspension polymerisation processes have been developed
to polymerise polar monomers, such as acrylamide (e.g., Dimonie et al., 1982; Lee et
al., 200 l). The so-called water-in-oil suspension polymerisation comprises an aqueous
solution, containing the hydrophilic monomer(s) and initiator(s), which is dispersed in a
nonpolar hydrocarbon media and polymerised. The use of perflourocarbon fluids has
extended the scope ofthe suspension polymerisation method to monomers and initiators
that can not be used due to their high solubility and reactivity in conventional
suspension media (Zhu, 1996).
In a suspension polymerisation process, monomer is initially dispersed in the water
phase, with the aid of mixing and suspending agents (stabilisers), to form a liquid-liquid
dispersion. Subsequent polymerisation inside drops transforms the liquid monomer
drops into solid polymer particles. Therefore, the study of liquid-liquid dispersion
seems to be the first step toward the understanding of the major mechanisms involved
in a typical suspension polymerisation reactor. On the other hand, the kinetics of
polymerisation reactions and the continuous variation of intrinsic properties of drops
affect the particle size and particle size distribution dramatically.
In order to study the variations of particle size and particle size distribution in a
suspension polymerisation process one should have an understanding of liquid-liquid
dispersions and the effects of different mixing parameters on drop size and drop size
distribution, on one side, and the kinetics of the polymerisation reactions and effect of
5

CHAPTER ONE LITERATURE REVIEW
varying viscoelastic properties of drops on the particle size, on the other side, and the
interactions between these two phenomena.
In this chapter the main features of liquid-liquid dispersions are discussed first. Then an
overall view of the kinetics of polymerisation reactions and effects of these reactions on
the nature of the drops are presented. In the last section of this chapter a brief review of
the mathematical modelling of liquid-liquid dispersions and suspension polymerisation
reactors are presented. The reader should note that some literature review has been
given in the "introduction" of the result sections in chapter 3. Those reviews are not
repeated here.
1.1 LIQUID-LIQUID DISPERSION
Liquid-liquid dispersions play an important role in many industrial processes including
heterogeneous chemical reactions, extraction, emulsion and suspension polymerisation,
and emulsion preparation. Stirred tanks represent the most popular equipment to carry
out these operations. The geometry and scale of the vessel and impeller, agitation rate
and physical properties of the mixed phases, determine the drop breakage and
coalescence rates and resulting drop size distributions.
Dispersing a liquid into another immiscible liquid with the help of agitation makes
drops of dispersed liquid (dispersed phase) suspended in the continuous liquid (phase).
Liquid-liquid dispersions are extremely unstable and separate into two phases if
agitation is ceased. To acquire a sufficient stability, a third component, called a
suifactant or emulsifier is required. Surfactants will reduce the interfacial tension and
assist the drop break up. Furthermore, they hinder drop coalescence by adsorption on
the surface of drops. In the terminology of the suspension polymerisation technology,
these materials are usually referred to as stabilisers.
Liquid-liquid dispersions can be in laminar, intermediate or turbulent regions depending
on the intensity of energy dissipation rate or the intensity of the agitation. The value of
tank Reynolds' Number (Rer) is a criterion used to measure the intensity of agitation.
For Rer> 104 the liquid-liquid dispersion is considered to be under turbulent conditions.
For most suspension polymerisations processes this condition is valid and so only the
turbulent flow and its features are discussed here. Drop break up and coalescence in
6

CHAP1ERONE LITERATURE REVIEW
stirred tanks with a turbulent flow are of prime importance because of their drastic
influence on the size of drops.
In this section the concepts corresponding to liquid-liquid dispersions (break up,
coalescence, mean drop size and drop size distribution) are discussed and then a brief
review of the role of stabilisers in liquid-liquid dispersions is presented.
1.1.1 Turbulentflow
Turbulent flow in a stirred tank is an irregular condition of flow in which various
components show a random variation with time and space so that statistically distinct
average values can be determined (Hinze, 1987). The fluctuations of velocity due to a
random character of a turbulent flow will result in a range of frequencies. It is assumed
that the fluid eddies are sized from large to small. Large eddies transfer their kinetic
energy to the smaller ones until the kinetic energy is transferred to the smallest eddies.
The transfer takes place without energy dissipation. But the smallest eddies dissipate
the kinetic energy as heat to overcome the viscous forces. The macroscale of
turbulence, I, is defined as the scale of large eddies and is approximated by the width of
the impeIler. The micro scale of turbulence '1 is defined as the scale of the smallest or
maximum energy dissipation eddies (Kolmogoroff, 1941).
The relative velocity fluctuation components are defined as root mean square values in
three space coordinates. If the volume under consideration is small enough compared to
the macroscale of turbulence, I, the local isotropy can be considered and so the relative
velocity between two points in a very small volume is independent of the radius vector
of two points (Kolmogoroff, 1941; Shinnar and Church, 1960).
For high levels of turbulence, high tank Reynolds number (ReT> 1 04), the range of
energy containing eddies (large eddies) and the range of maximum dissipation eddies
(the smallest eddies) are sufficiently far apart (l»1l) and the smallest eddies are
independent from the large eddies. For this case Kolmogoroff (1941) postulated that the
turbulence is statistically in eqUilibrium and uniquely determined by the energy
dissipation per unit mass (E) and kinematic viscosity (v). This range is called the
universal equilibrium range and is subdivided to two subranges: the inertial subrange
where the velocity fluctuation for two points with distance d (u2(d» is independent of v
and solely dependent on E,
7
CHAP'IER ONE LITERATURE REVIEW
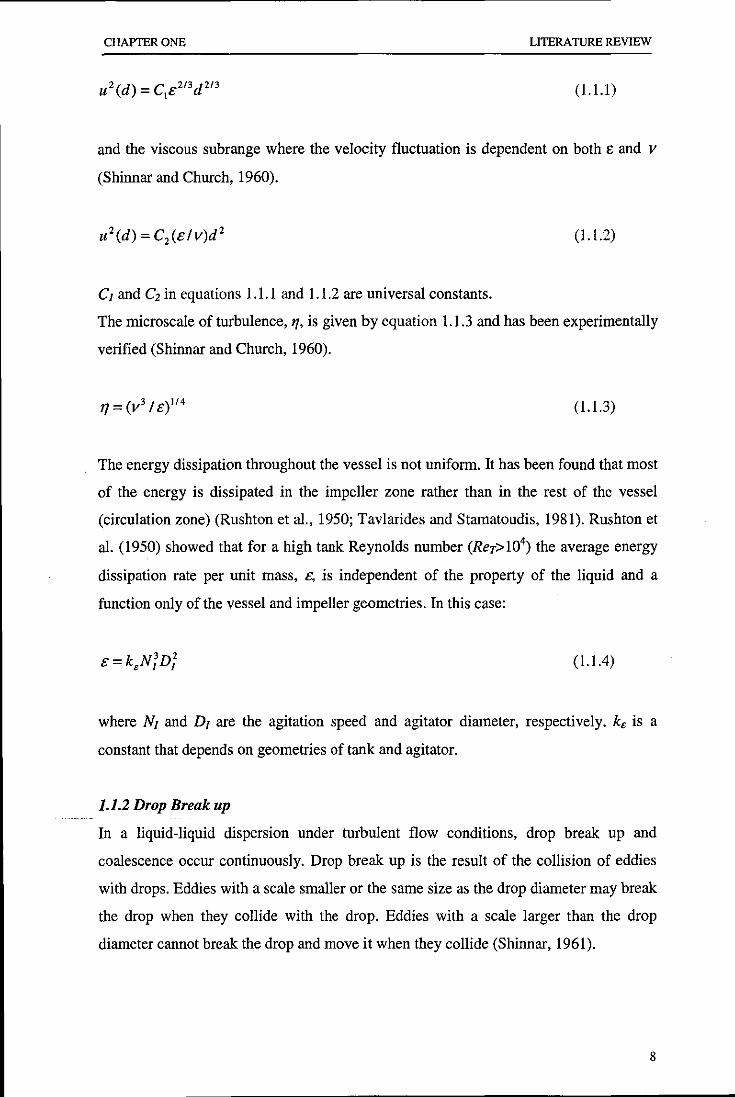
(1.1.1)
and the viscous subrange where the velocity fluctuation is dependent on both e and v
(Shinnar and Church, 1960).
(1.1.2)
Cl and C2 in equations 1.1.1 and 1.1.2 are universal constants.
The microscale of turbulence, 1'/, is given by equation 1.1.3 and has been experimentally
verified (Shinnar and Church, 1960).
( 1.1.3)
The energy dissipation throughout the vessel is not uniform. It has been found that most
of the energy is dissipated in the impeJIer zone rather than in the rest of the vessel
(circulation zone) (Rushton et al., 1950; Tavlarides and Stamatoudis, 1981). Rushton et
al. (1950) showed that for a high tank Reynolds number (ReT> 104) the average energy
dissipation rate per unit mass, £, is independent of the property of the liquid and a
function only of the vessel and impeIIer geometries. In this case:
(!.l.4)
where NI and D/ are the agitation speed and agitator diameter, respectively. k, is a
constant that depends on geometries of tank and agitator.
1.1.2 Drop Break up
In a liquid-liquid dispersion under turbulent flow conditions, drop break up and
coalescence occur continuously. Drop break up is the result of the collision of eddies
with drops. Eddies with a scale smaller or the same size as the drop diameter may break
the drop when they collide with the drop. Eddies with a scale larger than the drop
diameter cannot break the drop and move it when they collide (Shinnar, 1961).
8

CHAPTER ONE LITERATURE REVIEW
If the average diameter of drops is much larger than the microscale of turbulence but
still much smaller than the macroscale of turbulence (l»d»I/), the system is in inertial
subrange. Under such conditions equation 1.1.1 is valid and drops break up due to
velocity fluctuations. For drop diameters smaller than 1/, break up is the result of
viscous shear forces (Shinnar, 1961).
Whether or not a drop can be broken depends on the relative magnitude of the restoring
forces and the external deforming forces. In other words, a drop can be broken only
when it gains enough energy to compensate for the interface energy increase due to an
increase in the total surface area and viscous energy of drop. The main external
deforming forces are turbulent pressure fluctuations and viscous stress and the restoring
forces are mainly due to the interfacial tension and internal viscous stress. Under the
condition of inertial subrange (l»d»I/), the external viscous stress is negligible
compared to turbulent pressure fluctuations. Hinze (1955) introduced two
dimensionless groups to account for the force balance when both interfacial tension and
dispersed phase viscous forces contribute to drop stability. One is a generalised Weber
group, We, which is the ratio of turbulent energy to interfacial energy, and the other is a
viscosity group, Vi, which is the ratio of internal viscous energy to interfacial energy of
a drop with diameter d:
Vi = lid ~PddO"
( 1.1.5)
( 1.1.6)
where /1d is the dispersed-phase viscosity, and O"is the interfacial tension. Hinze (1955)
further postulated that a drop would break up at a critical Weber number which
increases with Vi number according to the following equation:
We = C3 [1 + f(Vi)l (1.1.7)
wherefis a function of Vi.
9

CHAPTER ONE LITERATURE REVIEW
Maximum stable drop size. According to equation 1.1.7, for the case of negligible
dispersed-phase viscosity, C3 is the critical value of We for inviscid dispersions, leading
to the determination of the maximum stable drop size (dmax), above it the drop will
definitively break up. Equation 1.1.8 is a well-known expression for the maximum
stable drop diameter for inviscid, low hold up dispersions (negligible coalescence):
d _ _ K TIT -3/5 - K N-1.2 - lyye - 2 I
D{ (1.1.8)
where Kt and K2 are constants (Shinnar, 1961).
For non-negligible values of Vi, Calabrese et al. (1986) derived the following equation
for maximum stable drop size, where K3 and K4 are constants:
[ ( P
)
1/2 f.l e"3 d l / 1 K l+K _, d ~'I
3 4 P 0' d ~
( 1.1.9) 0'
Arai et al. (1977) derived the maximum stable drop size by considering the Voigt model
that simultaneously takes the interfacial tension (restoring force) and viscous dissipation
into account. Further works (Lagisetty et a1. 1986; Koshi et al. 1988a and 1988b;
Gandhi and Kumar, 1990) improved this model by incorporating the power law models
for viscous fluids, and the effect of surfactant on the maximum stable drop size. Koshi
et al. (l988b) were the first who considered the viscoelastic feature of the dispersed
phase and proposed a model to predict the maximum stable drop size. They showed that
some of the kinetic energy of the eddy is restored by the elastic mode of the viscoelastic
fluid and so more energetic eddies or larger eddies are needed, in comparison to a
purely viscous fluid, to break a drop.
1.1.3 Drop Coalescence
The coalescence phenomenon is more complex than break up, since it involves not only
the approach of two drops, but also the drainage and eventual rupture of the intervening
liquid film, in which the physical properties of fluids and interface play an important
role. The rate of droplet coalescence is controlled by liquid drainage in the film between
approaching droplets, and more significantly, the rigidity of the two corresponding
10

CHAP1ERONE LITERATURE REVIEW
oil/water interfaces, since this controls the damping of thermally or mechanically
induced oscillation in the film thickness.
Drop coalescence rate can be expressed by the product of drop collision frequency and
coalescence probability or efficiency. Collision frequency of drops has been treated in a
similar way to the collision frequency of ideal gas molecules (kinetic theory of gases)
(Howarth, 1964; Abrahamson, 1975; Coulaloglou and Tavlarides, 1977). The proposed
correlation for collision frequency is presented in Chapter 4.
Coalescence probability or coalescence efficiency has been the subject of many
investigations (Coulaloglou and Tavlarides, 1977; Ross et aI., 1978; Sovova, 1981a;
Valadez-Gounzalez, 1988; Alvarez et aI., 1991; 1994; Liu and Li, 1999). Coalescence
efficiency depends on the physical and rheological properties of two phases as well as
interface properties. When two drops collide due to the turbulent flow they stay together
for a short time before they separate. Meanwhile, a film of continuous phase is trapped
between the two drops and it should be drained and ruptured before coalescence can
occur. The contact or interaction time of colliding drops (ti) and the coalescence time
(te), or the time required for film drainage and rupture, are important parameters
characterising the process of coalescence. The larger the ratio of te to t;, the less the
probability of coalescence. The coalescence, efficiency (A,,) can be defined as
(Coulaloglou and Tavlarides, 1977; Ross et al., 1978; Chesters, 1991):
Ac = exp(-t, Iti ) (1.1.10)
Assuming that the eddies in the inertial subrange are responsible for the motion of
drops, Levich (1962) estimated the average contact time between two equal-size drops
in turbulent flow as:
(1.1.11)
Coulaloglou and Tavlarides (1977) derived expressions for coalescence efficiency of
deformable and rigid drops. For deformable drops they predicted that coalescence
efficiency favours the coalescence of the small drops. Later Sovova (l981a) proposed
an expression for A" which promotes coalescence of larger drops for deformable drops.
11

CHAPTER ONE LITERATURE REVIEW
He used the ratio of interfacial energy over the energy of collision for calculating the
coalescence efficiency.
In pure dispersions, in the absence of any stabiliser, the oil/water interfaces are mobile
when the dispersed phase viscosity is small. In the presence of stabiliser the interfacial
mobility is retarded. Liu and Li (1999) have proposed correlations for coalescence time
for mobile and immobile systems for Newtonian fluids. They showed that for mobile
interfaces the coalescence time is shorter than that for immobile interfaces. In other
words, the rate drop coalescence for immobile interfaces (dispersion with stabiliser) is
smaller than mobile interfaces (pure system). Liu and Li (1999) also derived the
coalescence efficiency, using equation 1.1.10, and found that any increase in turbulence
intensity increases the coalescence time and so decreases the coalescence efficiency.
Hashim (2001) studied the effect of viscosity of dispersed phase on the rate of
coalescence. He showed experimentally that increasing the dispersed-phase viscosity
decreases the rate of coalescence. However, he has found that at higher agitation speeds
any increase in dispersed-phase viscosity causes an increase in the rate of coalescence.
The group of Alvarez (Valadez-GounzaIez, 1988; Alvarez et al., 1991; 1994) were the
first who proposed a model for drop coalescence in suspension polymerisation
considering rheological (viscoelastic) behaviour of polymers. More details of their
model are presented in the modelling section of this chapter and also chapter 4.
Minimum stable drop size. The minimum stable drop size (dmin) in a liquid-liquid
dispersion has been estimated from the condition that the turbulent energy imposed on a
pair of drops is not enough, when they contact, to prevent their adhesion and, finally,
coalescence (Shinnar and Church, 1960):
(i.1.l2)
where Ks and K6 are constants.
In a turbulence-stabilised dispersion all drops are larger than druin and smaller than d max•
According to equations 1.1.8 and 1.1.12, both dmax and dmin decrease with increasing
agitation speed (or energy dissipation rate), although dm• x decreases more rapidly than
12

CHAP'IERONE LI1ERATURE REVIEW
dmin. Church and Shinnar (1961) showed that after a critical value of energy dissipation
rate (&.tax), dmin becomes larger than d max and the dispersion is unstable. Under this
condition turbulence is unable to prevent coalescence and drops coalesce and break up
rapidly.
Zhou and Kresta (1998) showed that the microscale of turbulence (17) can not be a
proper estimation for the minimum drop size in liquid-liquid dispersions, due to satellite
formation through drop break up. A significant number of drops (up to 30%) smaller
than 17 were measured by them for various reactor and agitator geometries. Zhou and
Kresta (1998) found that with increasing agitation speed the minimum drop size
approaches the microscale of turbulence, since coalescence becomes more significant.
Liu and Li (1999) proposed correlations for minimum stable drop size for mobile and
immobile interfaces for Newtonian fluids. They found that an important difference
between the two limiting cases, i.e., drops with mobile interfaces and those with
immobile interfaces, lies in the effect of dispersed-phase viscosity. Increasing the
viscosity of dispersed phase in mobile-interface systems leads to partial immobility of
the interface and so decreases the probability of coalescence. For immobile interfaces
the minimum stable drop diameter is independent of dispersed-phase viscosity for low
hold up and a weak function of it for high hold up systems.
1.1.4 Evolution of drop size average and distribution
1.1.4.1 Definitions
Drop size average and distributions are two important parameters, which quantify the
properties of a dispersion/suspension. Before proceeding, it is essential that these
properties are defined.
Mean drop Size. Several mean drop size can be defined for a drop size distribution. For
example number (dn), volume (dv), and weight (d,,) average drop sizes are defined as
follows:
" Nd d =L... , , n IN, (1.1.13)
13

CHAPTER ONE LITERATURE REVIEW
(1.1.14)
(1.1.15)
where N j is the number of drops with diameter d j • In liquid-liquid dispersions the most
useful mean drop size is the surface average diameter or the Sauter mean diameter (d32)
since it is directly related to the dispersed-phase volume fraction (I/Jd) and the interfacial
area per unit volume of continuous phase (a):
(1.1.16)
From the commercial point of view, weight average size seems to be the most important
one because it reflects the average size of larger particles, which are usually considered
as the main product. In many suspension polymerisation processes, small particles,
though important in terms of surface area, are not considered economically valuable
and are discharged into the wastewater during washing and/or screening.
Drop size distribution (DSD): A major property of dispersions is the size distribution of
the drops, in addition to the average size of drops. In fact, the average drop size is
calculated from the full drop size distribution. The drop size distribution in a mixing
vessel is largely dependent on the micro- and macro-size turbulent motions and flow
patterns in the mixing vessel because the mutual relation between energy dissipation
rate, residence time of drops at a certain location in the vessel, and the rates of drop
break: up and coalescence decides the drop size distribution. From measurements of
DSD, and the time evolution of this property, mechanistic information can be gained
about the mechanism of drop break: up and coalescence (Shinnar, 1961; Nishikawa et
al., 1991).
Data for drop size distribution may be illustrated usmg either differentiated size
distribution (fraction of drops with diameter between d and d+&!), or cumulative size
14

CHAPTER ONE L11ERA TURE REVIEW
distribution (fraction of drops with diameter::; d). The fraction of drops can be either
volume fraction, number fraction, or weight fraction. Volume density distribution and
diameter density distribution have also been defined by dividing the fraction of drops in
a certain size by the bin volume (~v) and bin diameter (~d), respectively. As a result, a
density distribution is normalised and its surface area is equal to 1.
1.1.4.2 Average Drop Size
The formation of dispersions is governed by two competing processes; drop break-up
and drop coalescence. Initially, the bulk of the liquid in the dispersed phase breaks up to
produce smaller drops and, simultaneously, the drops coalesce to form larger drops. The
drop breakage rate dominates the drop coalescence rate in the initial stage of stirring,
which causes drop sizes to decrease with time (Narsimhan et al.,1980). As stirring
proceeds, the drop breakage rate decreases while drop coalescence rate increases.
Ultimately, a steady state is reached where the rate of both processes become equal, and
a steady-state drop size distribution is established. Hong and Lee (1983) indicated that
the average drop size during the initial period of mixing decreases and that the
minimum transition time depends on the mixing and system's physical properties.
Most of the research work on liquid-liquid dispersions have focused on the steady-state
size of drops. Shinnar (1961) proposed that for systems where drop size is controlled by
break up, d32 ", dmax, whereas for systems where drop size is controlled by coalescence,
d32 ", drnin. Sprow (1967) showed that Sauter mean diameter is proportional to maximum
stable drop size in dilute dispersions:
(1.1.17)
where C has been found experimentally in the range of 0.38 to 0.70 for various systems
(Zhou and Kresta, 1998). However, Pacek et al. (1998) performed a number of
dispersion experiments in a specific reactor/agitator geometry and showed that C, in
equation 1.1.17, decreases with increasing agitation speed and so d32 is not a constant
fraction of dmax in dilute dispersions. It has been shown that d32 can be correlated with
the maximum energy dissipation rate, rather than the mean rate of dissipation rate, and
the circulation time (Zerfa and Brooks, 1996; Pacek et al., 1998).
15

CHAPlERONE LITERA TORE REVIEW
In liquid-liquid dispersions the mean drop diameter at steady state increases with
increasing dispersed-phase viscosity, hold up, and interfacial tension (Doulah, 1975;
Park and Blair, 1975; Delichatsios and Probstein, 1976; Lagisetty et aI., 1986;
Calabrese et al., 1986; Nishikawa et aI., 1987; Gandhi and Kumar, 1990; Kumar et aI.,
1991) and decreasing agitation speed (Shinnar, 1961; Sprow, 1967; Iohnson, 1980;
Chatzi and Kiparissides, 1994; Lazrak et aI., 1998, Maggioris et al., 2000; Yang et aI.,
2000).
1.1.4.3 Drop Size Distribution (DSD)
Hong and Lee (1983) indicated that the average drop size during the initial period of
mixing decreases exponentially while the size distribution changes less drastically from
wide to narrow. The size distribution of drops at the steady state does not vary with
time. Many investigators have studied drop size distributions in liquid-liquid
dispersions (Chen and Middleman, 1967; Van Heuven and Hoevenaarj, 1969; Brown
and Pit, 1974; Chatzi and Kiparissides, 1992; 1994; 1995; Calebrese et al., 1986;
Nishikawa et ai, 1991; Zhou and Kresta, 1998; Pacek et al., 1998). They have reported
that the volume drop size distribution can be represented by a normal, log-normal, or
gamma distribution, or a combination of normal distributions to cover all drop size
ranges including small, intermediate and large sizes.
Bimodal drop size distributions have been reported by a number of investigators (Ward
and Knudsen, 1967; Brown and Pitt, 1972; Konno et aI., 1982; Hong and Lee, 1985;
Laso et al., 1987; Chatzi et aI., 1991; VilIalobos, 1993; Pacek et al., 1998). Non
homogeneity of turbulent flows and formation of satellite drops via drop break up have
been mentioned as possible reasons of bimodality of the drop size distributions (Chatzi
and Kiparissides, 1991; Vivaldo-Lima et al., 1997).
Nonhomogenous environments: It has been shown that in a stirred tank, coalescence
and drop break up occur in different regions of the reactor. Coalescence is found to
occur predominantly in the region of circulating flow (where the shear stress is least),
whereas droplet break up is found to occur mainly in regions of high shear, such as in
the vicinity of the agitator (Coulaloglou and Tavlarides, 1976; Clark, 1988). This
nonhomogeneity is at least one of those factors that are responsible for bimodal particle
size distributions in suspension polymerisation processes (Vivaldo-Lima et al., 1997).
16

CHAP1ERONE LITERATURE REVIEW
Mechanism of drop break up: Another factor that can be responsible for bimodality of
particle size distribution is simply the drop break up mechanism. The mechanism of
drop break up is affected by the size of the mother drop, the agitation speed and the
viscosity of the drop (Kuriyama et al., 1995). For dispersions with a low-viscosity
dispersed phase it has been found that drops burst and several smaller drops are
obtained (Ali et al., 1981; Chang et al., 1981). Chatzi and Kiparissides (1992; 1994;
1995) proposed a model in which the drops break up into daughter drops and a number
of satellite drops with a large ratio of daughter to satellite drop volume. This model
could predict their experimental results very well.
With increasing the viscosity of the drop, the number of drops formed by breaking of a
mother drop increases and broadens in the size range. This is because the mechanism of
drop break up shifts from bursting towards stretching as the resistance to break up
increases. As a result a broadlbimodal drop size distribution is obtained (Ali et aI.,
1981; Chang et al., 1981; Calabrese et al., 1986a; Kuriyama et al., 1995). In drop break
up through stretching, the drop is stretched and forms a dumbbell-like shape and then
breaks to two large daughter drops (stripping of the two ends of the dumbbell) and
several satellite droplets (fragmentation of the liquid thread connecting the daughter
drops).
Calabrese et al. (1986a) observed that with increasing drop viscosity, the size of largest
drops increased while their number decreased, and the size of the smallest drops
decreased while their number increased. They assumed that at higher drop viscosities
C,u,t> 1 Pa.sec) an extreme form of stretching may predominate by which the fracture of
highly elongated dumbbells produces satellite droplets. Alternatively, break up may
only occur close to impeller surfaces and may therefore be more erosive (stripping of
small satellite droplets from the mother drop).
The effects of mixing variables on the size distribution of drops and their averages have
been extensively studied. In liquid-liquid dispersions drop size distribution become
narrower and shifts to a smaller size range with an increase in the agitation speed, and
temperature and decreasing the interfacial tension and dispersed-phase hold up (Ross et
al., 1978; Chatzi et aI., 1991; Chatzi and Kiparissides, 1994; Pacek et aI., 1998). An
increase of agitation speed or a decrease of interfacial tension causes a reduction of the
17
CHAP1ERONE LITERATURE REVIEW
minimum transition time, and thus allowing the system to approach equilibrium faster
(Chatzi et al., 1991). Drop size distribution broadens with an increase in the dispersed
phase viscosity (Calabrese et al., 1986).
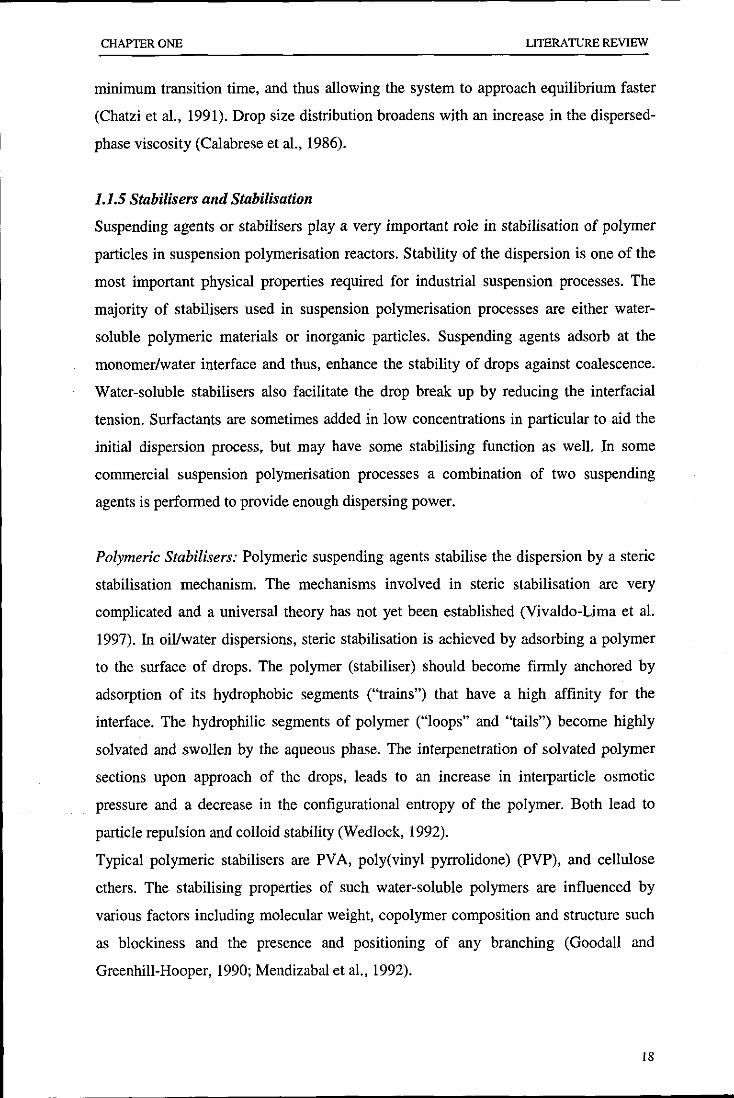
1.1.5 Stabilisers and Stabilisation
Suspending agents or stabilisers play a very important role in stabilisation of polymer
particles in suspension polymerisation reactors. Stability of the dispersion is one of the
most important physical properties required for industrial suspension processes. The
majority of stabilisers used in suspension polymerisation processes are either water
soluble polymeric materials or inorganic particles. Suspending agents adsorb at the
monomer/water interface and thus, enhance the stability of drops against coalescence.
Water-soluble stabilisers also facilitate the drop break up by reducing the interfacial
tension. Surfactants are sometimes added in low concentrations in particular to aid the
initial dispersion process, but may have some stabilising function as well. In some
commercial suspension polymerisation processes a combination of two suspending
agents is performed to provide enough dispersing power.
Polymeric Stabilisers: Polymeric suspending agents stabilise the dispersion by a steric
stabilisation mechanism. The mechanisms involved in steric stabilisation are very
complicated and a universal theory has not yet been established (Vivaldo-Lima et al.
1997). In oil/water dispersions, steric stabilisation is achieved by adsorbing a polymer
to the surface of drops. The polymer (stabiliser) should become firmly anchored by
adsorption of its hydrophobic segments ("trains") that have a high affinity for the
interface. The hydrophilic segments of polymer ("loops" and "tails") become highly
solvated and swollen by the aqueous phase. The interpenetration of solvated polymer
sections upon approach of the drops, leads to an increase in interparticle osmotic
pressure and a decrease in the configurational entropy of the polymer. Both lead to
particle repulsion and colloid stability (Wedlock, 1992).
Typical polymeric stabilisers are PVA, poly(vinyl pyrrolidone) (PVP), and cellulose
ethers. The stabilising properties of such water-soluble polymers are influenced by
various factors including molecular weight, copolymer composition and structure such
as blockiness and the presence and positioning of any branching (Goodall and
Greenhill-Hooper, 1990; Mendizabal et ai., 1992).
18

CHAP'IERONE LI1ERA TURE REVIEW
Several investigators have studied PV A as a suspending agent in suspension
polymerisation processes (Goodall and Greenhill-Hooper, 1990; Castellanos et aI.,
1991; Mendizabal et aI., 1992; Chatzi and Kiparissides, 1994; Zerfa, 1994; Zerfa and
Brooks, 1996; Olayo et al., 1998; Lazrak et aI., 1998; Yang et aI., 2000). It has been
proved experimentally that the molecular weight, degree of hydrolysis and the method
of manufacturing of PV A affect the dispersing power of this dispersant.
It has been reported that interfacial tension between the dispersed phase and the
aqueous solution of PV A increases with increasing degree of hydrolysis and molecular
weight of PV A. Moreover, interfacial tension between the dispersed phase and the
aqueous solution of PV A decreases with increasing the water solubility of the dispersed
phase (Castellanos et al., 1991; Mendizabal et aI., 1992). The thickness of the PVA
adsorbed layer on drops increases with increasing molecular weight of PV A. High
degree hydrolysed PV As (>96%), regardless of molecular weight, yield unstable
dispersions. Polymerisations using these PV As yield shapeless bulk polymer. That is
because they are too hydrophilic to adsorb strongly enough at monomer-water
interfaces to form a coherent film to prevent drop coalescence. Partially hydrolysed
PV As (88%) with low molecular weight (<70,000) yield very stable dispersions (non
reacting suspensions). But polymerisation using these PVAs yields big polymer lumps
that are formed by very small particles. These PVAs are more surface active per unit
weight than their higher molecular weight counterparts. So they are prone to adsorb
more strongly and faster than the higher molecular weight ones. On the other hand,
because of their low molecular weight, the thickness of the adsorbed layer is very small
and so during the polymerisation, the drops can approach each other closely enough for
the adsorbed polymer segments to interact and entangled (bridging). The result is the
formation of polymer lumps. Partially hydrolysed PV As (88%) with high molecular
weight (>70,000) yield moderately stable dispersions. Polymerisation using these PV As
carries on without any problem and polymer beads are obtained. These are the best kind
of PV As and can be used as stabilising agents in suspension polymerisation. For
partially hydrolysed PV As, as the molecular weight increases the concentration
required to give stable drops during the polymerisation becomes smaller (Castellanos et
aI., 1991; Mendizabal et al., 1992).
19

CHAPTER ONE LITERATURE REVIEW
For more water soluble monomers, such as MMA and acrylonitrile, even low molecular
weight PV A (partially hydrolysed) gives moderately stable dispersions and
polymerisation leads to small lumps or even beads of polymer (Castellanos et al., 1991;
Mendizabal et al., 1992).
Inorganic particles. Many different types of inorganic particles have been used in this
context, including hydroxyapatite or tricalcium phosphate (TCP), calcium carbonate,
barium sulphate, and aluminium oxide/hydroxide. The presence of these particles on the
surface of monomer droplets decreases the rate of coalescence by hindering the
approach of other monomer droplets. Models for the stabilisation of drops by inorganic
particles have been reported (Wang and Brooks, 1992 and 1993). Addition of surfactant
may increase the efficiency of the particles as stabilisers. Inorganic stabilisers, such as
TCP, can be made in situ in suspension polymerisation processes (Sajjadi and Fazeli,
1994; Jahanzad and Sajjadi, 2000). Unlike polymeric stabilisers, inorganic particles
usually can be removed after the polymerisation completed by washing with acid or
base. Moreover they are generally cheaper than polymeric stabilisers.
1.2 SUSPENSION POLYMERISATION
In suspension polymerisation processes the initiator is soluble in monomer phase and
polymerisation occurs in monomer droplets. Calculations show that the monomer
droplets are large enough to contain a very large number of free radicals (- 108 mol/l)
(Kalfas and Ray, 1993) and so this is a bulk polymerisation carried out in individual
droplets.
Several detailed and complete reviews on suspension polymerisation have been
published (Brooks, 1990; Yuan et aI., 1991; Arshadi, 1992; Hamielec and Tobita, 1992;
Vivaldo-Lima et al., 1997; Dowding and Vincent, 2000). A number of investigators
have studied suspension polymerisation processes from different points of view. For
example, water solubility of monomer and mass transfer (Kalfas et aI., 1993: Zhang and
Ray, 1997), bifunctional initiators (Villalobos et aI., 1993), dependence of polymer
molecular weight on particle size (Bhargava et al., 1979), and effect of ultrasonic
irradiation on particle size and its distribution (Hatate al., 1985) have been studied.
20

CHAP1ERONE LITERATURE REVIEW
The production of unsaturated polyesters particles (Narkis, 1979), hollow polymer
beads (Jo et aI., 1996), and particles with core-shell morphology (Cunningham et aI.,
2000) through suspension polymerisation have been also reported.
In comparison with the quantity of studies on the kinetics of polymerisation and the
properties of final polymer particles in suspension polymerisation processes, less
attention has been paid to the study of evolution of particle size and particle size
distribution in these processes. The main reason for this is the complexity of the
phenomena (drop break up and coalescence rates and drop viscosity build up) affecting
the particle size.
1.2.1 Kinetics offree-radicalpolymerisation
The reaction kinetics of suspension polylnerisation are reasonably well understood and
are the same as those of bulk polymerisation (Munzer and Trommsdorff, 1977).
The mechanism of free-radical bulk polymerisation of monomer M in the presence of
thermal initiator I and chain transfer agent S can be schematically shown as follows:
Initiation:
(1.2.1 a)
'i = k,[/][M] (1.2.lb)
Propagation or chain growth:
( 1.2.2)
Chain transfer to:
monomer: (1.2.3a)
o k, o
chain transfer agent: Rn + S ~ Pn + RI r, = k,[S][R] (1.2.3b)
Termination:
o 0 kid
disproportionation: Rn + Rm ~ Pn + Pm ( 1.2.4a)
21

CHAPTER ONE LITERATURE REVIEW
combination: (1.2Ab)
o
where Rn and Pn denote the free-radical and dead polymer molecules with chain length
n (degree of polymerisation), respectively. rand k represent the rate and the rate
constant for each reaction, respectively, with the subscript indicating the type of the
reaction. [] denotes the concentration.
The rates of initiator consumption (equation 1.2.1a) and initiation (equations 1.2.la and
1.2.1 b) can be written as below:
1 d([llV)
V dt -kAI] (I.2.5a)
(1.2.Sb)
where V is the total volume of reaction mixture and f is the initiator efficiency. The
overall rate of polymerisation, Rp, or the rate of monomer consumption, is:
1 d([M]V)
V dt (1.2.6)
According to equation 1.204 the overall rate of termination reactions is:
(1.2.7)
where k, is the overall termination rate constant (k, = k,d + k,c). Assuming QSSA for the
rate of radical formation, the radical concentration can be obtained as
[R] = (2fkdI! kj/2 from equations 1.2.5b and 1.2.7. Then Rp can be rewritten as:
( )
112
R == (k + k )[M] 2fkAI] p p f k
I
(1.2.8)
22

CHAP1ERONE
Monomer conversion (x) is defined as:
x = :c-[M---=..elo--'Vo'------.:['-M--=lV_ [Mlo Vo
LI1ERA TURE REVIEW
(1.2.9)
where [M]o is the initial monomer concentration. Since the density of monomer is
generally less than corresponding polymer, a volume contraction factor (tp) is defined
as:
(1.2.10)
where pm and {Jp are densities of monomer and polymer, respectively. Accordingly, the
variation of reaction volume can be written as:
(1.2.11)
where Vo is the initial volume of monomer.
The instantaneous number-average degree of polymerisation (Xn.in), which is the
average number of monomer units in a polymer chain formed at time t, can be obtained
from the following equation:
x . '" _Rp = -.;.(k..!:p_+_k.!...f :..::)[M=l n,m RI (2jkAl]k, Y'2 (1.2.12)
1.2.2 Diffusion-controlled Reactions
There are some important effects in free-radical polymerisation which can affect the
kinetics and polymer molecular weight during the course of the polymerisation, They
are briefly discussed here,
Diffusion-controlled tennination: In free-radical polymerisation, in the medium
conversion region, there is an "autoacceleration effect" or "gel effect" which leads to a
23

CHAPTER ONE LITERATURE REVIEW
decrease of k, and so increases the overall rate of polymerisation and polymer molecular
weight (see equations 1.2.8 and 1.2.12). This effect is due to entanglements between
long free-radical chains because of increasing polymer concentration (conversion). This
hinders the free radicals in approaching, reacting with each other, and terminating and
so the termination reactions become diffusion controlled. The polymer concentration
and molecular weight are the most important factors that affect the onset and intensity
of the gel effect. Using a chain transfer agent reduces, and control, the polymer
molecular weight and so reduces the importance of the gel effect (Odian, 1991; Rempp
and Merrill, 1991).
Diffusion-controlled Propagation: There is another important effect in free-radical
polymerisation that may occur at high conversion region. If the reaction temperature is
below the glass transition temperature (Tg) of the polymer being produced, the
propagation reactions become diffusion controlled as the glassy state is approached at
high conversions. In the glassy state even the motion of small molecules of monomer is
restricted and the propagation reactions ceases to occur. This sets a limiting conversion
on the polymerisation process. This phenomenon is called "glass effect" (Odian, 1991;
Rempp and Merrill. 1991).
Diffusion-controlled initiation: The rate of initiator decomposition might be also
affected at high conversions. The decomposition of initiator molecules into two primary
radicals takes place in an environment consisting of monomer molecules. When two
primary radicals are produced, they are kept close together by the surrounding
monomer molecules for a very short time before they can move away. In this very short
time they can react with each other and form the initial initiator molecule or other stable
compounds that cannot be decomposed. The latter case decreases the efficiency of the
initiator to produce free radicals. This effect is referred to as the "cage effect". This
effect causes the initiator efficiency, j, to be lower than unity (in the range of 0.4 to 0.8
depending on the properties of initiator and monomer). During polymerisation in which
the viscosity of the reaction media increases, f decreases due to the intensifying of the
cage effect. This can decrease the rate of polymerisation (see equation 1.2.8) at high
conversions (Odian, 1991; Rempp and MerriII, 1991). However, the cage effect might
not limit the final conversion for suspension polymerisation reactions because a small
24

CHAPTER ONE LITERATURE REVIEW
part of the radicals enter the particles from the water phase, depending on the initiator
concentration in the water phase (Cunningham, 1999).
1.2.3 Heterogeneous Nature of Suspension Polymerisation
Suspension polymerisations occur in heterogeneous monomer-water dispersions. The
kinetics of suspension polymerisation, however, have been considered to be similar to
the free radical bulk polymerisation (Munzer and Trommsdorff, 1977). This assumption
is based on the fact that the locus of polymeriastion in suspension polymerisation is in
the monomer drops. While this assumption seems to be sound for many cases as long as
the kinetics of the oil phase is concerned, it may not be sufficient under all
circumstances.
Emulsion Particles: The formation of emulsion particles in suspension polymerisation
reactions has been realized for a long time (Almog and Levy, 1980; Adams et aI., 1990;
Cunningham, 1999). These particles are the result of a homogenous nucleation
mechanism occurring in the aqueous phase (Fitch et al., 1969). Because of segregation
of radicals in these particles, they usually have a higher molecular weight than the
particles formed with suspension polymerisation. To address such a phenomenon, the
kinetics of the water phase should be also considered in parallel to that of the oil phase.
Another route by which the emulsion particles can be formed is by the partial
dissolution of monomer/polymer droplets (Azad and Fitch, 1978). Dissolusion of
monomer droplets by molecular diffusion occurs faster for smaller droplets because of
their higher monomer fugacity, which in turn is due to their small radius of curvature
and therefore higher surface energy. Because of the formation of polymer in the
droplets, the droplets do not completely disappear and so colloidal-sized particles are
formed. These small particles have the same molecular weight as larger suspension
particles.
Monomer Partitioning: When the solubility of the monomer in the aqueous phase is
negligible (as it is for styrene, for example), quantitative predictions are possible for
suspension polymerisation using the same kinetic model used for the corresponding
homogeneous (bulk) polymerisation. However, in the case of monomers with a
moderate to high water solubility in the aqueous phase, quantitative agreement between
the experimental results and the model prediction are usually lacking. This is because
25

CHAPTER ONE LI1ERA TURE REVIEW
some of the monomer resides in the water phase and do not get involved in the
polymerisation reaction. As polymerisation proceeds in the drops, monomer transfers
from the aqueous phase into the drops to compensate the monomer that has replenished.
Kalfas et aI (1993) carried out a series of suspension homo- and copolymerisations of
monomers with different water solubility. Their results showed that mass transfer
limitations in suspension polymerisation of partially water-soluble monomers (MMA,
vinyl acetate and acrylonitrile) at low monomer-to-water ratios is considerable and
leads to a lower final conversion in comparison with higher monomer-to-water ratios.
Later Zhang and Ray (1997) showed that the aqueous-phase mass transfer is not the
limiting resistance, and the intraparticle diffusion may cause limitations on monomer
transport.
1.2.4 Particle Size Average and Distribution
Suspension polymerisation reactions generally produce particles with a broad size or
bimodal distribution. Bead particles are usually the intended product from a suspension
reactor, with diameters in the range of 10 pm to 5 mm. In principal, the size of particles
in suspension polymerisation is detennined by a balance between the rate of drop break
up and coalescence, similar to that in a simple dispersion process. The major difference
is that in the polymerising drops, the drop properties are not constant and vary with
time.
Without the presence of a stabiliser, the polymerising drops would agglomerate after a
certain degree of polymerisation. As polymerisation proceeds in the drops, the viscosity
of the drops increases correspondingly. For example, in suspension polymerisation of
styrene, the dispersed droplets reach a critical viscosity of about 100 cp at about 30%
conversion from which droplet coalescence overcomes the droplet breakage. As a result
.. the mean particle size starts to increase (Church, 1966; Arai et al., 1977; Konno et al.,
1982; Villalobos et al., 1993). Particle growth stops at a secondary critical viscosity
(106 cp) reached at about 70% conversion because coalescence becomes less likely for
highly elastic collisions. The period during which particles grow is usually called the
"sticky stage" (Vil\alobos et al; 1993). By the combined action of stabilisers and
turbulent agitation, agglomeration can be prevented until individual droplets are
transformed into solid spherical particles (Church and Shinnar; 1961). The type and
26

CHAPTER ONE LITERATURE REVIEW
concentration of suspending agent plays an important role in prevention of coalescence
between polymerising drops. Regarding recent applications of suspension
polymerisation products, the major aim in this process is the formation of as uniform as
possible dispersion of monomer drops in the aqueous phase with controlled coalescence
of these drops during the polymerisation process. This indicates that the kinetics of
polymerisation together with mixing and surface phenomena associated with
stabilisation of drops are quite important in elucidation of polymer bead formation in
suspension polymerisation reactions.
To understand drop size variations in suspension polymerisations, reports on liquid
liquid dispersions with high viscosity dispersed phase are quite useful. With increasing
viscosity of the disperse phase in a liquid-liquid dispersion, the rate of drop break up
decreases due to higher resistant forces (Koshi et al., 1988b). When the viscosity of the
dispersed phase is high the rate of drop break up is determined by resisting viscous
forces and independent of interfacial-tension forces (Calabrese et aI., 1986; Koshy et
al.,1988b).
Koshy et al. (l988b) were the first accounted for the effect of elasticity increase on the
rate of drop break up. They showed that the drop break up for a viscoelastic fluid needs
more energetic eddies or larger eddies in comparison to a purely viscous fluid due to the
restoring some of the kinetic energy of the eddies by the elastic mode of the viscoelastic
fluid. Mighri et al. (1998) also showed experimentally that drop resistance to
deformation and break up increases with increasing drop elasticity.
Increase in the viscosity of dispersed phase in mobile-interface systems leads to partial
immobility of the interface and so decreases the efficiency of coalescence (Liu and Li,
1999). This results in a decrease in the rate of drop coalescence with an increase in the
viscosity of the drop.
In a suspension polymerisation the viscoelastic properties of the dispersed phase (drops)
increase with time, especially during the gel effect, as the result of conversion of
monomer to polymer. Experimental evidence shows that particle size increases
significantly during the gel effect in suspension polymerisation processes (Konno et aI.,
1982, Zerfa and Brooks, 1996; Lazrak et aI., 1998; Yang et aI., 2001). Viscosity
increase in the polymerising drops affects inversely the rates of drop break up and
27

CHAPTER ONE LI1ERATURE REVIEW
coalescence but affects break up more than coalescence and so the mean drop size
increases during the gel effect or "sticky stage", as the theoretical predictions shows
(Alvarez et aI., 1994).
1.2.4.1 The origin of satellite particles
In the final product of a suspension polymerisation process, bead particles are usually
accompanied by a few orders of magnitude larger number of very small satellite
particles and emulsion particles. As mentioned earlier (section 1.1.5.3) in liquid-liquid
dispersions nonhomogeneity of turbulent flows and mechanism of drop break up may
be responsible for the formation of small drops and for the bimodality of drop size
distribution. In a suspension polymerisation reactor in addition of the above factors
(Vivaldo-Lima et aI., 1997), satellite particles could be the result of the following
factors:
Change in the mechanism of drop break up: The mechanism of drop break up is
strongly affected by the viscosity of the drop. As previously mentioned (section 1.1.5.3)
with an increase in the drop viscosity the mechanism of drop break up shifts from
bursting towards stretching and erosion. At very high viscosities of dispersed phase
(polymer/water dispersions with high ratio of J/d/jl,;) it has been found recently that drop
deformation and break up consisted in erosion at the drop surface. Clouds of very small
ribbons and sheets were developed around the drop then stretched and finally broken
into very small droplets (Mighri and Huneault, 2002).
Emulsion particles: As mentioned earlier (section 1.2.3) emulsion particles are formed
in the aqueous phase in suspension polymerisation of monomers with moderate to high
water solubility. Although these particles are very small they may coagulate due to
instability.
1.2.5 New developments
The inadequacy of traditional suspension polymerisation process to produce polymers
of narrow particle size distribution motivates more attempts to develop new methods for
producing monodisperse polymer particles by suspension polymerisation. Some of
these attempts include: 1- using an encapsulation step of monomer droplets (Matsumoto
28

CHAPTER ONE LITERATURE REVIEW
et al., 1989) previous to the polymerisation step (which can then be carried out in
suspension without using stabilisers), 2- proposal of a circular loop reactor to carry out
the suspension polymerisation, which was reported to be superior for the production of
the polymer (polystyrene) particles of uniform size than the conventional suspension
polymerisation process (Tanaka and Hosogai, 1990),3- development of a method for
the production of large monosized spherical polymer particles made by passing the
monomer under pressure through a nozzle coupled to an energised piezoelectric crystal
(Colvin et al., 1990), 4- carrying out the suspension polymerisation (of MMA) in a
"gelled" solution of water and agarose (which immobilises the polymerising drops all
along the reaction) (Polacco et aI., 1994).
In a new technique, a new kind of reactor called oscillatory-baffled reactor has been
studied extensively for suspension polymerisation (e.g., Ni et al., 1998; Ni et aI., 1999;
Ni et al., 2001), and for mixing behaviour (e.g., Ni et al., 1998; Ni et aI., 2003).
Another technique has been developed to use membranes as a novel emulsification
technique to produce monodisperse drops. Subsequent suspension polymerisation
produces monodisperse polymer particles. Shirazu porous glass (SPG) membranes (e.g.,
Omi et aI., 1994; Yuyama et al., 2000; Ma et aI., 2003) have been used for this purpose.
Very recently polytetraflouroethylene (PTFE) membranes have been used for producing
monodisperse oil in water emulsions (Yamazaki et aI., 2002; Yamazaki et aI., 2003).
1.3 MODELLING OF SUSPENSION POL YMERISA TION
Suspension polymerisation processes can be classified in several levels on which
modelling is important. These levels are microscale chemical kinetics (polymerisation
reactions), mesoscale physical phenomena (interphase equilibrium, interphase and
intraphase heat and mass transfer, fluid mechanics and micro mixing, break
up/coalescence phenomena, polymer morphology), and the macroscale reactor
phenomena (macromixing, overall energy and material balances, particle population
balances, heat and mass transfer from the reactor, reactor dynamics and control)
(Vivaldo-Lima et aI., 1997). Usually, separate models are required at each level, and
simplified versions of the smaller scale models are incorporated as the scale grows
larger.
29

----------------------------------------------------------------------- -
CHAPTER ONE LITERATURE REVIEW
In suspension polymerisation processes microscale chemical kinetics are reasonably
well understood. The macroscale has been considered independently from the other
scales, so that effective interconnection has not been obtained to date. The least
developed issues in the suspension polymerisation processes is mesoscale
(breakagelcoalescence phenomena) and its relation with rheological behaviour of the
polymerising mass, the kinetics of polymerisation, non-homogenous flow and rate of
energy dissipation in the reactor. However, the modelling of break up and coalescence
processes in liquid-liquid dispersions has been the subject of many investigations
during the last 50 years (e.g.; Shinnar and Church, 1960; Valentas and Amundson,
1966; Coulaloglou and Tavlarides, 1976; 1977; Calabrese et al., 1986; Chatzi and
Kiparissides, 1992; 1995; Tsouris and Tavlarides, 1994).
The first attempt to model the particle size distribution in suspension polymerisation
reactors was done by Mikos et al. (1986). They assumed that if the drops become
stabilised from the early reaction, the final size distribution of particles is govemed by
the initial distribution, taking into account the contraction of monomer when it is
converted to polymer. So Mikos et al. (1986) did not consider the effect of kinetics of
polymerisation and viscosity build up in the polymerising drops. Their report of PSD
modelling of suspension polymerisation is based on a purely dispersion mechanism.
To date, a few studies have been reported on the modelling of suspension
polymerisation reactions that combine the kinetics of polymerisation and the dynamics
of the dispersion. The break through in modelling of suspension polymerisation
reactions was reported by a Mexican group (Valadez-GounzaIez 1988; Alvarez et al.
1991; 1994) and then followed by other research groups (Vivaldo-Lima et aI., 1998;
Maggioris et aI., 1998 and 2000; Chen et aI., 1999; Machado et al., 2000).
One of the most complex features of liquid-liquid dispersions is the nonhomogeneity of
the turbulent flow. It has been shown that in a stirred tank, coalescence and drop break
up occur with different magnitudes in different regions of the reactor (Coulaloglou and
Tavlarides, 1976). Coalescence is found to occur predominantly in the region of
circulating flow, whereas droplet break up is found to occur mainly in the vicinity of the
agitator. However, most of the modelling attempts have been made with the assumption
of homogeneity of the vessel content. In liquid-liquid dispersions the inherent
nonhomogeneity of turbulent flow makes the modelling very difficult. Tsouris and
30

CHAPTER ONE LITERATURE REVIEW
Tavlarides (1994) have developed a model that assumes a homogeneous environment
but accounted for the nonhomogeneity of the tank by using two energy dissipation rates
at the impeller and circulation zones. Recently, two-compartment models have been
presented that consider two zones, the impeller zone and the circulation zone. Two
population balances have been proposed for the two zones; taking into account the
exchange flow between the two compartments (Nambiar et al., 1994; Alexopoulos et
aI., 2002). Two-compartment model has also been used for suspension polymerisation
processes (Vivaldo-Lima et aI., 1998; Maggioris et al., 1998; 2000). The parameters for
the two-compartment models are compartment ratio of energy dissipation rates,
compartment volume ratio and exchange flow rate. They have been determined through
computational fluid dynamics (CFD) simulations (Boume and Yu, 1994). Alopaeus et
al. (1999) proposed a multi-block (multi-compartment) model for stirred tanks. They
divided the stirred tank into eleven sub-regions. However, they have not discussed the
advantages of their model over two-compartment models.
The two- or multi-zones models are also known as "compartment mixing models" (Cui
et al., 1996). As a matter of fact, these modelling approaches can be considered as
simplifications, or approximations, of a rigorous three-dimensional CFD calculation
(Mann et aI., 1995).
1.3.1 Free-Radical Polymerisation
1.3.1.1 Modelling o/the Kinetics
Several models have been proposed for predicting the kinetics and polymer molecular
weights in free-radical polymerisation; among them the method of instantaneous
properties (Marten and Hamielec, 1979) and the method of moments (Chiu et al., 1983)
are the most important models. In the method of instantaneous properties, the
instantaneous molecular weights of the polymer are integrated to give the cumulative
molecular weights. In the method of moments, the cumulative molecular weights are
directly obtained by integration of the moment equations. The method of instantaneous
properties is presented here, while the method of moments will be discussed in detail in
Chapter 4.
In the method of instantaneous properties instantaneous number-average (Xn,;n) and
weight-average (Xw,in) degree of polymerisation, which are defined as the properties of
the polymer chains produce at time t, are presented by following equations:
31

CHAPTER ONE LITERATURE REVIEW
x . = 1 n,m r+fJl2
(1.3,1)
x . = 2(r+3/2fJ) w,m (r+ fJ)2 (1.3.2)
r = (2fkd [I]k'd )1/2 + k 1 k + k [S]I k [M] fJ = (2fkd [I]k,jI2 k [M] f P s P' k [M]
P P
(1.3.3)
The parameter r represents the importance of disproportionation termination reactions
and chain transfer reactions in the molecular weight of polymer. While the parameter fJ
reflects the role of the combination termination reactions in the polymer molecular
weight.
The cumulative number-average and weight-average degree of polymerisation, which
are defined as the properties of all polymer chains produce until time t, can be obtained
by integration of equations 1.3.1 and 1.3.2 over the reaction time.
t
Xn = JXn,in dt o
(1.3.4)
(1.3.5)
Average polymer molecular weights are easily calculated by multiplying of the average
degrees of polymerisation by the molecular weight of the monomer.
1.3.1.2 Modelling of Diffusion-controlled Reactions
The variations of termination and propagation rate constants during the gel and glass
effects have been predicted by several semi-empirical relationships. Three of the most
applied correlations in this regard have been proposed originally by Marten and
Hamielec (1979) based on free volume theory, Tulig and Tirrel (1981) based on the
reptation theory, and Chiu et al. (1983) based on random walking statistics. Here the
32

CHAP1ERONE LITERATURE REVIEW
model of Marten and Hamielec (1979) is presented. The model of Chiu et al. (1983)
will be discussed in Chapter 4.
Marten and Hamielec (1979) proposed correlations for the variation of k, and kp during
the gel and glass effects, respectively. These correlations are on the base of the
molecular weight of the polymer formed during the reaction and the free volume of the
reaction mixture, which varies with the monomer conversion. They defined a parameter
(K) for any polymerisation system, which can be calculated for every increment in
conversion as follows:
K=M;exp(AIVj )
Vj = [O.02S+am(T -T,m)l~m +[O.02S+ap(T - T,p)l~p
(1.3.6)
(1.3.7)
where V, is the free-volume of the monomer/polymer solution, T is reaction temperature
(K), a is the thermal expansion coefficient, and m and A are adjustable parameters.
Subscripts m and p denotes monomer and polymer, respectively.
The critical value of K (Kcr) for the onset of the gel effect for any specific monomer, is
a function of temperature only. When the value of parameter K reaches its critical value,
the gel effect begins and k, will decrease according to the following correlation:
(1.3.8)
where Mwcr and V,crl are the values of polymer weight-average molecular weight and
free-volume at the onset of gel effect and n is an adjustable parameter.
Marten and Hamielec (1979) proposed the following equation for the decrease in kp
with conversion during glass effect:
(1.3.9)
where v,crZ is the free-volume of system at onset of glass effect and B is an adjustable
parameter.
33

CHAPTER ONE LITERATURE REVIEW
1.3.1.3 Modelling of the Rheological Properties
It is apparent that the rheological properties of drops change with time as
polymerisation proceeds in the drops. As the drops become more viscous, their
tendency to break up is depressed. The coalescence efficiency may be also affected by
the drop rheological properties. Therefore, appropriate correlations are required to allow
for the variation in drop properties with polymer concentration or conversion in the
drops.
Baillagou and Soong (1985a) proposed the following equation to calculate viscosity of
monomer/polymer solution (j1) based on free-volume and coil-coil interaction theories:
(1.3.10)
where cp is polymer concentration, Mw is polymer molecular weight. K, B, rn, and n are
adjustable parameters.
Alvarez et al. (1990,1994) calculated the zero-shear viscosity using free-volume theory:
f1 = CTmDn (1.3.11)
(1.3.12)
where f1 is the zero-shear viscosity, A is a temperature-dependent parameter, and Band
C are constants.
Another correlation for prediction of variation of zero-shear viscosity, with temperature,
conversion and polymer molecular weight in free radical bulk polymerisation of MMA,
has been given by Stuber (1986):
T/, == FS (1.3.13)
(1.3.14)
34

CHAPTER ONE LI1ERATURE REVIEW
( = exp[(600+ 80c p + c;)(I/T -11465.15) + 1.2xlO-5 c! 1 (1.3.15)
where cp is polymer weight percent, and Mw is polymer weight-average molecular
weight (thousands).
1.3.2 Particle Size Distribution
The modelling of break up and coalescence processes in liquid-liquid dispersions has
been the subject of many investigations during the last 50 years (e.g.; Shinnar and
Church, 1960; Valentas and Amundson, 1966; Coulaloglou and Tavlarides, 1976; 1977;
Calabrese et al., 1986; Chatzi and Kiparissides, 1992 and 1995; Tsouris and Tavlarides,
1994). In this section, the main features of these models are discussed.
1.3.2.1 Population Balance Equation (PBE)
By assuming homogeneous isotropic turbulence, implying perfect macromixing and
statistical homogeneity of the vessel content, the population balance approach is usually
used for tracing the destruction and re-creating of individual identities of drops by
dynamic processes of break up and coalescence. The evaluation of drop volume
distribution can be described by the following integro-differential equation:
dF(v,t)
dt
'mm< J b(v')j3(v', v)u(v')F(v' ,t)dv' -b(v)F(v,t)
v/2 Vrnax-V
+ J c(v -v', v')F(v - v' ,t)F(v' ,t)dv'-F(v,t) J c(v, v')F(v' ,t)dv'
(1.3.16)
where F(v,t) is the drop volume distribution (the number of drops with volume vat time
t), Vrnin and Vrnax are the minimum and maximum drop volumes, respectively, which can
exist in the dispersion. bey) and c(v, v') are the rates of drop break up and coalescence,
respectively.
fJ(v',v) is the probability of forming a drop with volume v from breakup of a drop with
volume v' or, in other words, the daughter drop volume distribution, which can be
assumed approximately by a normal distribution about a mean value v, since it is the
combined result of a large number of independent random events:
35
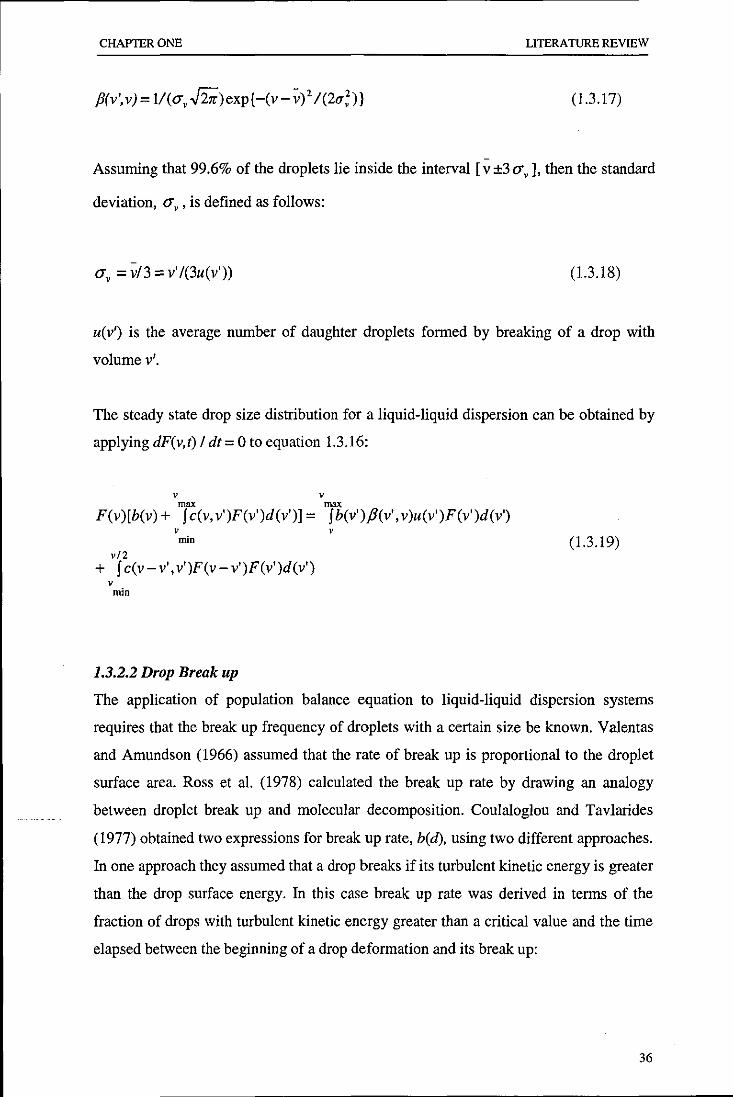
CHAPTER ONE LITERATURE REVIEW
(1.3.17)
Assuming that 99.6% of the droplets lie inside the interval [V ±3 O'v]' then the standard
deviation, O'v' is defined as follows:
O'v = v/3 = v'/(3u(v'» ( 1.3.18)
u( v') is the average number of daughter droplets formed by breaking of a drop with
volume v'.
The steady state drop size distribution for a liquid-liquid dispersion can be obtained by
applying dF(v,t) I dt= 0 to equation 1.3.16:
v v m~ m~
F(v)[b(v) + f c(v, v')F(v')d(v')] = f b(v')P(v', v)u(v')F(v')d(v') v v min
v/2 + f c(v-v', v')F(v - v')F(v')d(v')
v min
1.3.2.2 Drop Break up
(1.3.19)
The application of popUlation balance equation to liquid-liquid dispersion systems
requires that the break up frequency of droplets with a certain size be known. Valentas
and Amundson (1966) assumed that the rate of break up is proportional to the droplet
surface area. Ross et al. (1978) calculated the break up rate by drawing an analogy
between droplet break up and molecular decomposition. Coulaloglou and Tav larides
(1977) obtained two expressions for break up rate, bed), using two different approaches.
In one approach they assumed that a drop breaks if its turbulent kinetic energy is greater
than the drop surface energy. In this case break up rate was derived in terms of the
fraction of drops with turbulent kinetic energy greater than a critical value and the time
elapsed between the beginning of a drop deformation and its break up:
36

CHAPTER ONE LITERATURE REVIEW
(1.3.20)
where Cl and C2 are constants. In another approach break up of a drop is caused from a
collision with a turbulent eddy. If the turbulent kinetic energy imparted to the drop is
greater than the drop surface energy, the drop deforms and breaks. The break up rate is
then determined by the fraction of these collisions for a random motion of drops and
eddies, and by the break up time:
(1.3.21)
According to N arsimhan et al. (1979), the break up of a drop exposed to a turbulent
field is due to its oscillation resulting from the relative velocity fluctuations imposed by
the arrival of eddies at the surface of the drop. So the rate of break up depends on the
average number of eddies arriving at the surface of the drop per unit time and on the
probability that an arriving eddy will have energy greater than or equal to the minimum
increase in surface energy of the drop required for break up:
(1.3.22)
Valadez-Gounzruez (1988) proposed a model for the break up rate with two efficiency
terms; energy and time efficiencies (Ae and A,). He assumed that a minimum amount of
energy for (at least) a minimum period of time should be provided to a droplet to break
it up. He proposed that the rate of break up should be given as follows:
b(v) = OJb (V)A, (V)A, (v) (1.3.23)
where ll.j, is collision frequency of eddies with droplets. The time efficiency was
proposed to be a function of the time required for a deformed polymer droplet to flow a
distance equal to its original radius and the time where enough energy to break: the
droplet is available. The energy efficiency is obtained from an energy balance
considering the surface energy (the energy required to overcome interfacial tension) and
the energy required to promote the viscous internal flow. To account for the
monomer/polymer flow, he used a power law viscosity model and assumed the flow to
37

CHAP'IER ONE LITERATURE REVIEW
be equivalent to the flow of a monomer/polymer mixture through a circular duct of
diameter equal to the droplet diameter and a pressure drop on the order of magnitude of
the available kinetic energy. On the basis of these assumptions Valadez-GounzaIez
(1988) obtained expressions for collision frequency and time and energy efficiencies
with five adjustable parameters.
Alvarez et al. (1991 and 1994) used the same approach as Valadez-GounzaIez (1988),
but instead of using a power law viscosity model, they assumed the polymer flow to
behave as a Maxwell fluid and only one break up efficiency was used. The efficiency
expression they obtained has only two adjustable parameters. The proposed equations
for break up rate distribution have been presented in details in Chapter 4. Alvarez et al.
(1994) showed theoretically that with an increase in the viscoelasticity of the drop the
rate of break up is reduced due to increased resistance of drops for being broken.
Chatzi and Kiparissides (1992) assumed the break up rate to depend on the average
number of eddies arriving on the surface of the drop per unit time and on the probability
that the arriving eddy will have energy greater than or equal to break a droplet of
diameter d. They indeed used the same principle as Valadez-GounzaIez (1988) but only
considered surface energy to be overcome, so their model is limited to low dispersed
phase viscosity. Chatzi and Kiparissides (1992) considered that a mother drop breaks up
to one daughter and several satellite drops and presented the following correlation for
break up frequency:
C = C [NdaX2/3
+ N,. 111112 11 N + N )213 'I
daX sa J (1.3.24)
where Cl and Cll are constants, Nda and N,a are the number of daughter and satellite
drops, respectively, and x is the ratio of volume of daughter to volume of satellite drops.
This concept allows the prediction of bimodal distributions, which is common in
suspension polymerisations in small reactors (Konno et aI., 1982; Villalobos, 1993).
Although there is experimental evidence that drops break up into a large number of
daughter drops of different sizes (Tavlarides and Stamatoudis, 1981), in most modelling
attempts this number is assumed to be fixed and usually equal to 2 (e.g., Coulaloglou
38

----------------------------------------------------------------------------- - ,
CHAPTER ONE LI1ERATURE REVIEW
and Tavlarides, 1976; 1977; Delichatsios and Probstein, 1976; Alvarez et al., 1991;
1994).
Recently a review of models for drop break up in liquid-liquid dispersions has been
published (Lasheras et al., 2002).
1.3.2.3 Drop Coalescence
Coalescence has been modelled assuming that the suspended droplets move randomly
and their collision frequency is similar to the collision frequency of ideal gas molecules
(kinetic theory of gases) (Howarth, 1964; Abrahamson, 1975; Coulaloglou and
Tavlarides, 1977; Das et aI., 1987). Coulaloglou and Tavlarides (1977) proposed
equation 1.3.25 for collision frequency of drops with diameters d. and dv, m(d.,dv),
where kc is a constant.
113
(j) (d d )=k _e_(d2+d2)~(d213+d213) c u' vel + f/Jd U v u v
(1.3.25)
Shinnar and Church (1960) stated that coalescence will not happen if the kinetic energy
of the oscillations imposed to the drops by turbulent pressure fluctuations is greater than
the energy of the adhesion between two drops. Based on this idea, Coulaloglou and
Tavlarides (1977) derived the coalescence efficiency (A.,) for deformable and rigid
drops as follows:
(rigid drops) (1.3.26b)
Howarth (1964) considered coalescence as a "single-shot" process. If the velocities of
two colliding drops are greater than a critical value they coalesce immediately. Sovova
(1981a; 1981b) proposed an expression for coalescence efficiency by considering that
the drops follow the motion of eddies having the same scale to their size. Drop
coalescence occurs if the turbulent energy of collision of the drops is greater than their
surface energy. The fraction of "energetic collisions" has been derived as;
39

CHAPTER ONE LITERATURE REVIEW
The group of Alvarez (Valadez-GounzaIez, 1988; Alvarez et al., 1991 and 1994) also
used the kinetic theory of gases for calculating collision frequency but they proposed
different expressions for coalescence efficiency that take into consideration the
rheological changes of polymerising drops. Valadez-GounzaIez (1988) proposed this
efficiency to depend on a deformation efficiency, a film drainage efficiency, and a time
for deformation efficiency. The expressions for these efficiencies were developed using
a power law rheological model. Alvarez et al. (1991) proposed that the overall
coalescence efficiency is the product of four efficiencies, namely, an efficiency for
drop-drop approach, a deformation efficiency, a film drainage efficiency before the film
is broken, and a film drainage efficiency once it has been broken. They also considered
the effect of the suspending agent on the coalescence by using a Maxwell fluid model to
characterise the rheological behaviour of the drops. Later, Alvarez et al. (1994)
considered only two efficiency terms, the deformation efficiency and the film drainage
efficiency. The details of their model are presented in chapter 4.
40

CHAP1ERONE LIlERATURE REVIEW
1.3.4 CONCLUSIONS
It is understood from the literature review that the kinetics of polymerisation and drop
break up and coalescence play important roles in the determination of the size of
polymer beads in suspension polymerisation processes. Despite many relevant
publications, in particular after 1990, the effects of the kinetics of polymerisation
reactions and rheological properties of polymerising drops on the rates and mechanisms
of drop break up and coalescence are not well elucidated. The following general
conclusions may be drawn from the literature review regarding suspension
polymerisation:
1- In a liquid-liquid dispersion, there is a transition period during which the average
drop size exponentially decreases with time until it reaches a steady-state value. For
a suspension polymerisation, generally it is accepted that the drop size reaches a
steady-state in the initial stage of mixing before polymerisation proceeds much (a
Iow viscosity build up in the drop). If the polymerisation reaction proceeds fast
compared with the stabiIisation of the dispersion, it is possible that the initial drop
sizes never decreases to the steady state value and starts enlarging from the start of
the polymerisation.
2- The occurrence of the quasi steady-state in the size of particle in suspension
polymerisation is still in question.
3- The role of satellite particles in the stability of particles and evolution of particle
size has not been elucidated.
4- The effects of chain transfer agents, on particle size average and distribution in
suspension polymerisation processes have not been studied.
5- Recent modellings of suspension polymerisation reactions have used the application
of CFD. This technique gives a better possibility for investigating the
inhomogeneities in the reaction vessel.
41

OUTLINE OF THE RESEARCH
OUTLINE OF THE RESEARCH
The objective of this research is to investigate the evolution of particle size distribution
in suspension polymerisation reactors. In order to elaborate on the kinetics of
polymerisation and particle size evolution, appropriate kinetic and population balance
models are also developed. The experimental results are tested against the mathematical
model predictions.
Methyl methacrylate was chosen as the model monomer to study the effects of different
operation and formulation parameters on the evolution of the drop/particle size average
and distribution as well as the reaction kinetics. The distinctive feature of this research
is that corresponding non-reacting MMAlwater dispersions are also carried out to
unravel the importance of the forces influencing the dynamics of dispersion processes.
The comparative study of reacting and non-reacting dispersion systems will be seen to
provide valuable information regarding drop behaviour in suspension polymerisation
reactions.
A widely used stabiliser, Polyvinyl alcohol (PVA) with a hydrolysis degree of 88%,
was selected for this research. Lauroyl peroxide (LPO), which has low water solubility,
was selected as an initiator. The advantage of using LPO is that the formation of
emulsion particles will be limited.
Three categories of variables can be found for a suspension polymerisation. The first
category includes those parameters that affect the properties of the water phase such as
stabiliser concentration and type. The second category contains those parameters that
affect the kinetics of polymerisation such as initiator and chain transfer types and
concentrations. The third category includes those parameters that affect the mixing
conditions of the dispersion/suspension such as impeller type and speed, tank geometry
and baffling. Some variables may be classified under more than one category. The
variables selected for this research, which are from the three categories, are suspending
agent (PV A) concentration, initiator (LPO) concentration, chain transfer agent (n
DDM) concentration, monomer hold up, inhibitor type and concentration, reaction
temperature, and agitation speed.
42

:---------------------------- -----
CHAPTER TWO EXPERIMENTAL PROCEDURES
CHAPTER TWO
EXPERIMENTAL PROCEDURES
2.1 MATERIALS
Distilled water was used as the continuous phase. Methyl methacrylate (MMA)
(analytical grade, Aldrich) was distilled at reduced pressure. Polyvinyl alcohol (PVA)
(Mw'" 85000-146000, degree of hydrolysis '" 87-89%, Aldrich), lauroyl peroxide (LPO)
(97%, Aldrich), normal-dodecyl mercaptan (n-DDM) (98+%, Aldrich), hydroquinone
(HQ) (99%, Aldrich) and 4-tert-butylcatechol (TBC) (97%, Aldrich) were used without
any further purification.
Auxiliary chemicals including sodium lauryl sulphate (SLS), acetone, and methanol
were analytical grade obtained from Aldrich and were used as received.
2.2 EXPERIMENTAL
Set up: Experiments were carried out using a I-litre jacketed glass reactor with an
internal diameter of 10 cm equipped with a four-bladed flat turbine-type impeller with a
width of 5.0 cm, a standard four-baffle plate with the width of 1/10 of vessel diameter
located at 90° intervals, an overhead reflux condenser, a thermocouple, a sampling
device, a port for nitrogen purge, and an inlet for feeding ingredients (Figure 2.1). The
temperature of the vessel content was controlled within ± 1.0°C of the desired reaction
temperature (mostly 70°C) by pumping water at an appropriate temperature through the
reactor jacket. The temperature of the vessel contents was continuously monitored by a
thermocouple. An adjustable impeller-speed motor with a display was used. Agitation
speed was adjusted at the desired level before the start of each experiment.
43
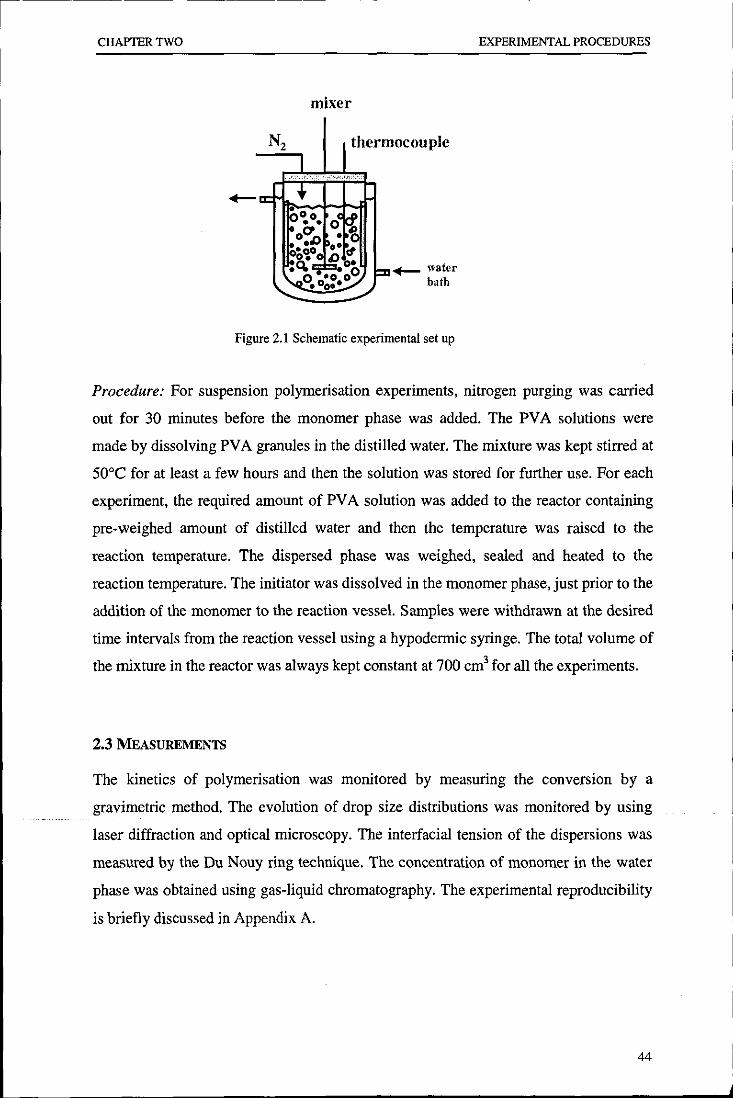
CHAPTER TWO
mixer
N2 thermocouple
..- water bath
Figure 2.1 Schematic experimental set up
EXPERIMENTAL PROCEDURES
Procedure: For suspension polymerisation experiments, nitrogen purging was carried
out for 30 minutes before the monomer phase was added. The PV A solutions were
made by dissolving PVA granules in the distilled water. The mixture was kept stirred at
500 e for at least a few hours and then the solution was stored for further use. For each
experiment, the required amount of PV A solution was added to the reactor containing
pre-weighed amount of distilled water and then the temperature was raised to the
reaction temperature. The dispersed phase was weighed, sealed and heated to the
reaction temperature. The initiator was dissolved in the monomer phase, just prior to the
addition of the monomer to the reaction vessel. Samples were withdrawn at the desired
time intervals from the reaction vessel using a hypodermic syringe. The total volume of
the mixture in the reactor was always kept constant at 700 cm3 for all the experiments.
2.3 MEASUREMENTS
The kinetics of polymerisation was monitored by measuring the conversion by a
gravimetric method. The evolution of drop size distributions was monitored by using
laser diffraction and optical microscopy. The interfacial tension of the dispersions was
measured by the Du Nouy ring technique. The concentration of monomer in the water
phase was obtained using gas-liquid chromatography. The experimental reproducibility
is briefly discussed in Appendix A.
44

CHAPTER TWO EXPERIMENTAL PROCEDURES
2.3.1 Conversion
Monomer conversion was measured gravimetrically. Small quantities of the dispersion
were withdrawn from the reactor and transferred into the small weighed aluminium foil
dishes. The samples, contained in the dishes, were weighed and then quenched by
adding cold acetone. The dishes were kept in the vacuum oven at 50°C for at least 18
hours. Monomer, acetone, and water were driven off by drying to constant weight in the
vacuum oven. Then the dishes were weighed again to calculate the monomer
conversion using the following expression:
weight.residue l'd fi . so I • ractzon . aliquot.weight
conversIOn = monomer·fraction
(2.1)
The solid fraction accounts for the weight fraction of initiator and stabiliser, and any
other solid additive such chain transfer agent and inhibitor, in the reactor. The monomer
fraction accounts for the weight fraction of monomer in the reactor.
2.3.2 Drop/Particle Size Distribution
Several techniques have been developed for drop size measurements of liquid-liquid
dispersions and emulsions. Optical microscopy seems to be one of the oldest techniques
used for drop size measurements in liquid-liquid dispersions. Traditionally, optical
microscopy has been used for off-line measurements. In several reports, vessels with a
special on-line photomicrographic set-ups have been designed to obtain size
distributions of the dispersed phase drops during mixing (Park and Blair, 1975; Hong
and Lee, 1983; Chatzi and Lee, 1987; Coulaloglou. and Tavlarides, 1976 and 1977;
Konno et aI, 1983; Konno et al., 1988; Borwankar et al., 1986; Clark, 1988). Pacek et
al. (1994) developed a video-microscope-computer technique for on-line monitoring of
the drop size and size distribution as well as the structure of the drops. Hocq et al.
(1994) and Bae and Tavlarides (1989) used a capillary method for drop-size
measurement. Tsouris and Tavlarides (1994) used a laser capillary technique which is
able to measure bivariate distributions of drop size and drop concentration by
monitoring the intensity of the laser light penetrating the walls of the capillary glass
tube along with the sampled drops and continuous phase are forced to pass. Hong and
Lee (1983) used a light transmission method. Alopaeus et al. (2002) used a laser beam
45

CHAPTER TWO EXPERIMENTAL PROCEDURES
reflectance measurement device that is based on a rapidly rotating laser beam. The laser
beam randomly measures chord length of passing drops, and the measured distribution
of chord length is then converted into a drop size distribution. Zhou and Kresta (1998)
used an aerometrics phase doppler particle analyser (PDP A) to measure the size of
drops. The technique requires the transparency of the dispersion in addition to the
transparency of both phases. Another technique which is widely used for liquid-liquid
and solid-liquid dispersions is the laser diffraction technique (Chatzi et al., 1991). This
technique is based on the measurement and interpretation of the angular distribution of
light diffracted by the drops and uses the Fraunhofer diffraction theory.
In this research we used two off-line techniques: laser diffraction and optical
microscopy. Because of the presence of the stabiliser, the dispersions were sufficiently
stable to allow reliable size measurements to be made with off-line techniques. The
advantages of laser diffraction are its speed and that it does not need any calibration. Its
drawback is that it requires the samples to be diluted. The advantage of the optical
technique is visual observation of drops and their shape, and that under normal
circumstances samples can be directly used for measurements. Its demerit is that it is
very tedious and there is always the possibility that representative samples for
measurement cannot be obtained. This is particularly true for broad size distributions
because of the natural tendency of operators to size larger and more distinct drops. The
combination of the two techniques proved to be very efficient.
2.3.2.1 Laser diffraction particle sizer
In this research, a laser diffraction technique has been selected as the main method for
drop/particle size measurement. A laser diffraction particle sizer (Malvern, Coulter
LS 130), based on Fraunhofer diffraction, was used for PSDIDSD measurements. For a
brief description of the method see Appendix B.
Prior to any measurement, the sample cell of the instrument was thoroughly cleaned and
filled with an aqueous solution of sodium lauryl sulphate (SLS; 0.2 g/l) to prevent
coalescence of the droplets. In order to avoid irreproducibility, the sampling point was
fixed at 2 cm distance from the impeller shaft and 3 cm below the suspension level.
Samples were withdrawn at desired time intervals. A drop of each sample was
immediately transferred to the sample cell. The cell contents were mixed gently by a
magnetic stirrer, provided in the cell, to prevent coalescence of droplets during the
46

CHAP1ERTWO EXPERIMENTAL PROCEDURES
measurement. Sampling and size measurements were continuously carried out in the
course of the process (non-reacting dispersion or suspension polymerisation).
Particle/drop sizing required the dispersion to be highly diluted in water whereupon the
monomer in the monomer drops or unreacted monomer inside the particles may diffuse
out of the particles, depending on the water solubility of the monomer. Water-solubility
of MMA at 25°C is around 15 gIIitre. A simple mass balance shows that dilution of
samples with 102 times volume of water would be enough to drain almost all MMA
monomer out of particles/drops. To avoid underestimation of drop sizes, the distilled
water used for the dilution of the samples, was saturated with the monomer prior to
preparation of the surfactant solution.
Typical PSD Calculation
The particle sizer Coulter LS 130 has 84 channels (bins) which accommodate size range
that change logarithmically. These channels cover the size range of 0.43-822 J1ffi.
The output of the particle sizer is in terms of volume of drops in each bin size. This can
be easily transformed to volume frequency distribution if,), defined as:
v 1,(dJ=L~ (2.2)
where Vj is the volume of drops with a diameter between di and d,+Llln(di). Considering
that Vi = Ni Vi' where Ni is the number of drops with diameter between dt and
di+Llln(dj), the number frequency distribution ifn) can be calculated as follows:
(2.3)
1: (d.)= I,(d)ld,' n I LI,(d)ld;
(2.4)
It should be noted that both Iv and In are normalised in terms of a logarithmic scale of
size; In(d). The distribution in terms of normal scale of size, d, is more convenient for
47

CHAP1ERTWO EXPERIMENTAL PROCEDURES
practical applications. The normalised distributions in terms of d can be calculated
using the following equation:
(2.5)
F(d;) is called "diameter density distribution", which has the dimension of inverse
length unit (Ilm-1) and satisfies the normalisation condition:
dnu~
L:F(d)~(d)=l (2.6) dm1n
where dmin and dmax are the diameters of the smallest and the largest drops that exist in
the vessel, respectively.
Application of density distributions facilitates the comparative study of drop size
distributions of different samples. In this way all size distributions are normalised and
can be compared easily with each other on a single graph.
Table 2.1 indicates a typical result from the particle sizer. The sample used was'
withdrawn from a MMA suspension polymerisation run at the beginning of the
polymerisation. A quick look at the data in this table reveals that they represent a
bimodal distribution. The maximum of the first peak is at about 2.6 pm and that of the
second one is at about 77 Ilm (the data related to the peaks are written in bold).
Generally most size distributions obtained in this research presented a bimodal
distribution including a main or primary peak at a larger diameter range and a
secondary peak in a diameter range lower than 10 Ilm. The formation of tiny droplets
have been attributed to nonhomogeneity of turbulent flows in stirred tanks, drop break
up mechanism (breaking into daughter drops and large number of small satellite
droplets), and viscosity build up in the drops (in the case of suspension polymerisation).
Detailed discussions regarding the formation of satellite droplets are presented in
Chapter 1.
For simplicity, hereafter the drops included in the main or primary peak are called
"daughter drops". Those drops, which usually form the secondary peak and are smaller
48

CHAPTER TWO EXPERIMENTAL PROCEDURES
than 10 IIID, are called "satellite droplets". These terminologies are used throughout this
text.
Table 2.1 Typical results obtained from the Laser sizer (Coulter LS 130).
d, (1J.I1l) v, (1J.I1l') d, (1J.I1l) v, (11m3) ddlJ.l1l) V, (IIm') d, (IIm) V, (11m3)
0.42922 0 2.9045 141.4 19.654 116.1 133 1128
0.47013 0 3.1813 136 21.528 132 145.68 891.5
0.51495 0 3.4846 128.1 23.58 155.8 159.56 677.3
0.56403 0.1884 3.8168 118.3 25.828 197.1 174.77 468.7
0.6178 2.219 4.1806 107.3 28.29 263 191.43 293.7
0.67669 6.115 4.5791 95.8 30.986 352.5 209.68 173.2
0.7412 10.54 5.0156 84.58 33.94 459.4 229.67 84.77
0.81185 16.82 5.4937 74.24 37.175 585.6 251.56 21.94
0.88924 25.02 6.0174 65.52 40.719 753 275.54 1.32
0.974 35.04 6.591 59.29 44.601 998.1 301.81 0
1.0668 46.32 7.2193 55.61 48.852 1355 330.58 0
1.1685 58.62 7.9074 53.7 53.509 1831 362.09 0
1.2799 71.87 8.6612 52.9 58.61 2389 396.61 0
1.4019 85.49 9.4868 52.86 64.197 2938 434.41 0
1.5356 99 10.391 53.41 70.316 3352 475.82 0
1.682 111.7 11.382 54.94 77.019 3510 52U8 0
1.8423 123 12.467 58.44 84.36 3359 570.86 0 2.0179 132.3 13.655 64.93 92.402 2946 625.28 0
2.2102 139.1 14.957 74.81 101.21 2399 684.88 0
2.4209 143 16.382 87.59 110.86 1863 750.17 0
2.6517 143.8 17.944 101.8 121.43 1436 821.67 0
Figures 2.2 and 2.3 show the drop size distributions of data given in Table 2.1 in terms
of logarithmic and normal scale of drop diameter, respectively. The volume fraction of
the droplets below 10 f.lm (secondary peak) is 0.06 while the number fraction of these
small droplets is 0.99. This implies that in terms of volume, the satellite droplets
contain only 6 % of the whole volume of drops. But in terms of number, 99 % of drops
have a diameter smaller than 10 f.lm. Similar results have been observed with samples
from all non-reacting or reacting dispersions in the context of this study. This difference
in the distribution of drops indicate how significant is to use an appropriate distribution
for any intended use.
49

CHAP1ERTWO EXPERIMENTAL PROCEDURES
0.15 -,-------------------------,
~ ~0.1O go
.::: .. ~0.05 ~
0.003
1 ~
0.002
0.001
O.OOO~, ~
0.1 10
,..~ ; . . , ~ . •
0.00 -I--~~ __ -""""r;_. __ -,.,.rrI~~.,.,__..::> __ _l
0.1 1 10 diameter (j.II11)
100 1000
Figure 2.2 Drop size distribution for typical data given in Table 2.1. The small figure shows a close up of the peak in the diameter range of below 10 ).lm.
0.02
e -<!-... ~
i 0.01 .. " 0246810
:lK .. .l .. .. -~ :a
0.00
0 50 lOO 150 diameter ().lm)
200 250
Figure 2.3 Diameter density distribution for typical data given in table 2.1. The small figure shows a close up of the peak in the diameter range of below 10 ).lm.
The Sauter mean diameter of particles (drops) was calculated using the following
equation:
~ ~
'LN;d; 'Lf.(d;)d; d
32 = ;:1 = i=1 ;::::1 (2.7)
'LNidi2 'Lf.(di)d; 'Lj,(d,)ldi
;=1 ;=1 i=1
We have used the above equation to determine the Sauter mean diameter of the drops in
the whole diameter range, for the drops with diameter above 10 J.lm, and also for
50

CHAPTER TWO EXPERIMENTAL PROCEDURES
satellite droplets with diameter below 10 ~m. Table 2.2 compares the Sauter mean
diameter for the above three groups of drops for the data in Table 2.1. It is obviously
seen that the presence of a large number of satellite droplets has a great effect on the
Sauter mean diameter.
Table 2.2 Sauter mean diameter for different size classes of drops presented in Table 2.1.
whole range (D' 32) d > 10 ~m (D32) d < 10 ~m (d32)
Sauter mean diameter 22.94 62.73 2.27 (!lm)
In order to track the variations in the mean drop size of the daughter drops, the satellite
droplets, and the whole population of drops in the course of a reacting/non-reacting
dispersion process, the Sauter mean diameter has been separately calculated for these
populations. The corresponding Sauter mean diameters are labelled as: daughter drops
(D32), satellite droplets (d32), and the whole drops (D'32)'
2.3.2.2 Optical Microscopy
As a complementary method, the particle/drop size was also measured using an optical
microscope connected to a camera and a graphic printer. Several photographs were
taken from each sample and 350-500 drops were counted. The number frequency
distribution obtained was used to calculate the other distributions and the Sauter mean
diameter.
A comparison of the resulted DSD from the two methods for a typical sample is
illustrated in Figure 2.4. Good agreement is observed between the results of the two
methods. Some differences can be seen, however, in the small-size range. These
differences can be explained in view of the accuracy of each technique in measuring the
small-size portion of the drops and their inherent measurement errors. In the laser
diffraction method, the size range is discretised on the logarithmic diameter scale,
which places more weight on the small-size droplets. On the other hand, the actual
determination of drop sizes by photography may result in significant errors, especially
for small drops that cannot be distinguished very clearly (Mlynek and Reshnik, 1972;
51
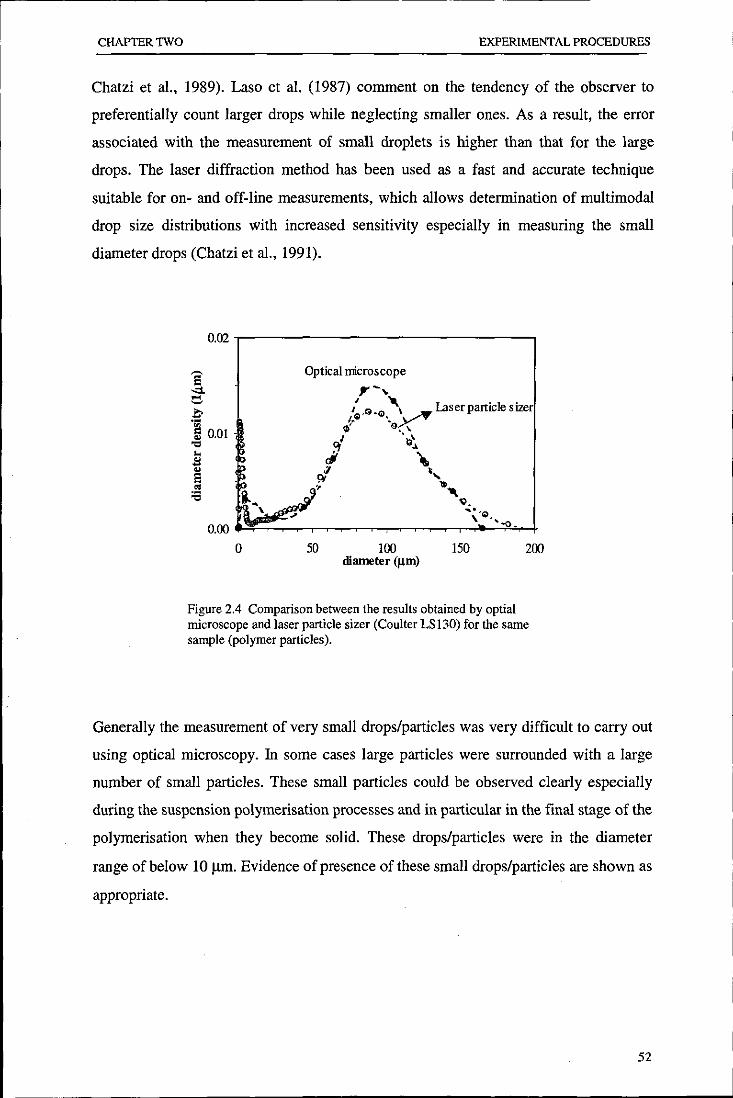
CHAPTER TWO EXPERIMENTAL PROCEDURES
Chatzi et aI., 1989). Laso et al. (1987) comment on the tendency of the observer to
preferentially count larger drops while neglecting smaller ones. As a result, the error
associated with the measurement of small droplets is higher than that for the large
drops. The laser diffraction method has been used as a fast and accurate technique
suitable for on- and off-line measurements, which allows determination of multimodal
drop size distributions with increased sensitivity especially in measuring the small
diameter drops (Chatzi et al., 1991).
0.02.,...-----------------,
50 100 150 200 diameter (flm)
Figure 2.4 Comparison between the results obtained by optial microscope and laser particle sizer (Coulter LS 130) for the same sample (polymer particles).
Generally the measurement of very small drops/particles was very difficult to carry out
using optical microscopy. In some cases large particles were surrounded with a large
number of small particles. These small particles could be observed clearly especially
during the suspension polymerisation processes and in particular in the final stage of the
polymerisation when they become solid. These drops/particles were in the diameter
range of below 10 /lm. Evidence of presence of these small drops/particles are shown as
appropriate.
52

r---------------------------------------------------------------------~------
CHAPTER TWO EXPERIMENTAL PROCEDURES
2.3.3 Interfacial Tension
Interfacial tensions between MMA and aqueous solutions of PV A (the grade used in
this study) were measured using a Du Nouy ring tensiometer. The principles of this
method have been presented in Appendix C. No correction was made on the reading.
15 cm3 of different aqueous solutions of PV A (0.25, 0.5, 1.0,2.0,4.0, and 10.0 g1I) were
prepared and transferred into small glass dishes. 15 cm3 of MMA was added very gently
through the sidewall of the dish to lie as a layer on top of the aqueous phase. Samples
were allowed for 30 min to reach the thermodynamic equilibrium before any surface
tension was recorded. Measurement was repeated three times for each sample. The
average value was reported as the interfacial tension. The surface tension of pure water
was measured to check the reliability of the tensiometer.
2.3.4 Aqueous-phase Monomer Concentration
Monomer concentration in the aqueous phase was measured using a Gas-Liquid
Chromatograph (Pye Unicam 304-FID GLC). A brief description of gas-liquid
chromatography (GLC) has been presented in Appendix D.
A general-purpose capillary column, wall coated-fused silica-CP-SIL5, was used. The
detector used was flame ionization one (FID). The advantage of this detector is that it
does not detect water, in addition to its high sensitivity. The carrier gas was helium
(He). The GLC measurements were carried out at the following conditions: column
temperature of 40°C, injector and detector temperature of 125 and 130°C, respectively;
the flame fuel gases hydrogen and air at 17.0, and 10.0 kglcm2, respectively, and the
carrier gas He at the flow rate of 18 ml/min. Samples of 1 ~l were injected to the
column. For each sample, two injections were carried out and the average value was
used. In the case of a large discrepancy between the output values, the injection was
carried out for the third time and the average of all three injections was used.
Calibration: Methanol (Me) was used as the internal standard to avoid the effect of
variation in sample volume to the injection port. In order to calculate the concentration
of MMA in the sample, a calibration curve is required.
The calibration curve for GLC measurement was prepared using the following
expression:
53
-~- --- - -------------------------------------------------------------------

CHAPTER TWO EXPERIMENTAL PROCEDURES
WMMA = Fr AMMA
WMe AMe (2.8)
where WMMA and WMe are the weight of MMA and the standard, Me, in the sample, and
AMMA and A Me are surface areas of the MMA and the standard in the chromatographs,
respectively. Fris the response factor of MMA compared to the internal standard.
10 standard solutions of MMA, Me, and water (with known concentrations) were
prepared and injected into the OLe. The addition of water was made to obtain samples
similar to those from the dispersions. Using the surface areas of MMA and Me in the
obtained chromatographs, and the weight ratios of the MMA and Me in the samples, the
calibration curve shown in Figure 2.5 was drawn, according to the above equation. The
slope of this graph shows the value of response factor, F, = 0.84, which remains
constant with concentration ratio of MMA and Me, and also with the concentrations of
other ingredients such as water.
Sample preparation: Samples were taken from the reactor at appropriate intervals and
kept in capped test tubes for a while to allow for phase separation to occur. Samples
from the aqueous phase were withdrawn with a syringe and weighed. A known amount
of a Methanol solution (with known concentration) was added to the samples. Using the
response factor, and the known values of MMA and Me peak areas and weight of Me in
the sample, it is possible to calculate the MMA weight in the sample from which the
monomer concentration in the water phase can be calculated.
25
20 ~
:: 15 -~ ';10
5
0
0
Figure 2.5 Calibration curve for calculating MMA concentration in the aqueous phase using methanol (Me) as the internal standard.
54

CHAPTER THREE EXPERIMENTAL RESULTS AND DISCUSSION
CHAPTER THREE
EXPERIMENTAL RESULTS AND DISCUSSION
INTRODUCTION
The experimental results from the MMA batch suspension polymerisation with PV A as
a stabiliser and LPO as an initiator are presented in this chapter. The MMNwater
dispersions were also carried out with PV A as stabiliser.
LPO was used to limit the formation of emulsion particles. Experiments with initiators
such as azobisisobutyronitrile (AffiN) resulted in the formation of a large number of
emulsion particles so were not perused in this research.
Drop size measurements was carried out with laser light diffraction method. The initial
results obtained by optical microscopy are given in the first year report and not repeated
here. The variables studied in this research are:
1. Suspending agent (PVA) concentration that mainly affects properties of the
continuous phase.
2. Initiator (LPO) and chain transfer agent (n-DDM) concentrations that affect
properties of the dispersed phase.
3. Inhibitor concentration (water-soluble and oil-soluble inhibitors) that may affect
properties of both phases.
4. Reaction temperature that affects properties of both phases but mainly the
dispersed phase (kinetics of polymerisation).
5. Agitation speed that affects the mixing conditions and directly the drop/particle
size.
6. Monomer hold up that affects directly the drop/particle size. It also affects
properties of both phases due to monomer partitioning between the two phases.
In the following sections the effects of these variables on the evolution of average
particle size and distribution, in both non-reacting dispersion and suspension
polymerisation of MMA, are presented.
55

CHAPTER THREE EXPERIMENTAL RESULTS AND DISCUSSION
3.1 EFFECT OF PVA CONCENTRATION
3.1.1 INTRODUCTION
The perfonnance of a stabiliser in terms of its ability to stabilise a droplet is a function
of surface coverage of the drop, and diffusion and adsorption characteristics of
stabiliser molecules, which is further determined by the molecular properties of the
stabiliser. For polymeric stabilisers soluble in the continuous phase, stability of liquid
liquid dispersions was found to increase with both increasing polymer molecular weight
and degree of grafting of hydrophobic branches. In this case drop stabilisation is
achieved mainly by an increase in the resistance to film thinning thus hindering the
coalescence process. This may be achieved through two mechanisms. The first is
related to higher viscosity of continuous phase with adding polymeric stabiliser. The
other mechanism is what has been called "Marangoni effect". When the intervening
film thins, it sweeps along its path the stabiliser molecules adsorbed on the interface,
creating a stabiliser concentration gradient and subsequent interfacial tension gradient
that opposes the film thinning (He et al., 2002).
PV A, is one of the polymeric water-soluble stabilisers used in suspension and emulsion
polymerisation processes. A number of studies have been done on suspension
polymerisation using PV A as stabiliser and the effects of its characteristic properties on
stabilisation of drops (e.g., Konno et aI., 1982; Goodall and Greenhill-Hooper, 1990;
Castellanos et aI., 1991; Mendizabal et aI., 1992; Zerfa, 1994).
Effect of degree of hydrolysis: For PVA, an increase in hydrophobicity represents an
increase in the driving force for the molecules to move to and adsorb onto the
water/monomer interface, which improves the stability of dispersion. Therefore the
lower the degree of hydrolysis for PV A, the higher the driving force for adsorption and
the better is drop stability (He et al., 2002). As the degree of hydrolysis increases the
interfacial tension increases and larger drops with broader distribution are obtained
(Chatzi and Kiparissides, 1994). Using PVAs with a very low degree of hydrolysis «
80) or molecular weight, however, results in some coagulation and agglomeration of
polymer particles and the fonnation of polymer lumps, while using PV As with a very
high degree of hydrolysis (>90) result in unstable dispersions leading to fonnation of
56

CHAP'IER TIlREE EXPERIMENTAL RESULTS AND DISCUSSION
shapeless polymer bulk (Castellanos et al., 1991; Mendizabal et aI., 1992). PVAs with a
very high degree of hydrolysis are too hydrophilic to adsorb strongly enough at
monomer-water interfaces to form a coherent film that will inhibit drop coalescence.
Effect of Molecular Weight: The ability of PV As, of similar degree of hydrolysis, to
stabilise dispersions increases with increasing molecular weight. But this influence is
more significant for PV As with a lower degree of hydrolysis (He et al., 2002). The
thickness of the PV A adsorbed layer on drops increases with increasing molecular
weight of PV A. For low molecular weight PV As the thickness of the adsorbed layer is
very small and so, during the polymerisation, the drops can approach each other closely
enough for the adsorbed polymer segments to interact and become entangled (bridging).
The result is the formation of polymer lumps.
It has been reported that the best PV A grade for using as a stabilising agent in
suspension polymerisation is a PVA with degree of hydrolysis of 80-90 and molecular
weight above 70000 (Goodall and Greenhill-Hooper, 1990; Castellanos et al., 1991;
Mendizabal et aI., 1992). This grade of PVA forms a thicker and stronger layer on the
water/monomer interface and has less tendency to desorb, therefore, a similar grade was
selected as stabiliser for the current research.
One of the crucial factors in the control of polymer beads formed in suspensIOn
polymerisation reactors is the concentration of the stabiliser used. Increasing the
concentration of stabiliser in general, and PVA in particular, has been found to increase
its ability to stabilise the dispersion due to steric and Marangoni effects. Although it has
been also reported that some types of PV As at high concentrations show a decrease in
coalescence time probably caused by partial cancellation of Marangoni effect due to
readily available stabiliser molecules in the continuous phase. It has been shown that
the increase in viscosity of the continuous phase with increasing PV A concentration
does not play a major role in drop stabilisation (He et aI., 2002). In an excellent paper,
Konno et al. (1982) reported the effect of PV A concentration on the coalescence of
dispersed drops in suspension polymerisation of styrene. They, for the first time,
monitored the transient drop size during polymerisations and suggested that the
coalescence of dispersed drops above the maximum stable drop size is not effectively
prevented by the stabiliser. A smaller mean particle size and sharper PSD have been
obtained with increasing PV A concentration (Konno et al., 1982). With increasing PV A
concentration in a liquid-liquid dispersion, mean drop size decreases and PSD becomes
57

CHAPTER THREE EXPERIMENTAL RESULTS AND DISCUSSION
narrower (Chatzi and Kiparissides, 1994). Chatzi and Kiparissides (1994) have also
reported formation of bimodal PSDs suggesting erosive mechanism for drop break up.
In this series of experiments, we study the effect of PV A concentration on the evolution
of particle size distribution hi MMA suspension polymerisation. Particular attention has
been paid to the formation and growth of very small droplets. To underline the
characteristic features of drop evolution in suspension polymerisations, or a reacting
liquid-liquid dispersion, the results have been compared with those from corresponding
non-reacting liquid-liquid dispersion.
3.1.2 EXPERIMENTAL
The materials, experimental procedure and measurements have been described in detail
in Chapter 2. All experiments (polymerisations and dispersions) in this series were
carried out at 70°C and an agitation speed of 500 rpm. The MMA hold up was 0.20.
The LPO concentration (for polymerisation runs) was 1.0 wt% based on the monomer
phase. Different PV A concentrations were used in this series.
Two series of experiments were carried out in this study. In one series, the entire
required amount of PV A was used in the initial formulation. In another series, a part of
PV A was used in the initial formulation and the second part was added during the
polymerisation.
Interfacial tensions of MMNaqueous PV A solutions were measured for different PV A
concentrations.
3.1.3 RESULTS AND DISCUSSION
3.1.3.1 Non-reacting MMAlWater Dispersion
Mean Drop Size: The time evolution of the Sauter mean diameter of drops in the
MMA-water dispersions with PV A concentrations of 0.2, 0.5, 1.0, 4.0, and 10 gIl is
shown in Figure 3.1.1. D32 and d32 are the Sauter mean diameters for drops with
diameter higher (daughter drops) and lower (satellite droplets) than 10 !lm, respectively.
D'32 is the Sauter mean diameter of all drops. Figure 3.1.1a shows that the drop sizes
are exponentially reduced with time until they approach a fairly constant value. Based
on these figures, the evolution of drop size can be divided into two stages; transition
and quasi steady-state. During the transitions stage, drops are broken into smaller drops
as they pass through the impeller region. A steady state, or a near steady state, was
58

CHAPTER TIIREE EXPERIMENTAL RESULTS AND DISCUSSION
reached in about 2 hours after which the size of drops did not significantly vary. With
increasing PV A concentration, the rate of drop break up increased during the transition
period due to a lower interfacial tension. Also the minimum transition time decreases
with decreasing interfacial tension (Chatzi et aI., 1991). As a result, a shorter transition
stage and a lower steady-state D32 was achieved with increasing PV A concentration.
The difference, however, became less important with increasing PV A concentration.
This is backed by a diminishing difference in the interfacial tension (0) with increasing
PVA concentration as can be seen in Figure 3.1.2.
100 a
PVA(gII) <>0.2 ~75
00.5 <11.0 04.0 )1:10
].50 ~OOOO!)O .~ ::l l:l <> go o~ 25 XXAoII! <1 0 x8 0
o 30 60 time (min) 90 120 150
5~--------------------------------------~ 4 PV A (gII) <> 0.2 00.5 A 1.0 04.0 X 10
o
1
o 30 60 time (min) 90 120 150
40,--------------------------------------,
c PVA (gIl)
l:l1O
o 30
<>0.2 00.5 A 1.0 04.0 X 10
o <> 0 XO
60 time (min) 90 120
o
150
Figure 3.1.1 Time evolution of a ) daughter drops, b) satellite droplets, and c) overall Sauter mean diameter with different PVA concentrations.
59

CHAPTER THREE EXPERIMENTAL RESULTS AND DISCUSSION
15e---------------------------------------. I I I I
~
~-~----tt----------tt----------------------------------~ o 2 4 6 8 10
PV A concentration (gII)
Figure 3.1.2 Variations of interfacial tension with PVA concentration.
According to Figure 3.1.1b, the size of satellite droplets does not seem to be affected by
the PV A concentration. The time variations of the overall Sauter mean diameter, D' 32,
(Figure 3.1.1c) is similar to D32•
Drop Size Distribution: Figures 3.1.3 to 3.1.5 demonstrate the time evolution of drop
size distribution for dispersions with 0.2, 1.0, and 10.0 gIl PV A. The micrographs for a
typical run is shown in Figure F.l (Appendix F). The size distribution of daughter
drops continuously narrowed and shifted to a smaller size with time. It is quite
interesting to note that size distributions never reached a real steady-state distribution.
Even after 150 min, the size distribution was still narrowing with time, but with a much
lower rate. For practical applications, however, the average size of drops may be
considered constant.
The results indicate that a large number of satellite droplets are formed. The mechanism
of formation of these droplets is discussed in chapter one. Figure F.2 (Appendix F)
shows micrographs of drops sorrounded with numerous satellite droplets. The
formation of stalite droplets was also observed for the styrene/water dispersion in the
presence of PVA, but to a lesser extent (Appendix E). In Figure 3.1.6, the variation of
the volume fraction of the satellite droplets (/vs) is plotted against time for different
PVA concentrations. The general trend observed from the family of curves shown in
Figure 3.1.6 is that the overall volume of the satellite droplets increases with time and
PV A concentration and reaches a plateau at a later time.
60

CHAPTER THREE EXPERIMENTAL RESULTS AND DISCUSSION
~0.05
00.04 .e-'i!i 0.03
" "<:I ... 0.02 " ~ " EiO.QJ ,~ "<:I
0.00
0
~ 0.05
~0.04 ~
E 0.03 ~ " "<:I 0.02 ... " ~ " O.QJ Ei ;8 0.00
0
a
b
2
50 100
4 6 diameter (J.l.IIl)
"-0' -O,S min
- - -<>- - - 20 min
- - -& - -60min
-lIE-1S0min
ISO
- - -0 - -O.5min
- - -<>- - - 20 min
- - -& - -60min
-lIE-1S0min
8
Figure 3.1.3 Time evolution of a) daughter, and b) satellite drop size distributions
in dispersoin with PV A = 0.20 gIl.
~ 0.05 a - - -0 - -0.5 min
~ 0.04 - - -<>- - - 10 min ~
i O.Q3 - - -& - -60min
" -lIE-lSOmin "<:I 0.02 " ... ~ .l!! .. A..I3·B · 8 ' 8-a . " om ~
a . '9 __ 8 . • --e
0.00 " - - El ..
0 50 lOO 150 diameter (J.l.IIl)
~ 0.05 b ·-o·"O.5min
;::; 0.04 - - -<>- - - ID min ~
.e-'<Jl 0.03 ---&--60min c;
-lIE-I50min " ... 0.02 ... " ~ " 0.01 aseBG·S·B. :: - .. Ei ,~
200
10
200
... 0.00 B-{l_{I El - ..
- - - -B .. ..- .......
0 2 4 6 8 diameter (J.l.IIl)
Figure 3.1.4 Time evolution of a) daughter, and b) satellite drop size distributions
in dispersoin with PV A = 1.0 gIl.
10
61

CHAPTER THREE EXPERIMENTAL RESULTS AND DISCUSSION
50
o 2
100
4 6 diameter (1lIll)
.• G' '0.5 min
•• -0-' '20 min
• • ".. •• 60 min
--lIE-- 150 min
150
•• G • '0.5 min
• • -0-' '20 min • • 0:6- • ·60 min
)I( 150 min
8
Figure 3.1.5 Time evolution of a) daughter, and b) satellite drop size distributions in dispersoin with PVA = 10 gIl.
0.20 o
0.15 D
~ <> 0.10
0.05
PV A (gII) <> 0.2 Dl "'4 010
0.00
0 20 40 60 80 lOO 120 140 time (min)
Figure 3.1.6 Time variation of volume fraction of satellite droplets in dispersions with different PV A concentrations.
200
10
160
62

CHAPTER THREE
3.1.3.2 MMA Suspension Polymerisation
3.1.3.2.1 One-Shot (Batch) Addition of PVA
EXPERIMENTAL RESULTS AND DISCUSSION
Rate of Polymerisation: Figure 3.1.7 shows the conversion-time variation for runs with
PVA concentrations of 0.1,0.2,0.5, 1.0, and 4.0 gIl (conversion was not measured for
PV A = 10 gIl). As it is seen from this figure all the data points fall on the same curve
indicating that PV A concentration does not affect the rate of polymerisation. It is also
evident that the rate of polymerisation shows a drastic increase around the conversion
of 0040 because of the gel effect. The onset of the gel effect was reached in about 60
min. Within the next 10 min, the conversion reached a value as high as 0.9. Events in
the time interval of 60-70 min, therefore, have a crucial effect on the PSD evolution
because of the viscosity increase in the particles in association with the gel effect.
~r1> A 0" 0 0
0.8 0
~ =0.6
PVA (gIl) 'S rR • tf
.0.1 ~ S°.4
~~ +0.2 00.5
0.2 A 1.0
fft~ 04.0
0
0 20 40 60time (milt) 100 120 140 160 180 200
Figure 3.1.7 Conversion-time variations for runs with different PVA concentrations (for other conditions see section 3.1.2).
Mean Particle Size: Figure 3.1.8 illustrates the variations of the Sauter mean diameter
of daughter drops, satellite droplets and the whole population of drops with time. In
order to correlate the time evolution of drops to the kinetics of polymerisation and the
status of the reaction system, the variations in Sauter mean diameter of daughter drops
with conversion is shown in Figure 3.1.8d. The average drop size initially decreased
with time (this may be again called transition stage), reached a plateau, and then either
remained practically constant or increased with time depending on the PV A
63

CHAPTER THREE EXPERIMENTAL RESULTS AND DISCUSSION
concentration.
The pattern of variation in drop size with time after the end of the transition stage can
be characterised by up to three intervals depending on the polymerisation conditions.
The first interval is the quasi steady-state stage during which a rather constant drop size
is maintained by balanced rates of drop break up and coalescence despite an increase in
the drop viscosity. The occurrence of a steady state for suspension polymerisation is not
always certain because of kinetic events occuring in the polymerising drops. Note that
even for the dispersion processes there is some reduction in the size of drops with time
during the so called quasi steady state. Unlike the dispersion process without
polymerisation, the overall size of drops at the plateau showed a mixed behaviour with
increasing PV A concentration because of the formation of satellite droplets. In the case
of the PV A concentration of O. I g1I, the steady state was never reached and drops grew
continuously, after the first reduction, until mass coagulation of particles occurred 20
min after the start of the polymerisation (see Figures 3.1.8a and 3.1.8c). For PVA
concentration of 0.2 g1I, the steady state lasted for 40 min and after that drops started
growing very steeply. For PVA concentration of 0.5 g/l, the quasi steady state lasted for
50 min and then drops grew slowly. For PV A concentrations of 1.0 g/I and more, the
polymerisations produced almost the same trend of constant drop size until
approximately 62 min. Generally, the duration of the steady-state was prolonged with
increasing PV A concentration.
As the drop viscosity increases, a point is reached where drops can not be easily broken
up but they can still undergo coalescence. As a result, drops start growing by
coalescence. This interval can be called the growth stage. This stage has been called the
sticky stage in the literature perhaps because of the impression that drop coalescence
increases with the drop viscosity due to increasing drop tackiness. However, the present
author believes that this is a misleading title because, during this interval, particles are
usually more stable against coalescence than in the earlier stage. The viscosity increase
in the drops reduces the rate of drop break up more significantly than drop coalescence
resulting in an increase in the size of particles. Drops with less coverage with the
stabiliser are more susceptible to coalescence after a collision due to a weaker surface
protection. The higher the PV A concentration, the later was the onset of the growth
stage, and the less was the particle enlargement during the growth stage due to higher
surface coverage ratio of particles. This can be readily realised from Figure 3.1.8.
64

CHAPTER THREE EXPERIMENTAL RESULTS AND DISCUSSION
400 a
~300
1 ~
~"2oo
lOO
0 0
5
b 4
. , ,
,x i , $
, , ,
PVA(gII) •• *. ·0.1 · . 0 .. 0.2 "0"0.5 • • 1:r •• 1.0 · . 0 . '4.0
lIE 10 ... _ ••. ---~.' ••• " •• -" •• .......... 0()
••••••• 11!. ••••• -A
~~~~_"~.:..:. '':'':' '..:..:' .~. ':.:.' .:..:.' '.:..:.' .~. C"" {3. ·····EJ
20 40 60 80 100 120 140
PVA(gIl) ··0· '0.5 ··0' '4.0 .• ,*. '10
13 ;& ................. ······-0
r;!2 ~""'-,= i .,. ~-- -'" "~;. ·x· -·ix-x.·'· rn. ••. ~ •.••••• "'" .. •• .... ·!3 .. •• .. EJ I"' ....... •··· " .......... )I(
0 0 20 40
120
c
90
to ~
~
30
0
60 80 lOO 120 140
PVA (gII) •• * .. 0.1 •• 0 •. 0.2 •• 0 • ·0.5 •• 1:r •• 1.0 •• 0 •. 4.0 .• '* .. 10
pr"···· .0
~e_ ................. ·······0 • ~
................ -A
'.:t(.": :: ...•• ::, ,,'. 'lIC , .. "!3--"-€l
160
160
0 20 40 60 80 100 120 140 160
400
d
300
1200 ~ ~
100
time (miD)
PVA(gll) ·0 .. 0.2 "0"0.5 •• -l!r •• 1.0 .. 0 .. 4.0
0.2 0.4 conversion 0.6 0.8
Figure 3.1.8 Variations of Sauter mean diameter of a )daughter, b )satellite and c )all drops with time and d)daughter drops with conversion for different PVA concentrations.
65

-------- ~---
CHAP'IER THREE EXPERIMENTAL RESULTS AND DISCUSSION
At the end of the growth stage, drops have a very high viscosity and behave like solid
particles. These drops cannot coalesce with each other and they keep their identity for
the remainder of the process. This has been called the identification point (Alvarez at
al., 1994). Variations in average drop size occur in both the transition stage and the
growth stage but sizes remain almost constant during the steady state and during the
identification stage (i.e., after the indentification point is reached); although some
limited flocculation may occur during the identification stage.
Particle Size Distribution: Figures 3.1.9 to 3.1.14 show the time evolution of PSD for
the PV A concentrations of 0.1,0.2, 0.5, 1.0,4.0, and 10.0 gIl, respectively. The peak for
daughter drops, or bead particles, which covers the particle size > 10 J1m, have been
clearly illustrated in Figures 3.1.9a to 3.1.14a. The peak for satellite droplets, which
appeared under 10 J1m, has been clearly shown in Figures 3.1.9b to 3.1.14b. Figure F.3
(Appendix F) shows typical SEM micrographs of particles and satellite particles. In
some instances the surface of large particles are covered with small particles indicating
the importance of particle flocculation in the system under study. The flocculation of
small satellite particles with themselves and large particle was also observed.
1°·03 a ;::, ~
.e- 0.Q2 'i§ " "'" tom ~h -" 8 ........ :9 0
." .•. ::~.tt:·.· .... . -.. ... ....... ..
·-~""O.5min
.... +· .. 23min - - -N - - 32 min - -..,. - -38 min ---*--43min
JI( 46 min
0 200 400 600 800
~
§. 0.05 b -..... ~ 0.04
f 0.03 " " "'" 0.02 .. " -0.01 " S ~ 0
0
diameter (IIM)
a __ •.•
2 4 6 diameter (IIM)
.... 0&" -0.5 min ··.qo·-23min "" -I¥''' -32min .... -0-" "38min ---*--43min
JI( 46 min
8
Figure 3.1.9 Time evolution of a) daughter, and b) satellite drop size distributions in the run with PVA=Q.IO gIl.
10
66

CHAP1ER THREE EXPERIMENTAL RESULTS AND DISCUSSION
0.03.,.--------------------,
~ 5 0--02
~ ~ j ~I ,$ ."
o
a
o 200 400 diameter (Ill")
.... -0- .. .. 0.5 min - - ..... - -20 min ·-..()o·"42min - - ...,. - -58 min
)I( 70min
t> 0.05 b - - ..,. - -0.5 min '~ 0.04 - - ....... 20 min " ~ ~ ~.03 - . o()o - -42 min .l!j 20 ...... "58 min
600
a .02 __ 70min
:S O.O~ Lr:=~~~~~:!i!: ~~.~. dQt:t:;*~~i~J o 2 4 6 8
diameter (Ill")
Figure 3.1.10 Time evolution of a) daughter, and b ) satellite drop size distributions in the run with PV A = 0.20 gn.
'[0.03
;::; ~
t>O.02 ';l
= " ." al 0.01 ~
" ~ 0
a .... -0- .... 0.5 min ··-O-·"12min ......... -32min
"*--5Imin -- o()o -- 64 min __ 70min
10
0 lOO , 200 dIameter (1ll"1
300 400
~.05 ~.04 t> '~.03 " ." ~0.Q2
" ~ So·OI
:a 0 0 2 4
diameter (Ill") 6
.... .g. .. -0.5 min
.... 000-" -12 min -- .... --32 min
-"*'-5Imin
I 11;
8
Figure 3.1.11 Time evolution of a) daughter, and b) satellite drop size distributions in the run with PV A = 0.50 gn.
10
67

CHAPTER TIlREE EXPERIMENTAL RESULTS AND DISCUSSION
~ 0.03
~ ,e. 0.02
'i!l '" ... 1l:: 0.01 II § :a 0
.. --a-"·lmin
...... .. -12 min
.... -,0... .. -40min
--*--60min
0 50 diameter (JlIIl) 100 150 200
'[ 0.05
e 0.04 ~ 'i!l 0.03
'" ~ 0.02
" -~ 0.01
:a 0
0 2 diameter~JlIIl) 6
.... .g.. .. ·1 min
....... • .. 12min
- - .... - -40min "·*··60min
8
Figure 3.1.12 Time evolution of a) daughter, and b) satellite drop size distributions in the run with PV A = 1.0 gIl.
\0
'[ 0.03,------------------,
;:, ---o--0.5min ~
... - - -<> - -20 min ;;:: 0.02 ~ .... ~ .. ·60min
--70min j 0.01
... 0.00
'[0.05 ;:, -;: 0.04 ;;:: 50.03 ... ::; 0.02 II
o 50 100 diameter (1J.Il1)
b
150 200
- - -0 - - 0.5 min - - -<> - -20min .... --fr .. .. 60 min __ 70min
.~ 0.01
... 0.00 l-lJ.~--~~~&1~~~~Bl·:;:·:t:!·~'~-::!:-:!l· 6~1:i:i::~:!±~ o 2 4
diameter (1J.Il1) 6 8 10
Figure 3.1.13 Time evolution of a) daughter, and b) satellite drop size distributions in the run with PV A = 4.0 g/l.
68

CHAPTER THREE EXPERIMENTAL RESULTS AND DISCUSSION
0.03 -r----~""=--------------__, - - 0- - '0.5 min
- - -0- - '20 min
- - ... - '60 min
--70min
} -;;: 0.02
! ... 0.01
i -S __ S
~ 0.00 -I-Jiiiill!!~~---, __ ....:;.~:t:.~~ .......... -:,,:-~i3::-~-.;\-~.:..ij..:..;:...:..e."""'~
10.05
e 0.04 ,e. .~ 0.03 ~
;: 0.02 $ aO.D1
:a 0.00
o
o 2
50 100 150 200 diameter (J.ID1)
4 diameter (J.ID1)
6
- - 0- - '0.5 min
- - -0- - '20 min
- - .. - - '60 min
--70min
8 10
Figure 3.1.14 Time evolution of a) daughter, and b) satellite drop size distributions
in the run with PV A = 10 gll.
The evolution of satellite droplets is discussed below. Generally, satellite droplets were
continuously formed during polymerisation by break up of daughter drops up to 60 min
from the start of polymerisation as can be observed in Figures 3.1.9b to 3.1.J4b.
Satellite particles were also observed in the suspension polymerisation of a sparingly
water-soluble monomer (styrene) with PVA as a stabiliser (Appendix E). Figure 3.1.15
clearly shows that, however, satellite droplet formation was less prevalent at the higher
PV A concentrations so that for the PV A concentration of 10 g/l, the volume fraction of
the satellite droplets reached a constant value early in the reaction. An interesting result
is that the order of satellite formation takes an opposite trend to that observed for the
dispersion process in which satellite formation increased with PVA (see Figure 3.1.6).
One possible explanation for this is as the polymerising drops becomes smaller with
increasing PV A concentration, their stability is increased and their vulnerability to
break up is reduced because of their viscosity cohesive force. As a result the formation
of satellite droplets is hindered. Whereas at a lower PV A concentration, where the
polymerising drops are large as well as unstable, the more viscous drops are more
69

CHAPTER THREE EXPERIMENTAL RESULTS AND DISCUSSION
favourably broken up into satellite droplets because of shift in the mechanism of the
drop break up with drop viscosity. At intermediate PV A concentrations, i.e. 1.0 gIl
PV A, the evolutions of droplet volume fractions for the non-reacting dispersion and
suspension polymerisation processes are comparable.
In contrast to Figure 3.1.1 b which shows a constant d32 for the satellite droplets formed
in the dispersion process, as seen in Figure 3.1.8b, d32 of those droplets formed in the
suspension polymerisation decreased at higher PV A concentrations but remained
constant at a lower PV A concentration. It seems that the viscosity build up in drops will
change the mechanism of drop break up from bursting to stretching so that more
satellite droplets are formed. It has been reported that the rate of drop break up at a high
viscosity becomes independent of interfacial tension (Calabrese et aI., 1986; Koshyet
aI., 1988b). Figure 3.1.15 reveals that the volume fraction of satellite droplets reaches a
maximum around 45-50 min from the start of the polymerisation and suddenly
decreases after that. At a low to medium PV A concentration, where drops are not
sufficiently stabilised against coalescence, satellite droplets are removed from the
suspension by coalescence with daughter drops and between themselves during the
growth stage. With increasing PV A concentration, more of the satellite droplets could
be preserved in the suspension. For a PVA concentration of 4.0 g/l, see Figure 3.1.13b
and Figure 3.1.15, only a small fraction of satellite droplets were lost during the growth
stage. Interestingly, for the PVA concentration of 10.0 gIl, see Figure 3.1.14b and
Figure 3.1.15, almost all satellite droplets remained in the reaction medium.
0.225
0.2 PV A (gIl) ~ 0.5 DI 010
0.175
0.15
0.125 • • 0.1 .....,
0.075
0.05
0.025
0
0 20 40 60 80 lOO 120 140 160 time (miD)
Figure 3.1.15 Time variation of volume fraction of satellite droplets in polymerisations with different PV A concentrations.
70

CHAPTER THREE EXPERIMENTAL RESULTS AND DISCUSSION
Generally the evolution of the PSD of daughter drops followed a similar pattern to that
of the Sauter mean diameter. The size distribution of daughter drops initially narrowed
and shifted to a lower value of drop size with time (transition stage). The evolution of
the size distribution after the transition stage showed a quasi steady state and a growth
stage with magnitudes depending on the PV A concentration. Note that the fact that the
PSD curves include two peaks and a constant Sauter mean diameter does not
necessarily mean a constant PSD for either type of drops, but only for the overall PSD.
During the quasi steady state, the PSD of daughter drops moved slightly to the higher
range, because of a decreasing rate of drop break up due to increasing drop viscosity.
However this was simultaneously compensated for by the formation of large number of
satellite droplets leading to a rather constant overall Sauter mean diameter. The PSDs
remained unchanged after 70 min when the identification point was reached.
3.1.3.2.2 Two-Stage Addition of PVA
Three experiments were carried out semi-batchwise at initial PV A concentrations of
([PVA]o=) 0.1, 0.15, and 0.25 gIl. The total PVA concentration was kept constant at 0.5
gIl. The remainder of the PV A (to make the final PV A concentration equal to 0.5 gIl)
was added to the reaction vessel in one shot after 50 minutes from the start of the
polymerisations. The desired amount of PV A was added as a 1.0 wt% PV A aqueous
solution. In a further experiment the remainder of the PV A was fed to the reaction
vessel continuously with a dosing pump. In that experiment an initial PV A
concentration of 0.25 gIl was used and the rest of the PV A (in the form of a 0.5 wt%
PV A aqueous solution) was added with a pump during the reaction until t = 50 minute.
Rate of Polymerisation: Figure 3.1.16 shows the conversion-time for runs with
different initial charges of PV A. The overall rate of polymerisation was not affected by
the addition procedure, as was expected.
71

CHAP'IER THREE EXPERIMENTAL RESULTS AND DISCUSSION
0.8
§ 0.6 .;;; .. " ~ 0.4 0
" 0.2
0
0 50 time (miD) 100
PVAo (gII) 00.1 00.15 00.5 (one shot) l!J. 0.25 (pump)
150 200
Figure 3.1.16 Conversion-time variations for one shot and two shot PV A additions. (for other conditions see section 3.1.3.2.2).
120r---------------------------------------~
a
80
0
0 40
5
b
4
3
~ 1;: 2
."
PVAo (gII)
time (miD)
PVAo (gII)
-·0·-0.1 - - -0- - ·0.15 --~--0.25
- - 0 - -0.5 (one shot) - •• :If • ·0.25 (pump)
80
··0·-0.1 •• -0- • -0.15 --~ ··0.25 - - 0 - ·0.5 (one shot) . -* . -0.25 (pump)
...........................
120
o+-__ --~--__ ~--__ --____ --__ --____ --__ ~ o 40 time (miD) 80
Figure 3.1.17 Variations of Sauter mean diameter of a) all drops and b) satellite droplets with time.
120
72

CHAP'IER THREE EXPERIMENTAL RESULTS AND DISCUSSION
Mean Particle Size: Figure 3.1.17 shows the variations of overall Sauter mean diameter
(D'32) with time for this series. Generally, the application of a higher concentration of
PV A resulted in a longer steady-state period. For [PV A]o = 0.1 gIl, there was a short
steady-state period and drops enlarged 20 min after the start of the polymerisation
leading to a significant growth in the size of particles. The addition of the remainder of
the PV A improved the stability of particles and maintained their size in the course of
polymerisation (for this experiment the size of particles exceeded the operational size
range of the particle sizer after 45 min, so photographs were taken from the samples
using an optical microscope and the particle size average was determined by counting
about 300 particles). For the higher initial charge of PV A, drops showed a rather long
steady-state period. The growth stage started after about 62 min from the start of the
polymerisation. The interesting result is that by post-addition of the stabiliser, it is
possible to control the size of final particles within a rather wide range. Furthermore, it
is possible to produce finer particles with the same overall concentration of the
stabiliser. From Figure 3.1.17, it is conjectured that there could be a critical
concentration of PVA for any polymerisation condition, [PVA]o > 0.15 gIl for the
current study, above which two-stage addition of stabiliser will result in the formation
of smaller particles in comparison with those from the corresponding batch process.
Particle Size Distribution: Figure 3.1.18 compares the final PSDs for this series.
Delayed addition of the PV A stabiliser will remove the possibility of grafting PV A
molecules on the PMMA particles which has been found to occur in emulsion
polymerisation of MMA (Okaya et al., 1999; Kim et al., 2003). Therefore with holding
a fraction of the stabiliser for the later stage of the polymerisation, can reduce the size
of final particles.
73

CHAPTER THREE EXPERIMENTAL RESULTS AND DISCUSSION
0.01 a
~ ~
~ .: .. ... .. " '<l a ;9
0.00 0 100
0.D3
~ ~0.02
f .. " '<lom Si :a
o 2
200
PVAq(gll}
•• 0 •• 0.1 ··0· '0.15 ...... '0.25 __ 0.5 (one shot) .. +. '0.25 (pump)
= ' .8.~'~" .. ·"(3 ••••• 13
300 400 500 600 700 diameter (fUll)
4 6 diameter (fUll)
PVAo (gIl)
.. 0 .. 0.1 "0··0.15 ...... ·0.25 __ 0.5 (one shot) .. +. '0.25 (pump)
8
800
10
Figure 3.1.18 Final a) daughter, and b} satellite PSDs for the runs with different PVA addition policy (final PV A concentration= 0.5 gll).
Figures 3.1.19 to 3.1.22 show the evolution of drop/particle size distribution for this
series of experiments.
74

CHAPTER THREE EXPERIMENTAL RESULTS AND DISCUSSION
~0.Q3
} a •• O· '0.5 min
~ """"23min .e- 0.02 • • -I!r •• 32 min .~
'" • •• )<- • - 46 min
.... •• -0-. -55 min ~ 0.01 - )I( 70min '" e A·A·A·"··A •
" .6' ·A. :a 0.00
0 200 400 rli~mptpr (1Im)
600 800
~ 0.05
} 0.04 b --O-·0.5min
~ _ • ..,.. -23min
.~ 0.03 ···fr - '32 min
= • _.)<-. '46 min " .... 0.02 "
- - -0- - • 55 min
'" )I( 70min -.~ om .... 0.00
0 2 4 6 diameter (~)
8 10
Figure 3.1.19 Variations of a) daughter. and b) satellite PSD with time for the run with
two-shot adding of PV A. initially 0.1 finally 0.5 gIl.
~0.Q2 ~
.e-
. ~ r~ . ' . . ~
a
~O.oI
j .... 0.00
o 100 200 . 300 400 dIQnu.t", ... (IInI \
~~O-"O.5min
"""'-lOmin • - -I!r .. 30 min • • .)<- • - 50 min
:« 70min
500 600
~ 0.05.---:::;-------------------, §. bf\.
;:;i 0.04 l<" '-" >.< x ~0.03 \
'" .... 002 ~ .
•• o· '0.5 min •• ..,. • '10 min .. -I!r •• 30 min
e 0.01
.a 1-ll-~--~~~~~~~~~~~~~~~ic~tc~~~~ .... 0.00
o 2 ~iameter (~r 8 10
Figure 3.1.20 Variations of a) daughter. and b) satellite PSD with time for the run with two-shot adding of PV A. initially 0.15 finally 0.5 gn.
75

CHAPTER THREE EXPERIMENTAL RESULTS AND DISCUSSION
a - - 0- - -0.5 min --~--20min
--* --40min ---.!r--60min i
'<:I 001 j . --I-70min
'<:I 0.00 o 100 • 200
ilua .... ".t"'r 1I1n1) 300 400
~ 0.08 ,-:-"""T------------------, ab ... ~ t 00.06
- - 0- - -0.5 min - -~ - -20min
E - - -:. - -40 min
~ 0.04 - - -.!r - -60min '<:I
II "\l 0.02
~ :a 0.00 W[..,.-~::!±!::E~E~4;!:b$:ili:~~6::::a_
o 2 4 6 diameter (J.lIlI)
8 10
Figure 3.1.21 Variations of a) daughter. and b) satellite PSD with time for the run with two-shot adding of PV A. initially 0.25 finally 0.5 gn.
E ~ -:: 0.01
j .:3 '<:I 0.00
o
a
100
2
200 rli~lTIph'r (IIm)
4 6 diameter (J.lIlI)
- - 0- - - 0.5 min --~--20min
---)Io--40min ---.!r--50min --e-120min
300 400
--o---O.5min --~--20min
---)Io--40min
- - -.!r - -50 min --I-120min
8 10
Figure 3.1.22 Variations of a) daughter. and b) satellite PSD with time for the run with pump addition of PV A. initially 0.25 finally 0.5 gn.
76
CHAPTER THREE EXPERIMENTAL RESULTS AND DISCUSSION
3.1.3.3 Suspension Polymerisation versus Non-reacting Dispersion
Mean Drop/Particle Size: In Figure 3.1.23 the time variations of the Sauter mean
diameter of daughter drops in reacting and non-reacting systems are compared for
different PVA concentrations used in this study (0.2, 0.5, 1.0,4.0, and 10.0 gIl). For all
PV A concentrations, at first D32 decreases exponentially for both the reacting and non
reacting systems. However, it seems that while the size of drops in the dispersion
continues to decrease with time, the drops in the suspension polymerisation reach
practically a constant value shortly after the start of the polymerisations. The difference
between the steady-state drop sizes in the two systems grows with time. This implies
that the viscosity build up in drops during the early minutes of polymerisation enhanced
drop stability against break up (Dowding et al., 2000). It has been reported that during
the initial period of a typical suspension polymerisation, in which the viscosity of the
monomer/polymer mixture in the drops has not increased considerably, a steady-state
drop size distribution may be established at which the rates of drop break up and
coalescence are balanced (Konno et al., 1982). Mikos et al (1986) assumed that if the
drops become stabilised from the early stages of the reaction, the final size distribution
of particles is governed by the initial distribution of the non-reacting dispersion at the
steady state. The results suggest that even a small increase in the viscosity of drops
during the early minutes of reaction is sufficient to slow down the rate of drop break up
and increase the steady-state size of drops.
With increasing PV A concentration, particle growth and PSD broadening occurred only
to a limited extent in the suspension polymerisation. As a result the evolution of drop
size average and size distribution in suspension polymerisations follow similar trends to
those in the corresponding dispersions at a high stabiliser concentrations, as shown in
Figure 3.1.23 for the PVA concentration of 10.0 gIl. The experimental data from Konno
et al. (1982) for the suspension polymerisation of styrene with 10 gIl PVA provides
further evidence for such a claim. Although the size measurements with optical
microscopy, as used by Konno et al.(1982), may not be sufficiently sensitive to detect
small variations in particle size.
77

CHAPTER THREE
a
400 .,----...... =-.,,_-----, 350
300
'9 250
5 200 ::l ~ 150
100
50
o polymerisation
C dispersion
O+-_________ ~
o 30 60 90 120 150 time (min)
c
100r-----~~~--l
80
o polymerisation
::l ~ 40
!:;;re Jli [J dispersion
~~l'\:~tP ~.
20
o 30 60 90 120 150 time (min)
Figure 3.1.23 Comparison of time evolution of D 32 in polymerisation systems and the corresponding dispersions with a) 0.2. b) 0.5, c) 1.0, d) 4.0, and e) 10.0 gn PVA.
EXPERIMENTAL RESULTS AND DISCUSSION
b
400.,-----------,
350
300
~ 250
!200 ~ 150 ~
100
o polymerization
[] dispersion
5~!~~~~~~~~~~~;:~~:;~ o 30 60 90 120 150
time (min)
d
100 r------------, o polymerisation
80 o dispersion
::l ~ 40
20
o 30 60 90 120 150 time (min)
e
100.,-------------,
80
1 60 ::l ~ 40
20
o
o polymerisation
[] dispersion
30 60 90 120 time (min)
150
78

CHAPTER THREE EXPERIMENTAL RESULTS AND DISCUSSION
Drop/Particle Size Distribution: In Figure 3.1.24 the evolution of drop size
distributions in the reacting and non-reacting systems are compared for different PVA
concentrations used in this study. The size distributions from both systems in the first
minute of the runs during which polymerisations have not appreciably progressed,
whatever the PV A concentration is, coincided with each other. Later, during the
transition period, the size distributions diverged with a degree depending on the PV A
concentration. While both narrowed significantly with time, until a steady-state value
was reached. The final size distributions approached each other with increasing PV A
concentrations.
The variations of the D32 versus PV A concentration for final drops from the dispersion
process (steady-state value), the steady-state drops from the suspension polymerisation,
and the final particles from polymerisation process are plotted in Figure 3.1.25. The
steady-state size of particles from suspension polymerisations is consistently larger than
that from corresponding dispersions, indicating the importance of the kinetic events
occurring during the transition period. It can be also seen from this figure that D32 of
polymer particles approaches that of drops in the corresponding dispersions with
increasing PV A concentration.
79

CHAPTER THREE EXPERIMENTAL RESULTS AND DISCUSSION
80

CHAPTER THREE EXPERIMENTAL RESULTS AND DISCUSSION
1000 o dispersion: steady-state
I!. polymerisation: steady-state
100 '-... polymerisation: final
~
0...,. ~
10
o 2 4 6 8
PV A concentration (gII)
Figure 3.1.25 Effect of PV A concentration on steady-state and final D 32 in polymerisation systems and the corresponding dispersions.
3.1.4 CONCLUSIONS
10
• From the experimental results of this series of experiments, the characteristic
intervals of a typical suspension polymerisation were realised as follows:
Transition Stage; during which PSD narrows dramatically and drop size
decreases exponentially due to higher rate of drop break up in comparison with
drop coalescence.
Quasi Steady-State Stage; during which the rate of drop break up and drop
coalescence are almost balanced leading to a quasi steady-state drop size and
distribution.
Growth Stage; during which the rate of drop break up falls considerably below
the rate of drop coalescence due to the viscosity build up in drops leading to
drop enlargement and PSD broadening.
Identification stage; during which a solid-liquid suspension is attained and the
PSD and mean particle size are unchanged.
• For simple liquid-liquid dispersions only the transition and steady-state stages
exist. Figures 3.1.26 and 3.1.27 show a typical variation of Sauter mean
diameter of drops with time in the four intervals of suspension polymerisation
81

CHAPTER THREE EXPERIMENTAL RESULTS AND DISCUSSION
and in the two intervals of dispersion, respectively. The boundaries of the
intervals have been shown on these figures.
100 : transitio~
steady state stage I growth v
80 stage I stage I identification stage I
p I
1 60 I
:~ : 0 N
M 40 o -er I vv Cl
20
0
0 30 60 90 120 time (min)
Figure 3.1.26 Characteristic intervals in time evolution of Sauter mean diameter in a typical suspension polymerisation of MMA (<I>d = 0.2, [PV Al = 1 g/l, NI'" 500 rpm,
T",70°C).
100
80 transition p stage steady state stage
I 60 ~
I~i N
M 40 Cl
~
~
20
0
0 30 60 90 120
time (min)
Figure 3.1.27 Characteristic intervals in time evolution of Sauter mean diameter in a
typical dispersion ofMMAIW (<I>d = 0.2, [PVAI = 1 g/l, NI'" 500 rpm, T = 70°C).
• The volume fraction of the satellite droplets ifvs) formed in the MMNW ater
dispersions increased with time and with PV A concentration. In the MMA
suspension polymerisation, ivs increased with time but decreased with PV A
concentration.
82

CHAPTER THREE EXPERIMENTAL RESULTS AND DISCUSSION
• The boundaries of the intervals can be distorted with variation in the stabiliser
concentration. In a non-reacting dispersions shorter transition stage and lower
steady-state drop size are obtained for higher stabiliser concentration. In a
suspension polymerisation, with a low stabiliser concentration, the transition
stage is longer, the steady-state stage is very short and the growth stage is
advanced. At a high stabiliser concentration, the steady state, growth and
identification stages overlap so that the drops formed after transition stage are
maintained in the reaction medium and are gradually converted to polymer
beads with little interaction with other particles. The results suggest that the
critical viscosity or conversion at which growth stage starts is not a constant and
depends on the polymerisation conditions. For suspension polymerisation of
styrene, for example, it has been reported that the dispersed droplets reach a
critical viscosity of about 100 cp at about 30% conversion from which droplet
coalescence overcomes the droplet breakage (Villalobos et al; 1993).
• The significance of the transition stage has hardly been recognised in the
literature. It was shown that there is a difference between the drop sizes from the
two processes during the transition period. This implies that the viscosity build
up in drops during the early minutes of polymerisation is an important kinetic
event and that its effect on the evolution of drops cannot be ignored.
• From the results, two types of steady state can be suggested. The steady state
drop size distribution in liquid-liquid dispersions will mainly depend on the
relative magnitude of the rates of drop break up and coalescence. At steady
state, when the rates of drop break up and coalescence are balanced, coalescence
removes as many drops from the dispersion as are made via the break up
mechanism. This has been called a dynamic steady state where individual drops
do not retain a unique identity but undergo continuous break up and
coalescence. The runs carried out at low PV A concentrations present that type
of steady state. With increasing drop viscosity, the rate of drop break up will be
reduced and the growth stage starts. Figures 3.1.23a - 3.1.23c represent such
conditions. If drops are reduced to a size that cannot be further broken by
83

CHAPTER THREE EXPERIMENTAL RESULTS AND DISCUSSION
agitation and if they are also sufficiently protected against drop coalescence,
then drops do not undergo any transfonnation during mixing and with
increasing drop viscosity so that static steady state may be established. Static
steady state can actually be achieved, or approached, if a high concentration of
stabiliser, for example, is used. The resulting drops from such dispersions would
be very small. Figure 3.1.23e shows that the increase in drop size is very small
in the growth stage for the polymerising drops with PV A concentration of 10 g!l
despite the large increase in the drop viscosity.
84

CHAPTER THREE EXPERIMENTAL RESULTS AND DISCUSSION
3.2 EFFECT OF INITIATOR AND
CHAIN TRANSFER AGENT CONCENTRATIONS
3.2.1 INTRODUCTION
The kinetics of polymerisation can play an important role in the evolution of particle
size and size distribution in a typical suspension polymerisation reaction. The viscosity
of drops and its variation with time is in fact a reflection of the rate of polymerisation
inside drops. In this part we attempted to alter the time variation of drop viscosity by
changing the formulation variables; namely initiator and chain transfer agent
concentrations. With increasing initiator concentration, the concentration of propagating
radicals increases leading to a boost to the rate of polymerisation reaction. The chain
transfer agent does not affect the radical concentration, but increases their mobility,
through reducing the viscosity of the reaction medium, and thus facilitates radical
termination. This can result in a lower rate of polymerisation at high conversions where
termination reactions are usually diffusion controlled. The initiator and chain transfer
agent concentrations are ideal variables for this case study, because they are used in a
very small amount so that the oil phase and interfacial properties of the dispersions are
not appreciably affected by their presence.
The rate of polymerisation reaction is highly affected by the reaction temperature.
However, the interfacial properties of the stabiliser are also affected. Therefore, the
temperature effect was excluded from this section and will be discussed separately. The
effects of the concentration of the initiator, lauroyl peroxide (LPO), and the
concentration of the chain transfer agent, n-dodecyl mercaptan (n-DDM), on the
evolution of PSD in the suspension polymerisation of MMA are discussed here.
3.2.2 EXPERIMENTAL
The materials, experimental procedure and measurements have been described in detail
in Chapter 2. All experiments in this series were carried out at 70°C and agitation speed
of 500 rpm. MMA hold up was 0.20 and PV A concentration was 1.0 g/l. For the
85

CHAPIER THREE EXPERIMENTAL RESULTS AND DISCUSSION
experiments with n-DDM as variable, the LPO concentration was kept constant at 1.0
wt% based on the monomer phase.
3.2.3 RESULTS AND DISCUSSION
3.2.3.1 Initiator Concentration
Suspension polymerisations of MMA with LPO concentrations of 0.25, 1.0, and 4.0
wt% were carried out. No chain transfer agent was used in this series.
Rate of Polymerisation: Figure 3.2.1 shows the conversion-time variations for the runs
with different LPO concentrations. The overall rate of polymerisation increased with
LPO concentration. The rate of polymerisation in a typical free radical polymerisation
is given by equation 1.2.8 (chapter 1) which is repeated here:
. ( )1/2 R = (k + k )[M] 2fkd [I]
p p f k , (3.2.1)
The above equation shows that, in agreement with the experimental data at low
conversions, Rp will theoretically increase with [1]112. The onset of the gel effect was
also affected by the LPO concentration. Generally the onset of the gel effect is affected
by two factors; the volume fraction of polymer in the mixture (or conversion) and the
molecular weight of the polymer produced (Marten and Hamielec, 1979; 1982).
The number-average molecular weight of polymer is given by equation 1.3.1 (chapter
1) which can be written as follows:
1
X, (2fkd[l]k'dYI2 + (2fkd[l]k,jI2 +k Ik +k [Sjlk [MJ (3.2.2)
k [M J 2k [M J fp' p p p
The above equation indicates that, in the absence of any chain transfer reaction, Xn is
proportional to [1]"112. Figure 3.2.1 shows that for the LPO concentrations of 0.25, 1.0,
and 4.0 wt% the gel effect starts at conversions of 0.35, 0040, and 0045, respectively.
With increasing the LPO concentration shorter polymer chains were produced and the
gel effect was postponed to higher conversions. The rate of the polymerisation reaction
86

CHAPTER THREE EXPERIMENTAL RESULTS AND DISCUSSION
during the gel effect increased significantly with LPO concentration, as was expected.
Generally, a higher final conversion was achieved with increasing LPO concentration.
0.8
= .SO.6 r; ~ §0.4
" 0.2
50 time (min) lOO 150
LPO (wt%)
00.25
200
Figure 3.2.1 Conversion-time variations for MMA suspension polymerisations with diff~rent LPO concentrations (for other conditions see section 3.2.2).
Mean Drop Size: Figure 3.2.2 illustrates the variations of Sauter mean diameter of
daughter drops (D3z) with time and conversion. Figure 3.2.2a shows that during the
transition stage, the size of drops was initially reduced to a low value for all LPO
concentrations used. Interestingly, the largest decrease in the average size of drops
during this stage was obtained for the lowest LPO used. Obviously this is due to a lower
rate of viscosity build up in the drops containing a lower concentration of LPO. A larger
increase in the rate of viscosity build up, associated with a higher rate of polymerisation
for the higher LPO concentration, damps the rate of drop break up so that the rate of
drop break up and drop coalescence is balanced earlier. This results in a larger drop size
in the beginning of the quasi steady-state stage. During this stage drops underwent a
slight size increase with time. The slope depended on the rate of viscosity build up (rate
of polymerisation) in the drops. A higher initiator concentration resulted in a larger rate
of polymerisation and thus a higher rate of viscosity increase. The quasi-steady state
lasted longer for the lower LPO concentration.
Note that time is not a good representative of the status of the polymerising drops when
they contain different concentrations of the initiator. The evolution of D3z can be better
explained if the comparison is made at a constant conversion. Figure 3.2.2b reveals that
growth stage started at the lowest conversion, for the lowest LPO concentration. This is
87
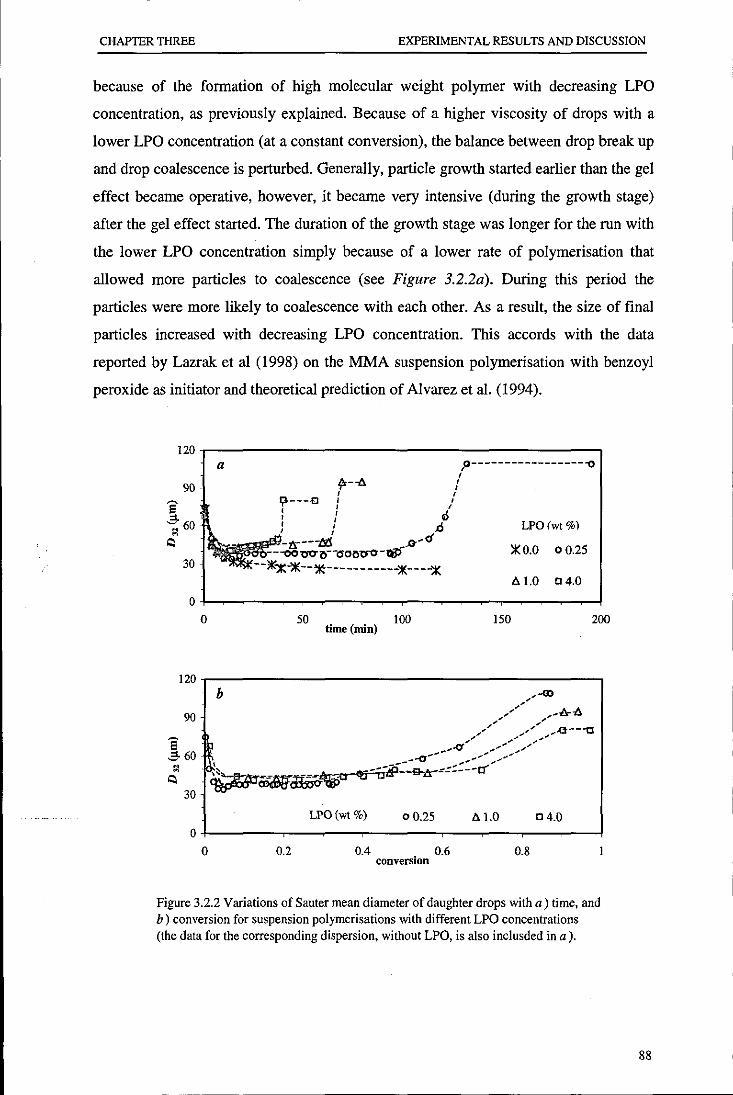
CHAPTER THREE EXPERIMENTAL RESULTS AND DISCUSSION
because of the formation of high molecular weight polymer with decreasing LPO
concentration, as previously explained. Because of a higher viscosity of drops with a
lower LPO concentration (at a constant conversion), the balance between drop break up
and drop coalescence is perturbed. Generally, particle growth started earlier than the gel
effect became operative, however, it became very intensive (during the growth stage)
after the gel effect started. The duration of the growth stage was longer for the run with
the lower LPO concentration simply because of a lower rate of polymerisation that
allowed more particles to coalescence (see Figure 3.2.2a). During this period the
particles were more likely to coalescence with each other. As a result, the size of final
particles increased with decreasing LPO concentration. This accords with the data
reported by Lazrak et al (1998) on the MMA suspension polymerisation with benzoyl
peroxide as initiator and theoretical prediction of Alvarez et al. (1994).
120 a
90
8' -5 60 ~
'l
30
0 0
--tJ
50 time (min)
lOO
LPO (wt %1
)I( 0.0 0 0.25
t. 1.0 04.0
ISO 200
120r------------------------------------------,
90
8' -560
b
LPO(wt %) 00.25 t. 1.0 o 4.0 O+---~--~--~--r_--__ --r_--__ --__ --__ ~
o 0.2 0.4 0.6 0.8 conversion
Figure 3.2.2 Variations of Sauter mean diameter of daughter drops with a) time, and b) conversion for suspension polymerisations with different LPO concentrations (the data for the corresponding dispersion, without LPO, is also inclusded in a).
88

CHAP'IER TIlREE EXPERIMENTAL RESULTS AND DISCUSSION
Particle Size Distribution: Figures 3.2.3 and 3.2.4 indicate the time evolution of PSD
for the runs with LPO concentrations of 0.25 and 4.0 wt%, respectively (the time
evolution of PSD for l.0 wt% LPO has been previously shown in Figure 3.1.12). As it
can be seen, with decreasing the LPO concentration, larger particles formed and broader
particle size distribution were obtained.
~ 0.03 -.-----------------.-. --o-.-.-o-.s-Ill1-'n--'
} •• -<>- •• 15 min ; 0.02 .• -I!r • ·95 min ] •• -<> •• 120 min .~ lIE 135 min il 0.01
:I '" 0.00
o 100 . 200 dIameter (lUll)
300
2 4 6 8 diameter (lUll)
Figure 3.2.3 Time evolution of a) daughter. and b ) satellite PSDs for the run with LPO = 0.25 wt%.
400
10
89

CHAPTER THREE EXPERIMENTAL RESULTS AND DISCUSSION
'[ 0.03
:::i ~
o 0.Q2
~ l:l 0.01
I ;a 0.00
a
o 50 100 150 diameter (lUll)
•• -0. ·0.5 min .. ~. ·7min
··~··17min
•• <>-··35 min
)I( 40 min
200
'8 b ··-o··O.5min gO.06 •• ~ .. 7 min
·f 0.04 •• ~ .• 17 min ~ •• <>-. ·35 min
250
... -)l(-40min
j 0.02 4i:~~~~*~~~~J ;a 0.00 -J-i~..,-..,-""":;;';::' $
o 2 4 6 8 diameter (/lm)
Figure 3.2.4 Time evolution of a) daughter, and b) satellite PSDs for the run with LPO = 4.0 wt%.
10
An important observation was that more satellite droplets were produced in the course
of reaction with decreasing LPO concentration simply because of prolonged reaction
time. In section 3.1.3.1 we showed that the number of satellite droplets in the non
reacting MMA dispersion, which behaves similar to a polymerisation with a very low
amount of initiator, increased continuously with time. A longer steady-state stage
allows the satellite droplets to be formed in a larger number. Figure 3.2.5 illustrates the
time variation of Iv,. The initial rate of satellite formation seems to be the same for all
runs. According to this figure for the run with 0.25wt% LPO concentration, satellite
droplets are continuously formed up to 95 min, which is shortly before the onset of the
growth stage. For the runs with LPO concentration of 1.0 and 4.0 wt%, the formation of
satellite droplets continued during the steady-state stage that lasted up to 50, and 30
min, respectively. It can be stated that the formation of satellite droplets correlates with
the duration of the steady-state stage.
As the growth stage started and intensified due to the gel effect, the events changed and
most of the satellite droplets were lost by coagulation (or flocculation) with other drops.
90

CHAPTER THREE EXPERIMENTAL RESULTS AND DISCUSSION
The extent of disappearance of the satellite droplets during the growth stage was high
for the runs using low LPO concentrations because of a long mixing time required to
reach the identification point. As a result, final suspensions with high LPO
concentration contained more satellite particles as shown in Figure 3.2.6b.
Figure 3.2.6a shows a comparison between final PSDs of the daughter drops. With
increasing LPO concentration PSD becomes narrower and moves towards smaller
particle sizes as was explained before.
0.225
0.200
0.175
0.150
0.125 •
...:; 0.100
0.075
0.050
0.025
0.000
0 50 100
LPO(wt%) <>0.25 []l.0 A4.0
150 time (min)
200 250 300
Figure 3.2.5 Time variation of volume fraction of satellite droplets in polymerisations with different LPO concentrations.
~ 0.015 """""---------------------,
~ ... LPO (wt %) a
;0.010 • • ()o •• 0.25
] Il 0.005
• • " ••. 1.0
• • 0- • '4.0
1 :a 0.000
o 100 200 300 400 500 diameter (Ill")
0.03 .--:!!!I.---------------------, ~ b 1fI'Q §. III iD ;:, rit\iD -;: 0.02 1>' .
LPO(wt%)
• • ()o • '0.25 ~ !l ~~
"C~ ,"'Ill •• " ••. 1.0 _ ,.lI:i;)
~ om ~ .. 0- • '4.0
~ : ~1'il!l~~:!!!.B.a.I3.0(3 .. B .. {3 ••• B ... a ... I3 .... ~ _ 0.00 Ii ;!;i1~·l!!:l,p!i,ii.~."" .. "' ............. "' ... .;;; .•..
o 2 4 6 diameter (Ill")
8
Figure 3.2.6 Final a) daughter, and b) satellite PSDs for runs with different LPO concentrations.
10
91

CHAPTER THREE EXPERIMENTAL RESULTS AND DISCUSSION
3.2.3.2 Chain Transfer Agent Concentration
Three experiments were carried out with n-DDM concentrations of 0.0, 0.25, and 1.0
wt% based on monomer phase.
Rate of Polymerisation: Figure 3.2.7 illustrates the conversion-time variations for these
runs. The rate of polymerisations for the region of x < 0.40 are almost identical for all
runs, indicating chain transfer to n-DDM does not affect the inherent kinetics of
polymerisation. The kinetic chain length of polymer in the presence of a chain transfer
agent is determined by equation 3.2.2 where [S] represents the chain transfer agent
concentration. In the initial stage of polymerisation where k, is very high, Xn is
controlled by termination reactions. A difference in the rate of polymerisation is
developed for x> 0.40 when the gel effect is operative at the condition of this study.
During the gel effect k, is so reduced that Xn is controlled by the chain transfer agent
concentration (lIXn=kn_DDM[n-DDM]lkp[Mj). A higher chain transfer agent
concentration, thus, results in a lower molecular weight of polymer being formed. The
decrease in the rate of polymerisation with increasing n-DDM concentration occurs
because the gel effect is suppressed due to the reduction in polymer molecular weight.
A similar observation was reported for styrene/acrylonitrile suspension
copolymerisation with n-DDM as chain transfer agent and Tep as suspending agent
(Jahanzad and Sajjadi, 2000). The onset of the gel effect was postponed to the
conversion of 0.55 for the run using 0.25wt% n-DDM. For the run with n-DDM
concentration of 1.0 wt%, a very mild and short gel effect was observed around the
conversion of 0.70.
Mean Drop Size: The variations in Sauter mean diameter of daughter drops with time
and conversion are shown in Figure 3.2.8. The duration of the transition stage was not
appreciably affected by the n-DDM concentration. In the initial stage of polymerisation
the evolution of viscosity of drops is similar for all runs because the molecular weight
of polymer is controlled by the termination reactions. As a result, the drops have the
same size during the transition stage for n-DDM different concentrations.
92

CHAPTER THREE EXPERIMENTAL RESULTS AND DISCUSSION
P'i---G------o:--.[J .0 ,.... /- ----0'"--
0.8 ! ~'-+ onset of gel effect
= 1-·-·-·-·-·-·-·-·-·-·-·-·~·-+;/-·~;,-it75.~: .~ 0.6 1-'-'-'-'-'-'-'-'-'-T+.~1';4-A ~ t,E1Ao-~/ ~ 0.4 I-'-'-'-'-'-'-'-~;#":'A---
0.2 ~<4-
d"~.e
o ... rJd' o 50
time (min)
n-DDM(wt%)
[l0.0
<> 0.25
A 1.0
100 150
Figure 3.2.7 Conversion-time variations for runs with different n -DDM concentrations (for other conditions see section 3.2.2).
600.----------------------------------------. 500
~400
.§.300 ~
<::1200
100
a
o
n-DDM (wt%)
[] 0.0
<> 0.25
" 1.0
50 time (min)
100 150
600,----------------------------------------.
a
500
400
b n-DDM (wt%)
[] 0.0
() 0.25
• I I , , ,
I I
5300 I I
" 1.0 , , <::I~ I
/ ........ ~""O I _-
I 00 f'i'otra..,.[ftIII3:t-<O .... "'1-1"'.--tIll ..... "rO~.....,*erea-"'i~1!5!~~"i~~~;:::------t:r-c O~--__ --__ --__ --__ --__ --__ --__ --______ ~
o 0.2 0.4 0.6 0.8 conversion
Figure 3.2.8 Variations of Sauter mean diameter of daughter drops with a) time, and b) conversion for runs with different n -DDM concentrations.
93

--------------------------------------------------------------------------- -
CHAPTER THREE EXPERIMENTAL RESULTS AND DISCUSSION
The onset of the growth stage was reached earlier in terms of time with decreasing n
DDM concentration. In terms of conversion, however, the growth stage started at the
critical conversion of x = 0.65, independent of the chain transfer concentration. This
means that the molecular weight of the polymer did not appreciably affect the onset of
the growth stage. We showed before that the onset of the growth stage is displaced with
variation in the LPO concentration. It should be noted that the molecular weight of the
polymer formed up to the intermediate conversion (x = 0.40) is expected to be constant
for the runs with different n-DDM concentrations, as explained above. Application of a
higher n-DDM concentration, more than the range used here, can reduce the molecular
weight of the polymer formed in the early stage of reaction and affect the drop size
evolution in the corresponding stage.
The steady-state stage was prolonged with increasing n-DDM concentration (see Figure
3.2.8a). During the growth stage, drops enlarged with time with a rate depending on the
n-DDM concentration. For the run with no n-DDM, the growth stage was very short, of
the order of 5 min, so that particles grew a little during this stage. For n-DDM
concentration of 0.25wt% the growth stage was passed in 10 min, long enough to
increase the size of particles almost two fold. For the run with 1.0 wt % n-DDM, the
growth stage lasted for a long time. When the conversion of 0.80 was reached, at 125
min, gross coagulation occurred and led to the formation of large flocculated particles.
The results indicate that the duration of the growth stage is of crucial importance in the
stability of suspension polymerisation reactors. The presence of n-DDM in suspension
polymerisation of MMA destabilises the particles through prolonging the growth period
or coalescence-controlled period for particles.
Particle Size Distribution: The time evolution of particle size distributions for the runs
in the presence of n-DDM is illustrated in Figures 3.2.9 and 3.2.10. Similar trends, as
previously explained, occur for all polymerisations. The initial distributions were rather
broad but they became narrower with time. The application of n-DDM reduced the
population of satellite droplets. The evolution of satellite droplets can be observed in
Figures 3.2.9b and 3.2. JOb. Final PSDs have been illustrated in Figure 3.2.11.
Generally, the size of final particles increased with n-DDM concentration.
Correspondingly, a broader distribution was obtained with increasing n-DDM
concentration. A larger population of satellite droplets was obtained at a lower n-DDM
concentration.
94

CHAP1ER THREE EXPERIMENTAL RESULTS AND DISCUSSION
~
~0.D3 a A ---o--O.5min - •• - - .... - -26min ... ~ . , e
~0.D2 !'It,:~ ---tr--45min 41.\' .~ •
= '. ~~ ~ ··-O--82rnin " ~ ~ "
'" .. ~ - - .,. - - 89 min ... ..!l0.0! _I05min " 8 .. S.-a . . S '" 0.00
0 100 diameter (/IJ1I) 200 300
0.06 ~
b - - -0 - -O.5min ~ eO.04
- - .... - -26min
·f - - -tr - -45 min - - -<> - -82min
" .. .. -x- .... 89 min .... 0.02 ... _I05min ..!l
" 8 :a 0.00 0 2 4 6 8
diameter (11Jtl)
Figure 3.2.9 Time evolution of a) daughter, and b ) satellite PSDs for the run with n -DDM = 0.25 wt%.
t·02
~0.D1
]0.00
a~
~~~ "1/1' :: IlOt .". ... :;~. ~ .... ;, la ~"m ~ :
! " m' " . .
---o--O.5min ........ 25min
---tr"l00min _120min
10
o 200 diameter (/IJ1I) 400 600
0.06,.--------------------,
l. eO.04 .~ 5 '" 0 02
b .... 0. .. -0.5 min
.... -<> .. .. 25 min
---tr--l00min
_120min
j . :a 0.00 -H ___ lIElIGIeIflIflIH~~~~~!;:.jl:_::_:I!_'~'_!,.!Jf!.!.!.!I.!..!!..:J.
o 2 4 6 diameter (Ilm)
8
Figure 3.2.10 Time evolution of a) daughter, and b) satellite PSDs for the run with n -DDM = 1.0 wt%.
10
95

CHAP'IER THREE EXPERIMENTAL RESULTS AND DISCUSSION
e 0.015,---------------------,
a
~0.01O 1\ 'ii m m"'~ ] g .~ .... DJ~' ~
n·DDM (wt%)
· • .,. .. 0.0 • • -0- •• 0.25
· • "'" .. \.0
I 0.005 r/l 9 G1'm \
a ~. i ~_ '~'-. . ............ " ............. " .... .. ;a 0.000 •• lIlt .... ~~c"'IJa....~ "'t;. ...... ;.4: a'';''~' ........ a.I............~.............. ........... .,....,~
o
e II1II.
-$0.02 b 1If~ __ r/J ID
E dr iD : m
200 400 diameter (iJ,m)
~ om ~ ~ ~ n' ••••• "S .....
600
n·DDM (wt%)
• . .,. •. 0.0 • • -0- •• 0.25 • • o{). ••• \.0
800
~ s ......... .. ;a 0.00 -I-'ri.·, __ ........... s ... G ... ;o.~iiI ... ' •• 'li:"''_li ••• B 1"" BIJ' •• ~ .... "'w.: ';..:J:~I!!.: ':'-'I:al!!.: :::,.:.:", .. ::""=-W' ",. ,,-,,It-'" """",:-l' -"".c.:. . ..,. "'1'J..u. ......
o 2 4 6 diameter (iJ,m)
8
Figure 3.2.11 Final a) daughter, and b ) satellite PSDs for the runs with different n ·DDM concentrations.
3.2.4 CONCLUSIONS
The main conclusions are:
10
• Decreasing initiator concentration lowers the rate of viscosity build up in drops
and, thus, enhances drop reduction in the transition stage. As the initiator
concentration is reduced to a low value, the pattern of size variation of drops
accords with that from non-reacting dispersions during this stage.
• As a result of delayed balance between drop break up and coalescence, a lower
steady-state size of drops was obtained with decreasing initiator concentration.
• Drops with a higher viscosity (at the same conversion), fonned by application
of a lower initiator concentration, revealed more instability and started to grow
96
CHAPlER THREE EXPERIMENTAL RESULTS AND DISCUSSION
earlier in terms of conversion. As a result larger particles were obtained with
decreasing initiator concentration.
• The effect of chain transfer concentration on the evolution of the drop size
average could be seen as its reflection on the viscosity of the polymer formed.
With a high chain transfer agent concentration the rate of polymerisation was
inversely affected (in intermediate conversion) and larger particles were
obtained mainly due to flocculation. The application of chain transfer agent,
however, broadened the range of conversion during which the quasi steady state
could be operative. The balance between drop break up and coalescence could
be maintained further with a decline in the drop viscosity due to the formation of
low-molecular-weight polymer formed by application of chain transfer agent.
97
CHAPTER THREE EXPERIMENTAL RESULTS AND DISCUSSION
3.3 EFFECT OF INHIBITION
3.3.1 INTRODUCTION
A significant portion of the petrochemical industry is based on the production and
utilisation of polymerisable monomeric compounds. Certain of these readily
polymerisable monomers are particularly reactive because their molecules contain an
activated ethylenic bond, i.e., a non-aromatic carbon-carbon double bond that is
activated by conjugation with other multiple bonds between adjacent atoms. Examples
of polymers produced from such monomers are polystyrene and polymethyl
methacrylate. The presence of activated ethylenic unsaturation in the readily
polymerisable monomers enables polymerisation of the monomers to be conducted
under rather mild but carefully controlled conditions.
However, the readily polymerisable monomers often undergo undesirable
polymerisation, e.g., polymerisation prior to the time polymerisation is intended, as
during the production, purification, storage or handling of the monomers, when exposed
to free radicals resulting from the presence of other free radical sources. This premature
free-radical polymerisation can have significant consequences since the polymer
formed tends to foul or even plug the mechanical equipment used in the production,
purification, handling or even storage of the monomer unless precautions are taken to
inhibit or prevent the polymerisation. Premature polymerisation typically produces a
polymer product of inferior quality and can be a safety hazard if operating equipment
becomes plugged. To prevent or at least retard premature free-radical polymerisation of
readily polymerisable monomers it is conventional to add to the monomer a small but
effective amount of an antioxidant or inhibitor. Many, if not most, of the conventional
polymerisation inhibitors are complex organic compounds containing functional groups
with atoms of oxygen, nitrogen or sulfur.
Studies on suspension polymerisation kinetics in academia are usually carried out with
high-purity grade monomers. In industrial practice, however, it is impractical to purify
raw materials and commercial monomers, which contain inhibitors, are usually used.
The addition of inhibitors increases the shelf life of monomers by suppressing their
98

CHAP'IER THREE EXPERIMENTAL RESULTS AND DISCUSSiON
polymerisation. These substances (inhibitors) act by reacting with the initiating and
propagating radicals and converting them either to non-radical species or radicals of
reactivity too low to undergo propagation. Such polymerisation suppresses are
classified according to their effectiveness. Inhibitors stop every radical and
polymerisation is completely halted until they are consumed (induction or inhibition
period). At the end of this period, polymerisation proceeds at the same rate as in the
absence of inhibitor (ideal inhibitor behaviour).
Retarders are less efficient and stop only a portion of the radicals. In that case,
polymerisation occurs, but at a slower rate and without an induction period (ideal
retarder behaviour). A single substance may function either as inhibitor or retarder or
both, depending on its concentration, so that distinction between inhibitors and retarders
becomes a matter of degree (Odian, 1991). Quinones and catechols are two important
classes of inhibitors. They represent water-soluble and oil-soluble inhibitors,
respectively.
It has been found that quinones act as retarders in bulk polymerisation of MMA
initiated by benzoyl peroxide and azobis-isobutyronirile (Mark, 1967). Bezoquinone
interferes only slightly in the initiation reactions at 60°C but reacts with the growing
chain radicals. This retarded free-radical product disappears by termination with
ordinary growing chain radicals. It has also been found that the retarded free-radical
product attack on monomer, resulting in limited copolymerisation of MMA and
benzoquinone. The absence of an appreciable concentration of stabilised radicals
formed by direct interaction of quinone molecules and initiator fragments indicates the
operation of a different retarding mechanism in systems containing quinones such as
bezoquinone and hydroquinone. The same results were found for styrene
polymerisation initiated by benzoyl peroxide (Mark, 1967).
In order to study the effect of inhibitor on the evolution of particle size and its
distribution in suspension polymerisation of MMA a series of experiments with oil
soluble and water-soluble inhibitors were carried out.
99

CHAPTER TIfREE EXPERIMENTAL RESULTS AND DISCUSSION
3.3.2 EXPERIMENTAL
The materials, experimental procedure and measurements have been described in
details in Chapter 2. Hydroquinone (HQ), 99%, and 4-tert-butylcatechol (TBC), 97%,
both from Aldrich were used as inhibitors without further purification.
In one experiment suspension polymerisation of MMA was carried out using the MMA
monomer as received (un-purified monomer containing 10-100 ppm monomethyl ether
hydroquinone).
Experiments were performed with different concentrations of the oil-soluble inhibitor
(TBC) and water-soluble inhibitor (HQ). The base formulation for this series contained
1.0 g/l of PVA and 1.0 wt% of LPO. The reaction temperature was 70°C. An agitation
speed of 500 rpm was used for the experiments with TBC. The experiments with HQ
were carried out at the agitation speed of 300 rpm.
3.3.3 RESULTS
3.3.3.1 Effect of Non-removed Inhibitor in the Monomer
. In all experiments carried out in this research we removed the inhibitor from the
monomer via reduced-pressure distillation. In order to study the effect of impurities in
the monomer on the kinetics of polymerisation and particle size, in one experiment we
used the monomer (MMA containing 10-100 ppm monomethyl ether hydroquinone) as
received without further treatment.
Rate of Polymerisation: Figure 3.3.1 shows the conversion-time variations for the
experiment with the un-purified monomer in comparison with the corresponding
polymerisation run with the purified monomer. The presence of inhibitor in the
monomer inhibited the polymerisation reaction, as was expected, and also retarded the
rate of polymerisation. The retardation effect on the rate of polymerisation was more
apparent after the onset of the gel effect.
Mean Particle Size: Figure 3.3.2 illustrates the time evolution of D32 for this series.
Interestingly, the run with un-purified monomer resulted in smaller polymer beads. A
smaller steady-state D32 was obtained for un-purified monomer because of lower
viscosity in comparison with that for the purified monomer at the initial stage due to the
induction period observed for the un-purified monomer. During the growth stage the
100

CHAPTER THREE EXPERIMENTAL RESULTS AND DISCUSSION
steep growth observed for the purified monomer drops was reduced to a mild growth
for the un-purified monomer drops.
1.0 ",.. • • 0 0
0.8 • 0
o ~
= • 0
.~ 0.6 .0
" ;. • § 0.4 ~.o
" 0.2 .o·~ 0.0 eo·~
• purified MMA
o un-purified MMA
o 50 time (min) 100 150 200
Figure 3.3.1 Conversion-time variations in suspension polymerisation of MMA with purified and un-purified monomer (for other conditions see section 3.3.2).
IOOr--:~:=~~--~~==~~.-------~ • purified MMA J o un-purified MMA
~ , )K dispersion
150 \ .~ ~ ~I~~'~;~~~:::~~~.*:--~:-'~-~-~----------)!(------)K
o 30 60 90 120 time (min)
Figure 3.3.2 Time evolution of D 32 in suspension polymerisation of MMA with purified and un-purified monomer and in the coresponding dispersion.
50 100 diameter (~)
- - ••. purified MMA
- - <> •. un-purified
150
Figure 3.3.3 Final PSDs in suspension polymerisation of MM A with purified and un-purified monomer.
150
200
101

CHAP'IER THREE EXPERIMENTAL RESULTS AND DISCUSSION
Particle Size Distribution: Figure 3.3.3 illustrates the final PSDs for this series. The run
with un-purified monomer showed a sharper PSD.
The enhanced stability of drops/particles that resulted from use of un-purified monomer
caused us to look at the effect of inhibition on particle size and PSD in a more
systematic way. A series of experiments was launched in which the monomer was
distilled to remove the unwanted inhibitor. In these experiments a specified amount of
an oil-soluble or water-soluble grade of inhibitor was added to the monomer phase or
the water phase, respectively.
3.3.3.2 Effect of oil-soluble inhibitor
Rate of Polymerisation: Figure 3.3.4 shows the conversion-time results for the runs
with 0.0, 0.1, and 0.4 g of TBe. The presence of TBe in the monomer phase not only
delayed the start of polymerisation but also reduced the rate of polymerisation. The
latter effect was more apparent for the run with 0.4 g TBe.
Mean particle size: Figure 3.3.5 shows the evolution of D32 for the runs with different
amounts of TBe. Generally, the application of TBe resulted in smaller polymer beads.
The presence of TBe in the monomer drops inhibits the polymerisation reaction during
the early stage of the mixing so that the suspension polymerisation reaction behaves as
a simple liquid-liquid dispersion. As a result, the early evolution of D32 of drops
coincided with that of the corresponding non-reacting MMA-water dispersion. Once the
inhibition period elapsed and the polymerisation started, drops became more resistant to
drop break up and their size reduction slowed down. As a result, the steady-state drop
size was established at a lower value with increasing TBe concentration. The size of
drops showed a small increase during the quasi-steady state. Drops showed a mild
growth at the times of 65 and 90 min for the runs with the TBe loading of 0.1 and 0.4
g, respectively, according to their onset of the gel effect. The final size of particles
obtained with the monomer containing TBe were much smaller than that with pure
monomer.
Particle Size Distriqution: Figure 3.3.6 shows the final PSDs of this series. Application
of TBe resulted in a sharper size distribution, as well as a smaller mean size of
particles.
102

CHAPTER THREE EXPERIMENTAL RESULTS AND DISCUSSION
1.0 tt: " • I). • 0.8 0 0 0 0
c r- 0 .~ 0.6 I). Cl ., .1). # ;. -.', ~ 0.4 .0.0 g TBC
0.2 .. ~- [jJ I). 0.1 g TBC ! 0 0 •• f:P 0 00.4 g TBC .A~'" 0.0
0 50 time (min)
100 150
Figure 3.3.4 Conversion-time variations in suspension polymerisation of MMA with different TBC concentrations (for other conditions see section 3.3.2).
200
loor-----------------~----~------------_, I .. -------~----• I
• 0.OgTBC I). 0.1 g TBC I
I
00.4 g TBC : ~ III )l(d" I
} 50 ~ Isperslon / il).------------;;-.o£------o
~ 1).~~~~~~~=~~~::----lK o 30 60 90 120
time (min)
Figure 3.3.5 Time evolution of D J2 in suspension polymerisation of MM A with with different TBC concentrations and in the corresponding dispersion.
r.04
~0.03 ~ 00 A"6,
.~ 0.Q2 t;l 'riJ/ 'A,.
"Cl r,;i':GJ \ I: 001 Ill' .,. ........ . 'S . . A •.•. [)J -~~ •• ".
··.··O.OgTBC
•• -Lr "0.1 g TBC
··0· ·0.4 g TBC
150
" Ill'" "". ~ 0.00 I -'.IIIlI.~";'··-· ,....-....2.lll.~f-B.re, .• ~. ~iiI;'~' .li"~' ·~'·l'~' *~ ........ ......J. ::: + • , 'lI.., ."' ... ~~.:I!I:" .. ,
o 50 100 diameter (J.UD)
150 200
Figure 3.3.6 Final PSDs in suspension polymerisation of MMA with different TBC concentrations.
103

CHAPTER THREE EXPERIMENTAL RESULTS AND DISCUSSION
3.3.3.3 Effect of water-soluble inhibitor
Rate of Polymerisation: The conversion-time histories for this series with 0.0, 0.1 and
0.4 g of HQ in the water phase are shown in Figure 3.3.7. The run with the higher
quantity of HQ showed a longer induction period and a depressed rate of
polymerisation in the later stages of polymerisation.
Mean Particle Size: The application of HQ resulted in smaller polymer beads as shown
in Figure 3.3.S. HQ affected the evolution of drop size during the transition stage in the
same way as TBC. The presence of HQ in the water phase almost suppressed the size
variation of drops/particles during the growth stage. The drop size variations with time
for the runs using different amounts of HQ are quite similar, despite a significant effect
of HQ on the rate of polymerisation as depicted in Figure 3.3.7.
1.0
0.8
= ·S 0.6 ~ = 0.4 0
" 0.2
0.0
0 50
e/'JlY!,. e
e ~Cl
Cl
100 time (min)
eO.OgHQ
'" 0.1 g HQ in water
Cl 0.4 g HQ in water
150 200
Figure 3.3.7 Conversion·time variations in suspension polymerisation ofMMA with different amounts of HQ added into the aqueous phase (for other conditions see
. section 3.3.2).
200r-------------------------~~~~----_, eO.OgHQ
50 .. --------------e '" 0.1 g HQ in water ~ 1 t, " Cl 0.4 g HQ in water
~ ~~~' .... ---..... --.. ::Kdispersion ';:; 100 A ~t;,.. -t!il\:~-""':o~~ ~ ~~::Cl:::~_ -- -----El
M ".~~:e--Er-cr-
~ 50 ~-~-lK--)K--~----------------)K---_____________ _
o 50 100 time (min)
150
Figure 3.3.8 Time evolution of D 32 in suspension polymerisation of MM A with different amounts of HQ added into the aqueous phase and in the corresponding dispersion.
200
104

CHAPTER THREE EXPERIMENTAL RESULTS AND DISCUSSION
Particle Size Distribution: Figure 3.3.9 shows the final PSDs of this series. The
presence of HQ in the water phase improved the stability of the polymerising drops and
resulted in a narrower particle size distribution as well as a smaller average particle
size.
- -. - '0.0 gHQ - - -d- - • 0.1 g HQ in water
o 50 100 150 200 250 diameter (iJIIl)
Figure 3.3.9 Final PSDs in suspension polymerisation of MMA with different amount of HQ added into the aqueous phase.
3.3.4 DISCUSSION
300
In a typical free-radical polymerisation chain growth continues until the radical is
terminated or transferred to another substance. If an inhibitor exists, primary radicals
will be converted to unreactive forms:
Inhibition; R Z k, . . d 0+ ) mactlve pro uct (3.3.1)
where Z and kz represent the inhibitor and the inhibition rate coefficient, respectively.
So an inhibitor depresses the rate of polymerisation by reducing the concentration of
active radicals.
For an ideal inhibitor, polymerisation does not start before all the inhibitor molecules
have been consumed. If the activity of the inhibitor is not high, chains can grow before
they react with an inhibitor molecule. In such a case, the term retardation can better
describe the chemistry of the process:
Retardation (ideal); Rn + Z k,) p • . + inert product (3.3.2)
Retardation (non-ideal); R• Z k, Q n + ) n (3.3.3)
105
CHAP'IER THREE EXPERIMENTAL RESULTS AND DISCUSSION
o
where Q is a radical with reduced activity. While retardation may not affect the number
of radicals, it will affect the reactivity of the radicals formed and thereby reduces the
rate of polymerisation. An important point is that a retarder can act as a chain transfer
agent by terminating active growing radicals (Huo et aI., 1987; Penlidis et ai, 1988).
Now we attempt to describe the role of the inhibitors used in the suspension
polymerisations according to their solubility in the two phases. In suspension
polymerisation, the locus of polymerisation reaction is, in fact, in the monomer drops or
the monomer phase. Although HQ is water soluble, it partitions into both water and
monomer phases. A closer look at Figure 3.3.7 reveals that the inhibition period for HQ
is rather short. Note that the highest amount of HQ used is 0.0036 mol (0.4 g), which is
almost equivalent to the total amount of the initiator available in the monomer phase
(0.0035 mol). However, the inhibition period observed for this run was around 10 min.
After this inhibition time, when all, or a part of the HQ dissolved in the oil phase is
consumed, the polymerisation starts. During the polymerisation period, as HQ is
consumed in the oil phase via reaction with initiator radicals, HQ dissolved in the water
phase diffuses into the monomer phase until all of the HQ is consumed. The retardation
effect of HQ, in the aftermath of the inhibition, also depends on the diffusion rate of HQ
from the water phase to the oil phase, which is influenced by the agitation speed and the
viscosity of the polymerising drops.
TBC is an oil-soluble substance, thus, TBC molecules tend to stay in the monomer
phase and react with the initiator derived free radicals. When the concentration of the
TBC dissolved in the monomer phase is reduced to a certain value by reaction with the
free radicals generated in the monomer phase, polymerisation starts (see Figure 3.3.4).
There are several reports in the literature indicating that inhibitors, such as TBC, do not
behave ideally as inhibitors and act as chain transfer agents as well as retarders and
reduce the polymer molecular weight (Huo et al., 1987; Cunningham et aI., 2000,
Bevington et al., 2002 and 2003).
It can be concluded that both of the inhibitors used affected the rate of polymerisation.
However, from the data presented in Figures 3.3.4 and 3.3.7, it is apparent that TBC
inhibited the polymerisations in a more drastic way than HQ. This was easily explained
106

CHAPlER THREE EXPERIMENTAL RESULTS AND DISCUSSION
by favoured dissolution of TBC in the monomer phase. Both inhibitors retarded the rate
of polymerisation significantly with an increase in the inhibitor concentration.
The application of inhibitors changed the magnitude of drop size variations. A higher
inhibitor concentration gave a longer inhibition period, a more severe drop break up
rate, and finally a lower steady-state drop size (see Figures 3.3.5 and 3.3.8). The results
also indicate that the presence of an inhibitor in the system damps the variation of drop
size during the growth stage. HQ appears to be more efficient in the prevention of drop
coalescence and production of small polymer beads in comparison with TBC. It is
interesting to note that the presence of even lOO ppm of a monomethyl ether
hydroquinone in the un-purified monomer was sufficient to greatly reduce the final
particle size (see Figure 3.3.2).
Figure 3.3.10 shows the evolution of the volume fraction of satellite droplets (!v,) for
the runs with purified and un-purified monomer. Figure 3.3.11 demonstrates the
evolution of Ivs for the runs with HQ. Both quinone-type inhibitors hindered formation
of satellite particles (see Figure FA, Appendix F). The mechanisms suggested for the
formation of satellite droplets/particles have been mentioned in chapter 1. A very brief
description is given here.
0.2 -r----------------------, • purified MMA
o un-purified MMA
o
o 30 60 90 120 150 time (min)
Figure 3.3.10 Time evolution of volume fraction of satellite droplets in polymerisation of MMA with purified and un-purified monomer.
107

CHAPTER TIlREE EXPERIMENTAL RESULTS AND DISCUSSION
~ ......
0.1 -,---------------------,
e eO.OgHQ
lJ. 0.1 g HQ in water
D 0.4 g HQ in water
0.05
O+--~-~--~--~--~--~--~--_r---r--~
o 20 40 60 80 100 time (miD)
Figure 3.3.11 Time evolution of volume fraction of satellite droplets in polymerisation of MMA in the presence of HQ.
Satellite droplets are usually assumed to be formed as a result of a drop breakage
mechanism. It has been suggested that drops break up into daughter drops and a large
number of satellite drops (Chatzi and Kiparissides, 1992). Satellite droplets could be
formed due to the nonhomogeneities of mixing. Drops in the zone close to the impeller
may break up into very small droplets. The size of satellite droplets formed by these
mechanisms is usually around dmin (larger than a few microns). Dispersion/emulsion
polymerisation mechanism can also produce small particles. It is known that emulsion
particles can be formed in suspension polymerisation reactions (Cunningham, 1999).
For MMA monomer with relatively high water solubility (16 gIl at 70°C), the formation
of emulsion particles could be quite significant. Emulsion particles are formed by a
homogeneous nucleation mechanism (Fitch et aI, 1969) in large numbers. The free
radicals generated in the water phase propagate with the dissolved monomer to reach a
critical size after which they become insoluble in the water phase and precipitate to
form primary polymer particles. These tiny particles adsorb emulsifier/stabiliser from
the continuous phase and after some coagulation with other particles, depending on the
concentration of stabiliser and agitation speed, will eventually form stable polymer
particles. The newly formed particles will compete with monomer drops for adsorption
of stabiliser. By adsorption of stabiliser, the aruount of stabiliser available to the drops
is diminished leading to a decreased stability of drops with a subsequent intensive
growth by coalescence.
108

CHAPTER THREE EXPERIMENTAL RESULTS AND DISCUSSION
A point worthy of attention is that the volume fraction of satellite particles maintained
in the suspension in the runs with HQ inhibitor because of enhanced stability of the
suspension (Figure 3.3.11). Whereas the runs with the pure monomer ended up with a
loss of satellite particles as a result of an extensive flocculation/coagulation of satellite
particles during the growth stage. The results suggest that the formation of large number
of satellite droplets/particles could be the reason why particles grow appreciably in the
absence of an inhibitor. The growing free radicals generated in the water phase by the
decomposition of the dissolved initiator will be terminated by reaction with inhibitor
molecules dissolved in the water phase before they can reach the critical size to form
primary particles. Application of water-soluble inhibitors as a means to reduce the
formation of dispersion/emulsion particles has been reported, but not compared and/or
analysed, in the literature (e.g., Okubo et al., 1997; Ma et al., 2003). Such a conclusion,
however, is not evident for TBC as the cessation in the formation of satellite particles
was not evident in the results obtained with this inhibitor (not shown). Although TBC is
an oil-soluble inhibitor, its solubility in the water phase, 0.2 wt% at 25°C (Sax and
Lewis, 1989), should be sufficient to prevent aqueous-phase polymerisation. This
assumption may look more plausible if we note that the concentration of the free
radicals generated in the water phase is very low. This is because LPO is also an oil
soluble initiator and its solubility in the water phase is limited. The reduction in the size
of particles with TBC concentration may have an origin in the drop viscosity.
The importance of the Emulsion/Dispersion Particles
In order to verify and estimate the contribution of emulsion particles to instability of the
suspensions, we performed a dispersion polymerisation with the aqueous phase that had
the same formulation as that in the suspension polymerisation.
The reaction temperature and PV A concentration were kept at 70°C and 1 gIl,
respectively. The impeIIer speed was 500 rpm. The water phase was saturated with the
monomer (MMA) and the initiator (LPO). Considering that the water solubility of
MMA is 16 gIl at 70°C, we used 8.96 g MMA for 560 g of aqueous phase (i.e., 1 gIl
PV A solution). LPO is an oil soluble initiator, but it is dissolved in the water phase to a
limited extent. The melting point of LPO (54°C) is lower than the reaction temperature
(70°C) and so the undissolved LPO remains as small droplets in the aqueous phase.
Precautions were taken to remove suspended droplets of MMA and LPO from the
109

CHAPTER THREE EXPERIMENTAL RESULTS AND DISCUSSION
aqueous phase. The dispersion polymerisation was carried out for 3 hr. The solution
became bluish after about 30 min indicating that polymer particles were being formed.
In fact this observation showed that the infinitesimal amount of dissolved LPO in water
provided a sufficient number of radicals in the water phase to induce homogeneous
nucleation. After 3 hr, the remainder of the monomer containing 1.0 wt% LPO, was
added to the reactor and the suspension polymerisation started. For simplicity we may
refer to this process as a hybrid of dispersion-suspension polymerisation in which the
formation of emulsion/dispersion particles was enhanced as will be discussed later.
Rate of Polymerisation: Figure 3.3.12 shows the conversion-time variation for the
conventional suspension polymerisation of MMA and the corresponding dispersion
suspension polymerisation. Time zero for the latter process is the time that suspension
polymerisation started. As seen from this figure, all the data points fall on the same
curve. The inset in this figure shows the variation of conversion in dispersion
polymerisation of MMA during the first 3 hr of dispersion-suspension polymerisation.
Mean Particle Size and Particle Size Distribution: Figure 3.3.13 illustrates the
variations of Saute! mean diameter of drops (D32) with time and conversion for the two
processes. The mean size of particles obtained as a result of dispersion polymerisation
was about 20 /lm. Figure 3.3.14a shows that the particles formed by this mechanism
have a broad distribution. Most of the particles obtained by this mechanism are smaller
than 10 /lm. This indicates that particles formed by this mechanism can be correctly
labelled as satellite particles. It should be noted that the primary particles formed by
homogeneous nucleation in the aqueous phase are usually small but they may coagulate
due to instability.
The measuring device used in this research was not able to detect particles smaller than
0.40 micron. So the contribution of particles smaller than 0.40 micron to the instability
of the suspension was not accounted for.
110

CHAP'IER THREE EXPERIMENTAL RESULTS AND DISCUSSION
1.---------------------~------------_, $0 g 0.8
0.2
o suspension polymerisation
o dispersion-suspension polymerisation
Ii)Gl
4iI
0.3
0.2
o o o
0.4
1 0.1 ... 0~-6~~--__ --__ --~
~ 0 m 100 Im ~ O~O~--~~--~ __ --~ __ --~--~-r--~-r--~~
o 20 40 60 80 100 120 140 time (min)
Figure 3.3.12 Conversion-time variations in suspension polymerisation of MMA and the corresponding disp-susp polymerisation (for the conditions see section 3.3.4). The small graph shows the conversion-time variations for the dispersion polymerisation.
300
a
8 200
E-l:!
Cl 100
0
0 20
300
b
rOO I:!
Cl 100
0
0
40
o suspension polymerisation
60 80 time (min)
[J dispersion-suspension polymerisation
0.2 0.4 0.6 conversion
o suspension polymerisation
o dispersion-suspension polymerisation
100 120
0.8
140
1
Figure 3.3.13 Evolution of D 32 in suspension polymerisation of MMA and the corresponding dispersion-suspension polymerisation with a) time, and b) conversion.
When the second stage (suspension polymerisation) started, the size of drops of added
monomer decreased according to the typical pattern in a transition stage (Figure
3.3.13). However, the rate of reduction in drop size is rather low in comparison with
that of suspension polymerisation. This could be due to a higher interfacial tension of
111

CHAPTER THREE EXPERIMENTAL RESULTS AND DISCUSSION
monomer/water interface as a result of emigration of the stabiliser molecules from the
water phase to the surface of emulsion particles. After sometime with continuation of a
period of mixing, the size of drops feIl to a value close to the steady-state value for the
drops in the suspension polymerisation. Eventually a point was reached when drop size
showed a rapid increase in size. Larger particles were obtained from the dispersion
suspension polymerisation in comparison with those from the suspension
polymerisation. Note that this experiment sets the maximum contribution of the
dispersion/emulsion particles to the suspension polymerisation. This is because in a
suspension polymerisation, both suspension and dispersion polymerisation occur
simultaneously and competitively. The primary particles formed via the dispersion
polymerisation may collide and coalesce with drops, before they become stable.
1. 0.10
eO.08
jO.06
" ~ 0.04
a
.ll S°.Q2 :6 0.00 :I--~~=:==;:::=::;::=:;:=::::;:==;:::=:;:::=---1
° 20 40 60 80 lOO diameter (IUD)
~0.015 ,--------------------"1 ~ b
;0.010 ,-' , ,
I •
] , \
, '. : ,
~ ~ ~ - - - suspension polymerisation
--dispersion-suspesion polymerisation
.. 0.005 i "
1 0.000 .l~;~""/L.:..:·'~·.:. =:===:::::::::;::::::=r==_-J ° 200 400
diameter (IUD) 600 800
Figure 3.3.14 Final PSD for a )dispersion polymerisation, and b )dispersion-suspension polymerisation and conventional suspension polymerisation of MMA.
The role of the dispersion particles in the overaIl evolution of particles can be
summarised as a sink for the stabiliser, which causes the large particles to grow to a
great extent as a result of their Iow coverage by the stabiliser. However, the author is
112

CHAPTER THREE EXPERIMENTAL RESULTS AND DISCUSSION
not certain that this is the only factor that destabilises the dispersions, at least for TCB.
Further study on the subject is left for future research.
The PSDs of final particles from the dispersion-suspension polymerisation and
conventional suspension polymerisation are shown in Figure 3.3.14h. The instability of
polymerising drops in the dispersion-suspension polymerisation, caused by the
formation of large number of satellite particles, led to an evolution of broad size
distribution of particles.
3.3.5 CONCLUSIONS
The main conclusions specific to this series are:
• Because of the heterogeneous nature of suspension polymerisation reactions, the
retardation effect of water-soluble inhibitors may be enhanced because of
continuous diffusion from the water phase to the monomer phase.
• The presence of inhibitor retarded the rate of polymerisation and viscosity
increase in drops, and thus facilitated drop break up so that smaller drop size
was achieved at the end of transition stage.
• The quasi steady-state drop size was lowered and approached that of
monomer/water dispersion with increasing inhibitor concentration.
• The application of inhibitors damped the growth stage and resulted in smaller
polymer beads. A possible reason for an enhanced stability of drops, in the
presence of an inhibitor, was found to be due to the cessation of formation of
emulsion/dispersion particles.
• The results from dispersion-suspension polymerisation process indicate that
dispersion/emulsion particles diminished the availability of the stabiliser to the
drops by adsorbing it. This slowed down the drop breakage rate during the
transition stage and established a higher steady-state drop size (if any) in
comparison with the conventional suspension polymerisation. Too many
satellite particles would destabilise the suspension and cause an imbalance in the
break up and coalescence rates so that particles continuously grow with the
progress of reaction (no quasi-steady state) and larger particles are obtained in
comparison with the conventional suspension polymerisation.
113

CHAPTER THREE EXPERIMENTAL RESULTS AND DISCUSSION
3.4 EFFECT OF TEMPERATURE
3.4.1 INTRODUCTION
In a suspension polymerisation the variation in reaction temperature will affect the
properties of both monomer and oil phases. The effect of an increase in temperature on
the dispersed phase is a higher rate of polymerisation, two- to threefold rate increase for
a IODC temperature increase (Odian, 1991), nothing certain can be said about its effects
on the properties of the water phase, which mainly depends on how PV A distributes
between the two phases at higher temperatures. Therefore, the results on the
temperature effects were not lumped with those that affect either of the two phases.
In this part of the thesis, the effects of temperature on the PSD evolution in the
suspension polymerisation of MMA have been studied. The results have been also
compared with those from corresponding non-reacting MMAlwater dispersions.
3.4.2 EXPERIMENTAL
The materials, experimental procedure and measurements have been described in detail
in Chapter 2. All experiments in this series were carried out at the agitation speed of
300 rpm. MMA hold up was 0.20. LPO and PV A concentrations were 1.0 wt% (based
on monomer) and 1.0 g!l (based on water), respectively.
3.4.3 RESULTS AND DISCUSSION
3.4.3.1 Non-reacting Liquid-Liquid Dispersion
Non-reacting dispersions of MMA in water were carried out at different temperatures of
50, 60, 70, and 80DC.
Mean Drop Size: The time variation of Sauter mean diameter of daughter drops at
different temperatures is illustrated in Figure 3.4.1. The drop size variations during
transient stage were almost the same for the different temperatures. Generally, the drop
size did not vary much with temperature (except for the drop size at 50 DC which
showed slightly a higher value than the others).
114

CHAPTER THREE EXPERIMENTAL RESULTS AND DISCUSSION
200
I> A50C 060C ISO
~
~ D70C 080C
,§.IOO ::: '~AO ~ A ~OA 50 0 01:10 0
0
0 50 100 time (min) ISO 200
Figure 3.4.1 Time variations of Sauter mean diameter of daughter drops for dispersions at different temperatures (for the other conditions see section 3.4.2).
250
0.03 -r--------------------, 1 a ... ;0.02
] ... 0.01
10.00+--__
o 20 40 60 diameter (1J.I11)
--i>--50C --O--60C
~, --O--70C -'A. ... -- -<> --80C
'»., .. ··s.
80 lOO 120
~ 0.02 -r---------------------, ]. ... ~
b
2 4 6 diameter (1J.I11)
--O--60C -- 0 --70C -- -<> --80C
8 10
Figure 3.4.2 Final a) daughter, and b) satellite drop size distributions for dispersions
at different temperatures.
115
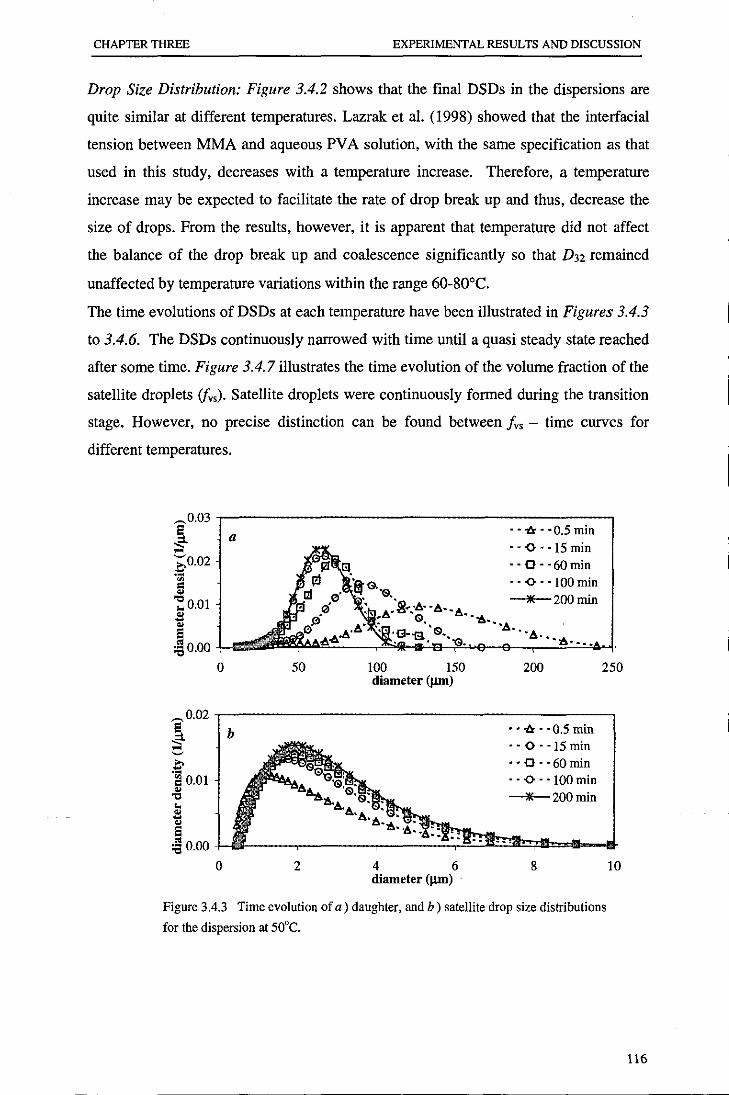
CHAP1ER THREE EXPERIMENTAL RESULTS AND DISCUSSION
Drop Size Distribution: Figure 3.4.2 shows that the final DSDs in the dispersions are
quite similar at different temperatures. Lazrak et al. (1998) showed that the interfacial
tension between MMA and aqueous PV A solution, with the same specification as that
used in this study, decreases with a temperature increase. Therefore, a temperature
increase may be expected to facilitate the rate of drop break up and thus, decrease the
size of drops. From the results, however, it is apparent that temperature did not affect
the balance of the drop break up and coalescence significantly so that D32 remained
unaffected by temperature variations within the range 60-80°C.
The time evolutions of DSDs at each temperature have been illustrated in Figures 3.4.3
to 3.4.6. The DSDs continuously narrowed with time until a quasi steady state reached
after some time. Figure 3.4.7 illustrates the time evolution of the volume fraction of the
satellite droplets (fvs). Satellite droplets were continuously formed during the transition
stage. However, no precise distinction can be found between lv, - time curves for
different temperatures.
~0.Q3
} a • - ob; - - 0.5 min - - 0 - . 15 min
;O.oz · - Q - -60min 'ill · - O· 'IOOmin !i "" lIE 200 min .. om -A--A .!! • .. "1!. ...... .. ~O.OO
G. A"'A . . .
0 50 100 150 200 250 diameter (lUll)
~0.02
~ b - • ob; - • 0.5 min · - 0 - -15 min
~
E '-Q"60min la 0.01 "O"IOOmin .. "" _200min .. .!! .. E ~O.OO
0 2 4 6 8 10 diameter (lUll) .
Figure 3.4.3 Time evolution of a) daughter, and b) satellite drop size distributions
for the dispersion at 50'C.
116

CHAPTER THREE EXPERIMENTAL RESULTS AND DISCUSSION
0.03 ~
i .... ~O.OZ
l!l .. "" ,,0.01 .. -.. ~o.oo
0
o.oz ~
i .... ~
~ .~
l!l 0.01 .. "" " .. -.. ~o.oo
0
50
2
lOO 150 diameter (J.III1)
4 6 diameter (J.III1)
- -.0, - -0.5 min - - 0 - -ZOmin - - 0 - -60min --O--100min
zoo Z50
- - .0, - -0.5 min - - 0 - -ZOmin - - 0 - -60min --O--100min
--150min
8 10
Figure 3.4.4 Time evolution of a) daughter. and b) satellite drop size distributions
for the dispersion at 60·C.
~0.03 ,---------------------,
i - - .0, - - 0.5 min .... :;0.02
] ,,0.01
10.00
- - 0 - -ZOmin --O--60min
- - 0 - -IZOmin __ 180min
-. -o 50 100 150 zoo 250
diameter (J.III1)
~O.o2 ,----------------------,
~ b ~
E irlO.OI ~
~ ~O.OO
o 2 4 6 diameter (J.III1)
- - .0, - - 0.5 min - - 0 - -20min --O--60min
- - 0 - -120min
--180min
8 10
Figure 3.4.5 Time evolution of a) daughter. and b) satellite drop size distributions
for the dispersion at 70·C.
117
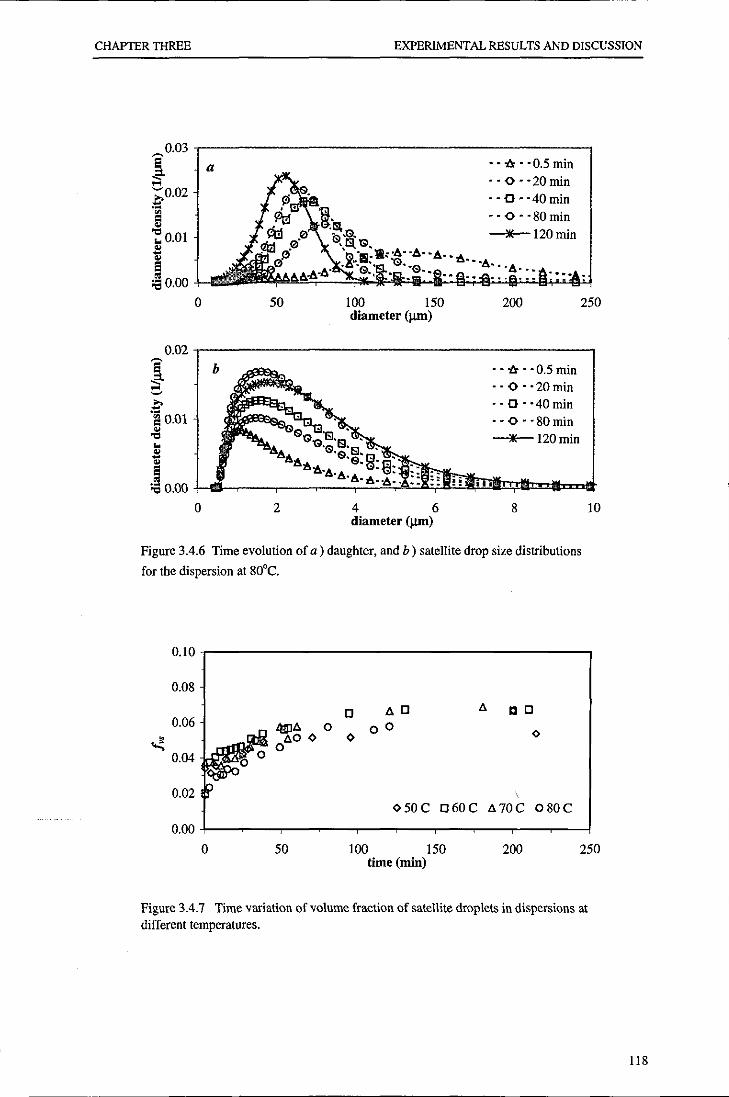
CHAP1ER THREE EXPERIMENTAL RESULTS AND DISCUSSION
0.03 ~
~ a ,..;
- - ob: - - 0.5 min --O--20min
;0.02 --O--40min ';l = - - 0 - -80min " "" .. 0.01 --lIE-- 120 min
" ~ " El ~O.OO
0 50 100 150 200 250
0.02 ~
} ~
E r! 0.01 " "" .. ~ " ~O.OO
0
b
2
diameter (j.IIl1)
4 6 diameter (j.IIl1)
- - ob: - - 0.5 min - - 0 - -20min --O--40min - - 0 - -SOmin --lIE-- 120 min
8
Figure 3.4.6 Time evolution of a) daughter, and b) satellite drop size distributions
for tbe dispersion at SO'C.
0.10
O.OS
0.06
~ 0.04
0.02
0.00
D AD
4!iJA 0 0 0 AO <> <>
ADD
<> o
<> 50 C D 60 C A 70 C 0 SO C
10
0 50 100 150 200 250 time (min)
Figure 3.4.7 Time variation of volume fraction of satellite droplets in dispersions at different temperatures.
118

CHAPTER THREE EXPERIMENTAL RESULTS AND DISCUSSION
3.4.3.2 Suspension Polymerisation
The suspension polymerisations of MMA were carried out at temperatures of 50, 60,
70, and 80°C.
Rate of Polymerisation: The conversion-time variations for the runs at different
temperatures are depicted in Figure 3.4.8. It is evident from this figure that the rate of
polymerisation increases with temperature. By considering the early time data for
conversion at each temperature, we can calculate the initial rate of polymerisation. This
calculation showed that in the range of temperature studied (50-80°C) the rate of
polymerisation increased 2.26 times (on average) for each 10°C increase in the reaction
temperature.
The onset of the gel effect was recorded at 210, 100, 55, and 32 min (corresponding to
the conversions of 0.30, 0.35, 0.40, and 0.45, respectively) for polymerisations carried
out at 50, 60, 70, and 80°C, respectively. A closer look at Figure 3.4.8 reveals that in
terms of conversion, the onset of the gel effect occurred at lower conversions with
decreasing temperature because of the high-molecular weight polymer formed at a
lower temperature. The duration of the gel effect, however, was shortened with
increasing temperature. This implies that the viscosity increase during the gel effect will
occur in a short interval of time at high temperatures (at about 5 minute for 80°C, for
example).
Mean Particle Size: Figures 3.4.9a and 3.4.9b show the variations of Sauter mean
diameter of daughter drops (D32) with time and conversion, respectively, at different
temperatures. The reduction in D32 during the transition stage appears to be more
appreciable for the lower temperatures; simply because for these runs the viscosity
build up in drops was slow and thus, drop break up could continue further. For the
higher temperatures, such as 80°C, the rise in drop viscosity depressed the rate of drop
break up and caused the transition stage to become short by balancing drop break up
and coalescence.
119
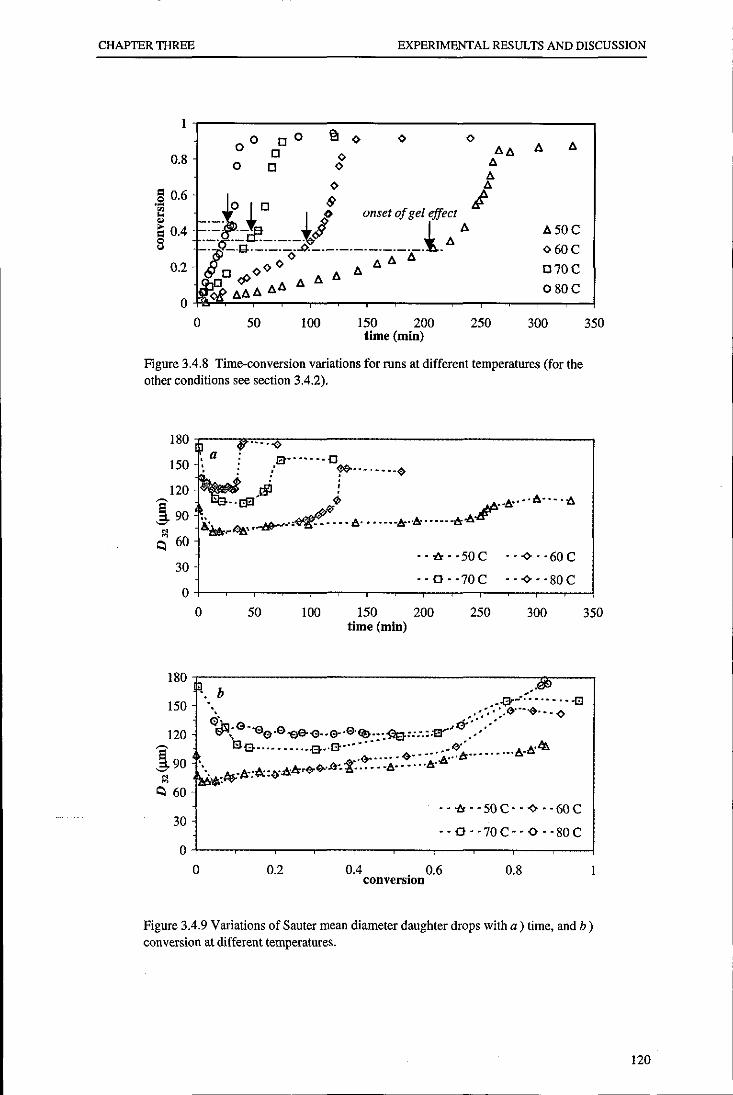
CHAP'IER THREE EXPERIMENTAL RESULTS AND DISCUSSION
I
00 O.S o
,~ 0.6 ~ " ~ 0.4 8
0.2
0
0 50
DO o o
100
<> <>
ISO 200 time (min)
250
I!. I!.
I!. 50 C
<>60C
070C
OSOC
300
Figure 3.4.S Time-conversion variations for runs at different temperatures (for the other conditions see section 3.4.2),
350
ISOr---A7-r·~··7.·~A.------------------------------~
,a: e---.... o ISO ~ 1! r-.. ---- .. ~ 120 @ !
~ 90 A~·r33~_"~~'I!."""_IIr"IIr ...... &-A#·I!."--I!."---I!. ~ ts. ... ~ ...
I:l 60
30
0
ISO
I:l 60
30
0 50 100 ISO time (min)
-- 'I!Io • ·50 C ---<>--60C
- - 0 - -70 C ---<>--SOC
200 250 300
- - 'I!Io' -sac- --<> - -60C
--O-'70C--O··SOC
350
O+---~--.---.----,--~---.--~--~---,--~
o 0.2 0.4 ,0.6 O.S converSIOn
Figure 3.4.9 Variations of Sauter mean diameter daughter drops with a) time, and b) conversion at different temperatures.
120

CHAPTER THREE EXPERIMENTAL RESULTS AND DISCUSSION
As a result of depressed rate of break up, a higher quasi steady-state drop size was
achieved with a temperature increase. It is seen from Figures 3.4.9a that D32 reveals a
mild growth during so called quasi steady-state stage for the lower temperatures (50 and
60°C). For these runs, in fact, D32 started increasing after a few percent conversion (see
Figure 3.4.9b). It can be stated alternatively that for these runs the steady state was
never achieved. For runs with the reaction temperatures of 70 and 80°C, quasi steady
states lasted for some time. At 80°C, D32 remained constant until a conversion of 0.60.
The molecular weight of polymer, and the polymer viscosity, is significantly reduced
with increasing temperature. Note that this is a double effect because besides formation
of Iow molecular weight polymers with Iow viscosity, polymers are less viscous at
higher temperatures. It is likely that at high temperatures when the viscosity of the
dispersed phase is comparatively Iow, the balance between drop break up and drop
coalescence is maintained to a greater extent resulting in a rather constant D32 during
quasi steady state. For the lower temperatures, the viscosity build up in drops with
conversion is so high that the rate of drop break up is extensively affected as reaction
proceeds. As a result, the rate of drop break up falls behind the rate of coalescence. This
leads to a constant, though small, rise in the size of particles even during the quasi
steady-state stage.
For all runs, a significant rise in the drop size was observed during the gel effect where
a massive increase in the drop viscosity occurred within a short period of time. The
growth was less significant for the lower temperatures and became steeper with a
temperature increase. If the stabiliser performance does not vary with temperature, a
possible conclusion emerging from the data obtained on MMNwater dispersions, then a
greater particle growth is expected at a lower temperature because of the large surface
area of particles formed and also a longer gel effect that allows more coalescence. This
is in contrast to the results obtained. Therefore, it seems that the growth of the particles
at higher temperatures could be due to loss of stability of the polymerising drops. This
implies that PV A becomes less effective in protecting polymerising drops against
coalescence with increasing temperature. It has been stated in the literature that there is
an overall trend of decreasing drop stability with increasing temperature, though the
magnitude of reduction is quite different for different PVAs (Lazrak et al., 1998). It has
been shown that this effect is not due to a decrease in viscosity of the continuous phase
with increasing temperature (He et al., 2002). The reasons for the loss of particle
121

CHAPTER THREE EXPERIMENTAL RESULTS AND DISCUSSION
stability at higher temperatures are not known. Increased rate of chain transfer to PV A
and dissolution of PV A in the monomer phase at higher temperatures are possible two
reasons.
Particle Size Distribution: Figure 3.4.10 shows a comparison between the final PSDs.
As a general statement, a larger and broader polymer particle and PSD were obtained
with increasing temperature. Figures 3.4.11 to 3.4.14 show the time evolution of the
PSDs for the polymerisations carried out at 50, 60, 70, and SO°C. The breadth of
distributions narrowed initially, but widened in the course of reaction. A distinctive
feature of polymerisation at lower temperatures (50 and 60°C) is the evolution of a
bimodal PSD during the polymerisations. The bimodal size distribution of daughter
drops occurred during the so-called quasi steady state and lasted till the onset of growth
stage. During the growth stage particles coalesced to form a single peak. The formation
of bimodal PSDs at lower temperatures is thought to be due to the shift in the drop
break up mechanism from uni-sized to multi-sized drops with increasing drop viscosity
(Kuriyama et al., 1995).
lOO 200 diameter (~)
Figure 3.4.10 Final PSDs for runs at different temperatures.
300 400
The evolution of satellite droplets is also illustrated in Figures 3.4.11 b to 3.4.14b.
Satellite droplets were continuously formed during polymerisation. The time variation
of fvs is shown in Figure 3.4.15. Satellite particles were generated at a greater rate with
increasing temperature. For the lower temperatures, satellite particles remained in
suspension by the end of reaction. For the higher temperature (SO°C). however. satellite
particles were lost by coalescence with large particles in association with the low
stability of the suspensions. However. all runs ended with almost the same value off vs.
122

CHAP'IER THREE EXPERIMENTAL RESULTS AND DISCUSSION
0.015.,-------------------------,
'[ eO.OIO
j ,,0.005
1 :a 0.000
o
a
100 d. mmeter (JUI1)
200
•• -0. ·0.5 min
··~··7Imin
• • -& •• 105 min ••• l+. ·163 min • • 0(> •• 240 min __ 300min
300
0.02,------------------------, .• -0. ·0.5 min • • ..,. . ·71 min • • -& •• 105 min • •. l+ •• 163 min • • 0(> •• 240 min
)I( 300 min
0.00 L ... ~--~-...::.~~~~~;,:I~!.!" ij' 1!.~.:.ao ........... "' ..... ~JbJ!.Yi .. o 2 4 6 8 10
diameter (fIJIl)
Figure 3.4.11 Time evolution of a} daughter, and b} satellite PSDs for run at 50'C.
~ 0.015,------------------------, El S-
a
;0.010
] Jl 0.005
J 0.000
o
'[ 0.03 ~ ~
~ 0.02 = " '"Cl
" 0.01 j!j
" El ~ 0.00
0
50 lOO
2
150 diameter (/lm)
4 6 diameter (/lm)
200
.• -0. ·0.5 min · . ..,. . ·20 min •• -&. ·40min · • ·x· •. 84 min • • 0(> •• 123 min __ 160min
250
•• -0. ·0.5 min .. ~. ·20min •• -&. ·40min · . ·x· . ·84 min • • <> •• 123 min --160min
8
300
ID
Figure 3.4.12 Time evolution of a} daughter, and b} satellite PSDs for run at 60'C.
123
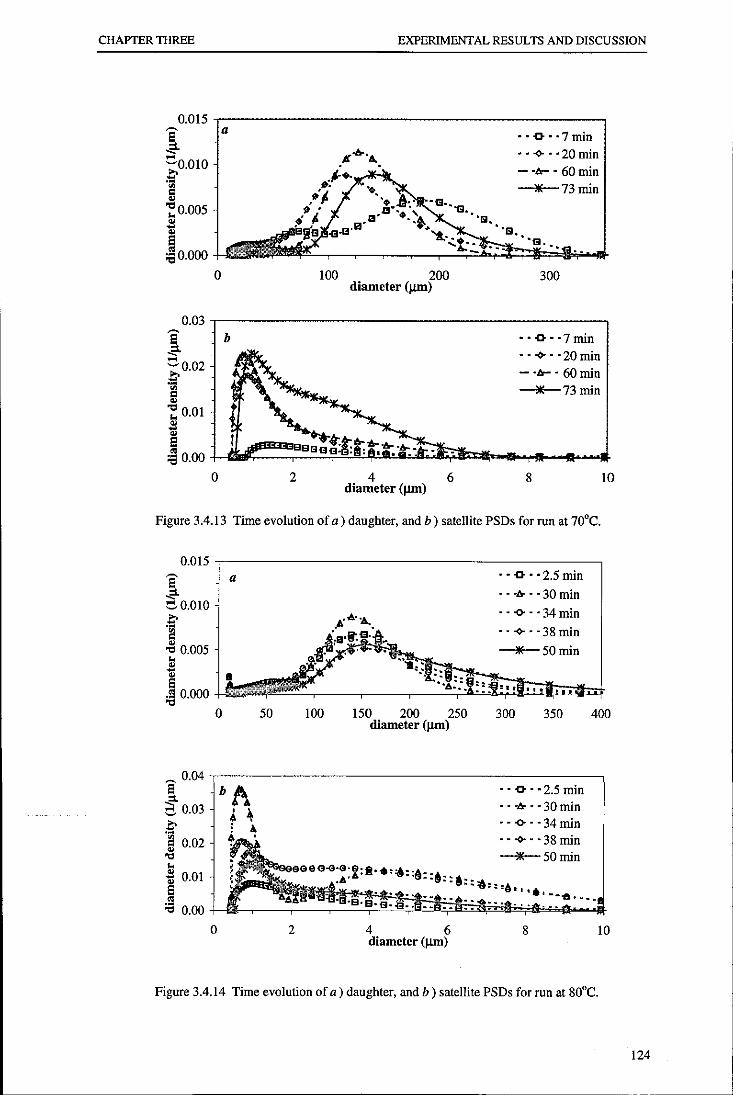
CHAP1ER THREE EXPERIMENTAL RESULTS AND DISCUSSION
0.015,..--------------------, ~
~ ;0.010
.~
~0.005
10.000 o
·EI.
100 200 diameter (lUll)
··-o-"7min •• o()o •• 20 min - ./>- • 60 min _73min
300
0.03.,---------------------, b ··-o-"7min
•• o()o •• 20 min - ./>- • 60 min _73min
2 4 diameter (lUll)
6 8 10
Figure 3.4.13 Time evolution of a) daughter. and b) satellite PSDs for run at 70°C.
0.015.,------------------------,
8' a
S-~0.01O
f 0.005
I :8 0.000 .J-liliiifj
•• -0-' '2.5 min • • -I!r •• 30 min · . ..,. .. 34 min • • o()o •• 38 min
_50min
o 50 tOo 150 200 250 300 350 400 diameter (lUll)
~ 0.04 .,----------------------, 13 b ,,-o-··2.5min ~ 0 03 .. -I!r •• 30 min c· .£ .. ..,. .. 34 min 5 0.02 .. o()o •• 38 min "" _50min
il .'''·.A .. " 0.01 ijr:~!~~~~tt~·1·"'~:~:"~:~: 8;:~:;"~. '~'~;:,:~j 8 ~~·6",. :8 .oo-e .•••
0.00
o 2 4 6 diameter (!lm)
8
Figure 3.4.14 Time evolution of a) daughter. and b ) satellite PSDs for run at 80°C.
10
124

CHAPTER THREE EXPERIMENTAL RESULTS AND DISCUSSION
0.10 r---:::....-------------------, <> 50 C [J 60 C .0. 70 C 0 80 C
0.08
0.06
0.00 +-~____,r---__r-,....___r__.,.-.,...._~____,--_,_-,...._-!
o 50 100 150 time (min)
200 250 300
Figure 3.4.15 Time variation of volume fraction of satellite droplets in suspension polymerisations at different temperatures.
3.4.3.3 Suspension Polymerisation versus Non-reacting Dispersion
350
Mean Drop/Particle Size: Figure 3.4.16 compares the time variation in the Sauter mean
diameter of drops from the MMNwater dispersion with that of particles from the MMA
suspension polymerisation at the same temperatures. A larger difference between the
size of particles and drops was developed at a higher temperature. This can be partly
attributed to the higher rate of reaction and viscosity build up in the polymerising drops,
which establishes an early quasi steady state by reducing the rate of drop break up. The
loss of stability of polymerising drops against coalescence at higher temperatures seems
to be the second factor, which contributes to such a difference.
125
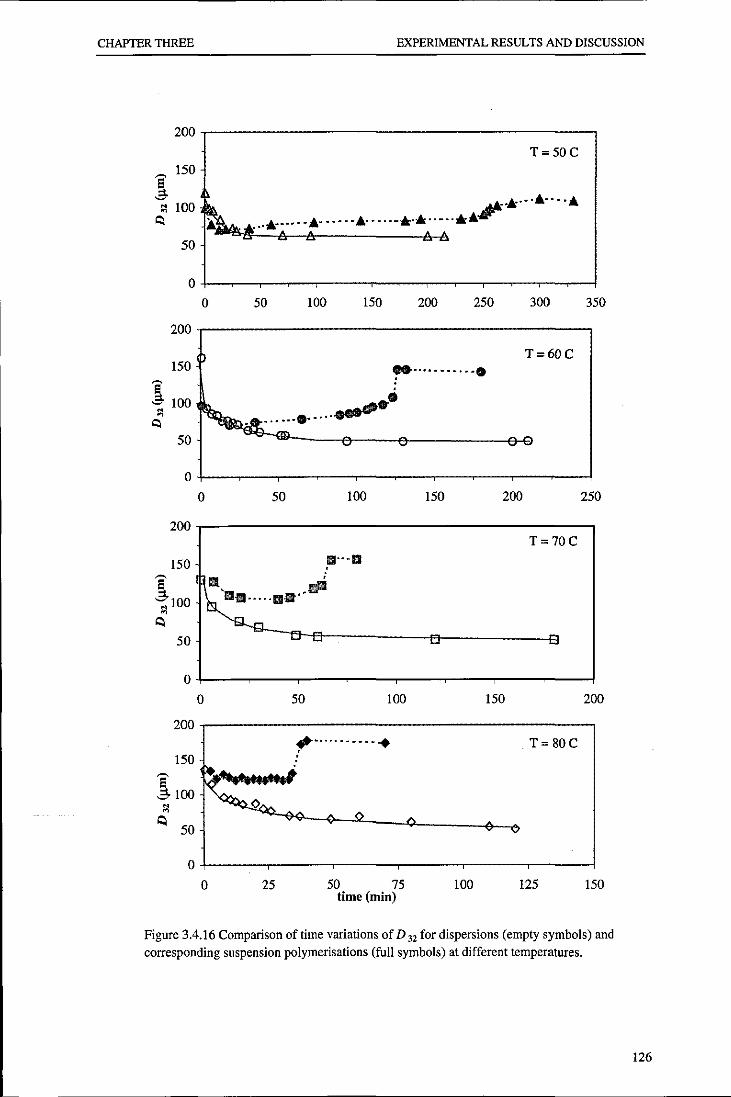
CHAPTER THREE EXPERIMENTAL RESULTS AND DISCUSSION
200,--------------------------------------,
~ 150
~ ::l lOO
I:<
50
T=50C
; .•.•. It. •.•. 1t.
~ .................. !' ..... . It. .... •• *.* ..... *'"
o 50 100 150 200 250 300 350
200r--------------------------------------,
P 150 ............. . T=60C
!100 ~ ~ ~ .•......•..... ~
f::c 50
0
0 50 100 150 200 250
200 T=70C
150 Ill- -·111 ~ HI ; ~100 ~dI ••••••• l1li •••
M ~
I:< 50 ~
0
0 50 100 150 200
200 ~.- ........... T= 80C
150
~ .... , ~
~ 100 ::l ~ <> I:<
50
0
0 25 50 75 100 125 150 time (min)
Figure 3.4.16 Comparison of time variations of D J2 for dispersions (empty symbols) and corresponding suspension polymerisations (full symbols) at different temperatures.
126

CHAPTER THREE EXPERIMENTAL RESULTS AND DISCUSSION
3.4.4 CONCLUSIONS.
The reaction temperature was found to play an important role in the determination of
the size average and distribution of particles in the suspension polymerisation of MMA.
The main conclusions are:
• Increasing the reaction temperature effectively shortened the transition period
and resulted in larger drops/particles.
• The balance between drop break up and coalescence during the so-called quasi
steady-state stage was better maintained at higher temperatures where the
polymer produced had a lower viscosity. At lower temperatures, drop size
increased with time during this stage. A real quasi steady-state drop size was
only achieved at higher temperatures and within a broader range of conversion.
• The growth stage was less evident at a lower temperature. Whereas a longer
growth stage is theoretically. expected for a slower rate of polymerisation.
Therefore the pattern of size variations with temperature during the growth stage
is most likely due to variation in the properties of the aqueous phase.
127

CHAPTER THREE EXPERIMENTAL RESULTS AND DISCUSSION
3.5 EFFECT OF AGITATION SPEED
3.5.1 INTRODUCTION
When two miscible phases are brought into contact by agitation, drops are fonned with
size depending on, among other variables, the agitation speed. The size of drops is
determined by the competition of break up and coalescence. An increase in the agitation
speed increases the rate of drop break up and thus favours the fonnation of smaller
drops (Shinnar, 1961; Sprow, 1967; Johnson, 1980; Chatzi and Kiparissides, 1994;
Lazrak et ai., 1998, Maggioris et ai., 2000; Yang et al., 2000). However, at very high
agit!l,tion speeds the drop size may increase due to an increase in the rate of coalescence
because of the very large surface area of drops and reduced effectiveness of the
suspending agent molecules on the interface. A V-shape dependence of the mean drop
size on the agitation speed has been reported by several investigators (Johnson, 1980;
Tanaka and Hosogai, 1990; Chatzi and Kiparissides, 1994; Zhou and Kresta, 1998).
In suspension polymerisations increasing the agitation speed decreases the final
polymer particle size (Konno et al., 1982; Kalfas et ai., 1993; Lazrak et ai., 1998). Yang
et al. (2001) have applied a variable agitation-speed method during the suspension
polymerisation of styrene to limit the drop size enlargement during the growth stage
and control the final polymer particle size.
In this section the effect of agitation speed on the evolution of PSD in the suspension
polymerisation of MMA has been studied. The results have been also compared with
those from corresponding non-reacting MMAlwater dispersions.
3.5.2 EXPERIMENTAL
The materials, experimental procedure and measurements have been described in detail
in Chapter 2. All experiments in this series were carried out at 70°C. MMA hold up was
0.20. LPO and PV A concentrations were 1.0 wt% (based on monomer) and 1.0 g/l
(based on water), respectively.
128

CHAPlER THREE EXPERIMENTAL RESULTS AND DISCUSSION
3.5.3 RESULTS AND DISCUSSION
3.5.3.1 Non-reacting MMA/Water Dispersion
Non-reacting MMAlwater dispersions were carried out with agitation speeds of 220,
300 and 500 rpm. The agitation speed of 220 was the minimum agitation speed at which
a thorough dispersion could be achieved for monomer hold up of 0.20.
Mean Drop Size: Figure 3.5.1 shows the time evolution of Sauter mean diameter of
daughter drops for this series. The transition stage is expected to elapse earlier with a
higher agitation speed (Chatzi et al., 1991). Such a pattern could be observed in the data
points for the runs with agitation speeds of 300 and 500.
Another series of experiments was carried out with agitation speed as a variable at PV A
concentration of 2.0 gII. The values of steady-state Sauter mean diameter were obtained
from each run and are plotted against agitation speed in Figure 3.5.2. On a log-log plot,
the data are well correlated with a line of slope -1.0 (Le., d32 oc NI·l.o).
150~--------------------------------------,
~. NI (rpm) """,. '220" -<>. '300·· o· '500 ~~.A, ~, t< A·.A-.A .•.• A •.•.• -.!. •••••••••• A._ ..•.• A
'~ ... ~ ;, .... ~.+ ... - ............ ~. - .............. ~
~ .. EJe.(3···e·········· ·13····-{']
M
~ 50
o 50. (.)100 tIme mm 150 200
Figure 3.5. I Variations of Sauter mean diameter of daughter drops with time in dispersions with different agitation speeds (for other conditions see section 3.5.2).
100r-----------------------------------------,
} .. ~ 10 I:i
o
100 1000 10000 NI (rpm)
Figure 3.5.2 Variation of steady-state D' 32 with agitation speed for a series of non· reacting dispersions.
129

CHAPTER TIlREE EXPERIMENTAL RESULTS AND DISCUSSION
The maximum and minimum stable drop diameters, above or below which drop
undergoes break up or coalescence, respectively, have been suggested by Hinze (1955)
and Shinnar (1961). Assuming that these boundary values are a linear function of the
average size of drops (Sprow, 1967), the following correlations are obtained where Kb
and Kc are constants (see equations 1.1.8 and 1.1.12, chapter 1):
d 32 _ K N-1.2 - b I
DJ Break-up dependent (3.5.1 )
d 32 = K N-o.75 D c J
I
Coalescence dependent (3.5.2)
From the comparison of the experimental exponent (-1.0) with those above, it can be
concluded that both drop break up and coalescence are operative under the condition of
this study with the PV A concentration of 2.0 gIl. It is apparent that drop coalescence
becomes more predominant as the PVA concentration is reduced (see part 3.1) to 1.0 gIl
used for this series.
Drop Size Distribution: In Figure 3.5.3 the steady-state DSDs (after at least 2 hours
from starting the agitation) for this series are shown. Figure 3.5.4 presents the evolution
of drop size distribution with time for the dispersion with the lowest NI used (220 rpm).
Note that the time evolution of DSDs for agitation speeds of 300 and 500 rpm have
been previously shown in Figures 3.4.5 and 3.1.4, respectively. Daughter drops were
continuously reduced in size and narrowed in breadth with time. The shape of DSDs
seems to change from a normal distribution at a higher impeJIer speed to one that is
negatively skewed at a lower impeller speed. Volume fraction of satellite droplets ifv,),
as shown in Figure 3.5.5, increases with time and impeller speed. However, an increase
in agitation speed from 220 rpm to 300 rpm did not result in any appreciable increase in
Iv,.
130

CHAPTER THREE EXPERIMENTAL RESULTS AND DISCUSSION
il°.oJ
l 50 lOO
diameter (~)
·A.
150
NI (rpm)
•• 0-. -500
•• -0- • -300
•• -i>. •• -220
200
0.04 ..,----------------------,
~0.Q3 ~
b
•• 0- • -500
•• -0- • - 300
2 4 6 8 diameter (~)
Figure 3.5.3 Final a) daughter, and b) satellite drop size distributions in dispersions with different agitation speeds.
.. .. ..a- .... 3min· .. .. .oX- .. -10 min
10
200 250
b
° 2 4 6 diameter (~)
.... -Do" "3 min •• ·X· • ·10 min ........ -30min ·"~""60min __ 150min
8
Figure 3.5.4 Time evolution of a) daughter, and b) satellite drop size distributions
for the dispersion with NI =220 rpm_
10
131

CHAP'IER THREE EXPERIMENTAL RESULTS AND DISCUSSION
0.20 NI (rpm) [J 220 ~300 A500
0.15 A A
~ '""'iJ.IO A
n "" 0.05 v ~.
0.00 0 50 100 150 200
time (min)
Figure 3.5.5 Time variation of volume fraction of satellite droplets in dispersions with different agitation speeds.
3.5.3.2 Suspension Polymerisation
250
Suspension polymerisations of MMA were carried out at three agitation speeds of NI =
220, 300, and 500 rpm.
Rate of Polymerisation: Figure 3.5.6 shows the conversion-time variation for the runs
with different impeller speeds. No effect of agitation speed was found on the rate of
polymerisation, as was expected.
132

CHAPTER THREE EXPERIMENTAL RESULTS AND DISCUSSION
1.0 £itA 4:J A oo A
0.8 ~
~ <= 0.6 0 0 ~ 'ill ..
0# '" ~ 0.4 0
e<J?> " 0.2
<:J)§ NI (rpm)
0220 0300 A 500
0.0 iJ 0 50 • (.) time nun
100 150 200
Figure 3.5.6 Conversion-time variations for MMA suspension polymerisation with· different agitation speeds (for other conditions see section 3.5.2).
Mean Particle Size: Figure 3.5.7 shows the variations of Sauter mean diameter of
daughter drops with time and conversion. Generally, the approach to the steady state
lasted longer with an decrease in impeller speed. It is quite interesting to note that the
duration of the steady-state stage was shortened with decreasing impeller speed. For NI
= 300 rpm, the steady-state stage was shorter than that for NI = 500 rpm. For NI = 220
rpm, the steady-state stage did not exist and the particle growth (growth stage) started
just after the transition stage where the minimum appeared. Consequently, the duration
of the growth stage was the longest for the lowest agitation speed. The onset of the
growth stage occurred approximately at the conversions of about 0.20, 0.40 and 0.60,
for NI = 220, 300, and 500 rpm, respectively. It can be stated that the critical conversion
at which the particle growth started, is not a constant and could be affected by the
mixing conditions, as well as the viscosity of drops.
133

CHAPTER THREE EXPERIMENTAL RESULTS AND DISCUSSION
200.---a----------------------,-,~~--=-=--=-1U~-----. ,--" ,6 ,~-----~ -----0. JJ-Z , ~,--- -e-' ,~ --~ 1:1---_____ , _I!Y ---O __ <> _________ <> __ Q-----
150
1100 ~ Is-----A Q /
50 ~ /' ,_~-~--A-----~--------A-------~~
o 25 ti (.) 50 me mm 75
NI (rpm)
0220 0300 A 500
100
200.-------------------------------_--~~~-=--~-~.~~, b , __ -------
-13-------3. " ,-Q----------~ "Cl. -B",Et' A_-'---->......... .a............ ->' ..... -<); "8---- __ ..... 4--....
~<>--------~-~---
150
,~I!A ,---~ _---'-' N I (rpm) ~r _ ''A_l!.-A.--.A.-----.A.--------A.---~----- 0 220
0300 t.500
0+---~_,--~--_r--~--~--~--~~--_4
0.0 0.2 0.4 conversion
0.6 0.8 1.0
Figure 3.5.7 Variations of Sauter mean diameter of daughter drops with a) time, and b) conversion for runs with different agitation speeds.
The reason for disappearance of the steady state (for NI = 220 rpm) is that the rate of
drop break up is a strong function of the agitation speed. We should bear in mind that to
maintain balance the rate of drop coalescence also increases with agitation speed as
more drops are formed. Note that drop/drop collision frequency increases with the
agitation speed, but the efficiency of coalescence decreases due to decline in the contact
time so that the net result is an increase in the rate of drop coalescence with the
agitation speed. The rate of drop break up is highly affected inversely by drop viscosity.
At a low agitation speed, with a lower rate of drop break up, an increase in the drop
viscosity will lead to an imminent reduction in the rate of drop break up. Therefore, the
balance between drop break up and coalescence could not be maintained further and no
steady state could be attained. This will result in a gradual enlargement of drops with
time and conversion. The balance could be better maintained at higher impeller speed,
which allows a quasi-steady state to form.
134

CHAPTER THREE EXPERIMENTAL RESULTS AND DISCUSSION
Particle Size Distribution: Figure 3.5.8 shows a comparison between the PSDs of the
final particles for this series. A larger size and a broader distribution were obtained with
decreasing impeller speed for daughter particles. Figure 3.5.9 shows the time evolution
of PSD for the experiment with NI = 220 rpm (the time evolution of PSD for agitation
speeds of 300 and 500 rpm have been previously shown in Figures 3.4.13 and 3.1.12,
respectively). Similar trends to those previously explained for the dispersions, are
observed here for the large particles.
NI (rpm) --0-'220
- - ~ - '300
- - "'- - '500
lOO 200 300 400 diameter (J.IIt1)
Figure 3.5.8 Final PSDs for runs with different agitation speeds.
0.01,-----------------------,
1 ..... ~
f too e 0.04 ::I.
com
f 0.02 " 'C ... " - 0.01 " e ~ 0.00
a
o
b/\. .. . , .. it. it.
0
100 • 200 dIameter (~)
2 4 6 diameter (~)
.... -0" -lOmin
- - -1Jr - -35 min
.... -0 .. -60 min
JI( 80 min
300
--O--lOmin
- -"", - -35 min
.. .. o()o .. .. 60 min
_80min
8
Figure 3.5.9 Time evolution of a) daughter, imd b) satellite PSDs for the run with
NI = 220 rpm.
400
10
135

CHAPlER THREE EXPERIMENTAL RESULTS AND DISCUSSION
Figure 3.5.10 shows the time evolution of the volume fraction of satellite droplets ifv,)
for the suspension polymerisations with different agitation speeds. The transient
formation of satelite droplets increased with stirring speed, similar to the results
obtained for the dispersion process. Generally, the formation of satelite
droplets/particles can be correlated with the duration of the steady state. The loss of
satelite particles occured when particles entered the growth stage. This occured at
different time and conversions for different agitation speeds. However, all runs ended
more or less with the same volume fraction of the satellite droplets because of
coaggulation during the growth stage.
0.20 N I (rpm) [] 220 <> 300 Il. 500
0.15
....:;0.10
0.05
0.00
0 20 40 60 80 100 120 140 160 time (min)
Figure 3.5.10 Time variation of volume fraction of satellite droplets in polymerisations with different agitation speeds.
3.5.3.3 Suspension Polymerisation versus Non-reacting Dispersion
Mean DroplParticle Size: Figure 3.5.11 compares the time evolution of D32 in
suspension polymerisations and in the corresponding dispersions for two agitation
speeds of 300 and 500 rpm. The approach to steady state was short when a high
agitation speed was used. As a result, the evolution of D32 during the transition period
for both dispersion and polymerisation processes was very similar. In fact, drops are
reduced to small sizes quickly enough at a high agitation speed before their viscosity
starts to increase appreciably as a result of ongoing polymerisation reaction. However, a
difference gradually develops as polymerisation proceeds.
Figure 3.5.12 shows the variations of D32 of the final polymer particles from the
suspension polymerisations and that of the steady-state drops from the non-reacting
dispersions with agitation speed. The difference between drops from the two processes
narrows with a stirring speed increase within the range of study.
136

CHAPTER THREE EXPERIMENTAL RESULTS AND DISCUSSION
Drop/Particle Size Distribution: Figure 3.5.13 compares the evolution of size
distributions for the two processes for the runs with NI = 300 and 500 rpm. At the
higher agitation speed, the difference between the size distributions of drops from the
two processes was small, but later grew with time. For the lower impeller speed, the
difference in the size distributions appeared to be appreciable even in the initial stage of
mixing. The gap became wider with time.
200 ,-----------,
ISO
~oo
N I =300rpm .-. , ~. " polymerisation 'Q ... --..... -
~ ~
50
"-~1)-o-~-er ____________ _
dispersion
o 30 60 90 120 time (min)
200~---------------------,
150
! polymerisation ~IOO ,. ____ .. _ ... ~ I
50 (". ... ..."i' dispersion ~-~er-er--------i)---C
o 30 60 90 time (min)
Figure 3.5.11 Time variation of Sauter mean diameter of daughter drops in suspension polyrnerisations and the corresponding dispersions with different agitation speeds.
120
~ ~
0.04.,-----------....,
o
NI = 300 rpm
•.... '0.5 min -.~ - 40min -120min
C 0.5 min o 40min ... final
100 200 diameter (pm)
300
0.04 .-.-----------,
N,=5OOrpm
........ .. '0.5 min -··-20min -120min
[] 0.5 min 50.02
'" o 20 min ... final J
0.00
o lOO 200 300 diameter (1IJIl)
Figure 3.5.13 Comparison of time evolution of DSDIPSD in polymerisation systems and the corresponding dispersions with different agitation speeds. Graphs with symbols represent the polymerisation.
200,-ac •..• -.------------------, .........•
.............. " . . . . . . . . . .
' .. ...... .... 0 ..
' .. ' .. '·-.e· ..... .......... .. .. .. .... .... .. .. ••••••• -0
O+---~--~----__ --,_--~--~----__ --~ 200 300 400 500 600
agitation speed (rpm)
Figure 3.5.12 Variation of Sauter mean diameter with agitation speed for suspension polymerisations (full symbols) and the corresponding dispersions (empty symbols),
137
CHAPTER THREE EXPERIMENTAL RESULTS AND DISCUSSION
3.5.4 CONCLUSIONS
The following major conclusions can be made:
• Drop coalescence was found to be important under the conditions of this study
even when a PV A concentration of 2.0 g/l was used.
• For both dispersion and polymerising processes, the size of final drops/particles
decreased with an increase in agitation speed within the range studied.
• A high agitation speed decreases the time required to reach the steady state, and
thus eliminates or alleviates the influence of viscosity increase, in association
with the polymerisation reaction, on the size of drops. This may lead to a similar
evolution of drop sizes in a suspension polymerisaion and the corresponding
non-reacting dispersion in the early reaction and during the transition stage in
particular.
• The duration of the so-called steady-state stage was prolonged with increase in
the agitation speed. The rate of drop break up is highly affected by drop
viscosity at a low agitation speed. As a result, the quasi steady state could be
better maintained at a higher impelIer speed. At a low agitation speed, there was
no quasi steady state.
138

CHAPTER THREE EXPERIMENTAL RESULTS AND DISCUSSION
3.6 EFFECT OF MMA HOLD UP
3.6.1 INTRODUCTION
It is always desired in industry to increase the output of manufacturing units at
minimum cost. In suspension polymerisation processes this target is usually met by
increasing the monomer hold up. The increase in monomer hold up, however,
destabilises the particles and also increases the possibility of thermal runaway.
Therefore, a careful examination of interaction of parameters involved in suspension
polymerisation reactors is required.
The maximum stable drop diameter, above which the drop undergoes a break up, for
inviscid and low hold up dispersions (negligible coalescence) is (see equation 1.1.8,
chapter 1) (Hinze, 1955):
(3.6.1)
The minimum stable drop diameter below which the drop will coalesce has been shown
to be (see equation 1.1.12, chapter 1) (Shinnar, 1961):
(3.6.2)
Any drop within the size range of dmin < d < dmax, thus, is expected to be stable. Sprow
(1967) assumed, and also verified within experimentation, that d32 is proportional to
dmax• So:
d K d K W. -3/5 K N-1.2 32=5max=6 e =71 (3.6.3)
This approach, which correlates d32 with the mixing conditions, has been used by many
investigators since then. The application of this correlation, however, has been
139

CHAP'IER THREE EXPERIMENTAL RESULTS AND DISCUSSION
questioned by some investigators in recent years (Pacek yet aI., 1998; Zhou and Kresta,
1998). Generally, in a liquid-liquid dispersion with increasing the volume fraction of
dispersed phase ((h) the mean particle size increases. Increase in tPd increases the
dispersion viscosity and thus damps the turbulence of the system, and also increases the
collision frequency of dispersed drops. All these result in an increase in mean drop size
(Doulah, 1975; Park and Blair, 1975; Delichatsios and Probstein, 1976; Lagisetty et al.,
1986; Nishikawa et al., 1987; Kumar et al., 1991). In order to accommodate such an
effect in the prediction, a following general form has been used (Calderbank, 1958;
Brown and Pitt, 1970; Coulaloglou and Tavralides, 1976; Van Heuven and Beek, 1971;
Mlynek and Resnick, 1972; Godfrey and Grilc, 1984; Lagisetty et aI., 1986):
(3.6.4)
Similar correlations, which used different exponents for tPd, have been also suggested
(Nishikawa et aI, 1987).
For suspension polymerisation, however, d32 is a complex function of mixing
conditions as well as the kinetics of polymerisation. Several investigators have studied
the effect of monomer hold up in suspension polymerisation on the final polymer
particle size (Konno et aI., 1982; Kalfas et al., 1993; Alvarez et al., 1994; Lazrak et aI.,
1998). All studies show that the final average particle size increases with monomer hold
up.
In this section the effect of dispersed phase hold up on the kinetics and the evolution of
PSD in the suspension polymerisation of MMA has been studied. The results have been
also compared with those from corresponding non-reacting MMAlwater dispersions.
3.6.2 EXPERIMENTAL
The materials, experimental procedure and measurements have been described in
details in Chapter 2. All experiments in this series were carried out at 70°C and
agitation speed of 300 rpm. LPO and PV A concentrations were 1.0 wt% (based on
140

CHAPTER THREE EXPERIMENTAL RESULTS AND DISCUSSION
monomer) and 1.0 gIl (based on water), respectively. Different MMA hold ups were
used for suspension polymerisation runs (~= 0.025, 0.05, 0.10, 0.20, 0.30, and 0.40)
and non-reacting dispersion runs (I/Jd= 0.05,0.20, and 0.40).
Gas-liquid chromatography was used to determine the equilibrium MMA concentration
in the aqueous phase. Details of the measurements are given in Chapter 2.
3.6.3 RESULTS AND DISCUSSION
3.6.3.1 Non.reacting Liquid.Liquid Dispersion
Mean Drop Size: Figure 3.6.1 shows the time evolution of the Sauter mean diameter of
drops (D32) in non-reacting MMAlwater dispersions for different values of I/Jd. A larger
drop size was obtained with increasing I/Jd due to collisions of drops. The increased rate
of drop coalescence balances the rate of drop break up earlier, thus a shorter transition
stage was obtained.
200,-------------------------------------, G>d Ll. 0.05 CJ 0.20 00.40
o+---~--~----~--~--__ --~~--__ --~ o 50 time (min) 100 150
Figure 3.6.1 Time variations of Sauter mean diameter of daughter drops for dispersions with different MMA hold ups (for conditions see section 3.6.2).
200
If the experimental overall Sauter mean diameter (D'32) is fitted with equation 3.6.4. the
values of constants are obtained as follows: a = 0.022, and b = 3.55. The constant a,
which depends on the experimental conditions and set up, is within the range given in
the literature. According to the literature, a value of b close to 3.0 is representative of
turbulence damping (Brown and Pit!, 1974; Doulah, 1975), and a value of b larger than
3 and up to lOis indicator of coalescence (Davies, 1972; Godfrey et al. 1987; 1989).
The result suggests that both turbulent damping and drop coalescence contribute to the
rise in the drop size with I/Jd. This implies that at the stabiliser level used, the dispersion
141
- -- -----------
CHAPlER THREE EXPERIMENTAL RESULTS AND DISCUSSION
is within the coalescence operative region, but not the coalescence dominating region,
where the size of drops is determined by a dynamic balance between drop break up and
coalescence.
A point worthy of attention here is that the interfacial area expands with a rise in the
volume fraction of the dispersed phase. At high-dispersed phase volume fractions the
collision between drops is frequent. The coalescence efficiency of drops (with a certain
size), however, is not affected by the hold-up for pure liquid-liquid dispersions. ill the
presence of (a fixed concentration of) a stabiliser, drops become less protected with a
hold up increase as the coverage of the drops with the stabiliser falls. This may lead to
an increase in the coalescence efficiency of drops. This implies that for stabilised
dispersions, a rise in the hold up would enhance both the collision rate and the drop
coalescence efficiency. However, the effect is still not as extensive as that for pure
liquid-liquid dispersions because of the drop stability provided by stabilisers.
Drop Size Distribution: The steady-state drop size distributions are compared in Figure
3.6.2 for different values of 9d. The application of a larger amount of monomer resulted
in the broadening of size distribution of daughter drops in association with an increase
in the average size of drops. The population of satellite droplets increased with
decreasing monomer hold up. The reduction in the population of the satellite droplets at
a high hold up is a result of a high rate of drop collision with subsequent coalescence.
However, the rate of droplet coalescence was not high enough to eliminate the peak of
satellite droplets.
Figures 3.6.3 and 3.6.4 demonstrate the time evolution of drop size distribution for the
dispersions with the maximum and minimum 9d values used; namely 0.05 and 0040,
respectively (the same graph for 9d = 0.20 has been shown in Figure 3.4.5). Similar to
the results previously described, the DSDs continuously narrowed and shifted to a
lower size with time. The peaks for the satellite droplets were dilated with time
indicating that these small droplets were continuously formed during mixing,
particularly for lower 9d values where drop break up is dominant.
142

CHAPTER THREE EXPERIMENTAL RESULTS AND DISCUSSION
o.o4,.----------------------,
~ ~
,e. ·~0.02
" ... I ;g 0.00
a
o 50 diameter (11Jl1) 100
<l>d • • -& • '0.05
• • 0-' '0.20
• • 0- • ·0040
·e.. _ •..• f.i) •
150
~ 0.04 T":"b---------------------,
! ~ e .J!I'4A'A •• ", ••. 0.05 .to ~- 'Az,-a •• . ~ 0.02 {>. A'A'A •• 0-' ·0.20 ~ la eBSi313 "a. 040
... (>. eeGG ·s . ., ..... 1. - - 0- •.. .. A "G·s . .,. '. _ G ..... '" A •• ~a'" 6. '6'9.'8- 13 • A ...
··"::6:,.~;;:6::: .$ 0.00 +-_I.,----,--_----,r---_-.,....:::.:..:.~:..:JI.'_¥.a..........j,.....o.4I! ...
o 2 4 6 diameter (11Jl1)
8
Figure 3.6.2 Steady-state a) daughter. and b) satellite drop size distributions for dispersions with different MMA hold ups.
~0.04
~ ~ 50.02 ... .. " -e " :a0.00
0
0.04
~ b
~
,e. ·~0.02
" ... .. " -" a ;go.oo
0 2
'A.
50diameter (11Jl1) 100
4 diameter (11Jl1)
• 'A. • 'A.
"1. ..
6
• - "" "I min "o'-17ntin - • -0- - -41 min - - <>. -50min __ 120min
150
•• "" • - I min "o--17ntin ---o-'-4Imin - - <> - '50min __ 120ntin
8
10
200
10
Figure 3.6.3 Evolution of a) daughter. and b) satellite drop size distributions for the
dispersion with <l>d = 0.05.
143

CHAPTER THREE EXPERIMENTAL RESULTS AND DISCUSSION
~O.O4
]. a --~--5min
.... --O--20min ~
.e- - - .... - -50min ·~O.O2 '"
- - <> - -120 min '<I .. '" ~ '" a
:gO.DO : :: .
0 50 lOO diameter (jl.IlI)
150 200
~O.04
} b --~--5min
--o--20min ~
E -- .... --50min !!lom - - <> - -120 min '" '<I __ 180min .. '" ~ '" e
:gO.OO
0 2 4 6 8 10 diameter (jl.IlI)
Figure 3.6.4 Evolution of a) daughter, and b) satellite drop size distributions for the dispersion with <i>d = 0.40.
3.6.3_2 Suspension Polymerisation
In this series suspension polymerisations with different MMA volume fractions (0.025,
0.05, 0.10, 0.20, 0.30, and 0.40) were carried out.
Rate of Polymerisation: Figure 3.6.5 shows the conversion-time variation for the runs
with different monomer hold ups. The rate of polymerisation can be better described if
the following conversion ranges are considered:
Initial stage: The initial rate of polymerisation shows an increase with increasing
monomer hold up. MMA has a high water solubility; 1.6 wt% at 70°C (Kalfas et al.,
1993). The initial monomer in the reactor saturates the water phase. This reduces the
amount of monomer available in the monomer droplets. Knowing that the locus of
polymerisation in suspension polymerisation is in fact the monomer drop phase, and
assuming that the polymerisation of MMA in the water phase is negligible, the rate
of polymerisation is expected to decrease with decreasing I/Jd. For I/Jd = 0.025, 60% of
144

CHAPTER THREE EXPERIMENTAL RESULTS AND DISCUSSION
the initial monomer is dissolved in the water phase and is absent from the locus of
polymerisation. Obviously, the rate of polymerisation was mostly affected for this
case. For 9d = 0.05, polymerisation still started with 30% of the initial monomer
charge in the water phase, and so the rate of polymerisation was consequently
affected. With higher 9d values, the initial rate of polymerisation became less
affected by 9d.
1.0 :A.+ + 11 ~~ 0
0.8 §~~~~~ ~
= ~ x [] .51 0.6 '" q~ .. initial stage final stage ~ =0.4 <l>d 0 A inter- [] 0.Q25 ~0.05 "
0.2 At ~~ ~ []! mediate 00.10 11 0.20
~d'iI [] [] ! stage +0.30 X 0.40 0.0
0 30 time (min) 60 90 120
Figure 3.6.5 Conversion-time variations for runs with different MMA hold ups (for other conditions see section 3.6.2).
Intennediate stage: This stage, which covers the gel effect, appears at different
conversions according to the 9d used. For the higher values of 9d, the gel effect
started at conversion of 0.40, which corresponds to the onset of the gel effect for
MMA bulk polymerisation. With decreasing 9d, the onset of the gel effect is shifted
towards a lower conversion. For 9d = 0.025, for example, the gel effect started at a
conversion of 0.20. It should be noted that the onset of the gel effect depends on the
monomer conversion inside the drops and not on the reactor monomer conversion.
This means that for all polymerisations, it is expected that the onset of the gel effect
occurs at x = 0.40, despite different values for the corresponding overall conversion.
Final stage: Generally a lower final conversion was achieved for the lower 9d. This
again is a result of monomer partitioning between monomer drops and water phase.
As the polymerisation reaches higher conversions in the particles, however, the
monomer dissolved in the water phase slowly diffuses into the polymer paiticles and
145

CHAPTER THREE EXPERIMENTAL RESULTS AND DISCUSSION
reacts there. This effect is more significant for the lower l/ld. The measurement of
conversion for 9d =0.40 was hampered by gross coagulation of particles, as is
explained later.
Monomer Partitioning: As stated above, monomer partitioning in the water phase may
play an important role in the kinetics of polymerisations particularly with low values of
9d. Figure 3.6.6 shows the variations in MMA concentration in the aqueous phase with
time and conversion in the suspension polymerisations with 9d = 0.10 and 0.30. Both
systems behaved similarly with no apparent difference. Initially MMA concentration in
water gradually decreased with time (and conversion) from about 1.6 wt%, which is the
equilibrium solubility of MMA in water at 70°C, because of diffusion of monomer
molecules from the water phase into the polymerising drops. Monomer transport occurs
to maintain the thermodynamic eqUilibrium between phases as a result of conversion of
monomer to polymer in the polymerising drops. The rate of monomer conversion
increased significantly after about 55 minutes (corresponding to a conversion of 0.40)
due to the gel effect. As a result, monomer molecules migrated from the water phase to
the polymer/monomer drops in order to maintain the equilibrium. This led to a sudden
drop in the MMA concentration in the water phase. As the conversion reached higher
values, the MMA concentration in the water phase dropped to a value as low as 0.2
wt%. Monomer transport at this stage was quite slow due to solidification of polymer
particles.
Mean Particle Size: Figures 3.6.7 compares the variation in the Sauter mean diameter
of daughter drops with time and conversion for different values of 9d. The general
pattern is that the final size of particles increased with 9d. The extent of variation in D32
with 9d is more than what turbulence damping can allow for. This implies that drop
coalescence is quite important at the conditions of this study, as confirmed in the
experiments with non-reactive MMNwater dispersion system. Now we look at the
variations of D32 in different time intervals.
A lower average size of particles was obtained at the end of the transition stage for the
lower values of 9d, similar to the results shown for non-reacting MMAlwater
dispersions. This is because the steady-state drop size increases with hold up as a result
of increase in drop encounters.
146

CHAP'IER THREE EXPERIMENTAL RESULTS AND DISCUSSION
0.04 .,--------------------,
o 20 40 60 80 100 time (min)
120 140 160
0.04,-------------------,
0.2 0.4 conversion
00.10
0.6
l> 0.30
0.8 I
Figure 3.6.6 Variations of MMA concentration in the aqueous phase with a ) time, and b) conversion for suspension polymerisations with two different MMA hold ups.
300,-------------------------r~r~---~-~-~~,-------,
a c 0.025 <> 0.05 0 0.10 /
0
300
~200 e
2!-~ ~
Cl 100
~ / t. 0.20 + 0.30 X 0.40 / .+ ____ +
~ )'( / r , ' \. 1.../' ~> . ..x7< .. -------1>. ~:'..iit~-"' __ ~--0..---XT"-~w-~·.'!'fi.:.IJ(,' ~~'O --.,A...-_A __________ A __ w6- __ ---
'~~~~'i~~~~~~~--~
0 20 40 time (min) 60 80 100
b c 0.025 <l>d
I> 0.20
o 0.2
<> 0.05 00.10
+0.30 x 0.40
0.4 . 0.6 conversIOn
-1(
.' -- •• +-----+
0.8
Figure 3.6.7 Variations of Sauter mean diameter of daughter drops with a) time, and b) conversion for runs with different MMA hold ups.
147

CHAPTER THREE EXPERIMENTAL RESULTS AND DISCUSSION
The drop size showed a slight rise with time with lower values of I/Jd, but showed an
appreciable increase in the beginning of the gel effect for the runs with higher values of
I/Jd. For the lowest values of I/Jd used, 0.025 and 0.05, the critical conversion at which
drop enlargement occurred was around the value of 0.20, which corresponds to the
onset of the gel effect for these runs as mentioned above. Except for the two lowest I/Jd
used, the conversion range for the quasi-steady state stage seems to narrow with
increasing I/Jd (see Figure 3.6.7b). This implies that with an enhancement of the rate of
drop coalescence with a I/Jd increase, the balance between drop break up and coalescence
is perturbed earlier and drops enter the growth phase. The results suggest that the onset
of the growth stage is advanced with increasing I/Jd. For the highest I/Jd used, 0040,
particle coalescence occurred extensively at x = 0045 leading to the formation of some
polymer lumps.
Particle Size Distribution: The PSDs of final particles are compared in Figure 3.6.8.
For lower I/Jd values, 0.025 and 0.05, rather sharp final PSDs were obtained. Whereas
for the higher values of I/Jd, 0.20-0040, positively skewed PSDs were obtained as a result
of increased particle coalescence with I/Jd. Generally, the size distribution broadened
with increasing I/Jd.
Figures 3.6.9 and 3.6.10 show the time evolution of PSD for the runs with extreme I/Jd
values of 0.025 and 0040, respectively (the same graph for I/Jd = 0.20 has been shown in
Figure 3.4.13). Similar to the results presented before, the PSDs of all suspensions
showed a peak for satellite particles. All PSDs continuously broadened with time. A
high rate of particle size broadening occurred during the growth stage for all runs with
an intensity increasing with I/Jd. It is quite interesting to note that particle size
distribution broadened with time in the course of polymerisation even for the run with
I/Jd = 0.025.
Figure 3.6.9b shows that for the lower I/Jd, the PSD peaks for the satellite droplets
reached their steady-state configuration quite early. This is because the small monomer
drops formed at low I/Jd values could not be further broken into satellite droplets. At the
higher values of I/Jd, the satellite droplets were continuously formed during
polymerisation.
148

CHAPTER TIlREE EXPERIMENTAL RESULTS AND DISCUSSION
o.o2,--------------------, <l>d
} ~
~0.01 ~
a • . ..,. • '0.025 · . ~. '0.05 ....... '0.10 ....... '0.20 .. + . ·0.30 • • i( •• '0040
10.00 ... 0 100 200 300 400 500
diameter (1J.IIl)
0.03.,...---------------......,-----,
'[ b •. .,.. '0.025 Co 02 .. -0- • '0.05 t> . • ..... --0.10 .~ ...... --0.20 ... 001 • '!'."'. .. + --0.30
t' iJU,-~~~~;;;;~ ... ~·~··~'!'j·~·+~·~·;+~~$~~·~·~*:·~·i·o:.;4~0~J J 0.00 "+.
o 2 4 6 8 diameter (1J.IIl)
Figure 3.6.8 Final a} daughter, and b} satellite PSDs for runs with different MMA hold ups.
10
0.02.,..-----------------------,
! o ~ ;gO.Ol ~
I
a
:SO.OO -1--' ...... o 50
....
100 150 diameter (1J.IIl)
" -0' '0.5 min " ..... ·20 min - .tr- • 49 min ...... " 60 min
)I( 75 min
200 250
~0.03 ..,-----------------------, ab" -0 "O.5min ;S- ...... "20min ;0.D2 - .tr- • 49 min .~ ·· ...... 60min ... )I( 75 min "om
10.00 .l-jL--;~!~~~~~~~~'l!::~t!!:!lII;~titl~:;!::ci o 2 4 6
diameter (1J.IIl) 8 10
Figure 3.6.9 Variations of a) daughter, and b) satellite PSDs with time for the run with <l>d = 0.025.
149

CHAP'lER THREE EXPERIMENTAL RESULTS AND DISCUSSION
0.02 -r-----------------------, ~
~ ~
io.o! '" '"
a
t.oo+--
- - -D - -0.5 min
- - -Q- - -15 min
- -"" - -40 min -lIE--71min
o 100 200 300 400 500 diameter (IJ.III)
~ 0.03 .,-----------------------,
~ ;0.02
] .. om
- - -D - -0.5 min - - -Q- - -15 min
- -"" - -40 min -lIE--61min
i LL~~~~ _$ '" 0.00
o 2 4. 6 dIameter (IJ.III)
8
Figure 3.6.10 Variations of a) daughter, and b) satellite PSDs with time for the run
with <l>d = 0040.
3.6.3.3 Suspension Polymerisation versus Non-reacting Dispersion
10
Mean Drop/Particle Size: Figure 3.6.11 compares the time evolution of the Sauter
mean diameter of daughter drops in suspension polymerisations and the corresponding
MMNwater dispersions with different MMA hold ups. The difference between the
drop sizes in the two processes developed with time during the transition stage and
steady-state stage and reached its maximum at the end.
Figure 3.6.12 compares the final size of particles (or drops) from the two processes.
The quasi steady-state size of particles for the polymerisation experiments is also shown
on the graph. The difference between the steady-state size of particles and drops, from
the two processes, increased gradually with I/Jd. The difference between the final size of
particles and drops, from the two processes, increased with I/Jd as a result of increasing
drop instability in the suspension polymerisation.
150
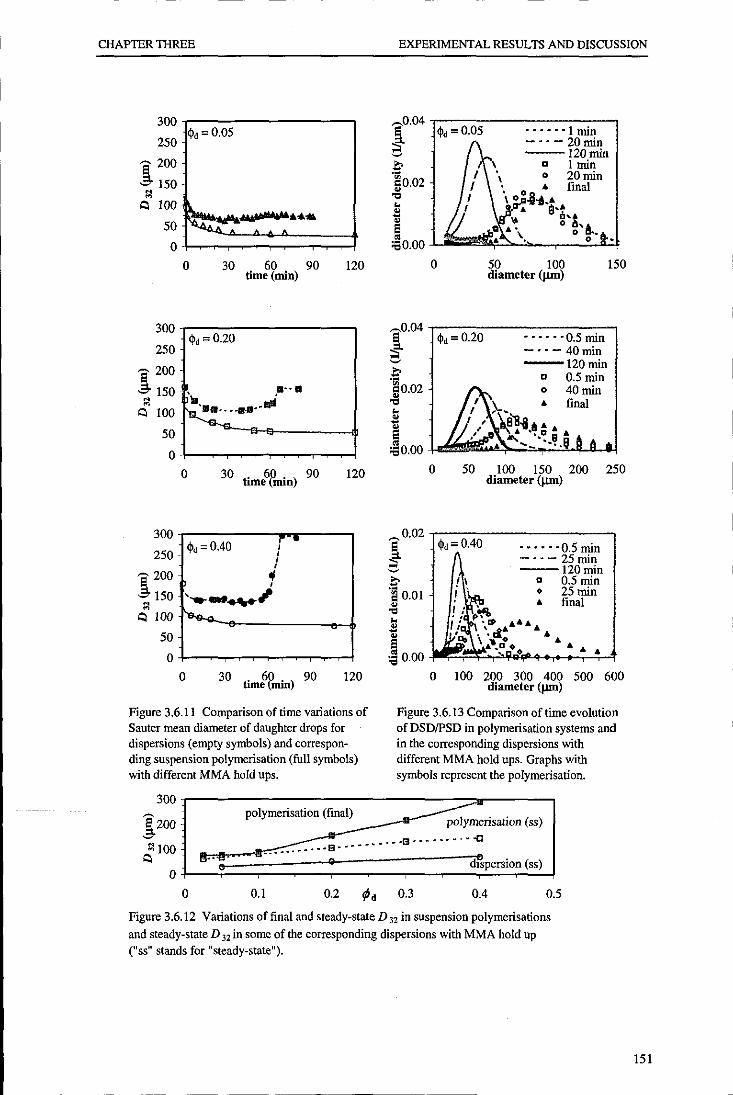
CHAPTER THREE EXPERIMENTAL RESULTS AND DISCUSSION
300
250 </Id = 0.05
~ 200
! 150 [;l
'1 100 "- ..... tWW ..... 50 .~. A
0
0 30 60 time (min)
90 120
300
250 </Id = 0.20
} 200
150 •••• [;l ' .... ". ......rad
Cl 100 ~. . 50
0
0 30 . 68,) tIme mm 90 120
300 </Id = 0.40 r-·
250 , , , ~200 <I ! 150
, ' __ ..... J1
M ~
~ '1 100
50
0
0 30 . 68,) time mm 90 120
Figure 3.6.11 Comparison of time variations of Sauter mean diameter of daughter drops for dispersions (empty symbols) and correspon· ding suspension polymerisation (full symbols) with different MMA hold ups.
~0.04
} ~
~
·~0.02
"" ~ " ~ 8 ~O.OO
~0.04
} ~
~ ·~O.O2
"" ~ $ " 8 ~O.OO
~0.02
} ~
~ le om " "" ~ $ " 8 ~O.OO
</Id = 0.05 ••••• '1 min -"-20min ---120min
a 1 min \ 0 20min . • final \ oOil .... .. e .... " g,~,.
Q.a.\ oa-"6 .... 0 ' ..
0 50 100 150 diameter (JUIl)
</Id = 0.20 •••••• 0.5 min -"-40min -120min
D 0.5 min
° 40min final
0 50 100 150 200 250 diameter (JUIl)
</Id = 0.40 .... "0.5min -"-25min ---120min
! \ D 0.5 min , . . 25min . ~- . final , . ' . : ~ofI,
'Lq~"" '" ! . 'od" A. ~ \ ."co
0 ..... ''':a''': <0 " "
0 100 200 300 400 500 600 diameter (JUIl)
Figure 3.6.13 Comparison of time evolution of DSDfPSD in polymerisation systems and in the corresponding dispersions with different MMA hold ups. Graphs with symbols represent the polymerisation.
o 0.1 0.2 (J. 0.3 0.4 0.5
Figure 3.6.12 Variations of final and steady-state D 32 in suspension polymerisations and steady·state D 32 in some of the corresponding dispersions with MMA hold up ("ss" stands for "steady-state").
151

CHAP1ER THREE EXPERIMENTAL RESULTS AND DISCUSSION
DroplParticle Size Distribution: Figure 3.6.13 compares the evolution of particle/drop
size distribution for Ih values of 0.05, 0.20, and 0.40 in the two processes. The match
between the data from the two processes is quite close in the initial stages. As reaction
proceeds, the distance between distribution of drops and particles at a fixed time grows.
For higher I/Jd values, the difference escalates as the reaction proceeds to the gel effect
region because of the instability caused by frequent collisions of polymerising drops.
For lower values of I/Jd, the difference freezes because of relative stability of the
polymerising drops due to more coverage by the stabiliser and also because of less
frequent collision.
3.6.4 CONCLUSIONS
The main conclusions are:
• The final size of drops/particles increased with I/Jd.
• From the variation of the Sauter mean diameter with I/Jd in the dispersion
process, it can be stated that the size of drops is determined by a dynamic
equilibrium between drop break up and coalescence. This implies that
coalescence occurs in the system under study.
• Changes in the growth stage were more drastic with increasing monomer hold
up (at a constant stabiliser concentration in water phase) due to an increased
coalescence efficiency and rate of drop encounters leading to higher rate of
coalescence.
• The monomer partitioning can affect the kinetics of polymerisation particularly
at Iow values of mono mer hold up.
• The boundaries of the so-called quasi-steady state, in terms of time and
conversion, vary with monomer hold up. Except for the Iow values of I/Jd, where
the monomer solubility in the water phase significantly affects the kinetics of
the polymerisation, the balance between drop break up and coalescence was
maintained longer in terms of conversion with decreasing I/Jd.
• The difference between the final size average and distribution of drops/particles
from dispersion and suspension polymerisation is the least when a Iow monomer
hold up is used.
152

~--------------------------------------------------------------------- - -
CHAPTER FOUR MATHEMATICAL MODELLING
CHAPTER FOUR
MATHEMATICAL MODELLING
INTRODUCTION
In a suspension polymerisation reactor the evolution of particle size distribution is the
result of interactions of the mixing conditions and the kinetics of the polymerisation
reactions that lead to the viscosity build up in the polymerising drops. Therefore,
mathematical modelling of particle size distribution in suspension polymerisation
processes should account for both the mixing parameters and the kinetic and rheological
behaviour of the system.
Mathematical modelling of the kinetics of polymerisation reactions has been more
understood and investigated in comparison with that of mixing phenomena such as drop
break up and coalescence and their relation with viscoelastic properties of drops, non
homogenous flow and with the rate of energy dissipation in the reactor. In this regard
modelling of non-homogeneous turbulent flow has become the most challenging aspect
of modelling of suspension polymerisation reactors in the recent years. Compartment
mixing models and complex CFD simulations have been used to model the
nonhomogeneity of the system (Vivaldo-Lima et al., 1998; Alopaeus et al., 1999;
Maggioris et al., 1998 and 2000). For a literature review on modelling of suspension
polymerisations see part 3.1, chapter 1.
The model developed in this research consists of two main parts; the kinetic model and
the population balance model. The kinetic model predicts the time evolution of
conversion and the polymer average molecular weights using the method of moments.
The viscosity and the elasticity of the monomer/polymer mixture are predicted using the
appropriate correlations. The population balance model assumes, at the first step, a
homogeneous environment for simplicity and predicts the drop/particle size distribution
and average particle size. The rates of drop break up and coalescence are predicted
153
---------------------------------------- - ---- - -- - ----~

CHAP'IER FOUR MATHEMATICAL MODELLING
using the model presented by Alvarez et al. (1994), which considers the viscoelastic
properties of the monomer/polymer mixture assuming a Maxwell body-type fluid.
Other parts of the model include prediction of monomer concentration in the aqueous
phase using the Flory-Huggins theory, and the stabiliser partitioning between the
aqueous phase and the water/drop interface using Langmuir-type interfacial adsorption
forPVA.
In this chapter the different parts of the model are presented first and then the numerical
solutions are discussed. The model predictions will be tested against experimental data.
4.1 POPULATION BALANCE MODELLING (PBM)
In the developed model the evaluation of drop volume distribution has been carried out
by numerical solution of the population balance equation for dispersed drops, which is
an integro-differential equation. The population balance equation may be given in terms
of drop volume (see Equation 1.3.16). It is more desirable, however, to write this
equation in terms of drop diameter using dv=(llf2)(61Ji)213V2i3d(dv):
dF(dv,t) = (1C 1 2)(61 1C)2!3 V 2/3 d"j'b(v')p(V', v)u(v')F(dv" t)d(dv') dt d,
2/3 dvI2 I I
- b(v)F(dv,t) + v f c(v - v, v )F(dv_v·,t)F(dv.,t)d(dv') (4.1.1) dVm1n
dvrnax-v
-F(dv,t) fc(v,v')F(dv·,t)d(dv') dVrnin
fJ(v',v), the daughter drop volume distribution, can be assumed approximately by a
normal distribution about a mean value v since it is the combined result of a large
number of independent random events (see equation 1.3.17):
fJ(v', v) = 1/(1T .J2;) exp{ -(v - V)2 /(21T;)) V
( 4.1.2)
154
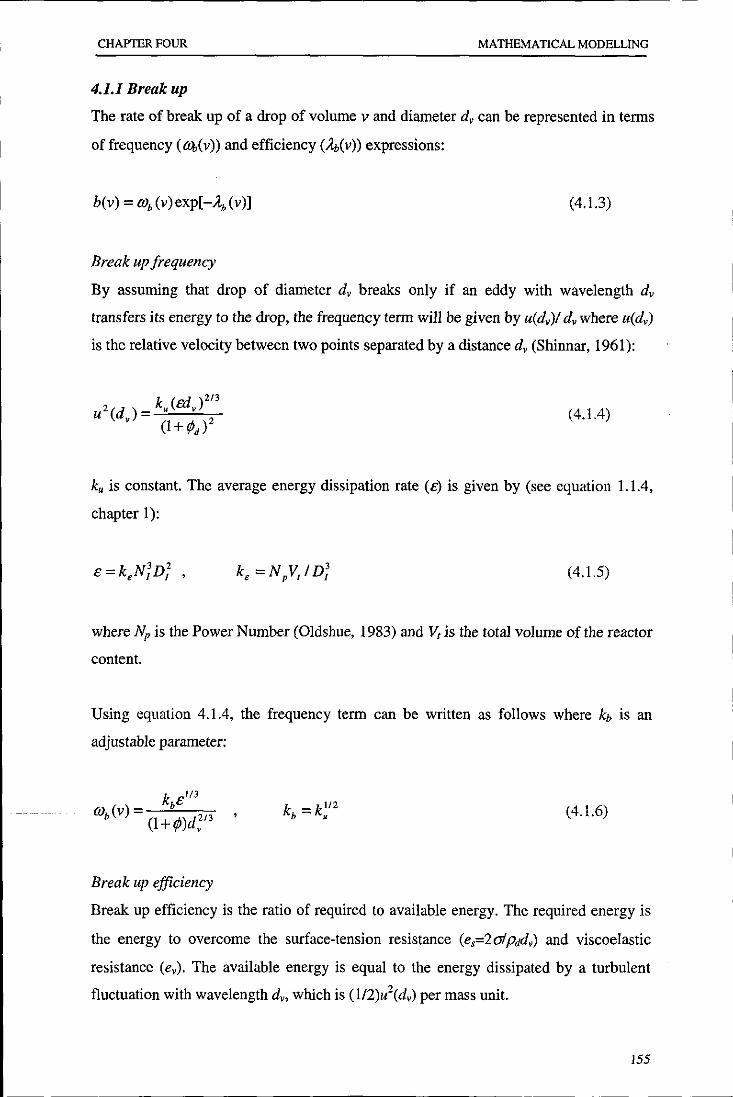
CHAPTER FOUR MATHEMATICAL MODELLING
4.1.1 Break up
The rate of break up of a drop of volume v and diameter dv can be represented in terms
offrequency (£!.l,(v» and efficiency (~(v)) expressions:
(4.1.3)
Break up frequency
By assuming that drop of diameter dv breaks only if an eddy with wavelength dv
transfers its energy to the drop, the frequency term will be given by u(dv)/ dv where u(dv)
is the relative velocity between two points separated by a distance dv (Shinnar, 1961):
(4.1.4)
ku is constant. The average energy dissipation rate (c) is given by (see equation 1.1.4,
chapter I):
(4.1.5)
where Np is the Power Number (Oldshue, 1983) and V, is the total volume of the reactor
content.
Using equation 4.1.4, the frequency term can be written as follows where kb is an
adjustable parameter:
(4.1.6)
Break up efficiency
Break up efficiency is the ratio of required to available energy. The required energy is
the energy to overcome the surface-tension resistance (e,=2afpddv) and viscoelastic
resistance (ev). The available energy is equal to the energy dissipated by a turbulent
fluctuation with wavelength dv, which is (1I2)u2(dv) per mass unit.
155

CHAPTER FOUR MATHEMATICAL MODELLING
To calculate ev, a Maxwell body-type, unidirectional fluid is considered initially at rest
and then subjected to a pressure drop (-e",Pd) during a fluctuation period dju(dv). By
calculating the required energy, ev, to displace the fluid as much as dv within one
fluctuation time, the break up efficiency can be obtained using the following equation
(Alvarez et al., 1994):
(4.1.7a)
(4.1.7b)
where ab is an adjustable parameter, Re(dv) and Weedy) are the Reynolds and Weber
numbers for a drop of diameter dv, and V,Cdv) is a dimensionless function that accounts
for elasticity:
V,(d,)=eexp[ I-a l I
2Yo Re(d,)~-12
(4.l.8a)
C4.J.8b)
e= 0 I+a exp (4.l.Sc) y. [ (I-a)2 ( I-a )~ a(l-a) I +a 2Yo Re(d,) ~
Ed and Vd are Young's elasticity modulus and the kinematic viscosity of the dispersed
phase (Vd = fld / P d)' respectively. Ed may be considered as a linear function of
polymer-monomer conversion (x),
(4.1.9)
where Ep is Young's elasticity modulus of pure polymer.
156

CHAP'IER FOUR MATHEMATICAL MODELLING
4.1.2 Satellite Droplets
In order to predict the formation of satellite droplets we may use the correlation
presented by Chatzi and Kiparissides (1992) that considers break up of a mother drop to
a few daughter drops (Nd) and a number of smaller satellite droplets (N,) with a volume
ratio of daughter to satellite drops of Xd,. The number of drops with volume v,
/1(v',v)u(v') (see equation 4.1.1), formed by break up of a drop of volume v', is:
r N d/1(v',v) + N,/1(v',Xd,v),
/1(v', v)u(v') = 1 N d/1(V', v),
IlO,
r v~v'/(NdXd' +N,)
if lv'/(Ndxd' +N,)<v~v'/[Nd +(N,lxd,)]
Ilv>v'/[Nd +(N,lxds)]
(4.1.10)
The values of N, and Xd, can be considered to depend linearly on the mother drop
volume (vm), with slopes SN, and S" respectively:
(4.1.11)
The above model has been successfully used to predict the drop size distribution for a
system of n-butyl chloride in water in the presence of PV A as the suspending agent
(Chatzi and Kiparissides, 1992).
4.1.3 Coalescence
Similar to the rate of drop break up, the rate of drop coalescence can be expressed in
terms of collision frequency (m,(v,u» and coalescence efficiency (A,,(v,u»:
c(v,u) = OJ,(v,u)exp[-A, (v,u)] (4.1.12)
Collision frequency
We used the following equation for collision frequency of drops with diameters dv and
du, m,(dv,du), where kc is an adjustable parameter:
157

CHAPTER FOUR MATHEMATICAL MODELLING
1/3
w(d d )=k _e_(d2+d2)~(d2/3+d2/3) c v' U c l+fjJd v U v u
(4.1.13)
Coalescence efficiency
For the coalescence efficiency term (A,,) we used the model presented by Alvarez et al.
(1994) considering only two efficiency terms, the deformation efficiency (A"d) and the
film drainage efficiency (Ag); A" = A"d + Ag. In order to calculate the deformation
efficiency for drop coalescence it is possible to use the same equations used for break
up efficiency with a simple modification.
When two drops collide, the smaller one has a larger energy content and it undergoes a
larger deformation (Ivanov et aI., 1985). To account for this fact, a mean length for
deformation (dvu) in coalescence interpenetration can be defined as:
(4.1.14)
Now we can assume that (i) the energy content available for coalescence is (1I2)u2(dvu),
and (ii) the energy required to overcome the viscoelasticity and surface-tension
resistance is the energy required by a drop of diameter dvu to reach a mean deformation
of dvu within a time period dviu(dvu). Using these assumptions the ratio of required to
available energy for coalescence efficiency (Aed) is obtained by replacing dv by dvu in
equation 4.1.7. With this approach we can use equations 4.1.7 and 4.1.8 to calculate Aed:
(4.1.15)
ae is an adjustable parameter.
To calculate the film drainage efficiency (A"d), first consider two drops that approach
together. On the verge of coalescence, an unstable film of water is formed with critical
tickness he and diameter dvu (Ivanov et aI., 1985). Then the film breaks and its water is
drained by capillary pressure (20'J1he). By assuming that the film drainage is fast in
comparison with the dynamics of the coalescence process, the capillary pressure over
the disc volume (mivuhJ4) yields the following energy for film drainage (ed):
158

CHAPTER FOUR MATHEMATICAL MODELLING
(4.1.16)
where O'd is the effective surface tension and, according to Koshy et al. (l988a), can be
considered as the difference between the actual and the full coverage value, O'd = kJ 1- B)
(see equation 4.3.3).
With dividing the drainage energy (equation 4.1.16) by the energy which is available
for coalescence, (1I2)u2(dvu)Pd, we have:
A,t (v) = b, /Wed (d t)
Wed (dt ) = Pwd f v 2 (d f )/O'd
(4.1.17)
(4.1.18)
WedC dj ) is the film drainage Weber number and dj is a characteristic drainage length.
Considering equations 4.1.15 and 4.1.17 the overall coalescence efficiency will be:
4.1.4 Number of Particles and Mean Particle Size
The total number of drops/particles is given by:
~
N, = jF(dv,t)d(dv) o
(4.1.19)
(4.1.20)
The Sauter mean diameter (d32) and the interfacial area per water volume unit (a) can be
calculated by the following equations:
~
jd;F(dv,t)d(dv) o (4.1.21) ~
jd;F(dv,t)d(dv) o
159

CHAPTER FOUR MATHEMATICAL MODELLING
(4.1.22)
4.2 MODELLING OF FREE-RADICAL POLYMERISATION
4.2.1 Kinetics
The basic chemical reactions occurring in a free-radical polymerisation have been
schematically presented in chapter 1 (see equations 1.2.1 to 1.2.4). One of the most
important mathematical techniques for prediction of the kinetics of free-radical
polymerisation reactions is based on the method of moments. We used this method to
model the kinetics of suspension polymerisation reactions in which each polymerising
drop can be assumed to be a miniature bulk reactor.
The moments of free radicals (A) and dead-polymer molecules (/1) are defined as:
Ai = Ini[Rn] (4.2.1) n=1
00
Ili = :Lni[Pn ] (4.2.2) If=i
where i denotes the degree of the moment. [Rn] and [P.] are the concentrations of
growing free radicals and dead polymer chains with n monomer units, respectively.
Note that ~ is the total free-radical concentration, j.Io is the total concentration of
polymer, and ,1,1 + 111 is the number of moles of monomer which has reacted. To obtain
the moments equations first we have to know the mass balances for free radicals and
dead polymers using the mechanism of free-radical polymerisation (equations 1.2.1-
1.2.4):
1 d([RolV)
V dt
. 2fkd [1]- k,[Ro ][M] = 0 (4.2.3)
1 d([RdV)
V dt
. 2fkN]- k, [RdA" + (k [[M] + k,[S])A" (4.2.4)
160

CHAPTER FOUR MATHEMATICAL MODELLING
o
~ d([~;]V) kp[M{[Rn-d-[Rn] f,AoA, -k,[Rn]Ao -(kf[M]+k,[S])[Rn]
(4.2.5)
(4.2.6)
By mUltiplying both sides of the above equations by nO (for zeroth moment). n1 (for first
moment). or n2 (for second moment) and summing them over n (n=! to 00). one can
obtain the differential equations for moments of free radicals and dead polymers. So the
zeroth. first and second moments of free radicals (Ao. A!, Az) and dead polymers (jlo. if].
J.l2) are obtained as follows:
1 d(AoV) = 2jk [I]-k 12 V dt d ,"'0
1 d(A,V) ;2jkd[I]-k,AoA, + (k,[S]+kp[M])(Ao -A,)+kf[M]Ao V dt
1 d(A,V) =2jkd[l]-k,AoA, +k,[S](Ao -..1,,) V dt
1 d(J.loV) =(k +.!.k )12 +(k [M]+k [S])l V dt d 2""'0 f ,'''0
1 d(J.l2V ) =k 1 1 +k 12+(k [M]+k [S])l V dt ,'''0'''2 ,,'~ f ,'''2
(4.2.7)
(4.2.8)
(4.2.9)
(4.2.10)
(4.2.11)
(4.2.12)
The rate of polymerisation (equation 1.2.6) can be rewritten in terms of the zeroth
moment of free radicals:
(4.2.13)
161

CHAP'IER FOUR MATHEMATICAL MODELLING
4.2.2 Polymer Molecular Weights
In the method of moments cumulative number-average (M.) and weight-average (Mw)
molecular weights of polymer at anytime of polymerisation can be calculated by
following expressions where Mm is the molecular weight of monomer.
(4.2.14)
4.2.3 Diffusion-Controlled Propagation and Termination
In order to predict the variations of kt and kp during the gel and glass effects,
respectively, we used the following correlations which were originally proposed by
Chiu et al. (1983) and modified later (BaiIlagou and Soong, 1985b):
(4.2.15)
(4.2.16)
(4.2.17)
k. = [l)oA. exp(-E. IRT), t t t
k. = A. exp(-E. I RT) p p p
(4.2.18)
kpo and ktO are the values of kt and kp at zero conversion, respectively. aE is a
temperature-dependent parameter and bE is a constant. A and E in equation 4.2.18 are
the constant and activation energy for the Arrhenius equation, respectively. A decrease
in kp and kt starts from the beginning of the reaction but is accelerated at medium and
high conversion, respectively. In this model the polymer content (~) is the main
determining factor in the prediction of the onset of the gel and glass effects. As is seen
the gel effect depends on the initial initiator concentration ([1)0) as well as polymer
concentration.
162

CHAPTER FOUR MATHEMATICAL MODELLING
4.2.4 Rheological Properties
The viscosity variation of polymer-monomer solution during the polymerisation of
MMA is calculated using the following correlation (Baillagou and Soong, 1985b):
f.ld = f.lm + 2C~4 exp(O.8/Vj ) if
(4.2.19)
if cp >O.16
where Pm and J1d are the viscosity of pure MMA and PMMA-MMA solution,
respectively. Vfis the free volume ofthe solution and cp is the polymer concentration.
4.3 MODELLING OF STABILISER PARTITIONING
Using Langmuir-type interfacial adsorption (Adamson, 1976) for PVA molecules as the
suspending agent, the partitioning of PV A molecules and its effect on interfacial tension
and drop surface coverage can be calculated by the following equations:
C, = c,a +alk~ (4.3.1)
(J (4.3.2)
(4.3.3)
where a is the interfacial area per water volume unit, Cs and Csa are the total and aqueous
phase concentrations of the suspending agent, respectively, (J is the surface coverage,
and C~ is the concentration of the suspending agent at B=1.
4.4 MODELLING OF MONOMER PARTITIONING
In the suspension polymerisation of MMA, with a considerable water solubility of 1.5
wt% at 25°C, interphase mass transfer may be important, especially when a low
monomer hold up is used. Kalfas and Ray (1993) proposed a kinetic model considering
163
1 ____________________________________________________________________ _

-- - - - - --------------- --------------- - - - -
CHAPTER FOUR MATHEMATICAL MODELLING
the monomer transport from the aqueous phase to the polymerising drops in suspension
polymerisation of partially water-soluble monomers (Kalfas et aI., 1993; Zhang and
Ray, 1997).
It can be easily shown that the aqueous phase becomes saturated with dissolved
monomer during the dispersion of the monomer and before the polymerisation reaction
can progress much. As the polymerisation begins in the monomer drops, the monomer
concentration in the drops decreases from the equilibrium value (with respect to the
dissolved monomer in the aqueous phase) forcing transfer of mono mer molecules from
the aqueous phase to the drops. The rate of monomer transport between two phases can
be defined as follows:
(4.3.4)
where Wm,.is the weight of dissolved monomer in the aqueous phase. c~,dand Cm,dare
mole concentrations of dissolved monomer in the aqueous phase in equilibrium and
non-equilibrium conditions, respectively. km is the overall mass transfer coefficient of
monomer from the aqueous phase to the drops and Mm is the monomer molecular
weight.
The eqUilibrium concentrations are calculated based on the Flory-Huggins theory of
polymer solutions and the modifications by Ugelstad et al. (1980). The free energy of
mixing in the two phases is given below:
a) Dispersed phase (drops) containing monomer and polymer
(4.3.5)
b) Aqueous phase containing water and dissolved monomer
(4.3,6)
where 1:J.Gm is the difference in Gibbs free energy, Rand T are the gas constant and
temperature, respectively, and IP"j is the volume fraction of species i in phase j. m'j is
164

CHAPTER FOUR MATHEMATICAL MODELLING
the ratio of the molar volumes of species i and j and Z ij is solubility interaction
parameter of species i and j. The last term in equation 4.3.5, which accounts for the
interfacial tension energy, may be neglected for drops of the size encountered in
suspension polymerisation.
The equilibrium concentrations can be obtained by equating the right-hand sides of
equations 4.3.5 and 4.3.6.
Two different monomer conversions can be defined here. The first one is the monomer
conversion in drops (Xd):
(4.3.7)
where Wp is the polymer weight and Wm,d is the weight of monomer in drops but the
overall monomer conversion, including the monomer dissolved in the aqueous phase,
is:
(4.3.8)
The monomer mass balance is:
(4.3.9)
where Wmo is the total weight of initial monomer.
4.5 NUMERICAL SOLUTION OF THE MODEL
4.5.1 Kinetics of Polymerisation
The set of differential equations for free-radical and dead-polymer moments (equations
4.2.7 to 4.2.12) together with the rate of initiator and monomer consumption (equations
1.2.5 and 1.2.6) have been solved by a Runge-Kutta 4th order method.
165

CHAPTER FOUR MATHEMATICAL MODELLING
4.5.2 Aqueous-phase Monomer Concentration
Thenuodynamic equilibrium concentrations of monomer in the dispersed phase and the
aqueous phase were obtained by equalising the right hand sides of equations 4.3.5 and
4.3.6. A simple trial and error method was used to calculate the equilibrium monomer
concentrations starting with a guess for an initial value for 9m.d until a full agreement
between the guessed value and predicted value was obtained. The method converged
within a few iterations.
4.5.3 Population Balance Equation (PBE)
The population balance equation (equation 4.1.1) was solved numerically for F(dv>t).
The integro-differential PBE was transformed into a system of differential equations by
discretising the range of drop diameters according to the method of classes (Chatzi and
Kiparissides, 1992). Thus, the size range was divided into a number of equally-spaced
intervals. Up to 100 equally-spaced discretisation points were used for the numerical
integration.
A Runge-Kutta 4th order method was used for solving the differential equations over the
time. The integral tenus in the PBE were approximated using a composite Simpson's
rule. For an even number of intervals Simpson' s 1/3 rule was applied, while for an odd
number of intervals Simpson's 3/8 rule was employed.
4.6 MODEL IMPLEMENETATION
Figure 4.1 illustrates the flow diagram of the model. The model may be used for both
reacting and non-reacting dispersions. The kinetic model is used simultaneously with
the PBM model when a reacting system (polymerisation) is being studied otherwise
only the PBM model is used for non-reacting systems.
166

CHAPTER FOUR
1---------------------------, I I I I I I I I I I I I I
Kinetic model
~---------------------------~
I I I I I I I I I I I I I I I I
MATHEMATICAL MODELLING
--------------------------------~ Dispersion model
1 _________________________________ 1
Figure 4.1 Flow diagram of the model.
4.7 MODEL VALIDATION
The validity of the developed model was checked by reproducing the modelling results
presented in the paper of Alvarez et al. (1994). They fited their modelling results to
Konno's experimental results on the suspension polymerisation of styrene in the
presence of PV A as the suspending agent at 70°C using azobis-isobutyronitrile (AmN)
as the initiator (Konno et aI., 1982).
167
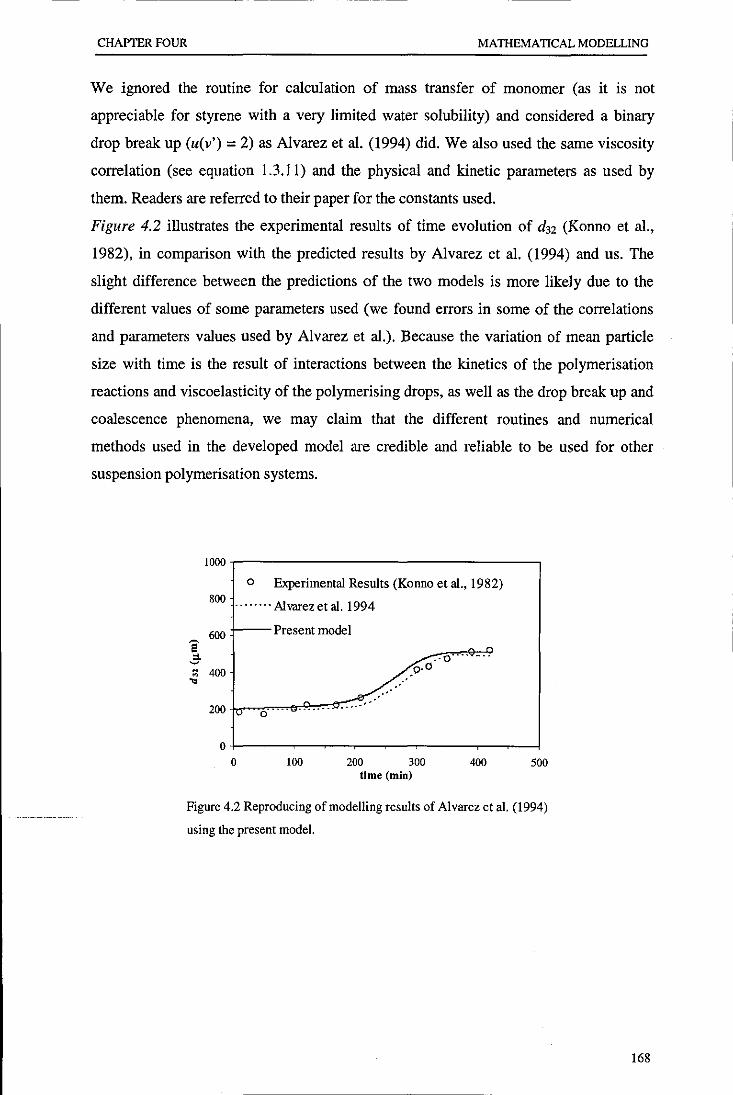
CHAPTER FOUR MATHEMATICAL MODELLING
We ignored the routine for calculation of mass transfer of monomer (as it is not
appreciable for styrene with a very limited water solubility) and considered a binary
drop break up (u(v') = 2) as Alvarez et al. (1994) did. We also used the same viscosity
correlation (see equation /.3.11) and the physical and kinetic parameters as used by
them. Readers are referred to their paper for the constants used.
Figure 4.2 illustrates the experimental results of time evolution of d32 (Konno et al.,
1982), in comparison with the predicted results by Alvarez et al. (1994) and us. The
slight difference between the predictions of the two models is more likely due to the
different values of some parameters used (we found errors in some of the correlations
and parameters values used by Alvarez et al.). Because the variation of mean particle
size with time is the result of interactions between the kinetics of the polymerisation
reactions and viscoelasticity of the polymerising drops, as well as the drop break up and
coalescence phenomena, we may claim that the different routines and numerical
methods used in the developed model are credible and reliable to be used for other
suspension polymerisation systems.
1000 -r-------------------, o Experimental Results (Konno et al., 1982)
e .:
800 ........ Alvarez et al. 1994
600 t--Present model
" 400 .;;
I~~~~~~~. " 200 -Iv 0····· .....
o 100 200
.'
300 time (min)
400 500
Figure 4.2 Reproducing of modelling results of Alvarez et al. (1994)
using the present model.
168

CHAPTER FOUR MATHEMATICAL MODELLING
4.8 APPLICATION OF THE MODEL
4.8.1 Numerical Parameters
Kinetic and Thermodynamic Parameters
The values and expressions used for the physical, kinetic and thermodynamic
parameters and constants used for the suspension polymerisation of MMA have been
collected in Table 4.2.
Table 4.2 Physical, kinetic and thermodynamic parameters used for modelling of MMA freeI I .. radica. polymensatlOn.
Parameter ValuelExpression Reference Mm (glgmol) 100 Brandrup et al. (1999)
Pm (glcm3) 0.968-0.001225T Brandrup et al. (1999)
Pp (glcm3) 1.20 Brandrup et al. (1999)
CI\n , Gp (1rC) 0.001 ,0.00048 Brandrup et ai. (1999)
Tgm , Tgp COc) -106, 114 Brandrup et al. (1999)
f1m (cp) exp(2.303x (0.1151V ... -1» t BaiIIagou and Soong (1985b)
kd (l/sec) 2.083xlO12exp(-145801I) j Brandrup et al. (1999)
kpo (Umol.sec) 4.92xlO'exp(-218911) BaiIIagou and Soong (1985b) k,o (Umol.sec) 9.8x10⁷exp(-35311) BaiIIagou and Soong (1985b)
klj> (l/sec) 3.0233x1 013exp( -1.17x1 0' IRI) Baillagou and Soong (1985b)
K(Jt (l/sec) 1.454X10²°exp( -1.458xlO' IRI) BaiIIagou and Soong (1985b)
aE 0.168-8.21x1 0·6(T_ Tgp)2 BaiIIagou and Soong (1985b)
bE 0.03 Baillagou and Soong (1985b) C,(=kjkpo) 8.93x10⁴ exp( -112711) Baillagou and Soong (1985b) C,(=k/kpo) 0.54 Jahanzad et al. (1993)
Zmw,.%mp 4.05,1.08 Forcada and Asua (1990)
mmWJ mmp 0.87,0.5 Forcada and Asua (1990)
km 1.0 Zhang and Ray (1997) S,q (wt%) 1.6 (at 70°C) KaIfas and Ray (1993)
Np (eq. 4.1.5) 5 Oldshue (1983) Ep (glcm.sec") 3.2xlOlO Ferry (1980)
t \'tm = 0.025 + CI\n (T - Tgm) j The Arrhenius equation was derived using the given values for LPO's half lives at different temperatures in Brandrup et al. (1999).
Parameters Obtained Experimentally
Interfacial tensions between MMA and different PV A solutions were determined
experimentally. The method and the procedure are explained in Appendix C and the
results have been presented in the form of a graph in section 3.1. The values of er are
169

CHAPTER FOUR MATHEMATICAL MODELLING
shown in Table 4.3. These experimental values were used to find the adsorption
parameters in equation 4.1.19. The fitted values for ka and k" are in good agreement
with the values found by Lazrak et al. (1998) for the same system (1.5xI04 and 10.4 for
ka and k", respectively).
The measurements were carried out at 25°C but the measured interfacial tensions were
used in the model for simulation of the dispersions and suspension polymerisations at
the base temperature of this study (70°C). No correlation was used for temperature
dependence of interfacial tension. This has been left for future work.
Adjustable Parameters
Table 4.3 Interfacial tensions measured for MMA and different aqueous PVA solutions (at 25°C) and h f d d . t e ltte a sorptIOn parameters.
PVA (gll) O'(dyn/cm} 0.0 (0'0 =) 15.01
0.25 6.05 0.5 4.12 1.0 3.15 2.0 2.50 4.0 2.35 10.0 2.13
ka (cm3/g) I.OXIO' K,,(dyn/cm) 13
c~ (glcm2) IxlO-6t
t Estimated from data reported by Van Den Boomgaard et al. (1978).
There are totally five adjustable parameter in drop break up and coalescence models
used in the present model.
The parameter kb in the break up frequency model, given in equation 4.1.6, determines
the rate of eddy-drop collisions leading to the drop break up. With increasing kb the
frequency of break up increases. The parameter ab in equation 4.1.7 indicates the
efficiency of drop break up. The higher the values of ab, the lower the required energy
for drop deformation leading to a higher probability for drop break up.
The parameter kc in equation 4.1.I3 determines the frequency of drop-drop collision.
The collision frequency increases with kc. The parameters a c and be in equation 4.1.19
indicate the importance of coalescence efficiency. A higher ac and lower be result in a
170

-------------- ------------------
CHAPTER FOUR MATHEMATICAL MODELLING
higher coalescence efficiency due to lower required energy for drop deformation and
film drainage processes.
We did not use the satellite formation module for the present study because of
ambiguities involved in the direct application of existing models to dispersions with a
high viscosity dispersed phase, which may require more elaboration.
In order to estimate the values of the adjustable parameters for suspension
polymerisation of MMA, we applied the model to d32-time experimental data of an
inviscid non-reacting MMNwater dispersion (9.-0.05) and found the estimated values
for break-up adjustable parameters that give the best fit to the experimental data. Then
using these values for a higher dispersed phase hold up (9a-0.20), the coalescence
adjustable values were estimated as well. The adjustable parameters and their fitted
values are given in Table 4.4. The fitted values of the adjustable parameters were used,
without any alteration, for the modelling of suspension polymerisation of MMA. No
optirnisation was carried out on parameter fitting due to lack of time. It is obvious that
application of an optirnisation method on the fitting of a large number of experimental
results, which may include the suspension polymerisation runs as well, could
substantially improve the accuracy of predictions. However, this will be pursued in the
future.
Table 4.4 Comparison of the numerical values for break up and coalescence adjustable b'dbd"f£' . parameters 0 tame )v 1 erent mvestlgators.
Adjustable Alvarez et al. Maggioris et al. This work parameter (1994) (2000) kb (cmJtg) 0.73 30 0.5
ab 0.112 14.5 0.03 kc (ItcmJ) 1.37xlO-' 7xlO-'l Ix 10-1
ae 2.62xlO-J 1 Ix 10-'
be 3.07 2 3
Table 4.4 also compares the numerical values of the five adjustable parameters obtained
by Alvarez et al. (1994), for the suspension polymerisation of styrene, with those
obtained by Maggioris et al. (2000), for the suspension polymerisation of vinyl
chloride, in the presence of PV A as the suspending agent, and those used in this work,
for the suspension polymerisation of MMA.
171

CHAPTER FOUR MATHEMATICAL MODELLING
4.8.2 Model Prediction: Kinetics o/polymerisation
Figure 4.3 compares the experimental conversion-time data with the theoretical results
for the suspension polymerisation of MMA at the base conditions (70°C, NI = 500 rpm,
tPd = 0.2, LPO = 1 wt%, PV A = 1 gIl). The value of initiator efficiency was adjusted at/
= 0.37 to give the best fit to the experimental data. The agreement between the
experimental data and model predictions is good. In the following sections, we evaluate
the effects of variations of some of the important variables on the kinetics of MMA
suspension polymerisation.
1
0.8
= .9 0.6 '" .. " is 0.4 0
" 0.2
0 0 30 60 90
time (min)
Figure 4.3 Comparison of experimental (symbol) and predicted
(line) conversion-time for suspension polymerisation ofMMA.
Initiator concentration
120
Figure 4.4 compares the experimental and theoretical results for conversion-time
variations in the suspension polymerisation of MMA (70°C, NI = 500 rpm, 9d = 0.2,
PV A = 1 gIl) with different LPO concentrations. The fit for the lowest LPO
concentration used in this research is not as good as those with the highest LPO
concentrations. The probable reason might be due to the dissolution of LPO in the water
phase, which appears to be more important when the overall concentration of LPO is
low.
Reaction temperature
Figure 4.5 compares the experimental and theoretical results for conversion-time
variations in the suspension polymerisation of MMA (NI = 300 rpm, tPd = 0.2, LPO = 1
172
-------

CHAPTER FOUR MATHEMATICAL MODELLING
wt%, PVA = I gIl) at different temperatures. Good agreements are observed between
the experimental and the theoretical results.
1
0.8
= .SO.6 '" ... ... ~0.4 0
" 0.2
0
0
o
50time (miD)1 00
o o
LPO(wt%)
00.25 t.1.0 04.0
ISO 200
Figure 4.4 Experimental (symbol) and theoretical (line) conversion
time for suspension polymerisation of MMA with different LPO
concentrations.
1.-----=::--------------,
0.8
= .SO.6 ~ ~ §0.4
" 0.2
l). SOC
<> 60 C o 70C
~~~~~~=__r~_.--~,_~_:O~8~0~C~ 0-,'1
o 50 lOO 150 200 250 300 350 time (miD)
Figure 4.5 Experimental (symbols) and theoretical (lines) conversion
time for suspension polymerisation of MMA at different temperatures.
Monomer hold up
Figure 4.6 compares the experimental and theoretical results for the conversion-time
data obtained for the suspension polymerisation of MMA (70°C, NI = 300 rpm, LPO = I
wt%, PV A = I gIl) with t(Jd = 0.025 and 0.20. The effect of water solubility of MMA is
quite significant for the lower monomer hold up. An advanced gel effect and a lower
final conversion are the results of relatively high solubility of MMA in the aqueous
phase. The model can predict these effects rather well.
173

CHAPTER FOUR MATHEMATICAL MODELLING
1.0 ~---------------~
0.8
= .9°·6 ~ .. ;0.4 ...
0.2
°
</>d
00.025 A 0.20
30time (min)60 90
o
120
Figure 4.6 Experimental (symbols) and theoretical (lines) conversion
time for suspension polymerisation of MMA with different monomer
hold ups.
Monomer concentration in aqueous-phase
Figure 4.7 compares the experimental and theoretical conversion-time for the
suspension polymerisation of MM A with l/Jd= 0.10 (70°C, NI= 300 rpm, LPO = 1 wt%,
PV A = 1 g/l). The experimental and theoretical results for the variations in the MMA
concentration in the water phase for this experiment have been compared in Figure 4.8.
A good agreement is observed between the experimental data and the model
predictions.
1.0
0.8 00
= 0 ':;;0.6 " " ~ e°.4 o
00
0.2 0
0.0
° 30time (min)60 90 120
Figure 4.7 Experimental (symbols) and theoretical (line) conversion
time for suspension polymerisation of MMA with I/Jd = 0.10.
174

CHAPTER FOUR MATHEMATICAL MODELLING
0.04 ,-----------------, a
~0.03 .. = ~S ~ " = oS 0.02 0
~ ;lO t~:---~°-o-v-O=--O-', ~~ ~ lo.01 0
o 30
<DO
60 time (min)
90 120
0.04 .----------------,
,.. 0.03 :; 0
-;~
b
'" .. ~ i 0.02 4)'_O_-'O"--.::)-<:O'-CO)_.Cl..." __ _
~ lo.OI 0
0.2 0.4 . 0.6 cODverslOn
o
0.8 I
Figure 4.8 Experimental data (symbols) and theoretical predictions
(line) of MMA concentration in the aqueous phase in suspension
polymerisation of MMA with IP. = 0.10.
175

CHAPTER FOUR MA THEMA TICAL MODELLING
4.8.3 Model prediction: drop/particle size average and distribution
4.8.3.1 Model capabilities
In this section we aim to demonstrate that the model can qualitatively predict the
characteristic behaviour of reacting and non-reacting dispersion systems. Some
examples of the model capabilities are briefly discussed here.
Figure 4.9 depicts the time evolution of d32 for the MMNwater dispersion with
different MMA solution viscosities. The MMA solution viscosity can be adjusted by
dissolving PMMA in the MMA monomer. The PMMA-MMA solution in fact forms
within polymerising drops during the polymerisation reactions. However, in Figure 4-9
attempts have been made to envisage the effect of viscosity on the drop size variation in
a non-reacting system. The characteristic intervals of dispersion, transient stage and
quasi steady state, are clearly reproduced by the model. Figure 4-9 shows that the
steady-state d32 increases significantly with viscosity. Dispersions with lower viscosity
reach the quasi steady state faster. This prediction is in agreement with the experimental
results reported in the literature (e.g., Doulah, 1975; Calabrese et al., 1986; Kumar et
aI., 1991).
200 1"-- J.l<l-1000~
150
1"- J.l<l 500llM
50 1"--- J.l<l IOOIlM
o J.l<l=~
o 20 40 60 80 100 time (min)
Figure 4.9 The time evolution of dJ2 for (MMA-PMMA)/water
dispersions with different dispersed-phase viscosities (T = 70'C,
NI = 500 rpm, rpd = 0.2, PV A = I gIl).
176

CHAP1ER FOUR MATHEMATICAL MODELLING
Figure 4.10 shows the time evolution of DSD for the MMNwater dispersion. The
initial DSDs are broad but narrow with time. Similar evolutions have been obtained in
this research and also reported by other investigators.
0.15 ~--------------~
1 180min 60min
20min
0.5 min
o 50 100 diameter (1lJII)
Figure 4.10 The time evolution of DSD for the MMNwater dispersion
(for the conditions see the caption of Figure 4.9).
Figure 4.11 demonstrates the final DSDs for the MMA-PMMNwater dispersions. The
DSDs become broader with increasing viscosity of the dispersed phase.
0.15 -y------------------,
1 ;:; ';:0.10 ~
.~
~ f /J<J = 100~ !l 0.05 ~ e ~=500 __ ~M--_ ~ ./ ~ ~= 1000~M
0.00 HL,l}.:--,...;...,.~"i=T=;:::;s;;:......._r~~~r_r_.,....,....:
o 50 100 150 200 250 diameter (~m)
Figure 4.11 Final DSDs for the (MMA-PMMA)/water dispersion with
different dispersed phase viscosities.
177

CHAPTER FOUR MATHEMATICAL MODELLING
Figure 4.12 presents the time evolution of d32 in a typical MMA suspension
polymerisation. The characteristic intervals of suspension polymerisation reactions -
transition, quasi steady state, growth, and identification stages - are reproduced by the
model as shown in this figure.
lOO ,---..,----.,--------,----,
75
25
o
I I
transi. I steady-state
lion stage
stage
growth
stage
20. (.)40 time mlD 60
identi· fication
stage
80
Figure 4.12 The characteristics intervals of the MMAlwater dispersion as
predicted by the model (T = 70°C, NI = 500 rpm, f/ld = 0.2, LPO = I wt%,
PVA = I gIl).
4.8.3.2 Non-reacting MMAlwater dispersion
Figure 4.13 illustrates the experimental results and model predictions (dashed line) for
the time variations of Sauter mean diameter for the non-reacting MMAlwater dispersion
with conditions stated in the caption of this figure. The initial DSD was assumed to be a
normal distribution with the average drop size equal to the first experimental measured
drop size (at t = 30 sec). The model predicted a very quick transition stage in
comparison with the experimental results. Mathematically, it is possible to slow down
the approach to the steady state by decreasing the ratio of the rate of drop break up over
that of drop coalescence without affecting the steady-state value of drop size. However,
this approach is not physically justified as is based on the assumption that a static
steady state is prevailing in the dispersion.
178
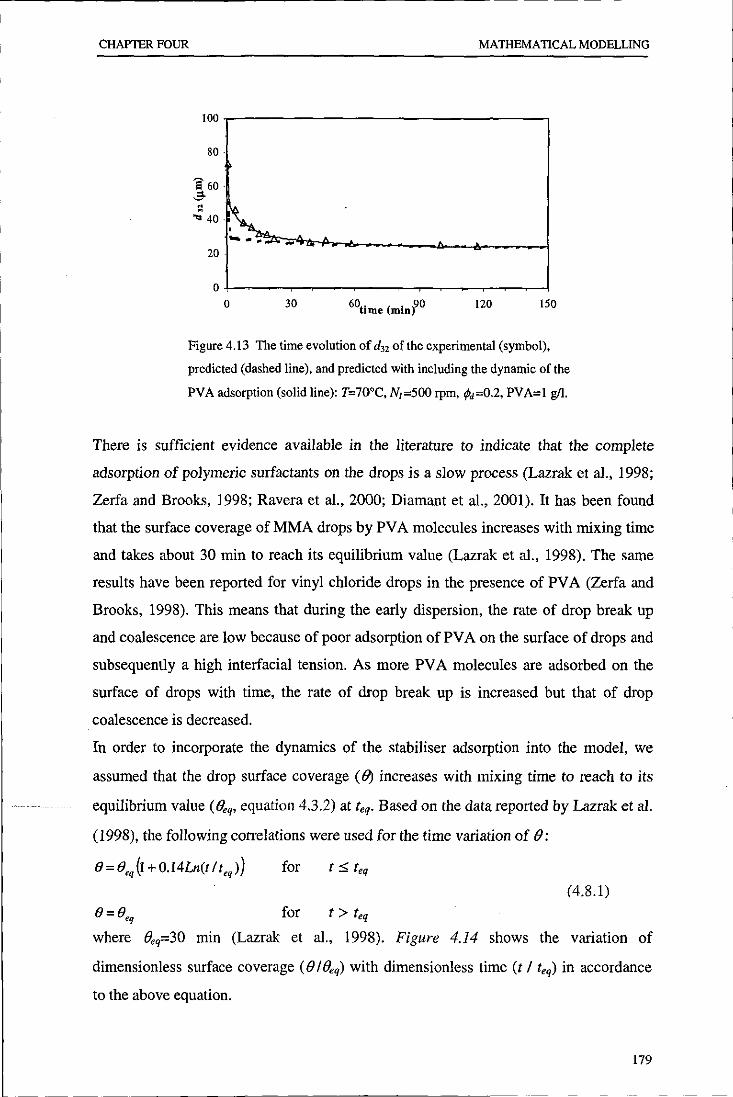
CHAPTER FOUR MATHEMATICAL MODELLING
100,------------------------------------,
N
"
80
... 40
Figure 4.13 The time evolution of d'2 of the experimental (symbol),
predicted (dashed line), and predicted with including the dynamic of the
PVA adsorption (solid line): T=70'C, NI =500 rpm, jld=0.2, PV A=l gIl.
There is sufficient evidence available in the literature to indicate that the complete
adsorption of polymeric surfactants on the drops is a slow process (Lazrak et al., 1998;
Zerfa and Brooks, 1998; Ravera et al., 2000; Diamant et al., 2001). It has been found
that the surface coverage of MMA drops by PV A molecules increases with mixing time
and takes about 30 min to reach its equilibrium value (Lazrak et al., 1998). The same
results have been reported for vinyl chloride drops in the presence of PV A (Zerfa and
Brooks, 1998). This means that during the early dispersion, the rate of drop break up
and coalescence are low because of poor adsorption of PV A on the surface of drops and
subsequently a high interfacial tension. As more PV A molecules are adsorbed on the
surface of drops with time, the rate of drop break up is increased but that of drop
coalescence is decreased.
In order to incorporate the dynamics of the stabiliser adsorption into the model, we
assumed that the drop surface coverage (B) increases with mixing time to reach to its
equilibrium value ({leq, equation 4.3.2) at teq. Based on the data reported by Lazrak et al.
(1998), the following correlations were used for the time variation of (J:
8 = 8,q (\ + O.l4Ln(1 I leq)) for t :$ teq
(4.8.1)
O=O,q for t> teq
where (Jeq=30 min (Lazrak et aI., 1998). Figure 4.14 shows the variation of
dimensionless surface coverage «(J I (}eq) with dimensionless time (t / teq) in accordance
to the above equation.
179
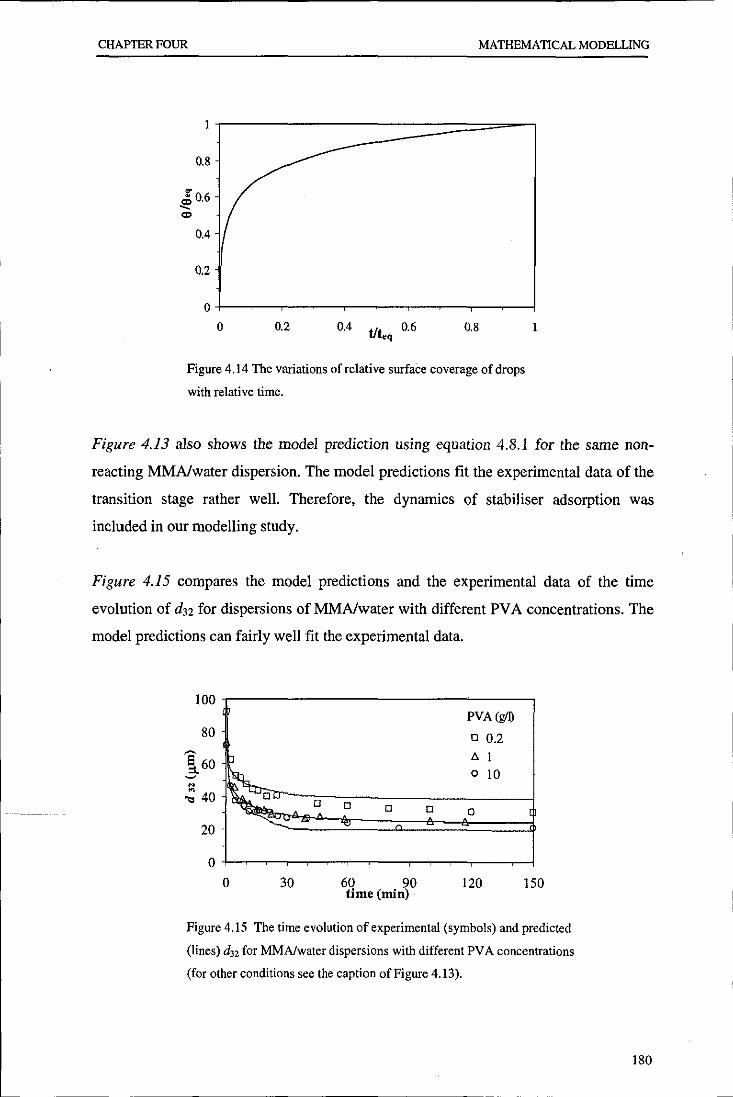
CHAPlER FOUR MATHEMATICAL MODELLING
0.8
~O.6 ..... Cl>
0.4
0.2
0
0 0.2 0.4 tlt.q
0.6 0.8
Figure 4.14 The variations of relative surface coverage of drops
with relative time.
Figure 4.13 also shows the model prediction using equation 4.8.1 for the same non
reacting MMAlwater dispersion. The model predictions fit the experimental data of the
transition stage rather well. Therefore, the dynamics of stabiliser adsorption was
included in our modelling study.
Figure 4.15 compares the model predictions and the experimental data of the time
evolution of d32 for dispersions of MMAlwater with different PV A concentrations. The
model predictions can fairly well fit the experimental data.
100 PVA (g/l)
80 o 0.2 ~ P '" 1 §. 60 ~
~u o 10
N ~
... 40 0 0 0 0 0
20 '" 0
0 30 60 90 120 150 time (min)
Figure 4.15 The time evolution of experimental (symbols) and predicted
(lines) d32 for MMNwater dispersions with different PV A concentrations
(for other conditions see the caption of Figure 4.13).
180

CHAP'IER FOUR MATHEMATICAL MODELLING
Figure 4.16 compares the predicted and experimental steady-state d32 for the
MMAlwater dispersions with different PV A concentrations.
50
40
lo~ l30 ~
~20 ... o
10
0
0 2 8 10
Figure 4.16 Comparison of the experimental (symbol) and predicted
(line) steady-state d32 with the PVA concentration.
Figure 4.17 compares the time evolution of predicted and experimental DSDs for a
typical MMAlwater dispersion run. While the average drop sizes are comparable, the
predicted distributions are sharper than the experimental. This discrepancy, however,
seems not to be a major concern as the broadness of the predicted DSDs can be adjusted
by applying a broader standard daughter drop size distribution (fJ(v',v) i.e, equation
4.1.2).
0.15 -,----------------...,
l e t> 0.10 .~
~ ... ~ 0.05 a .. :a
o 50 100 diameter (I1m)
150
Figure 4.17 Comparison of the experimental (symbol) and predicted
(line) DSDs with time (for the conditions see the caption of Figure 4.13).
181

CHAPTER FOUR MATHEMATICAL MODELLING
4.8.3.3 MMA suspension polymerisation
Figure 4.18 illustrates the time evolution of the predicted and experimental d32 for the
MMA polymerisation runs with different PVA concentrations. The model can
satisfactorily reproduce the experimental data.
300,------------------------------,
250
8' 200
5 150 ::l
." 100
PVA(g/I)
o 0.2
A I o 10
00
o o
o
50 ~~~~h~*9--e--<7--_t O+-~--.-~--,_~--,_--~_r--~~
o 20 40 60 80 100 time (min)
Figure 4.18 Time evolution of experimental (symbols) and predicted
(lines) d" for the MMA suspension polymerisations with different
PV A concentrations (T = 70°C, NJ = 500 rpm, rpd = 0.2, LPO = I wt%).
Figure 4.19 demonstrates the time evolution of predicted and experimental d32 for the
MMA polymerisation runs with different initiator (LPO) concentrations. The agreement
between the model predictions and the experimental data is acceptable, particularly for
the higher LPO concentrations. Better agreement may be obtained if the viscosity of the
polymerising drops can be better predicted. This requires a more precise conversion
molecular weight-viscosity correlation to be used.
182

CHAPTER FOUR MATHEMATICAL MODELLING
200
LPO (wt%) 0 0.25 t:. 1 o 4
150
e :100
0 0 0 N ~ ...
50
0
0 50 100 150 200 250 time (min)
Figure 4.19 Time evolution of experimental (symbols) and predicted
(lines) d" for the MMA suspension polymerisations with different LPO
concentrations (for other conditions see the caption to Figure 4.18).
Figure 4.20 demonstrates the time evolution of predicted and experimental PSDs for a
typical MMA polymerisation run. A good agreement between the model predictions
and experimental results is obtained.
0.05 ~---=-------------,
~ ..... 0.04 ... ~
» ;<::; 0.03
! ... 0.02 .l:i " e 0.01
~ 0.00 .J...=_;oAi.~~~~~~.:2.;.:~:ao;::,;;.;.;.+~
o SOd' . t ( )100 lame er ~ 150
Figure 4.20 Time evolution of experimental (symbols) and predicted
(lines) PSD for the MMA suspension polymerisation (T= 70'C,
NI = 500 rpm, tPd = 0.2, LPO = 1 wt%, PV A = 1 gll).
183

CHAPTER FOUR MATHEMATICAL MODELLING
4.9 CONCLUSIONS
The following conclusions can be drawn from the modelling section:
• The kinetics of suspension polymerisation of MMA was successfully modelled.
The model could fairly predict the rate of polymerisation and also the molecular
weight and viscosity of the drops with variations in the initiator concentration,
monomer concentration, and the reaction temperature.
• The population balance model could qualitatively predict the characteristic
behaviour of the evolution of drop size average and distribution in the
MMNwater dispersion and the MMA suspension polymerisation reaction.
• The evolution of size variations during the transient stage of mixing was
modelled with an assumption that the complete adsorption of PV A on the
surface of drops is a slow process.
• The PBM model could successfully reproduce the size variation of
drops/particles during mixing (reactions).
• A better agreement between the model predictions and experimental data can be
obtained by optimisation and fitting of the adjustable parameters to both
experimental d32 and PSD, together with application of more specific and tailor
made drop breakage functions and models.
184

GENERAL CONCLUSIONS
GENERAL CONCLUSIONS
INTODUCTION
The aim of this research work was to obtain a new insight into the evolution of average
particle size and distribution in suspension polymerisation reactions. Methyl
methacrylate was selected as a model monomer. The comparative study of the MMA
suspension polymerisation and MMNwater dispersion was carried out, for the first
time, to elaborate on the evolution of drop size distributions. The detailed conclusions
have been given in the appropriate sections. Here, the most significant conclusions are
highlighted.
1. Kinetics
1.1 rate of Polymerisation
The overall rate of polymerisation during the suspension polymerisation of MMA could
be monitored by sampling from the reaction vessel. The polymerisation rate could be
divided into three stages:
• Stage I. The initial period during which the rate of polymerisation
decreased with time.
• Stage 1I. The rate of polymerisation abruptly increased due to the gel
effect.
• Stage 1I. The increase in the rate of polymerisation levelled off and final
conversion was reached.
The rate of polymerisation in all three stages was shown to be independent of PV A
concentration, and the stirring speed, but slightly dependent on monomer hold up. The
rate of polymerisation was enhanced with increasing initiator concentration and
temperature, as was expected. The concentration of chain transfer agent did not affect
the rate of polymerisation during stage I, but it reduced the rate of reaction during the
next two stages.
185

GENERAL CONCLUSIONS
1.2 Onset of the gel effect
The onset of the gel effect was advanced, in terms of conversion, with a molecular
weight increase. A rise in the molecular weight was induced by a decline in the initiator
and chain transfer agent concentrations and the reaction temperature.
2. Evolution of Particle Size Average and Distribution
2.1 Characteristic intervals
It was found that the traditional division of suspension polymerisation processes into
three intervals of quasi-steady state, sticky stage, and identification stage is not
complete. It was further realised that the kinetics of polymerisation and/or mixing
condition can affect such classifications. From the comprehensive experimental results,
the characteristic intervals of a typical suspension polymerisation were realised. The
understanding of the phenomena occurring in a polymerisation system during each
interval will assist to elaborate the evolution of size distributions in these systems. The
suspension polymerisation can be characterised by:
• Transition period during which PSD narrows dramatically and drop size
decreases exponentiaIIy due to a higher rate of drop break up, in comparison
with drop coalescence, until a steady-state value is reached. For a suspension
polymerisation, it was generally accepted that the drop size reaches a steady
state in the initial stage of mixing before the onset of the polymerisation
reaction. The importance, and even the existence, of the transition stage has been
totally ignored in the literature. The results indicate that increasing the impeIIer
speed, monomer hold up, and PV A concentration will lead to a shorter transition
period. Increasing the rate of reaction, via increasing initiator concentration,
reaction temperature and decreasing inhibitor concentration, will shorten this
period.
• Quasi steady state during which the rate of drop break up and drop coalescence
are almost balanced leading to a steady-state drop size average and distribution;
The occurrence of this stage is conditional. Low impeller speed and PVA
concentration may remove the quasi steady-state stage completely and drops
starts growing considerably after a sharp decrease in size during the transition
186

GENERAL CONCLUSIONS
stage. Even for non-reacting liquid-liquid dispersions, no real steady state was
reached after 3 h of mixing because of continuous drop break up. However, the
variation in the average drop size was reduced with time so that a quasi steady
state could be assumed. The size of drops is determined as a result of a balance
between drop break up and coalescence. During the steady state, the average size
of drops remains constant despite a continuous drop breakage and coalescence.
This has been called a dynamic equilibrium. At a high stabiliser concentration,
all stages overlapped so that the drops formed after the transition stage were
maintained in the reaction medium and were gradually converted to polymer
beads with the least interaction with other particles. This was called a "static
steady state".
• Growth stage during which the rate of drop break up considerably falls below
the rate of drop coalescence due to the viscosity build up in drops leading to the
drop enlargement and PSD broadening. Traditionally a critical conversion or
viscosity has been used to identify the beginning of the growth stage. Results
show that the onset of the growth stage may not be fixed and it depends on the
balance of the forces acting on drops. The onset of the growth stage in terms of
time was advanced with decreasing stirring speed and PV A concentration and
increasing monomer hold up. These variations were associated with a decrease
in the rate of drop break up and/or increase in the rate of drop coalescence. The
onset of the growth stage in terms of conversion was delayed with increasing
initiator concentration because of the formation of a low-molecular-weight
polymer. The magnitude of the growth stage became more severe with
increasing monomer hold up and decreasing PV A concentration.
• Identification stage during which a solid-liquid suspension is attained and PSD
and mean particle size remain unchanged afterwards. The onset of this stage
appears to be fairly constant for different formulations.
187

GENERAL CONCLUSIONS
3. Satellite droplets
Satellite droplets were found to form continuously with time in non-reacting systems. A
similar behaviour was observed for the reacting systems, but the population of satellite
droplets declines significantly after the onset of the growth stage due to instability. With
a high concentration of the stabiliser, the growth stage was damped and as a result
satellite droplets could have more chance to survive in the system. Water-soluble
inhibitors hindered the formation of satellite particles by an emulsion polymerisation
mechanism and thus improved the stability of the suspension so that smaller particles
could be obtained.
4. Modelling
A population balance model was developed to track the evolution of drop/particle size
variation in the course of polymerisation. The time variation in the rheological
properties of the polymerising drop was taken into consideration by coupling of the
detailed kinetic model of the MMA polymerisation with the population balance model.
The following conclusions can be drawn from the modelling section:
• The population balance model developed could qualitatively reproduce the
characteristic intervals of non-reacting monomer dispersions (transient and quasi
steady-state stages) and reacting monomer dispersions (transition, quasi steady
state, growth and identification stages).
• The transient stage of suspension polymerisation reactions was, for the first
time, modelled.
• The agreement between the experimental data and predicted behaviour was, in
most cases, satisfactory. The fit can be improved by completion of the model
with new routines, in particular for satellite droplet formation, and by
optimisation of the adjustable parameters.
188

RECOMMENDATIONS FOR FURTHER WORKS
RECOMMENDATIONS FOR FURTHER WORK
The results obtained and the conclusions drawn from this research project have
increased the understanding of evolution of particle size average and distribution in
suspension polymerisation reactions. It is recommended that the following tasks should
be undertaken to widen the scope of understanding drop behaviour.
1- Two-stage addition of stabiliser should be implemented for other types of
stabilisers as the results appeared to be promising for control of particle size.
2- The effect of viscosity on the evolution of drop size as well as its effect on the
formation of satellite droplets should be further investigated.
3- The underlying mechanism for the role of oil-soluble inhibitors in the stability of
polymerising drops should be investigated.
4- Research should be directed at more in depth investigation of satellite droplet
formation in suspension polymerisation reactors as these tiny off-spec particles
were found to be a main cause for the drop instability by adsorbing a large
quantity of the stabiliser.
5- The formation of flocculates at high polymer conversion deserves a thorough
investigation.
6- Non-homogeneity considerations have to be taken into account since the quality
of agitation, especially in large scale reactors, is characterised by the average as
well as the local energy dissipation rate. Computational Fluid Dynamics (CFD),
coupled with PBM, provides a powerful tool to simulate the turbulent field and
to predict the evolution of DSDIPSD in suspension polymerisation reactors. The
modelling will be of great potential in resolving of the underlying mechanism of
satellite drop formation.
189

NOMENCLATURE
NOMENCLATURE
a interfacial area per aqueous phase volume unit
ab,a, adjustable parameters of break up and coalescence efficiencies, respectively
b rate of drop break up, IIsec (equation 4.1.3)
b, adjustable parameter of coalescence efficiency
c rate of drop coalescence, IIsec (equation 4.1.12)
c concentration, kg/m3
e constant in equations 1.1.1, 1.1.2, 1.1.7, 1.1.17
Cl chain-transfer constant of monomer
C, chain-transfer constant of chain-transfer agent
d drop/particle diameter, m
d32 Sauter mean diameter, m
DJ impeller diameter, m
dmax maximum drop size, m
dmin minimum drop size, m
dn number average diameter, m
Dr tank diameter, m
d»,d", volume and weight average diameters, respectively, m
e energy, J
E activation energy, J
E Young's elasticity modulus
f initiator efficiency
F(v,t) drop volume distribution
F(d"t) drop diameter distribution
F viscosity parameter defined by equation 1.3.8
G Gibbs free energy, J (equations 4.3.5, 4.3.6)
I initiator
k reaction rate constant, l/sec
K constant in equations 1.1.8, 1.1.9, 1.1.12
kb' k, adjustable parameters of break up and collision frequencies, respectively
km overall mass transfer coefficient of monomer from the aqueous phase to the drops
I macroscale of turbulence, m
mij ratio of the molar volumes of species i andj (equations 4.3.5, 4.3.6)
M monomer
190

NOMENCLATURE
Mm Monomer molecular weight, kglkgmol
M",Mw cumulative number and weight average molecular weights of polymer, kglkgmol
N number of drops/particles (N, : total number of drops/particles)
NI agitation speed, lIsec
Np Power Number (equation 4.1.5)
P polymer
R Universal gas constant, J/mol.K
R free-radical
Rp rate of polymerisation, moVm3.sec
Re Reynolds Number
S chain-transfer agent
S,q equilibrium water solubility (wt%)
t time, sec
T temperature, cC
Tg glass-transition temperature, cC
t.t, contact and coalescence times, sec (equation 1.1.10)
u mean turbulent velocity, m/sec (equations 1.1.1, 1.1.2)
u average number of daughter drops formed by breaking of a mother drop
v, v' drop/particle volume, m3
V volume of the polymerisation locus or dispersed phase, m3 (equation 1.2.11)
V, elasticity parameter defined in equation 4.1.8b
VI free volume of the reaction mixture
V, total volume of the reactor content, m3
Vi viscosity group defined by equation 1.1.6
W weight, kg
We Weber Number
x conversion of monomer to polymer
Xds volume ratio of daughter to satellite drops (equations 4.1.1 0, 4.1.11)
X",Xw number and weight average degrees of polymerisation
Yo elasticity parameter defined by equation 4.1.8b
Greek letters
a elasticity parameter defined by equation 4.1.8c
a thermal expansion coefficient, lice
f3 daughter drop volume distribution (equation 1.3.1 la)
191

NOMENCLATURE
P polymer molecular weight parameter defined by equation 1.3.2c
e average energy dissipation rate, m%ec3 (equation 1.1.4)
tp volume contraction factor (equation 1.2.10)
t; viscosity parameter defined by equation 1.3.8
TJ microscale of turbulence, m (equation 1.1.3)
e surface coverage of drops/particles (equation 4.1.19b)
e elasticity parameter defined by equation 4.1.8c
A efficiency of drop break up and coalescence
A moment of free-radical chains, mol/m3
f.l moment of dead-polymer chains, mol/m3
f.l viscosity, kg/m. sec
V kinematic viscosity, m%ec
p density, kg/m3
u interfacial tension, N/m
0; standard deviation (equation 3.1.11)
r polymer molecular weight parameter defined by equation 1.3.2c
rp volume fraction
.l solubility interaction parameter (equations 4.3.5, 4.3.6)
OJ drop break up and collision frequency, lIsec (equations 4.1.6, 4.1.13)
n efficiency parameter defined by equation 4.1.7
Subscripts
a aqueous phase
b break up
c coalescence
d dispersed phase - daughter drop - initiation reactions
f transfer to monomer reactions
m monorner
p polymer - propagation reactions
s suspending agent - satellite droplet
t termination reactions
u, v, v' drop/particle volume
192

REFERENCES
REFERENCES
Abrahamson, J. "Collision rates of small particles in a vigorously turbulent fluid."
Canadian J. Chem. Eng., 72,185-193 (1975).
Adams, M.E., Casey, B.S., Mills, M.F., Russell, G.T., Napper, D.H., Gilbert, RG.
"High conversion emulsion, dispersion, and suspension polymerization" Makromol.
Chem., Macromol. Symp., 35/36, 1-12 (1990).
Adamson, A.W. "Physical chemistry of surfaces" Wiley, New York (1976).
Alexopoulos, A.H., Maggioris, D., Kiparissides, C. "CFD analysis of turbulence non
homogeneity in mixing vessels: A two-compartment model" Chem. Eng. Sci., 57,
1735-1752 (2002).
Ali, A.M., Yuan, H.H.S., Dickey, D.S., Tatterson, G.B. "Liquid dispersion mechanisms
in agitated tanks. I: Pitched-blade turbine" Chem. Eng. Commun., 10(4-5), 205-213
(1981).
Almog, Y., Levy, M. "Effect of initiator on the molecular weight distribution in
dispersion polymerization of styrene" J. Polym. Sci., Polym. Chem. Ed., 18, 1-11
(1980).
Alopaeus, V., Koskinen, J., Keskinen, K.I., Majander, J. "Simulation of the popUlation
balances for liquid-liquid systems in a nonideal stirred tank. Part 2 - parameter fitting
and the use of the multiblock model for dense dispersions" Chem. Eng. Sci., 57(10),
1815-1825 (2002).
Alvarez, J., Alvarez, J.J., and Hernandez, M. "A Population balance approach for the
description of particle size distribution in suspension polymerisation reactors."
Chem. Eng. Sci., 49(1), 99-113 (1994).
Alvarez, J., Alvarez, J.J., and Martinez, RE. "Conformation of the particle size
distribution in suspension polymerisation. The role of kinetics, polymer viscosity
and suspension agent." J. Appl. Polym. Sci., Appl. Polym. Symp., 49, 209-221
(1991).
Arai, K., Konno, M., Matunaga, Y., and Saito, S. "Effect of dispersed-phase viscosity
on the maximum stable drop size for breakup in turbulent flow." J. Chem. Eng.
Japan, 10(4),325-330 (1977).
Arshadi, R "Suspension, emulsion, and dispersion polymerization: A methodological
survey." Colloid Polym. Sci., 270, 717-732 (1992).
193

REFERENCES
Azad, A.RM., Fitch, RM. "Particle size distribution in suspension polymerizations:
Effect of low molecular weight compounds" In Polymer Colloids IJ, Fitch, R.M.
(Ed.), Plenum Press, New York, 95-119 (1978).
Bae, J.H., Tavlarides, L.L. "Laser capillary spectrophotometry for drop-size
concentration measurements" A.I.Ch.E. J., 35(7), 1073-1084 (1989).
Baillagou, P.E., Soong, D.S. "A viscosity constitutive equation for PMMA MMA
solutions" Chem. Eng. Commun., 33(1-4),125-1343 (1985a).
Baillagou, P.E., Soong, D.S. "Free-radical polymerization of methyl-methacrylate in
tubular reactors" Polym. Eng. Sci., 25(4), 212-231 (1985b).
Bevington, I.C., Hunt, RI., Warburton, I. "Effects of stabilized radicals upon
polymerisations initiated by benzoyl peroxide" Polymer, 44,3469-3475 (2003).
Bevington, I.C., Warburton, I., Hunt, BJ. "Effects of stabilized radicals upon
polymerisations initiated by benzoyl peroxide" J. Macromol. Sci." A. Chem., 39(1),
295-303 (2002).
Bhargava, G.S., Khan, H.D., and Bhattacharyya, K.K. "SAN copolymer by suspension
polymerisation. H. Bead size distribution and molecular weight." J. Appl. Polym.
Sci.,23, 1181-1187 (1979).
Bird, RB., Armstrong, RC., Hassager, O. "Dynamics of polymer liquids" WHey, New
York (1977).
Borwankar, RP., Chung, S.l, Wasan, D.T. "Drop sizes in turbulent liquid-liquid
dispersions containing polymeric suspension stabilizers. 1. The breakage mechanism"
J. Appl. Polym. Sci. ,32(7), 5749-5762 (1986).
Boume, I.R., Yu, S. "Investigation of micromixing in stirred tank reactors using parallel
reactions" Ind. Eng. Chem. Res., 33, 41-55 (1994).
Brandrup, I., Immergut, E.H., Grulke, EA (Eds) "Polymer Handbook", 4th Ed., Wiley,
New York, IIJ43 (1999).
Brooks, B.W. "Basic aspects and recent developments in suspension polymerisation."
Makromol. Chem., Macromol. Symp., 35/36,121-140 (1990).
Brown, D.E., Pitt, K., paper presented at CHEMECA, Australia (1970).
Brown, D.E., Pitt, K., Chem. Eng. Sci., 29, 345-350 (1974).
194
--I

REFERENCES
Calabrese, R.V., Chang, T.P.K. and Dang, P.T. "Drop breakup in turbulent stirred-tank
contactors. Part I: Effect of dispersed phase viscosity." AIChE J., 32(4), 657-666
(1986a).
Calabrese, R.V., Wang, C.Y., and Bryner, N.P. "Drop breakup in turbulent stirred-tank
contactors. Part Ill: Correlations for mean size and drop size distribution." AIChE J.,
32(4),677-681 (1986b).
Calderbank, P.H., Inst. Chem. Eng., 36,443 (1958).
Castellanos, JR, Mendizabal, E., and Puig, J.E. "A quick method for choosing a
protecting colloid for suspension polymerization." J. Appl. Polym. Sci., Appl.
Polym. Symp., 49, 91-101 (1991).
Chang, T.P.K., Sheu, Y.H.E., Tatterson, G.B., Dickey, D.S. "Liquid dispersion
mechanisms in agitated tanks. IT: Straight-blade and disk style turbines" Chem. Eng.
Commun., 10(4-5),215-222 (1981).
Chatzi, E.G., Boutris, C.J., Kiparissides, C. "On-line monitoring of drop size
distributions in agitated vessels: 2. Effect of stabilizer concentration." Ind. Eng.
Chem. Res., 30, 1307-1312 (1991).
Chatzi, E.G., Gavrielides, A.D., Kiparissides, C. "Generalized model for prediction of
the steady-state drop size distribution in batch stirred vessels." Ind. Eng. Chem. Res.,
28,1704-1711 (1989).
Chatzi, E.G., and Kiparissides, C. "Drop size distributions in high holdup fraction
dispersion systems: effect of the degree of hydrolysis of PVA stabiliser." Chem.
Eng. Sci. 49(24B), 5039-5052 (1994).
Chatzi, E.G., and Kiparissides, C. "Dynamic simulation of bimodal drop size
distributions in Iow-coalescence batch dispersion systems." Chem. Eng. Sci., 47(2),
445-456 (1992).
Chatzi, E.G., and Kiparissides, C. "Steady-state drop size distributions in high holdup
dispersion systems." AIChE J., 41(7),1640-1652 (1995).
Chatzi, E.G., Lee, J.M. "Analysis of interactions for liquid-liquid dispersions in agitated
vessels" Ind. Eng. Chem. Res., 26, 2263-2267 (1987).
Chen, H.T., Middleman, S., A.I.Ch.E. J., 13,989 (1967).
Chen, Z., Pauer, W., Moritz, H.U., Pruss, 1., Warnecke, H. "Modeling of the suspension
polymerisation process using a particle population balance" Chem. Eng. Tech., 22,
609-616 (1999).
195

REFERENCES
Chesters, AK. "The modelling of coalescence process in fluid-liquid dispersions: A
review of current understanding. Transactions of the Institution of Chemical
Engineering (Part A) 69, 259-270 (1991).
Chiu, W.Y., Carratt, G.M., and Soong, D.S. "A computer model for the gel effect in
free-radical polymerization." Macromolecules, 16,348-357 (1983).
Clark, M.M. "Drop breakup in a turbulent-flow.2. Experiments in a small mixing
vessel" Chem. Eng. Sci., 43(3), 681-692 (1988).
Colvin, M., Chung, S.K., Hyson, M.T., Chang, M., Rhim, W.K "A new method for the
production of large spherical monosized polymer particles for biomedical and
chromatographic applications" 1. Polym. Sci., Part A: Polym. Chem., 28, 2085-2095
(1990).
Coulaloglou, C.A and Tavlarides, L.L. "Drop size distributions and coalescence
frequencies of liquid-liquid dispersions in flow vessels." AIChE J., 22(2),289-297
(1976).
Coulaloglou, CA and Tavlarides, L.L. "Description of interaction processes in agitated
liquid-liquid dispersions." Chem. Eng. Sci., 32(1),1289-1297 (1977).
Clark, M.M. "Drop breakup in a turbulent flow-n. Experiments in a small mixing
vessel" Chem. Eng. Sci., 43(3), 681-692 (1988).
Cui, Y.Q., Van der Lans, R.GJ.M., Noorman, HJ., and Luyben, KCh.A.M.
"Compartment mixing model for stirred reactors with multiple impellers." Trans.
Inst. Chem. Eng., 74, Part A, 261-271 (1996).
Cunningham, M.F. "Microsuspension polymerization of methyl methacrylate." Polym.
React. Eng., 7(2),231-257 (1999).
Cunningham, M.F., Geramita, K, Ma, J.W. "Measuring the effects of dissolved oxygen
in styrene emulsion polymerization" Polymer, 41, 5385-5392 (2000).
Cunningham, M.F., Mahabadi, H.K., and Wright, H.M. "Superrnicron polymer particles
with core-shell type morphology." J. Polym. Sci., Part A: Polym. Chem., 38, 345-
351 (2000).
Davies, J.T. "Turbulence phenomena" Academic Press, New York (1972).
Delichatsios, M.A, and Probstein, R.F. "The effect of coalescence and the average drop
size in liquid-liquid dispersions." Ind. Eng. Chem. Fundam., 15(2), 134-138 (1976).
Diamant, H., Ariel, G., Andeman, D. "Kinetics of surfactant adsorption: The free
energy approach" Colloids and Surfaces, 259, 183-185 (2001).
196
~--------------------------------------------------------- --

REFERENCES
Dimonie, M.V., Boghina, C.M., Marinescu, N.N. "Inverse suspension polymerization
of acrylamide" Eur. Polym. J., 18,639-645 (1982).
Doulah, M.S. "An effect of holdup on drop sizes in liquid-liquid dispersions." Ind. Eng.
Chem. Fundam., 14(2), 137-138 (1975).
Dowding, P.J., Goodwin, J.W., and Vincent, B. "Production of porous Ssspension
polymers using a continuous tubular reactor." Colloid and Polymer Science, 278(4),
346-351 (2000).
Dowding, PJ., and Vincent, B. "Suspension polymerisation to form polymer beads."
Colloids and Surfaces. A: Physicochemical and Engineering Aspects, 161,259-269
(2000).
Fan, S., Gretton-Watson, S.P., Steinke, J.H.G., Alpay, E. "Polymerisation of methyl
methacrylate in a pilot-scale tubular reactor: modelling and experimental studies"
Chem. Eng. Sci., 58, 2479-2490 (2003).
Ferry, J.D. "Viscoelastic properties of polymers", 3'd ed., WiIey, New York (1980).
Fitch, R.M., Prenosil, M.B., Sprick, KJ. "The mechanism of particle formation in
polymer hydrosols. 1. Kinetics of aqueous polymerization of methyl methacrylate" J.
Polym. Sci., Part C, 27, 95-118 (1969).
Gandhi, KS., Kumar, R. "An elongational flow model for drop breakage in stirred
turbulent dispersions" Chem. Eng. Sci., 45, 2998-3001 (1990).
Godfrey, J.C., Reeve, RN., GriIc, V., Inst. Chem. Eng., Symp. Ser., 89, 107-126 (1984).
Goodall, A.R., and GreenhilI-Hooper, MJ. "Characterisation of partially-hydrolysed
poly(vinyl acetate)s for use as stabilisers in suspension polymerisation." Makromo!'
Chem., Makromo!. Symp., 35/36,499-507 (1990).
Hamielec, A.E., and Tobita H. "Polymerization Processes." UIlmann's Encyclopedia of
Industrial Chemistry. VCH Publishers Inc., New York, Vo!. A21, 305-428 (1992).
Hashim, S. "Drop mixing in suspension polymerisation." Ph.D. thesis, Chemical
Engineering Department, Loughborough University, Loughborough, UK (2001).
Hatate, Y., Ikari, A., Kondo, K, Nakashio, F. "Change of size distribution of polymer
droplets with time in styrene suspension polymerisation under ultrasonic irradiation"
Chem. Eng. Commun., 34, 325-333 (1985).
197

REFERENCES
He, Y., Howes, T., Litster, J.D., and Ko, G.H. "Experimental study of drop-interface
coalescence in the presence of polymer stabilisers" Colloids and Surfaces, A:
Physicochemical and Engineering aspects, 207, 89-104 (2002).
Hinze, J.O. "Fundamentals of the hydrodynamics mechanism of splitting in dispersion
processes." AIChE J., 1,950-956 (1955).
Hinze, J.O. "Turbulence: an introduction to mechanism and theory." 2nd Ed., McGrow-
Hill, Toronto (1987).
Hocq, S., Milot, J.F., Gourdon, C., Casamatta, G. "Electrical-conductivity capillary
technique-A new method for bivariate drop-size concentration distribution
measurements" Chem. Eng. Sci., 49(4), 481-489 (1994).
Hong, P.O. Lee, J.M. "Changes of the average drop sizes during the initial period of
liquid-liquid dispersions in agitated vessels" Ind, Eng. Chem. Proc. Des. Dev., 24,
868-872 (1985).
Howarth,W.J. "Coalescence of drops in a turbulent flow field." Chem. Eng. Sci., 19,33-
38 (1964).
Huo, B.P., Carnpbell, J.D., Penlidis, A., Macgregor, J.F. "Effect of impurities on
emulsion polymerization: Case IT kinetics" J. Appl. Polym. Sci., 35, 2009-2021
(1987).
Ivanov, I.B., Dimitrov, D.S., Somasundaran, P., Jain, R.K. "Thinning of films with
deformable surfaces: diffusional-controlled surfactant transfer" Chem, Eng., Sci., 40,
137-150 (1985).
Jahanzad, F., Kazemi, M.M., Sajjadi, S., Taromi, F.A. "n-Dodecyl mercaptan transfer
constant in polymerization of methyl methacrylate" Polymer, 34(16), 3542-3544
(1993).
Jahanzad, F., and Sajjadi, S. "SAN copolymers by suspension polymerisation." Internal
report (in Persian), Iran Polymer Institute, Tehran, Iran (2000).
Jo, Y., Park, K., Ahn, J., !hm, S. "Hollow gelular beads of styrene-divinylbenzene
copolymer prepared by suspension polymerisation" Eur. Polym. J., 32(8), 967-972
(1996).
Johnson, G.R. "Effects of agitation during VCM suspension polymerization" J. Vinyl
Tech., 2, 138-143 (1980).
198

REFERENCES
Kalfas, G., and Ray, W.H. "Modeling and experimental studies of aqueous suspension
polymerization processes. 1. Modeling and simulation." Ind. Eng. Chem. Res., 32,
1822-1830 (1993).
Kalfas, G., Yuan, H., and Ray, W.H. "Modeling and experimental studies of aqueous
suspension polymerization processes. 11. Experiments in batch reactors." Ind. Eng.
Chem. Res., 32,1831-1838 (1993).
Kim, N., Sudol, E.D., Dimonie, V.L., EI-Aasser, M.S. "Poly(vinyl alcohol) stabilization
of acrylic emulsion polymers using the rniniemulsion approach" Macromolecules,
36(15),5573-5579 (2003).
Kolmogoroff, AN. "The local structure of turbulence in incompressible viscous fluid
for very high Reynolds numbers." C.R Acad. Sci. USSR, 30, 301 (1941).
Konno, M., Aoki, M., Saito, S. "Scale effect on breakup processin liquid-liquid agitated
tanks" J. Chem. Eng. Japan, 16(4),312-319 (1983).
Konno, M., Arai, K, Saito, S. "The effect of stabilizer on coalescence of dispersed
drops in suspension polymerization of styrene." J. Chem. Eng. Japan, 15(2), 131-135
(1982).
Konno, M., Muto, T., Saito, S. "Coalescence of drops in an agitated tank" J. Chem.
Eng. Japan, 21(4), 335-338 (1988).
Koshy, A, Das, T.R, and Kumar, R "Effect of surfactants on drop breakage in
turbulent liquid dispersions." Chem. Eng. Sci., 43,649-654 (l988a).
Koshy, A, Das, T.R, Kumar, R, and Gandhi, KS. "Breakage of viscoelastic drops in
turbulent stirred dispersions." Chem. Eng. Sci., 43,649-654 (l988b).
Kumar, S., Kumar, R, Gandhi, KS. "Alternative mechanisms of drop breakage in
stirred vessels" Chem. Eng. Sci., 46, 2483-2489 (1991).
Kuriyama, M., Ono, M., Tokanai, H., Konno, H. "The number of daughter drops
formed per breakup of a highly viscous mother-drop in turbulent flow" J. Chem.
Eng. Japan, 28(4), 477-479 (1995).
Lagisetty, J.S., Das, P.K, and Kumar, R. "Breakage of viscous and non-Newtonian
drops in stirred dispersions." Chem. Eng. Sci., 41(1), 65-72 (1986).
Lashares, J.C., Eastwood, C., Martinez-Bazan, c., Montanes, J.L. "A revIew of
statistical models for the break-up of an immiscible fluid immersed into a fully
developed turbulent flow" International Journal of MUltiphase Flow, 28, 247-278
(2002).
199

REFERENCES
Laso, M., Steiner, L., Hartland, S. "Dynamic simulation of liquid-liquid agitated
dispersions.2. Experimental determination of breakage and coalescence rates in a
stirred tank" Chem. Eng. Sci., 42(10), 2437-2445 (1987).
Lazrak, N., Le Bolay, N., Ricard, A. "Droplet stabiIization in high holdup fraction
suspension polymerisation reactors" EUf. Polym. J., 34,1637-1647 (1998).
Lee, KC., Song, B.K, Lee, DJ. "Inverse suspension polymerization of acrylamide"
Polymer Korea, 25, 460-467 (2001).
Levich, V.G. "Physicochemical hydrodynamics." Prentice-Hall, NJ (1962).
Liu, S., and Li, D. "Drop coalescence in turbulent dispersions." Chem. Eng. Sci., 54,
5667-5675 (1999).
Ma, G.H., Fujuwara, J., Su, Z.G., Omi, S. "Synthesis and characterization of
crosslinked uniform polymeric microspheres containing a polyimide prepolymer by
a new emulsification process", J. Polym. Sci., Part A: Polym. Chem., 41, 2588-2598
(2003).
Ma, G.H., Su, Z.G., Omi, S., Sundberg, D., Stubbs, J. "Microencapsulation of oil with
poly(styrene-N,N-dimethylaminoethyl methacrylate) by SPG emulsification
technique: Effects of conversion and composition of oil phase." 266 (2), 282-294
(2003)
Machado R.A.F., Pinto J.c., Araujo P.H.H., Bolzan A. "Mathematical modeJing of
polystyrene particle size distribution produced by suspension polymerisation"
Brazilian J. of Ch em. Eng., 17,395-405 (2000).
Maggioris, D., Goulas, A., Alexopoulos, AH., Chatzi, E.G., Kiparissides, C.
"Prediction of particle size distribution in suspension polymerization reactors: effect
ofturbulance nonhomogeneity." Chem. Eng. Sci., 55,4611-4627 (2000).
Maggioris, D., Goulas, A., Alexopoulos, A.H., Chatzi, E.G., Kiparissides, C. "Use of
CFD in prediction of particle size distribution in suspension polymer reactors."
Computers and Chemical Engineering, 22(Supp!. S), S315-S322 (1998).
Mann, R., PilIai, S.K, El-Hamouz, AM. Ying, P., Togatorop, A, and Edwards, R.B.
"Computational fluid mixing for stirred vessels: progress from seeing to believing."
Chem. Eng. J., 59, 39-50 (1995).
Mark, H.F. (editor) "Encyclopedia of polymer science and engineering" Wiley, New
York, Vo!. 13,729-733 (1989).
200

REFERENCES
Marten F.L., and Hamielec, A.E. "High-conversion diffusion-controlled polymerization
of methyl methacrylate." Am. Chem. Soc. Symp. Ser., 104,43 (1979).
Marten F.L., and Hamielec, A.E. "High-conversion diffusion-controlled polymerization
of styrene." J. Appl. Polym. Sci., 27,489-505 (1982).
Matsumoto, S., Takeshita, S., Koga, J., Takashima, Y. "A production process for
uniform-size polymer particles" J. Chem. Eng. Jpn., 22, 691-693 (1989).
Mendizabal, E., Castellanos-Ortega, JR, and Puig, J.E. "A method for selecting a
polyvinyl alcohol as stabilizer in suspension polymerization." Colloids and Surfaces,
63,209-217 (1992).
Mighri, F., Carreau, PJ., Aji, A. "Influence of elastic properties on drop deformation
and breakup in shear flow" Joumal of Rheology, 42(6),1477-1490 (1998).
Mighri, F., Huneault, M.A. "Drop deformation and breakup mechanism in viscoelastic
model fluid systems and polymer blends" Canadian J. Chem. Eng., 80(6),1028-1035
(2002).
Mikos, A.G., Takoudis, C.G., and Peppas, N.A. "Reaction engineering aspects of
suspension polymerization." J. Appl. Polym. Sci., 31, 2647-2659 (1986).
Mlynek, Y., Reshnick, W. "Drop sizes in an agitated liquid-liquid system" A.I.Ch.E. J.,
18, 122 (1972).
Munzer M., and Trommsdorff, E. "Polymerization processes." Schildknecht, C.E.,
Skiest, I., Eds., Wiley, New York, pp. 106 (1977).
Nambiar, D.K.R., Kumar, R., Das, T.R., Gandhi, K.S. "A two-zone model for breakage
frequency of drops in stirred dispersions." Chem. Eng. Sci., 49(13), 2194-2198
(1994).
Narkis, M. "Size distribution of suspension-polymerized unsaturated polyester beads" J.
Appl. Polym. Sci., 23, 2043-2048 (1979).
Ni, X., Brogan, G., Struthers, A., Bennett, D.C., Wilson, S.F. "A systematic study of the
effect of geometrical parameters on mixing time in oscillatory baffled reactor" Che.
Eng. Res. Des., 76(A5), 635-642 (1998).
Ni, X., Jian, H., Fitch, A. "Evaluation of turbulent integral length scale in an oscillatory
baffled column using large eddy simulation and digital particle image velocimetry"
Che. Eng. Res. Des., 81(A8), 842-853 (2003).
201

REFERENCES
Ni, X., Johnstone, J.C., Symes, K.C., Grey, B.D., Bennett, D.e. "Suspension
polymerisation of acrylamide in an oscillatory-baffled reactor: from drops to
particles" ALCh.E. J., 46, 1747-1757 (2001).
Ni, X., Zhang, Y.,. Mustafa 1. "An investigation on droplet size and size distribution in
methyl methacrylate suspensions in a batch oscillatory-baffled reactor" Chem. Eng.
Sci., 53, 2903--2919 (1998).
Ni, X., Zhang, Y., Mustafa 1. "Correlation of polymer article size with droplet size in
suspension polymerisation of methyl methacrylate in a batch oscillatory-baffled
reactor" Chem. Eng. Sci., 54, 841-850 (1999).
Nishikawa, M., Mori, F., Fujieda, S., and Kayama, T. "Scale-up of liquid-liquid phase
mixing vessel" J. of Ch em. Eng. of Japan, 20(5), 454-459 (1987).
Nishikawa, M., Mori, M., Kayama, T., Nishioka, S. "Drop size distribution in a liquid
liquid phase mixing vessel." J. Chem. Eng. Japan, 24, 88-94 (1991).
Odian, G. "Principles of polymerization." 3rd Ed., Wiley, New York (1991).
Okaya, T., Suzuki, A, Kikuchi, K. "Importance of grafting in the emulsion
polymerization of MMA using PV A as a protective colloid. Effect of initiators"
Colloids and Surfaces, A: Physicochemical and Engineering Aspects, 153, 123-125
(1999).-
Okubo, M., Yamashita, T., Suzuki, T. "Production of micron-sized monodispersed
composite polymer particles by seeded polymerization utilizing the dynamic
swelling method." Colloid Polym. Sci., 275(3), 288-292 (1997).
Olayo, R., Garcia, E., Garcia-Corichi, B., Sanchez-Vazquez, L., and Alvarez, J.
"Poly(vinyl alcohol) as a stabilizer in suspension polymerization of styrene: The
effect ofthe molecular weight" J. Appl. Polym. Sci., 67, 71-77 (1998).
Oldshue, J.Y. "Fluid mixing Technology" McGrow-Hill, New York (1983).
Omi, S., Katami, K., Yamamoto, A, Iso, M. "Synthesis of polymeric microspheres
employing SPG emulsification technique" J. Appl. Polym. Sci., 51,1-11 (1994).
Pacek, A.W., Man, C.C., and Nienow, A.W. "On the Sauter mean diameter and size
distribution in turbulent liquidlliquid dispersions in a stirred vessel." Chem. Eng.
Sci., 53(1l), 2005-2011 (1998).
Pacek, A.W., Nienow, A.W., Moore, LP.T. "On the structure of turbulent liquid-liquid
dispersed flow in an agitated vessel." Chem. Eng. Sci., 49(20),3485-3498 (1994).
202

REFERENCES
Park, J.Y., and Blair, L.M. "The effect of coalescence on drop size distribution in an
agitated liquid-liquid dispersion" Chem. Eng. Sci., 300,1057-1064 (1975).
Polacco, G., Palla, M., Semino, D. "Evolution of particle size distribution during
suspension polymerisation: theQIY and experiments" Dynamic and Control of
Process Systems, 1-2, 271-276 (1998).
Polacco, G., Semino, D., Rizzo, C. "Feasibility of methyl methacrylate polymerisation
for bone cement by suspension polymerisation in a gel phase" J. Mater. Sci.: Mater.
Med., 5, 587-591 (1994).
Ravera, F., Ferrari, M., Liggieri, L. "Adsorption and portioning of surfactants in liquid
liquid systems" Advances in Colloid and Interface Science, 88, 129-177 (2000).
Rempp, P., and Merrill, E.D. "Polmyer synthesis." 2nd Rev. Ed., Huthig and Wepf.,
Basel (1991).
Ross, S.L., Verkhoff, F.H., and Kurl RL. "Droplet breakage and coalescence processes
in an agitated dispersion." Ind. Eng. Chem. Fundam. 17(2),101-108 (1978).
Rushton, J.H., Costich, E.W., and Everett, H.J. "Power characteristics of mixing
impellers: Part I." Chem. Eng. Prog., 46,395-404 (1950).
Sajjadi, S., and Fazeli, N. "Particle size distribution in suspension polymerisation
processes." Internal report (in Persian), Iran Polymer Institute, Tehran, Iran (1994).
Sax, N.I., Lewis, R.J. "Hawley's Condensed Chemical Dictionary" 11th Ed., Van
Nostrand Reinhold Co., New York, NY, p. 184 (1989).
Shinnar, R "On the behaviour of liquid dispersions in mixing vessels." J. Fluid Mech.,
10,259-275 (1961).
Shinnar, R and Church, J.M. "Predicting particle size in agitated dispersions." Ind.
Eng. Chem., 52(3), 253-256 (1960).
Sovova,H. "Breakage and coalescence of drops in a batch stirred vessel- I. Comparison
of continuous and discrete models." Chem. Eng. Sci., 36(1),163-171 (1981).
Sprow, F.B. "Distribution of drop size produced in turbulent liquid-liquid dispersion."
Chem. Eng. Sci., 22, 435 (1967).
Tanaka, M., Hosogai, K. "Suspension polymerisation of styrene with circular loop
reactor" J. Appl. Polym. Sci., 39, 955-966 (1990).
203

REFERENCES
Tavlarides, L.L., and Stamatoudis, M. "The analysis of interphase reactions and mass
transfer in liquid-liquid dispersions." Adv. Chem. Eng., 11, 199-273 (1981).
Tsouris, C., Tavlarides, L.L. "Hold-up (volume fraction) measurements in liquid-liquid
dispersions using an ultrasonic technique response" Ind. Chem. Eng. Res., 33(3),
748-749 (1994).
TuIig, I.T., Tirrell, M. "Toword a molecular theory of the trommsdorff effect."
Macromolecules, 14,1501-1511 (1981).
Ugelstad, I., Mork, P.C., Kaggerud, K.H., Berge, A, EJlingsen, T. "Swelling of
oligomer-polymer particles, new methods of preparation of emulsions and polymer
dispersions." Adv. Colloid Interface Sci., 13, 101 (1980).
VaIadez-GounzaIez, A M.E. Thesis (In Spanish), Unidad de Ciencias Basicas e
Ingenieria, Universidad Autonoma Metropolitana, Plantel Iztapalapa, Mexico D.F.,
Mexico (1988).
Van Den Boomgaard, T., King, T.A, Tadros, T.F., Tang, H., Vincent, B. "The
influence of temperature on the adsorption and adsorbed laeyr thickness of various
molecular weight fractions of poly(vinyl alcohol) on polystyrene latex particles"
Journal of Colloid and Interface Science, 66(1), 68-76 (1978).
Van Heuven, I.W., Beek, WJ., Paper No. 51, Proceeding of International Solvent
Extraction Conference, Amsterdam (1971).
Van Heuven, J.W., Hoevenaarj, I.C., Proceeding of 4th International Symposium on
Reactor Engineering, Bruxelles (1969).
Villalobos, M.A, Hamielec, A.E., and Wood, P.E. "Bulk and suspension
polymerization of styrene in the presence of n-pentane. An evaluation of
monofunctional and bifunctional initiation." J. Appl. Polym. Sci., 50, 327-343
(1993).
VivaIdo-Lima, E., Wood, P.E., Hamielec, AE., and PenIidis, A "An update review on
suspension polymerization." Ind. Eng. Chem. Res., 36, 939-965 (1997).
VivaIdo-Lima, E., Wood, P.E., Hamielec, AE., PenIidis, A "Calculation of the particle
size distribution in suspension polymerization using a compartment-mixing model"
The Canadian I. of Ch em. Eng., 76, 495-505 (1998).
204

REFERENCES
Wang, Z.P., and Brooks, B.W. "Drop stabiIisation by inorganic solids in suspension
polymerisation - Modification by electrolytes using a wax model." Polymer Int.,
28(3),239-244 (1992).
Wang, Z.P., and Brooks, B.W. "Drop stabilisation by inorganic solids in suspension
polymerisation - Effect of inorganic particle-size using a wax model." Polymer Int.,
30(3),317-326 (1993).
Wedlock, DJ. "Colloid and surface engineering: Applications in the process
industries." Edited by Williams, R.A., Butterworth-Heinemann, Oxford (1992).
Yamazaki, N., Naganuma, K., Nagai, M., Ma, G.H., Omi, S. "Preparation of W/O
(water-in-oi1) emulsions using a PTFE (polytetrafluoroethylene) membrane- A new
emulsification device" J. Dispersion Sci. Tech., 24, 249-257 (2003).
Yamazaki, N., Yuyama, H., Nagai, M., Ma, G.H., Omi, S. "Comparison of membrane
emulsification obtained using SPG (Shirasu porous glass) and PTFE
[poly(tetrafluoroethylene)] membranes" J. Dispersion Sci. Tech., 23, 279-292
(2002).
Yang, B., Takabashi, K., and Takeishi, M. "Styrene drop size and size distribution in an
aqueous solution of poly(vinyl alcohol)." Ind. Eng. Chem. Res., 39, 2085-2090
(2000).
Yang, B., Takabashi, K., and Takeishi, M. "Unsteady stirring method used in
suspension polymerization of sty re ne." J. Appl. Polym. Sci., 82,1873-1881 (2001).
Yuan, H.G., Kalfas, G., and Ray, W.H. "Suspension polymerization." J. Macromol.
Sci., Rev. Macromol. Chem. Phys., C31(2&3), 215-299 (1991).
Yuyama, H., Hashimoto, T., Ma, G.H., Nagai, M., Omi, S. "Mechanism of suspension
polymerization of uniform monomer droplets prepared by class membrane (Shirasu
Porous Glass) emulsification technique" J. Appl. Polym. Sci., 78, 1025-1043 (2000).
Zerfa, M. "Vinyl chloride drop behaviour in suspension polymerisation reactors." Ph.D.
thesis, Chemical Engineering Department, Loughborough University,
Loughborough, UK (1994).
Zerfa, M., Brooks, B.W. "Experimental investigation of PV A adsorption at the vinyl
chloride water interface in monomer suspension." Colloid and Surface A.
Physicochemical and Engineering Aspects, 132(2-3),267-273 (1998).
205

REFERENCES
Zerfa, M., Brooks, B.W. "Prediction of vinyl chloride drop sizes in stabilised liquid
liquid dispersion." Chem. Eng. Sci., 51(12), 3223-3233 (1996).
Zhang, S.X., and Ray, W.H. "Modeling and experimental studies of aqueous suspension
polymerization processes. HI. Mass transfer and monomer solubility effects." Ind.
Eng. Chem. Res., 36,1310-1321 (1997).
Zhou, G., and Kresta, S.M. "Correlation of mean drop size and minimum drop size with
the turbulence energy dissipation and the flow in an agitated tank." Chem. Eng. Sci.,
53(11),2063-2079 (1998).
Zhu, D.W. "Perflourocarbon fluids: universal suspension polymerization media."
Macromolecules, 29, 2813-2817 (1996).
206

APPENDICES
APPENDIX A
Experimental Reproducibility
A.I Conversion
The monomer conversion was measured gravimetrically. Figure A.l compares the conversion
time variations of suspension polymerisation of MMA for two runs carried out at the same
conditions. The reproducibility is satisfactory.
I
c!Pc8tP 0 DO
0.8
~ " .S! 0.6 '" .. tP " ~ 0 00.4 DO " lil> 00 o Runl
0.2 Do OlO o Run2
0 [lJ)c9
0 30ti
. 60 me (mm)
90 120
Figure A.I Conversion-time variations for Run! and Run2 at the same conditions: T = 70'C, NI = 300 rpm, tPd = 0.2, LPO = I wt%, PV A = I gIl.
A.2 Particle Size Distribution
A laser diffraction technique (Malvern, Coulter LS 130) was used to measure drop/particle size
distribution. The Sauter mean diameter was calculated using the output of the particle sizer.
Figure A.2 compares the time evolution of the Sauter mean diameter and the final PSDs in two
runs at the same conditions. Good reproducibility is observed.
207

APPENDICES
2oo~----------------------------~ a
ISO 80 0
~ 100 ~ 02JI@O 00 ([Id)] cP<ttl t::l
50 0 Runl
o Run2
O+-------r-----~--____ _r __ --__ ~
o 30 60 90 120 time (min)
0.02 _a_------------------, b
o 100 200 diameter (!Lm)
300
o Runl
cRun2
400
Figure A.2 Comparison of a) time evolution of Sauter mean diameter and b) final PSDs of Run I and Run2 at the same conditions mentioned in the caption of Figure A.I.
208

APPENDICES
APPENDlXB
Malvern Particle Sizer
The Laser Diffraction method of measuring particle size takes advantage of an optical principle
which dictates that small particles in the path of a light beam scatter the light in characteristic,
symmetrical pattern which can be viewed on a screen. Given a certain pattern of scattered light
intensity as a function of angle to the axis of the incident beam (,flux pattern'), the distribution
of particle sizes can be deduced. Figure B.1 shows a schematic diagram of light scattering by
the small particles in a laser diffraction particle sizer.
The simplest flux pattern, that from a monornodal dispersion of spheres, consists of a central
bright spot (known as the Airy disk), surrounded by concentric dark and bright rings whose
intensity diminishes further from the centre of the pattern, that is at higher scattering angles.
The scattering angle at which the first dark ring, or diffraction minimum, occurs, depends on the
size of the particles; the smaller the particle, the higher the angle of the first dark ring (or,
alternatively, the larger the size of the Airy disk).
These flux patterns obey the rule of linear superposition. In other words, the pattern from a
mixture of two (or more) monomodal dispersions of particles can be constructed by adding the
intensity functions of the constituent particles in the mixture. The goal of a Laser Diffraction
particle size measurement of course is to measure the flux pattern accurately enough to
determine the distribution of particle sizes.
[II] H il hang le scatli>r
t[] Low ang I", scatli>r
i
,
Figure B.I Schematic diagram oflight scattering by small particles.
209

APPENDICES
APPENDIXC
Du Nouy Ring Tensiometry
Du Nouy ring tensiometry is one of the most widely used and effective methods of determining
surface and interfacial tensions. The method is to measure the force required to pull a ring from
the interface. Figure C.l shows the schematic diagram of the Du Nouy ring tensiometer. The
ring is hanging on a microbalance. The force is measured directly using the microbalance to
determine the apparent weight of a ring of platinum as it is pulled through the liquid-liquid
interface.
The surface tension force (F) acts around the perimeter of the ring (on both sides) that is being
withdrawn and is equal to the apparent weight force of the ring (mg):
F=4nry=mg
where r is the radius of the ring. The interfacial tension (y) can be easily calculated from the
above equation.
liquid-liquid interface
r to microbalance
~2r""'"
Figure C.l Schematic diagram of Du Nouy ring tensiometer.
210

APPENDICES
APPENDIXD
Gas-Liquid Chromatography
Gas-liquid chromatography is a method for quantitative and quantitative analysis of different
components of mixtures. Figure D.I shows a schematic diagram of a typical gas-liquid
chromatograph. Carrier gas from a cylinder of compressed gas first passes to a controller, the
usual purpose of which is to maintain a constant flow of gas. The gas then passes to the
Column, at the inlet to which is an Injector through which the sample to be analysed can be
introduced. The carrier gas then elutes the components of the mixture through the column. At
the far end is a device, the Detector, the purpose of which is to detect the separate components
of the mixture as they emerge one by one. The detector useS some physical or chemical
property (for example thermal conductivity) of the vapours by which they can be indicated and,
if possible, measured. A further piece of apparatus is a Flow controller to measure and control
of the rate of flow of gas.
There are two general types of column, packed and capillary. Capillary columns are more
efficient than packed columns.
There are many detectors which can be used in gas-liquid chromatography. Different detectors
give different types of selectivity. For example a Flame Ionisation Detector (FID) is suitable for
detecting organic compounds.
Flow controller
Carrier gas
Injector port
Column
Detector
Figure D.I Schematic diagram of a gas chromatograph
Recorder
211

APPENDICES
APPENDIXE
Suspension Polymerisation of Styrene
E.1 Introduction
A couple of experiments on the styrene/water dispersion and the styrene suspension
polymerisation with PV A as stabiliser were carried out. The objective of this series was to
verify that the characteristic intervals found for the MMA suspension polymerisation are
universal and can apply to any monomer. It also included the verification of the formation of
satellite droplets for a sparingly water-soluble monomer with PV A. In comparison with MMA,
the suspension polymerisation of styrene has been more studied in the literature (e.g., Konno et
ai., 1982; Tanaka and Hosogai, 1990; Villalobos et al., 1993, Olayo et ai., 1998;; Yang et ai.,
2001). A rather low rate of polymerisation for the styrene monomer provides more flexibility in
sampling and measuring drop sizes during the polymerisation.
E.2 Experimental
The materials, and the experimental procedure and measurements have been described in detail
in chapter 2. Styrene (analytical grade from Aldrich) was distilled under reduced pressure
before using. Suspension polymerisation of styrene was carried out at 70°C. Monomer hold up
and the agitation speed were 0.20 and 500 rpm, respectively. The concentration of PVA and
LPO were 1.0 gll (based on water phase) and 2.0wt% (based on monomer phase), respectively.
Generally the formulation and the polymerisation conditions were similar to those used for the
MMA suspension polymerisation. The corresponding non-reacting dispersion of styrene/water
was also carried out.
E.3 Results and Discussion
Rate of Polymerisation: Figure E.1 shows the time variations of conversion for the suspension
polymerisation of styrene. In comparison with the MMA monomer, the rate of polymerisation
was rather low for the styrene monomer due to a low propagation rate constant. A very mild gel
effect could be realised within the time interval of 400-450 min.
Mean Particle Size: Figure E.2 shows the time variations of the Sauter mean diameter of
daughter drops (D32) for the suspension polymerisation of styrene and the corresponding
dispersion. The size of drops was exponentially reduced during the transition stage for both
types of processes.
212

APPENDICES
1.0 ~---------------.
0.8
c .~ 0.6
§ 0.4
" 0.2
o 100 200 300 time (min)
400 500
Figure E.1 Conversion-time variations in suspension polymerisation of styrene (for the conditions see section D.l).
The time evolution of D32 for the polymerising drops was coincident with that of the non
reacting drops for almost 30 min. This corresponds almost to that at a conversion of 0.10. It
seems that the rate of drop break up is not much affected by the viscosity of drops until the
conversion reaches 0.10. However, a difference is gradually developed after this conversion; the
polymerising drops grow slightly with time, whereas the non-reacting drops remains almost
constant in size. The size of polymerising drops shows a steep rise after 420 min (corresponding
to the conversion of 0.70) from the start of polymerisation. That marks the onset of the growth
stage.
200 o dispersion / • , • polYIrerisation .1
~l~ I .§. , I
100 .~. ::l II • __ ....
.,--
~ I~ .............. - .... ----.... ---... -.--·---'~~-~-o--o_~ _________ ~ ____ ~ __________ _ 50
o 100 200 300 time (minJ
400 500
Figure E.2 Variations of D32 with time for suspension polymerisation of styrene and the corresponding dispersion.
213

APPENDICES
It may be concluded that for monomers with a low rate of polymerisation, the transition stage
for both polymerising and non-polymerising drops coincide. However, a gap is gradually
developed with time during the so-called steady state as a result of growth of the polymerising
drops due to the viscosity increase. The gap widens when the growth stage is reached.
Particle Size Distribution: Figure E.3 compares the time evolution of PSDIDSD in both
processes. The early distributions were similar, but later distributions were quite different for
the reasons explained above. The final PSD from the suspension polymerisation was very broad
as a result of continuous drop coalescence during the growth stage.
0.Q3 ,---,,--------------....,
.. * om El =6
/ . \ ! '.
lOO
--a-- 5min .- .- • _._- 180 min
- - • - - 500 min(fmal) ·······5 min - .. _·I80min --500min
200 diameter (j1m)
300 400
Figure E.3 Comparison of time evolution of PSDIDSD for suspension polymerisation of styrene and the corresponding dispersion (graphs with symbols present suspension polymerisation).
Satellite droplets/particles were also produced in the styrene/water dispersion and
polymerisation. Figure E.4 illustrates the time variations of the volume fraction of satellite
droplets if,,) for the two processes. A close look at this figure reveals two important points:
First, the formation of satellite droplets occurs less frequently for the styrene mono mer in
comparison with the methyl methacrylate monomer (see Figure 3.1.6, chapter 3, for
comparison). The higher interfacial tension between styrene and the continuous phase (an
aqueous solution of water containing 1.0 gII of PVA), which is 18.5 dynlcm at 70°C (Konno et
aI., 1982), in comparison with that for the MMA system (3.15 dynlcm at 25°C, see part 3.1,
chapter 3), depresses the formation of satellite droplets due to suppression of drop break up. A
similar reason can he also put forward for the larger daughter drops obtained for the styrene
monomer, in comparison with the MMA monomer.
Second, the evolution of j" was different for the two monomers. For the styrene monomer j"
increased during the whole course of polymerisation reaction with a rate similar to the rate of
214

APPENDICES
polymerisation (see Figure E.l). The formation of satellite particles occurred more extensively
during the growth stage where very viscous daughter particles underwent a massive growth. For
the MMA monomer, the satellite particles formed during the polymerisation but most of them
were lost during the growth stage due to their coalescencelflocculation with large particles. It is
not apparent why satellite particles formed in the styrene suspension polymerisation are so
stable that can escape coalescence with large particles during the growth stage. We were not
able to further explore this finding.
0.02 .,.....----------------,
om
o dispersion
• polytrerisation ,,-t • I
I , ... -...... • J ......... ------
• JL --~~-----~;i~-o~-<L~--------o---------------o
0.00 -'-'-~....,_~...,-~~-r-~~.....,..~_,.....j
o 100 200 300 400 500 time (min)
Figure E.4 Variations of fvs with time for suspension polymerisation of styrene and the corresponding dispersion.
215

~-------~--------------------,----,-c-:--~;-- - - -
APPENDICES
APPENDIXF Micrographs
Figure F.l Micrographs of drops in the non-reacting dispersion at the following conditions:
700C, NI = 500 rpm, (h= 0.2, PVA = 10 gll.
scale: 100 f1J!l
t = 5 min t = 15 min
t= 30 min t= 60 min
t= 120 min t=180min
I
I
I
I
I
I

APPENDICES
Figure F.2 Micrographs of the final polymer particles obtained in the suspension
polymerisation of MMA at the following conditions:
70°C, N1= 500 rpm, l/id= 0.2, LPO = 1 wt%, PVA = 10 g/l.
scale: lOO fLID
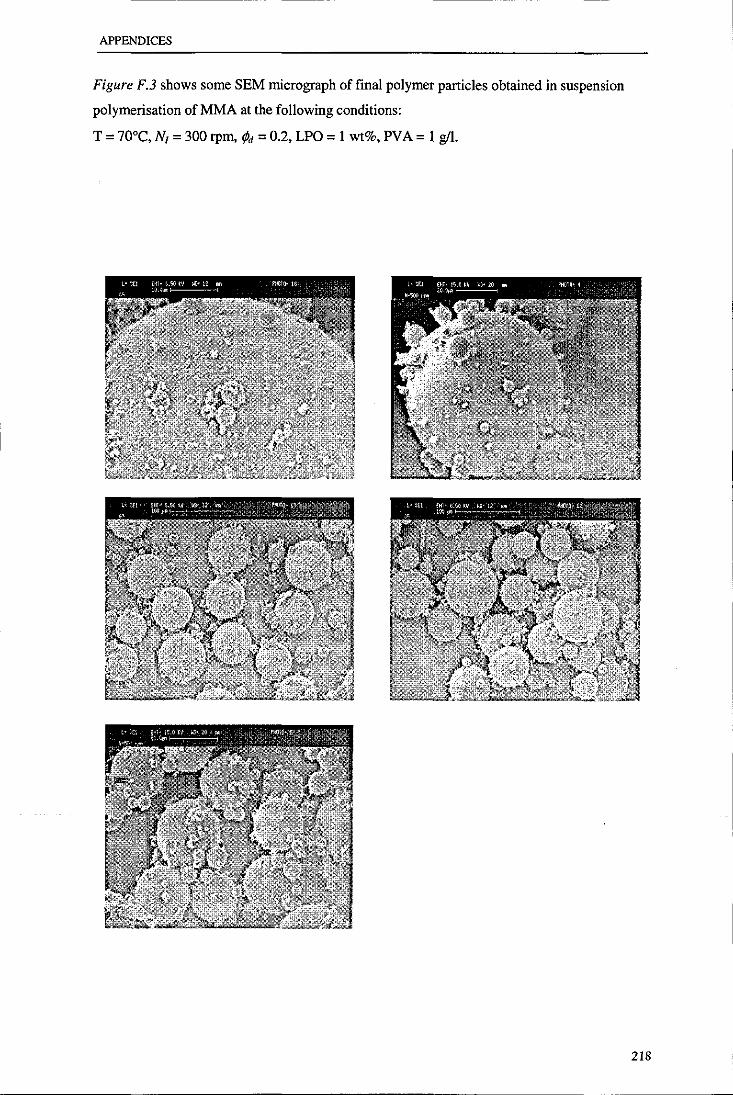
APPENDICES
Figure F.3 shows some SEM micrograph of final polymer particles obtained in suspension
polymerisation of MMA at the following conditions:
T = 70°C, NI = 300 rpm, </id = 0.2, LPO = 1 wt%, PV A = 1 gII.
218
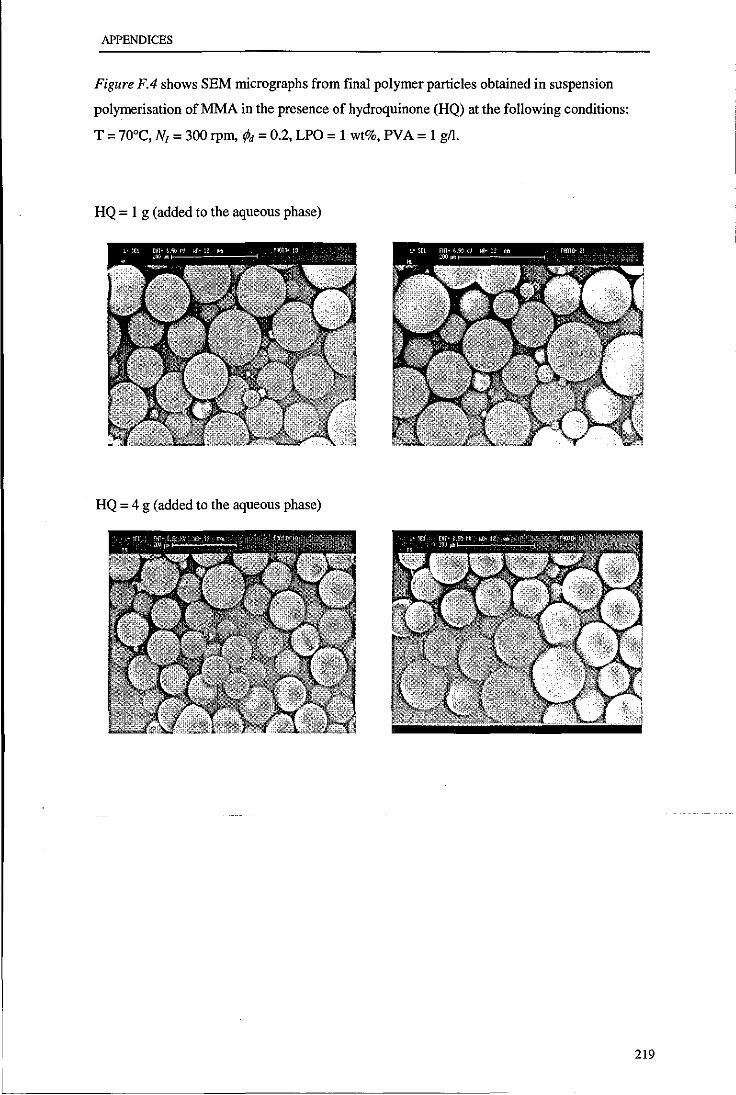
APPENDICES
Figure F.4 shows SEM micrographs from final polymer particles obtained in suspension
polymerisation of MMA in the presence of hydroquinone (HQ) at the following conditions:
T = 70°C, NI = 300 rpm, IPd = 0.2, LPO = 1 wt%, PV A = 1 gIl.
HQ = 1 g (added to the aqueous phase)
HQ = 4 g (added to the aqueous phase)
219

--- ----------------------------------------------------------------------
I',·.: " ..
APPENDICES
APPENDIXG
(appeared in Macromolecular Symposia, 2004, 206, 255-262)
On the Evolution of Particle Size Average and Size
Distribution in Suspension Polymerization Processes
Fatemeh JahanzadI, Shahriar Sajjad/, Brian W. Brooks! *
IOepartment of Chemical Engineering, Loughborough University, Loughborough, Leicestershire, LEl! 3TU, UK *Email: [email protected] 20 ivision of Engineering, King's College London, London, WC2R 2LS, UK
Summary: The dispersion of methyl methacrylate (MMA) and its suspension polymerization were used as models to elaborate the evolution of particle size average and size distribution in the course of suspension polymerization. The underlying mechanisms for the occurrence of the dynamic and static steady states in the population of drops were defined and their effects on the evolution of drop/particle size average and size distributions were examined. The characteristic intervals of suspension polymerizations (transition, steady-state, growth, and identification) were elaborated. The formation of satellite droplets and their evolution in the course of polymerization were also discussed.
Keywords: suspension polymerization, dispersion, drop break up and coalescence, particle size distribution, steady-state
Introduction
In suspension polymerization, drops of monomer (containing initiator) are dispersed in an
aqueous phase, which contains a stabilizer or suspending agent, with the aid of mechanical
agitation. As polymerization reactions proceed in the dispersed monomer drops they are
gradually converted to polymer particles. The suspending agent prevents excessive
coalescence of drops. The product of this process is polymer particles or beads with diameters
in the range of 1-5000 Ilm, depending on the process conditions.
The size of polymer beads is a complex function of drop break up and coalescence rates
during the polymerization process. Those rates are affected by several parameters such as the
1

APPENDICES
densities and viscosities of each phase, interfacial tension, type and concentration of
suspending agent, dispersed-phase hold up, type of impeller and stirring speed[I.3].
A suspension polymerization can be described as a reactive liquid-liquid dispersion in which
the nature of the drops change continuously with time. In a typical liquid-liquid dispersion,
the average drop size at first decreases quickly because of a high rate of drop break up in
comparison'with drop coalescence, Eventually a point is reached when the rates of drop break
up and drop coalescence become equal. That leads to the establishment of a so called quasi
steady state in drop size and size distribution[4.5].
The evolution of drop size in suspension polymerization is more complex because drop
viscosity increases continuously. As the drop viscosity increases, in the course of reaction, the
tendency of drops to break Up[6.9] and coalesce[IO·12] is reduced. This will affect the balance of
the rates of the break up and coalescence and may lead to an increase in the size of drops.
Suspension polymerization reactions produce particles with a broad size distribution. This is
because different mechanisms for particle formation might coexist in suspension
polymerization[l3]. Three size classes of particles can be obtained from a suspension
polymerization reactor. They are bead particles, satellite particles, and emulsion particles.
Satellite particles are the result of the drop break up mechanism and/or nonhomogenities of
the system[3]. Experimental evidence and model predictions have been presented to show that
drops deform and burst into daughter drops and a number of satellite droplets[l4.16]. Emulsion
particles are the result of partial dissolution of the initiator in the water phase that gives free
radicals that propagate to form new particles in the aqueous phase. These particles are usually
smaller than the satellite particles.
In this paper, the characteristics of a model MMA suspension polymerization in the presence
of polyvinyl alcohol (PV A) as stabilizer are studied. The evolution of drop/particle size and
size distribution is compared with those in the corresponding MMA-water dispersion and
some general conclusions are made.
Experimental
MMA (analytical grade from Aldrich) was distilled at reduced pressure. PV A (Mw = 85000-
146000, degree of hydrolysis = 87-89% from Aldrich) and lauroyl peroxide (LPO) (97%,
2

APPENDICES
from Aldrich) were used as stabilizer and initiator, respectively, without any further
purification. Distilled water was used as continuous phase. The monomer volume fraction
was 0.20 and different PV A concentrations were used. The suspension polymerization and
dispersion used similar formulation, with the exception that in the suspension polymerization
experiments an initiator concentration of 1.0 wt% (based on the monomer phase) was used.
The experiments were carried out using a one-litre jacketed glass reactor equipped with four
90° baffles. A four-paddle impeller was used for agitation. The stirring speed was 500 rpm
for all experiments. The temperature of the vessel content was continuously monitored using
a thermocouple and controlled within ± 0.5°C of the desired reaction temperature (70°C). In
suspension polymerization experiments nitrogen purging of the aqueous phase was carried
out for 30 minutes before the monomer phase was added. Samples were withdrawn at the
desired time intervals from the reaction vessel, using a hypodermic syringe, to measure the
monomer conversion gravimetrically. Drop/particle size distributions were determined by
using a laser diffraction particle sizer (Coulter LS I 30).
Results and Discussion
Dynamic Steady State
The evolution of the Sauter mean diameter (d32) of the MMA-water dispersion with 0.5 gll
PVA is shown in Figure I. In the dispersion process (without polymerization), the evolution
of drop size can be divided into two stages; transition and steady state. The steady state drop
size distribution in liquid-liquid dispersions will mainly depend on the relative magnitude of
the rates of drop break up and coalescence. At steady state, when the rates of drop break up
and coalescence are balanced, coalescence removes as many drops from the dispersion as are
made via the break up mechanism. This has been called a dynamic steady state where
individual drops do not retain a unique identity but undergo continuous break up and
coalescence.
Figure 1 also illustrates the evolution of d32 in the corresponding suspension polymerization
with 0.5 g/I PV A. Similar to the dispersion process, during the transition stage drops are
reduced in size, until they reach an almost constant average size. It can be seen that drops are
less severely broken up during the transition stage for the suspension polymerization process
3

APPENDICES
in comparison with the dispersion process. This implies that the formation of even a very
small amount of polymer in monomer drops, during the first few minutes of suspension
polymerization, suppresses the rate of drop break up and as a result larger drop sizes are
formed at the end of this interval. The quasi steady-state drop size is established at a higher
value for the suspension polymerization. Enhanced drop stability with adding a very small
amount of polymer has been reported by Dowding et al.[III.
According to Figure I, the particles start to grow at the time of 45 min and a steep rise in the
drop size is observed at 60 min. Conversion-time data for this polymerization system shows a
steep rise in the rate of polymerization at the time of 60 min, corresponding to the conversion
of 0.50 (see the small graph in Figure 3). The acceleration in the rate of polymerization is the
result of the gel effect which is caused by the increase in the drop viscosity. It should be
noted here that the PV A concentration was found to have no effect on the rate of
polymerization or conversion-time curve.
Based on the variations of drop size, as shown in Figure I, the pattern of variation in drop
size with time after the end of the transition stage can be characterised by up to three intervals
depending on the polymerization conditions. The first interval is the steady-state stage during
which a rather constant drop size is maintained by balanced rates of drop break up and
coalescence despite an increase in the drop viscosity. A short quasi steady-state stage can be
seen for the conditions given in Figure 1. The presence of a quasi steady state for suspension
polymerization is not always certain and sometimes that condition is never reached. Even for
the dispersion processes there is some reduction in the size of drops with time during the
steady-state stage. However, such variations are relatively limited.
200,-----------,
150 polytrerization
dispersion
o+--___ - __ ~_~
o 30 60 90 120 150 time (min)
Figure 1- Comparison of evolution of d32 in the suspension polymerization of MMA and in the corresponding dispersion ([PVAj=O.5 gIl).
0.25 ,-----------, poly~rization: ... Q ••• 0.5 rnin ..
~ 0.2
~ 0.15 .:: • § 0.1
~ 0.05
10 lOO diameter (1lID)
1000
Figure 2- Evoluion of drop/paerticle size distribution for the systems shown in Figure 1.
4

APPENDICES
As the drop viscosity increases, a point is reached where drops can not be easily broken up
but tbey can still undergo coalescence. As a result, drops start growing by coalescence. This
interval can be called growth stage. This stage has been called the sticky stage in the
literature perhaps because of the impression that drop coalescence increases with the drop
viscosity due to increasing drop tackiness. However, the present authors believe that this is a
misleading title because, during this interval, particles are usually more stable against
coalescence than in the earlier stage because of reduced mobility of the surface of drops. The
viscosity increase in the drops reduces the rate of drop break up more significantly than drop
coalescence resulting in an increase in the size of particles [171. The abrupt increase in the size
of drop during tbe growth stage is a direct result of a sudden viscosity build up in the drops
because of the gel effect.
At the end of the growth stage, drops have a very high viscosity and behave like solid
particles. These drops cannot coalesce with each other and they keep their identity for the
remainder of the process. This has been called identification point. Variations in average drop
size occur in both the transition stage and the growth stage but sizes remain almost constant
during the steady state and during the identification stage (i.e., after the indentification point
is reached); although some limited flocculation may occur during the identification stage.
Figure 2 shows that the size and size distribution of the reacting and non-reacting drops in the
first minutes are similar. Later, during the transition period, the size distribution of both types
of drops narrow significantly with time, due to a higher rate of drop break up in comparison
with drop coalescence, until a steady-state value is reached. For the dispersion, the size
distribution of drops does not change appreciably after the steady-state, but the size
distribution of the reacting drops broadens with time when d32 changes as shown in Figure 1.
Static Steady State
Figure 3 illustrates the evolution of d32 in the suspension polymerization of MMA and in the
corresponding MMA dispersion with 10 gll PV A. For the dispersion process, a similar trend
as to that found for 0.5 g/l PVA was obtained. For the suspension polymerization, however,
the pattern was different from the suspension polymerization with 0.5 glJ PVA, but it was
very similar to that found for the dispersions. In a liquid-liquid dispersion if drops are
5

APPENDICES
reduced to a size that cannot be further broken by agitation and if they are also sufficiently
protected against drop coalescence, then drops do not undergo any transformation during
mixing and a static steady-state may be established. Such a dispersion has been called a
turbulent-stabilized dispersion by Church and Shinnar[41. Static steady-state can actually be
achieved, or approached, if a high concentration of stabilizer, for example, is used. The
resulting drops from such dispersions would be very small. Figure 3 shows that the increase
in drop size is very small in the growth stage for the polymerizing drops despite the large
increase in the drop viscosity.
Figure 4 depicts the evolution of drop/particle size distribution for conditions corresponding
to those shown in Figure 3. For the suspension polymerization, particle growth and PSD
broadening occurred to a very limited extent. It is expected that, at a higher PV A
concentration, coalescence can be completely removed from the system and the evolution of
drop size average and size distribution in suspension polymerizations follow similar trends to
those in the corresponding dispersions. The experimental data from Konno et al. [l8J for the
suspension polymerization of styrene with 10 gll PV A provides an evidence for such a claim.
Although the size measurements with optical microscopy, as used by Konno et al.[l81, may
not be sufficiently sensitive to small variations in particle size.
200
'12J Q
.~ =1=
150 ~0.5 et ~
= ",of
e 8 0 ",+T
5100 ... 0 50 ~
"= poJytrerization 50 la,
0 dispersion
0 30 60 90 120 time (min)
Figure 3- Comparison of evoJution of d" in the suspension polymerization of MMA and in the corresponding dispersion ([PVA]=IO gIl).
lOO
150
0.25
~ Cl 0.2 = ~ 0.15
./:: .. 0.1 .§
= ... 0.05
0
poJytrerization: ........ 0.5 min -·<)-·60min ~fmalPSD
dispersion: ....... 0.5 min
-··_·60min --I20min
IO 100 lOOO diameter (~m)
Figure 4· Evolution of drop/particle size distribution for the systems shown in Figure 3.
6

APPENDICES
Satellite Droplets
The size distributions of drops/particles from the suspension polymerizations and dispersions
were all bimodal. Figure 5 illustrates a typical PSD measured by using laser diffraction. The
drop/particle size distributions included a main or primary peak corresponding to bead
drops/particles within the size range of 10-300 J1m. That was accompanied by a small
secondary peak given by drop/particles with diameters less than 10 J1m. The secondary peak
is mainly the cumulative result of satellite droplet formation from drop break up but there is a
partial contibution from particle formation via dispersion and/or emulsion polymerization
mechanisms. Study on the secondary peak has been rarely reported in the literature[19.20l. We
used an initiator with very limited water solubility, lauroyl peroxide, to minimize the
formation of emulsion particles. The secondary peaks are not shown in Figures 2 and 4 and
were ignored in the calculation of d32 for simplicity.
0.15 0.02,---------------,
~ ~0.1O ..
..:: .. § 0.05 -= ..
0.00
0.005
0
0.1
0.1
~ I 10 ... ) , , , ,
I 10 diameter (I1m)
Figure 5- A typical drop size distribution in Suspension polymerization of MMA (t=60 min. [PV A]=lO gll).
lOO
... ~ 0.015
.t _ 0.01 ..
.§ ~ 0.005
polymerization: •• ,,,···0.5 min -·~·-60min ---+- fmal PSD
dispersion: _ .. _. 0.5 min .. ·····60 min --120min
0.1
Figure 6- Evolution of satellite size distribution for the systems shown in Figure 5.
Figure 6 illustrates evolution of the size distribution of secondary particles for suspension
polymerization of MMA with 10 gIl PV A and for the corresponding dispersion. Satellite
droplets were continuously formed with time in the dispersion system. For the polymerization
system the satellite size distribution is narrower and smaller in comparison with the
corresponding dispersion which can be the result of increasing viscosity in polymerizing
drops. In suspension polymerizations with lower PV A concentration the population of
7
10

APPENDICES
satellite droplets dropped significantly during the growth stage because of coalescence and/or
flocculation.
Conclusion
The evolution of drop/particle size distribution in suspension polymerization may pass
through four intervals; transition, steady-state, growth and identification stages. As the
stability of drops in a suspension polymerization is enhanced, by increasing stabilizer
concentration for example, the evolution of drop size distribution approaches that in the
corresponding dispersion. That evolution is characterized by a transition stage followed by a
steady-state stage. That can only occur if the dynamic steady state can transform to a static
one. The size average and distribution of satellite particles obtained via suspension
polymerization were smaller and narrower, respectively, than those found in the
corresponding dispersion at the conditions of this study. The results suggest that tracking of
the evolution of satellite particles could lead to a better understanding of the mechanism of
drop formation in suspension polymerization.
References
[I] B.W. Brooks, Makromol. Chem. Macromol. Symp. 1990,35/36, 121 [2] H.G. Yuan, G. Kalfas, W.H. Ray, J. Macromol. Sci., Rev. Macromol. Chem. Phys., 1991, C3 I (2&3), 215. [3] E. Vivaldo-Lima, P.E. Wood, A.E. Ramielec, A. Penlidis, Ind. Eng. Chem. Res. 1997,36,939. [4] J.M. Church, R Shinnar, Ind. Eng. Chem 1961,53,479. [5] P.O. Hong, J.M. Lee, Ind. Eng. Chem. Process Des. Dev. 1985,24, 86S. [6] J.O. Hinze, AlChE J. 1955, I, 950. [7] RV. Calabrese, T.P.K. Chang, P.T. Dang, AIChE J. 1986,32(4),657. [S] A. Koshy, T.R. Das, R Kumar, K.S. Gandhi, Chem. Eng. Sci. 1988,43(10),2625. [9] A.N. Sathyagal, D. Ramkrishna, G. Narimhan, Chem. Eng. Sci. 1996,51(9),1377. [10] S. Liu, D. Li, Chem. Eng. Sci. 1999, 54, 5667. [11] PJ. Dowding, J.W. Goodwin, B. Vincent, Colloid Polym Sci. 2000, 27S, 346. [12] S. Hashim, B.W. Brooks, Chem. Eng. Sci. 2002, 57(17), 3703. [13] M.F. Cunningharn, Polym. React. Eng., 1999, 7(2), 231. [14] G. Narsimhan, D. Ramkrishna, J.P. Gupta, AIChE J., 1980, 26, 991. [15] E.G. Chatzi, A.D. Gavrielides, C. Kiparissides, Ind. Eng. Chem. Res. 1989, 2S, 1704. [16] E.G. Chatzi, C. Kiparissides, AIChE J.,1995, 41(7),1640. [17] J. Alvarez, J.J. Alvarez, M.A. Hemandez, Chem. Eng. Sci. 1994, 49(1), 99. [IS] M. Konno, K. Arai, S. Saito, J. Chem. Eng. Japan 1982,15(2),131. [19] G. Polacco, M. Palla, D. Semino, Polym. Int. 1999, 4S, 392. [20] C. Desnoyer, O. Masbemat, C. Gourdon, Chem. Eng. Sci. 2003, 5S(7), 1353.
S

I i

--------------------