
EVOLUTION OF IDEAS ON THE PRIMARY VISUAL … › uploads › 2018 › 06 ›...
33
EVOLUTION OF IDEAS ON THE PRIMARY VISUAL CORTEX, 1955-1978: A BIASED HISTORICAL ACCOUNT Nobel lecture, 8 December 1981 by DAVID H. HUBEL Harvard Medical School, Department of Neurobiology, Boston, Massachusetts, U.S.A. INTRODUCTION In the early spring of 1958 I drove over to Baltimore from Washington, D.C., and in a cafeteria at Johns Hopkins Hospital met Stephen Kuffler and Torsten Wiesel, for a discussion that was more momentous for Torsten’s and my future than either of us could have possibly imagined. I had been at Walter Reed Army Institute of Research for three years, in the Neuropsychiatry Section headed by David Rioch, working under the supervi- sion of M.G.F. Fuortes. I began at Walter Reed by developing a tungsten microelectrode and a technique for using it to record from chronically implant- ed cats, and I had been comparing the firing of cells in the visual pathways of sleeping and waking animals. It was time for a change in my research tactics. In sleeping cats only diffuse light could reach the retina through the closed eyelids. Whether the cat was asleep or awake with eyes open, diffuse light failed to stimulate the cells in the striate cortex. In waking animals I had succeeded in activating many cells with moving spots on a screen, and had found that some cells were very selective in that they responded when a spot moved in one direction across the screen (e.g. from left to right) but not when it moved in the opposite direction (1) (Fig. 1). There were many cells that I could not influence at all. Obviously there was a gold mine in the visual cortex, but methods were needed that would permit the recording of single cells for many hours, and with the eyes immobilized, if the mine were ever to begin producing. I had planned to do a postdoctoral fellowship at Johns Hopkins Medical School with Vernon Mountcastle, but the timing was awkward for him because he was remodeling his laboratories. One day Kuffler called and asked if I would like to work in his laboratory at the Wilmer Institute of Ophthalmology at the Johns Hopkins Hospital with Torsten Wiesel, until the remodeling was completed. That was expected to take about a year. I didn’t have to be persuaded; some rigorous training in vision was just what I needed, and though Kuffler himself was no longer working in vision the tradition had been main- tained in his laboratory. Torsten and I had visited each other’s laboratories and it was clear that we had common interests and similar outlooks. Kuffler 24
Transcript of EVOLUTION OF IDEAS ON THE PRIMARY VISUAL … › uploads › 2018 › 06 ›...
EVOLUTION OF IDEAS ON THE PRIMARYVISUAL CORTEX, 1955-1978:A BIASED HISTORICAL ACCOUNT
Nobel lecture, 8 December 1981
byDAVID H. HUBEL
Harvard Medical School, Department of Neurobiology,Boston, Massachusetts, U.S.A.
I N T R O D U C T I O N
In the early spring of 1958 I drove over to Baltimore from Washington, D.C.,and in a cafeteria at Johns Hopkins Hospital met Stephen Kuffler and TorstenWiesel, for a discussion that was more momentous for Torsten’s and my futurethan either of us could have possibly imagined.
I had been at Walter Reed Army Institute of Research for three years, in theNeuropsychiatry Section headed by David Rioch, working under the supervi-sion of M.G.F. Fuortes. I began at Walter Reed by developing a tungstenmicroelectrode and a technique for using it to record from chronically implant-ed cats, and I had been comparing the firing of cells in the visual pathways ofsleeping and waking animals.
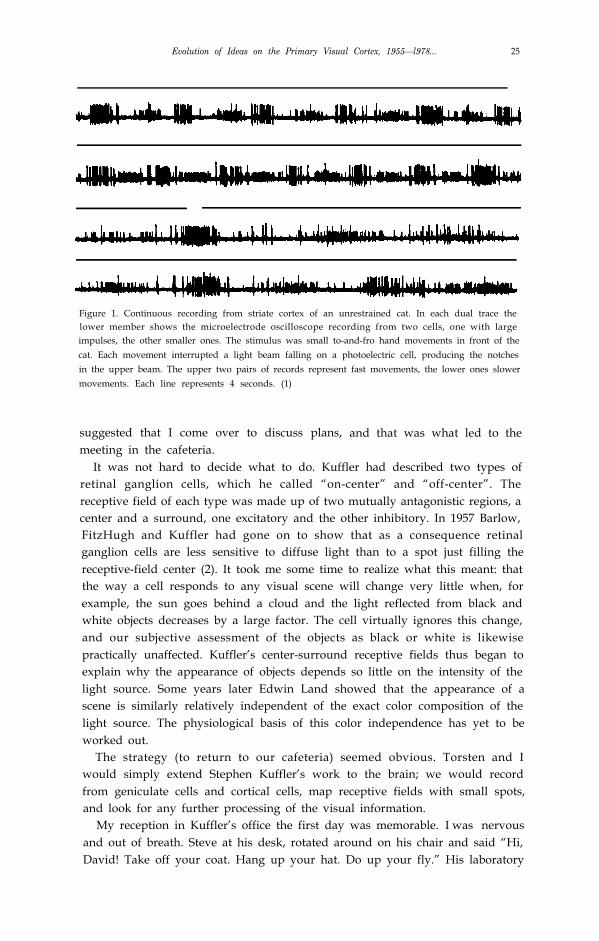
It was time for a change in my research tactics. In sleeping cats only diffuselight could reach the retina through the closed eyelids. Whether the cat wasasleep or awake with eyes open, diffuse light failed to stimulate the cells in thestriate cortex. In waking animals I had succeeded in activating many cells withmoving spots on a screen, and had found that some cells were very selective inthat they responded when a spot moved in one direction across the screen (e.g.from left to right) but not when it moved in the opposite direction (1) (Fig. 1).There were many cells that I could not influence at all. Obviously there was agold mine in the visual cortex, but methods were needed that would permit therecording of single cells for many hours, and with the eyes immobilized, if themine were ever to begin producing.
I had planned to do a postdoctoral fellowship at Johns Hopkins MedicalSchool with Vernon Mountcastle, but the timing was awkward for him becausehe was remodeling his laboratories. One day Kuffler called and asked if Iwould like to work in his laboratory at the Wilmer Institute of Ophthalmologyat the Johns Hopkins Hospital with Torsten Wiesel, until the remodeling wascompleted. That was expected to take about a year. I didn’t have to bepersuaded; some rigorous training in vision was just what I needed, and thoughKuffler himself was no longer working in vision the tradition had been main-tained in his laboratory. Torsten and I had visited each other’s laboratoriesand it was clear that we had common interests and similar outlooks. Kuffler
24
Evolution of Ideas on the Primary Visual Cortex, 1955—l978... 25
Figure 1. Continuous recording from striate cortex of an unrestrained cat. In each dual trace thelower member shows the microelectrode oscilloscope recording from two cells, one with largeimpulses, the other smaller ones. The stimulus was small to-and-fro hand movements in front of thecat. Each movement interrupted a light beam falling on a photoelectric cell, producing the notchesin the upper beam. The upper two pairs of records represent fast movements, the lower ones slowermovements. Each line represents 4 seconds. (1)
suggested that I come over to discuss plans, and that was what led to themeeting in the cafeteria.
It was not hard to decide what to do. Kuffler had described two types ofretinal ganglion cells, which he called “on-center” and “off-center”. Thereceptive field of each type was made up of two mutually antagonistic regions, acenter and a surround, one excitatory and the other inhibitory. In 1957 Barlow,FitzHugh and Kuffler had gone on to show that as a consequence retinalganglion cells are less sensitive to diffuse light than to a spot just filling thereceptive-field center (2). It took me some time to realize what this meant: thatthe way a cell responds to any visual scene will change very little when, forexample, the sun goes behind a cloud and the light reflected from black andwhite objects decreases by a large factor. The cell virtually ignores this change,and our subjective assessment of the objects as black or white is likewisepractically unaffected. Kuffler’s center-surround receptive fields thus began toexplain why the appearance of objects depends so little on the intensity of thelight source. Some years later Edwin Land showed that the appearance of ascene is similarly relatively independent of the exact color composition of thelight source. The physiological basis of this color independence has yet to beworked out.
The strategy (to return to our cafeteria) seemed obvious. Torsten and Iwould simply extend Stephen Kuffler’s work to the brain; we would recordfrom geniculate cells and cortical cells, map receptive fields with small spots,and look for any further processing of the visual information.
My reception in Kuffler’s office the first day was memorable. I was nervousand out of breath. Steve at his desk, rotated around on his chair and said “Hi,David! Take off your coat. Hang up your hat. Do up your fly.” His laboratory

26 Physiology or Medicine 1981
was informal! But it took me a month, given my Canadian upbringing, to forcemyself to call him Steve. For the first three months no paycheck arrived andfinally I screwed up the courage to go in and tell him. He laughed and laughed,and then said “I forgot!”
Torsten and I didn’t waste much time. Within a week of my coming toHopkins (to a dark and dingy inner windowless room of the Wilmer Institutebasement, deemed ideal for visual studies) we did our first experiment. For thetime being we finessed the geniculate (at Walter Reed I had convinced myselfthat geniculate cells were center-surround) and began right away with cortex.The going was rough. We had only the equipment for retinal stimulation andrecording that had been designed a few years before by Talbot and Kuffler (3).A piece of apparatus resembling a small cyclotron held the anesthetized andparalyzed cat with its head facing almost directly upwards. A modified oph-thalmoscope projected a background light and a spot stimulus onto the retina.The experimenter could look in, see the retina with its optic disc, area centralisand blood vessels, and observe the background light and the stimulus spots.Small spots of light were produced by sliding 2 cm X 5 cm metal rectanglescontaining various sizes of holes into a slot in the apparatus, just as one puts aslide into a slide projector. To obtain a black spot on a light background oneused a piece of glass like a microscope slide, onto which a black dot had beenglued. All this was ideal for stimulating the retina and recording directly fromretinal ganglion cells, since one could see the electrode tip and know where tostimulate, but for cortical recording it was horrible. Finding a receptive field onthe retina was difficult, and we could never remember what part of the retinawe had stimulated. After a month or so WC decided to have the cat face aprojection screen, as I had at Walter Reed and as Talbot and Marshall had in1941 (4). Having no other head holder, WC continued for a while to use theophthalmoscope’s head holder, which posed a problem since the cat was facingdirectly up. To solve this we brought in some bed sheets which we slungbetween the pipes and cobwebs that graced the ceiling of the Wilmcr basement,giving the setup the aura of a circus tent. On the sheets we projected our spotsand slits. One day Vernon Mountcastle walked in on this scene, and was horrorstruck at the spectacle. The method was certainly inconvenient since we had tostare at the ceiling for the entire experiment. Then I remembered having seenin Mountcastle’s laboratory a Horsley-Clarke head holder that was not only nolonger being used but also had the name of the Wilmer Institute engraved on it.It was no other than the instrument that Talbot had designed for visual workwhen he and Marshall mapped out visual areas I and II in the cat, in 1941 (4).For years Vernon had used it in his somatosensory work, but he had recentlyobtained a fancier one. Torsten and I decided to reclaim the Wilmer instru-ment, not without some trepidation. To give ourselves confidence we both puton lab coats, for the first and last times in our lives, and looking very profes-sional walked over to Physiology. Though Mountcastle was his usual friendlyand generous self, I suspect he was loath to part with this treasure, but theinscription on the stainless steel was not to be denied and we walked off with ittriumphantly. It is still in use (now at Harvard: we literally stole it from the
Evolution of Ideas on the Primary Visual Cortex, 1955-1978 … 27
Wilmer), and has probably the longest history of uninterrupted service of anyHorsley-Clarke in the world.
A short while before this adventure we had gone to a lecture by Vernon (thiswas a few years after his discovery of cortical columns) (5) in which he hadamazed us by reporting on the results of recording from some 900 somatosen-sory cortical cells, for those days an astronomic number. WC knew we couldnever catch up, so we catapulted ourselves to respectability by calling our firstcell No. 3000 and numbering subsequent ones from there. When Vernonvisited our circus tent we were in the middle of a S-unit recording, cell Nos.3007, 3008, and 3009. We made sure that we mentioned their identificationnumbers. All three cells had the same receptive-field orientation but neitherVernon nor we realized, then, what that implied.
At times we were peculiarly inept. Our first perfusion of a cat was typical.One morning at about 2:00 a.m. we had arranged two huge bottles on anoverhead shelf, for saline and formalin, and were switching over from saline toformalin when the rubber tubing came off the outlet of the formalin bottle andgave us an acrid early morning cold shower. We did not relish being preservedat so young an age! The reference to 2:00 a.m. perhaps deserves some com-ment, because neurophysiologists, at least those who study animals, have thereputation of doing experiments that last for days without respite. We soonfound that such schedules were not for us. I knew we were losing traction in anexperiment when Torsten began to talk to me in Swedish; usually this wasaround 3:00 a.m. The longest experiment we ever did was one in which Iarrived home just as my family was sitting down for breakfast. I had almostdriven off the road on the way back. At the risk of becoming what Mountcastletermed “part-time scientists” we decided to be more lenient with ourselves,giving the deteriorating condition of the animal as the official reason forstopping early.
Our first real discovery came about as a surprise. We had been doingexperiments for about a month. We were still using the Talbot-Kuffler ophthal-moscope and were not getting very far: the cells simply would not respond toour spots and annuli. One day we made an especially stable recording. (Wehad adapted my chronic recording system, which made use of Davies’ idea of aclosed chamber (6). to the acute experimental animals, and no vibrations shortof an earthquake were likely to dislodge things.) The cell in question lasted 9hours, and by the end we had a very different feeling about what the cortexmight be doing. For 3 or 4 hours we got absolutely nowhere. Then gradually webegan to elicit some vague and inconsistent responses by stimulating some-where in the midperiphery of the retina. We were inserting the glass slide withits black spot into the slot of the ophthalmoscope when suddenly over theaudiomonitor the cell went off like a machine gun. After some fussing andfiddling we found out what was happening. The response had nothing to dowith the black dot. As the glass slide was inserted its edge was casting onto theretina a faint but sharp shadow, a straight dark line on a light background.That was what the cell wanted, and it wanted it, moreover, in just one narrowrange of orientations.
28 Physiology or Medicine 1981
This was unheard of. It is hard, now, to think back and realize just how freewe were from any idea of what cortical cells might be doing in an animal’s dailylife. That the retinas mapped onto the visual cortex in a systematic way was ofcourse well known, but it was far from clear what this apparently unimagina-tive remapping was good for. It seemed inconceivable that the informationwould enter the cortex and leave it unmodified, especially when Kuffler’s workin the retina had made it so clear that interesting transformations took placethere between input and output . One heard the word “analysis” used todescribe what the cortex might be doing, but what one was to understand bythat vague term was never spelled out. In the somatosensory cortex, the onlyother cortical area being closely scrutinized, Mountcastle had found that thecells had properties not dramatically different from those of neurons at earlierstages.
Many of the ideas about cortical function then in circulation seem in retro-spect almost outrageous. One has only to remember the talk of “suppressorstrips”, reverberating circuits. or electrical field effects. This last notion wastaken so seriously that no less a figure than our laureate-colleague Roger Sperryhad had to put it to rest, in 1955, by dicing up the cortex with mica plates toinsulate the subdivisions, and by skewering it with tantalum wire to short outthe fields, neither of which procedures seriously impaired cortical function (7,8). Nevertheless the idea of ephaptic interactions was slow to die out. Therewere even doubts as to the existence of topographic representation, which wasviewed by some as a kind of artifact. One study, in which a spot of lightprojected anywhere in the retina evoked potentials all over the visual cortex,was interpreted as a refutation of topographic representation, but the resultalmost certainly came from working with a dark-adapted cat and a spot sobright that it scattered light all over the retina. It is surprising, in retrospect,that ideas of non-localization could survive in the face of the masterly mappingof visual fields onto the cortex in rabbit. cat and monkey done by Talbot andMarshall far back in 1941 (4).
It took us months to convince ourselves that we weren’t at the mercy of someoptical artifact, such as anyone can produce by squinting one’s eyes andmaking vertical rays emanate from street lights. We didn’t want to make foolsof ourselves quite so early in our careers. But recording in sequence in the samepenetration several cells with several different optimal orientations would. Ithink, have convinced anyone. By January we were ready to take the cells wethought we could understand (we later called them “simple cells”) and writethem up. Then as always what guided and sustained us was the attitude ofStephen Kuffler, who never lectured or preached but simply reacted withbuoyant enthusiasm whenever he thought we had found something interesting.and acted vague and noncommittal when hc found something dull. Neither ofus will ever forget writing our first abstract, for the International Congress ofPhysiology in 1959 (9). We labored over it, and finally gave a draft to Kuffler.The following day when I came in Torsten was looking more glum than usual,and said “I don’t think Steve much liked our abstract”. It was clear enoughthat Kuffler wasn’t quite satisfied: his comments and suggestions contained

Evolution of Ideas on the Primary Visual Cortex, 1955—l978 …
Figure 2. First draft our first abstract (8), showing comments by Kuffler.
more words than our original (Fig. 2) ! Writing, it may be added, did not comeeasy to either of us at the beginning, and our first paper, in 1959 (10) wentthrough eleven complete reworkings.
HIERARCHY OF VISUAL CELLS
During the years 1959-62, first at the Wilmer Institute and then at HarvardMedical School, we were mainly concerned with comparing responses of cellsin the lateral geniculate body and primary visual cortex of the cat. In the lateralgeniculate we quickly confirmed my Walter Reed finding that the receptive
30 Physiology or Medicine 1981
fields are like those of retinal ganglion cells in having an antagonistic concentriccenter-surround organization. But now we could compare directly the re-sponses of a geniculate cell with those of a fiber from an afferent retinalganglion cell, and we found that in geniculate cells the power of the receptive-field surround to cancel the input from the center was increased. This findingwas subsequently confirmed and extended in a beautiful set of experiments byCleland, Dubin and Levick (1l), and for many years remained the only knownfunction of the lateral geniculate body.
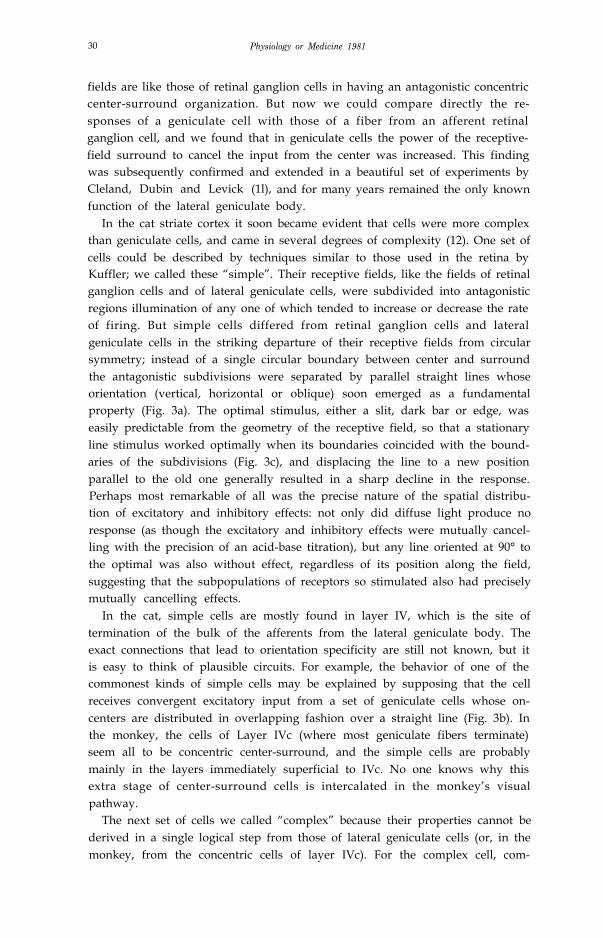
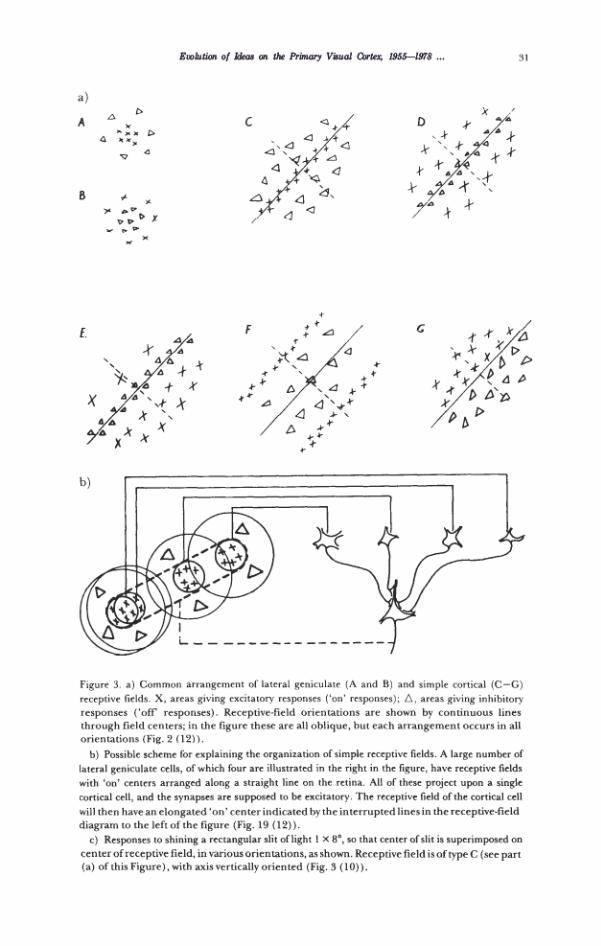
In the cat striate cortex it soon became evident that cells were more complexthan geniculate cells, and came in several degrees of complexity (12). One set ofcells could be described by techniques similar to those used in the retina byKuffler; we called these “simple”. Their receptive fields, like the fields of retinalganglion cells and of lateral geniculate cells, were subdivided into antagonisticregions illumination of any one of which tended to increase or decrease the rateof firing. But simple cells differed from retinal ganglion cells and lateralgeniculate cells in the striking departure of their receptive fields from circularsymmetry; instead of a single circular boundary between center and surroundthe antagonistic subdivisions were separated by parallel straight lines whoseorientation (vertical, horizontal or oblique) soon emerged as a fundamentalproperty (Fig. 3a). The optimal stimulus, either a slit, dark bar or edge, waseasily predictable from the geometry of the receptive field, so that a stationaryline stimulus worked optimally when its boundaries coincided with the bound-aries of the subdivisions (Fig. 3c), and displacing the line to a new positionparallel to the old one generally resulted in a sharp decline in the response.Perhaps most remarkable of all was the precise nature of the spatial distribu-tion of excitatory and inhibitory effects: not only did diffuse light produce noresponse (as though the excitatory and inhibitory effects were mutually cancel-ling with the precision of an acid-base titration), but any line oriented at 90° tothe optimal was also without effect, regardless of its position along the field,suggesting that the subpopulations of receptors so stimulated also had preciselymutually cancelling effects.
In the cat, simple cells are mostly found in layer IV, which is the site oftermination of the bulk of the afferents from the lateral geniculate body. Theexact connections that lead to orientation specificity are still not known, but itis easy to think of plausible circuits. For example, the behavior of one of thecommonest kinds of simple cells may be explained by supposing that the cellreceives convergent excitatory input from a set of geniculate cells whose on-centers are distributed in overlapping fashion over a straight line (Fig. 3b). Inthe monkey, the cells of Layer IVc (where most geniculate fibers terminate)seem all to be concentric center-surround, and the simple cells are probablymainly in the layers immediately superficial to IVc. No one knows why thisextra stage of center-surround cells is intercalated in the monkey’s visualpathway.
The next set of cells we called “complex” because their properties cannot bederived in a single logical step from those of lateral geniculate cells (or, in themonkey, from the concentric cells of layer IVc). For the complex cell, com-
E v ol uti o n of I d e a s o n t h e P ri m a r y Vi s u al C o rt e x, 1 9 5 5 —l 9 7 8 …
E
32 Physiology or Medicine I981
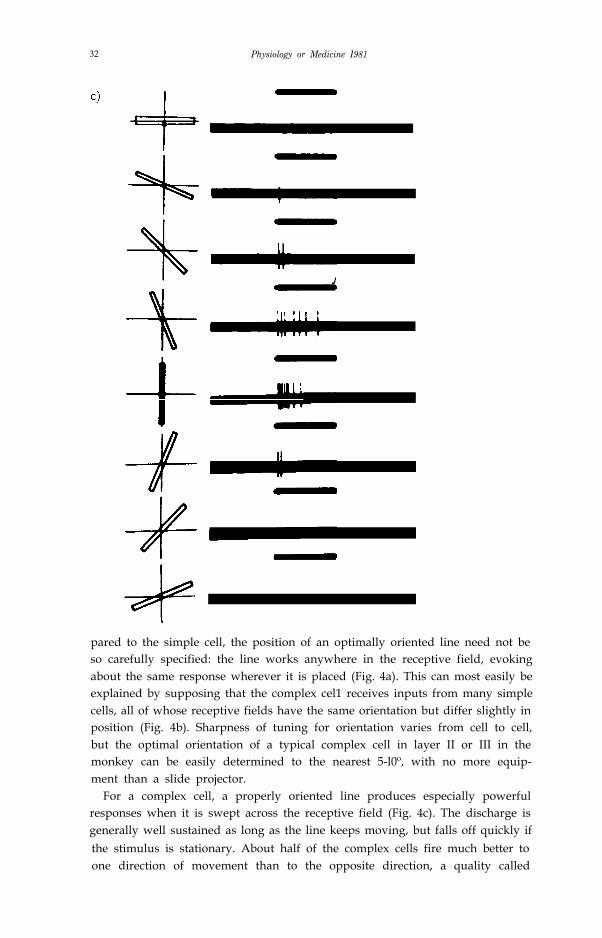
pared to the simple cell, the position of an optimally oriented line need not beso carefully specified: the line works anywhere in the receptive field, evokingabout the same response wherever it is placed (Fig. 4a). This can most easily beexplained by supposing that the complex cel1 receives inputs from many simplecells, all of whose receptive fields have the same orientation but differ slightly inposition (Fig. 4b). Sharpness of tuning for orientation varies from cell to cell,but the optimal orientation of a typical complex cell in layer II or III in themonkey can be easily determined to the nearest 5-l0º, with no more equip-ment than a slide projector.
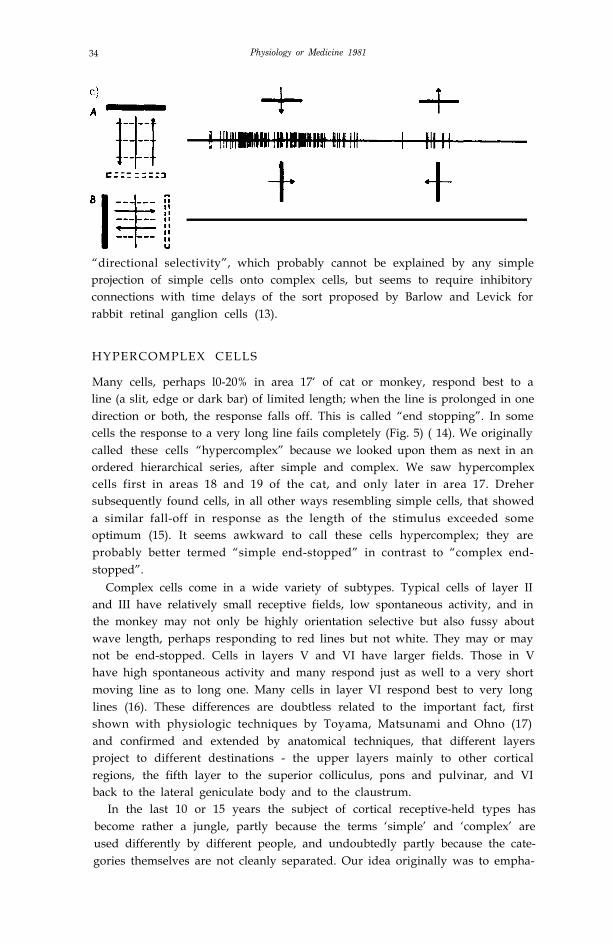
For a complex cell, a properly oriented line produces especially powerfulresponses when it is swept across the receptive field (Fig. 4c). The discharge isgenerally well sustained as long as the line keeps moving, but falls off quickly ifthe stimulus is stationary. About half of the complex cells fire much better toone direction of movement than to the opposite direction, a quality called
Evolution of Ideas on the Primary Visual Cortex, 1955—1978 … 33
a)
Figure 4. a) Complex cell responding best to a black horizontally oriented rectangle placedanywhere in the receptive field (A-C). Tilting the stimulus rendered it ineffective (D, E).
b) Same cell, showing response to a moving horizontal bar, downward movement betterthan upward (A), and no response to a moving vertical bar (B) Time 1 sec. (Figs. 7 and 8 (12)).
c) Possible scheme for explaining the organization of complex receptive fields. A number of cellswith simple fields, of which three are shown schematically, are imagined to project to a singlecortical cell of higher order. Each projecting neuron has a receptive field arranged as shown to theleft: an excitatory region to the left and an inhibitory region to the right of a vertical straight-lineboundary. The boundaries of the fields are staggered within an area outlined by the interruptedlines. Any vertical-edge stimulus falling across this rectangle, regardless of its position, willexcite some simple-field cells, leading to excitation of the higher-order cell. (Fig. 20 (12)).
34 Physiology or Medicine 1981
“directional selectivity”, which probably cannot be explained by any simpleprojection of simple cells onto complex cells, but seems to require inhibitoryconnections with time delays of the sort proposed by Barlow and Levick forrabbit retinal ganglion cells (13).
HYPERCOMPLEX CELLS
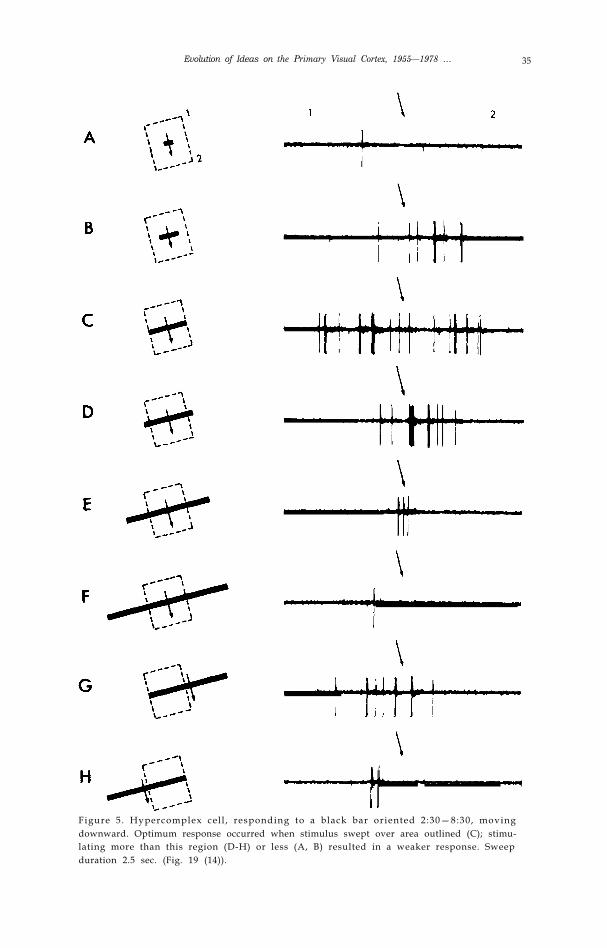
Many cells, perhaps l0-20% in area 17‘ of cat or monkey, respond best to aline (a slit, edge or dark bar) of limited length; when the line is prolonged in onedirection or both, the response falls off. This is called “end stopping”. In somecells the response to a very long line fails completely (Fig. 5) ( 14). We originallycalled these cells “hypercomplex” because we looked upon them as next in anordered hierarchical series, after simple and complex. We saw hypercomplexcells first in areas 18 and 19 of the cat, and only later in area 17. Drehersubsequently found cells, in all other ways resembling simple cells, that showeda similar fall-off in response as the length of the stimulus exceeded someoptimum (15). It seems awkward to call these cells hypercomplex; they areprobably better termed “simple end-stopped” in contrast to “complex end-stopped”.
Complex cells come in a wide variety of subtypes. Typical cells of layer IIand III have relatively small receptive fields, low spontaneous activity, and inthe monkey may not only be highly orientation selective but also fussy aboutwave length, perhaps responding to red lines but not white. They may or maynot be end-stopped. Cells in layers V and VI have larger fields. Those in Vhave high spontaneous activity and many respond just as well to a very shortmoving line as to long one. Many cells in layer VI respond best to very longlines (16). These differences are doubtless related to the important fact, firstshown with physiologic techniques by Toyama, Matsunami and Ohno (17)and confirmed and extended by anatomical techniques, that different layersproject to different destinations - the upper layers mainly to other corticalregions, the fifth layer to the superior colliculus, pons and pulvinar, and VIback to the lateral geniculate body and to the claustrum.
In the last 10 or 15 years the subject of cortical receptive-held types hasbecome rather a jungle, partly because the terms ‘simple’ and ‘complex’ areused differently by different people, and undoubtedly partly because the cate-gories themselves are not cleanly separated. Our idea originally was to empha-
Evolution of Ideas on the Primary Visual Cortex, 1955—1978 … 35
Figure 5. Hypercomplex cel l , responding to a black bar oriented 2:30—8:30, movingdownward. Optimum response occurred when stimulus swept over area outlined (C); stimu-lating more than this region (D-H) or less (A, B) resulted in a weaker response. Sweepduration 2.5 sec. (Fig. 19 (14)).
36 Physiology or Medicine 1981
size the tendency toward increased complexity as one moves centrally along thevisual path, and the possibility of accounting for a cell’s behavior in terms of itsinputs. The circuit diagrams we proposed were just a few examples from anumber of plausible possibilities. Even today the actual circuit by whichorientation specificity is derived from center-surround cells is not known, andindeed the techniques necessary for solving this may still not be available. Onecan nevertheless say that cells of different complexities, whose receptive fieldsare in the same part of the visual field and which have the same optimalorientation, are likely to be interconnected, whereas cells with different optimalorientations arc far less likely to be interconnected. In the monkey a majordifficulty with the hierarchical scheme as outlined here is the relative scarcity ofsimple cells, compared with the huge numbers of cells with concentric fields inIVc, or compared with the large number of complex cells above and belowlayer IV. The fact that the simple cells have been found mainly in layer IVbalso agrees badly with Jennifer Lund’s finding that layer IVcß projects not tolayer IVb but to layer III. One has to consider the possibility that in themonkey the simple-cell step may be skipped, perhaps by summing the inputsfrom cells in layer IV on dendrites of complex cells. In such a scheme eachmain dendritic branch of a complex cell would perform the function of a simplecell. All such speculation serves only to emphasize our ignorance of the exactway in which the properties of complex cells are built up.
Knowing how cortical cells respond !o some visual stimuli and ignore othersallows us to predict how a cell will react to any given visual scene. Most corticalcells respond poorly to diffuse light, so that when I gaze at a white object on adark background, say an egg, I know that those cells in my area 17 whosereceptive fields fall entirely within the boundaries of the object will be unaffect-cd. Only the fields that are cut by the borders of the egg will be influenced, andthen only if the local orientation of a border is about the same as the orientationof the receptive field. A slight change in position of the egg without changing itsorientation will produce a dramatic change in the population of activatedsimple cells, but a much smaller change in the activated complex cells.
Orientation-specific simple or complex cells “detect” or are specific for thedirection of a short line segment. The cells are thus best not thought of as “linedetectors”: they arc no more line detectors than they are curve detectors. If ourperception of a certain line or curve depends on simple or complex cells itpresumably depends on a whole set of them, and how the information fromsuch sets of cells is assembled at subsequent stages in the path, to build up whatwe call “percepts” of lines or curves (if indeed anything like that happens atall), is still a complete mystery.
A R C H I T E C T U R EWhen I began my training in neurophysiology at Walter Reed I was luckyenough to be influenced by new and vigorous traditions of experimental neuro-anatomy, represented by Walle Nauta, and by a new blend of neuroanatomyand neurophysiology represented at Walter Reed, Johns Hopkins, and theNational Institutes of Health by (among others) Jerzy Rose, Vernon Mount-
Evolution of Ideas on the Primary Visual Cortex, 1955—l978 … 37
castle, and Robert Galambos. One day very near the beginning of my term atWalter Reed, Jerzy Rose, on the steps of the Research Institute, very sternlytold me that I had better make it my business to know exactly where myrecording electrode was. I subsequently began to use the Hopkins – WalterReed technique of making one electrode track or several parallel tracks throughcortex, recording as many cells as possible in each track and then reconstruct-ing the tracks from the histology. This made it possible to work out theresponse properties of single cells and also to learn how they were grouped. Itwas put to use most dramatically by Vernon Mountcastle, whose discovery ofcolumns in the somatosensory cortex was surely the single most importantcontribution to the understanding of cerebral cortex since Cajal. Our additionto the reconstruction technique was the strategy of making multiple small(roughly 100 pm diameter) electrolytic lesions along each track by passingsmall currents through the tungsten electrodes. I worked out this method atWalter Reed by watching the coagulation produced at the electrode tip onpassing currents through egg white. The lesions made it possible to be sure ofthe positions of at least several points along a track; other positions weredetermined by interpolating depth readings of the microelectrode advancer.
By the early 1960s our research had extended into four different but overlap-ping areas. Closest to conventional neurophysiology was the working out ofresponse properties (i.e. receptive fields) of single cells. We became increas-ingly involved with architecture, the grouping of cells according to functioninto layers and columns, studied by track reconstructions. This led in turn toexperiments in which single-cell recording was combined with experimentalanatomy. It began when one day James Sprague called to tell us that his chiefhistological technician, Jane Chen, was moving to Boston and needed a job:could we take her? Luckily we did, and so, despite our not possessing anatomi-cal union cards, we acquired an expert in the Nauta method of making lesionsin nervous tissue and selectively staining the degenerating axons. It seemed aterrible waste not to use this method and we soon got the idea of working outdetailed pathways by making microelectrode lesions that were far smaller thanconventional lesions and could be precisely placed by recording with the sameelectrodes. It became possible to make lesions in single layers of the lateralgeniculate body, with results to be discussed shortly. Finally, still anotherphase of our work involved studies of newborn animals’ postnatal development,and the effects of distorting normal sensory experience in young animals. Thisbegan in 1962 and grew steadily. Torsten Wiesel will discuss these experi-ments.
Having mentioned Jane Chen, this is perhaps as good a place as any toacknowledge our tremendous debt to many research assistants who havehelped us over the past 22 years, especially to Jane and to Janet Wiitanen andBea Storai, and also to Jaye Robinson, Martha Egan, Joan Weisenbeck, KarenLarson, Sharon Mates, Debra Hamburger, Yu-Wen Wu, Sue Fenstemaker,Stella Chow, Sarah Kennedy, Maureen Packard and Mary Nastuk. For photo-graphic assistance I am grateful to Sandra Spinks, Carolyn Yoshikami andMarc Peloquin. In electronics and computers David Freeman has continued to

38 Physiology or Medicine 1981
amaze us with his wizardry for 12 years. And for secretarial help and preserva-tion of morale and sanity I want to thank Sheila Barton, Pat Schubert andOlivia Brum.
ORIENTATION COLUMNS
What our three simultaneously recorded cells, Nos. 3009, 3010 and 3011,mapped out on the overhead sheet in September 1958, with their parallelorientation axes and separate but overlapping field positions, were telling uswas that neighboring cells have similar orientations but slightly different
Figure 6. a) Brain of a macaque monkey, perfused with formalin, viewed from above and behind.The occipital lobe is demarcated in front by the lunate sulcus (L) and consists mainly of the striatecortex, area 17, which occupies most of the smooth surface, extending forward to the dotted line(the 17 – 18 border). If followed medially area 17 curves around the medial surface of the brain andcontinues in a complex buried fold, a part of which lies underneath the convexity and parallel to it.X marks the projection of the fovea; movement in the direction of the arrow corresponds tomovement along the horizon; movement along the dotted line, to movement down along thevertical midline of the visual field. The brain on removal from the skull does not, of course, lookexactly like this: the groove in the right hemisphere was made by removing a parasagittal block oftissue to produce the cross section of Fig. 6b. (Fig. 6a (29)).
b) Low power Nissl-stained section from a parasagittal block such as that of Fig. 6a. It is whatwould be seen if one could stand in the groove of 6a and look to the left. A marks the outerconvexity; B the buried fold, and arrows indicate the 17 – 18 borders, the upper right one of which isindicated by the dotted line in Fig. 6a. (Fig. 6b (29)).
c) Cross section through monkey striate cortex showing conventional layering designa-tions. W, white matter. Deeper layers (VI, V) of the buried fold of cortex are shown in the lowerpart of the figure (compare Fig. 6b). Cresyl violet. (Fig. 10 (29)).

Evolution of Ideas on the Primary Visual Cortex, 1955—1978 …
receptive-field positions. We of course knew about our visitor Mountcastle’ssomatosensory colums, and we began to suspect that cells might be grouped instriate cortex according to orientation; but to prove it was not easy.
Our first indication of the beauty of the arrangements of cell groupings camein 1961 in one of our first recordings from striate cortex of monkey, a spidermonkey named George. In one penetration, which went into the cortex at anangle of about 45° and was 2.5 mm long, we were struck right away bysomething we had only seen hints of before: as the electrode advanced theorientations of successively recorded cells progressed in small steps, of about10° for every advance of 50 µm. We began the penetration around 8:00 p.m.;five hours later we had recorded 53 successive orientations without a single

Physiology or Medicine I981
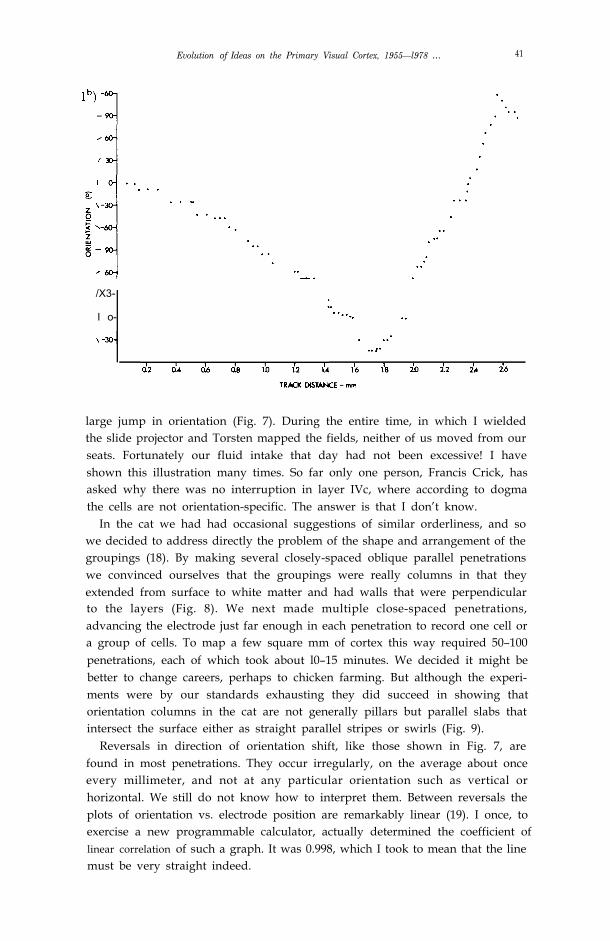
Figure 7. a) Reconstruction of a penetration through striate cortex about 1 mm from 17-18border, near occipital pole of a spider monkey called George. To the left of the figure the linesindicate receptive-field orientations of cells in the columns traversed; each line represents one orseveral units recorded against a rich unresolved background activity. Arrows indicate reversal ofdirections of shifts in orientation (32).
b) Graph of stimulus orientation in degrees vs. distance along electrode track in mm, in theexperiment shown in (a). Vertical is taken as O°, clockwise is positive, anticlockwise negative.
Evolution of Ideas on the Primary Visual Cortex, 1955—l978 … 41
/X3-
I o-
large jump in orientation (Fig. 7). During the entire time, in which I wieldedthe slide projector and Torsten mapped the fields, neither of us moved from ourseats. Fortunately our fluid intake that day had not been excessive! I haveshown this illustration many times. So far only one person, Francis Crick, hasasked why there was no interruption in layer IVc, where according to dogmathe cells are not orientation-specific. The answer is that I don’t know.
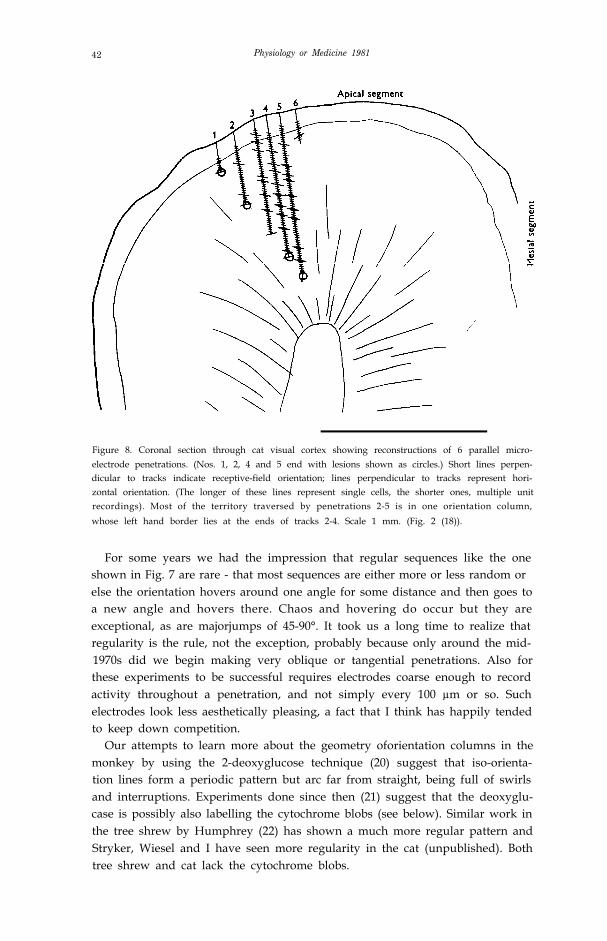
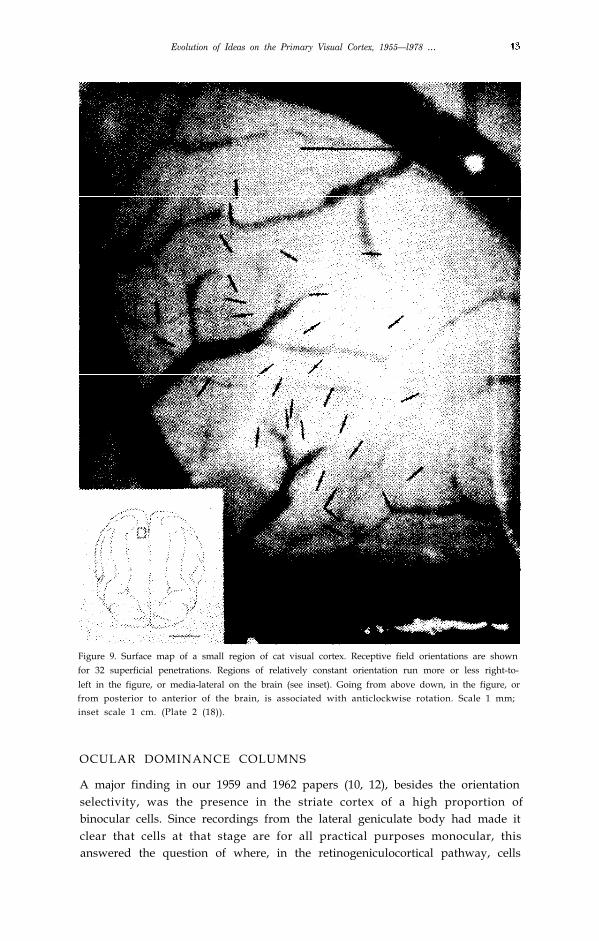
In the cat we had had occasional suggestions of similar orderliness, and sowe decided to address directly the problem of the shape and arrangement of thegroupings (18). By making several closely-spaced oblique parallel penetrationswe convinced ourselves that the groupings were really columns in that theyextended from surface to white matter and had walls that were perpendicularto the layers (Fig. 8). We next made multiple close-spaced penetrations,advancing the electrode just far enough in each penetration to record one cell ora group of cells. To map a few square mm of cortex this way required 50–100penetrations, each of which took about l0–15 minutes. We decided it might bebetter to change careers, perhaps to chicken farming. But although the experi-ments were by our standards exhausting they did succeed in showing thatorientation columns in the cat are not generally pillars but parallel slabs thatintersect the surface either as straight parallel stripes or swirls (Fig. 9).
Reversals in direction of orientation shift, like those shown in Fig. 7, arefound in most penetrations. They occur irregularly, on the average about onceevery millimeter, and not at any particular orientation such as vertical orhorizontal. We still do not know how to interpret them. Between reversals theplots of orientation vs. electrode position are remarkably linear (19). I once, toexercise a new programmable calculator, actually determined the coefficient oflinear correlation of such a graph. It was 0.998, which I took to mean that the linemust be very straight indeed.
42 Physiology or Medicine 1981
Figure 8. Coronal section through cat visual cortex showing reconstructions of 6 parallel micro-electrode penetrations. (Nos. 1, 2, 4 and 5 end with lesions shown as circles.) Short lines perpen-dicular to tracks indicate receptive-field orientation; lines perpendicular to tracks represent hori-zontal orientation. (The longer of these lines represent single cells, the shorter ones, multiple unitrecordings). Most of the territory traversed by penetrations 2-5 is in one orientation column,whose left hand border lies at the ends of tracks 2-4. Scale 1 mm. (Fig. 2 (18)).
For some years we had the impression that regular sequences like the oneshown in Fig. 7 are rare - that most sequences are either more or less random orelse the orientation hovers around one angle for some distance and then goes toa new angle and hovers there. Chaos and hovering do occur but they areexceptional, as are majorjumps of 45-90°. It took us a long time to realize thatregularity is the rule, not the exception, probably because only around the mid-1970s did we begin making very oblique or tangential penetrations. Also forthese experiments to be successful requires electrodes coarse enough to recordactivity throughout a penetration, and not simply every 100 µm or so. Suchelectrodes look less aesthetically pleasing, a fact that I think has happily tendedto keep down competition.
Our attempts to learn more about the geometry oforientation columns in themonkey by using the 2-deoxyglucose technique (20) suggest that iso-orienta-tion lines form a periodic pattern but arc far from straight, being full of swirlsand interruptions. Experiments done since then (21) suggest that the deoxyglu-case is possibly also labelling the cytochrome blobs (see below). Similar work inthe tree shrew by Humphrey (22) has shown a much more regular pattern andStryker, Wiesel and I have seen more regularity in the cat (unpublished). Bothtree shrew and cat lack the cytochrome blobs.
Evolution of Ideas on the Primary Visual Cortex, 1955—l978 …
Figure 9. Surface map of a small region of cat visual cortex. Receptive field orientations are shownfor 32 superficial penetrations. Regions of relatively constant orientation run more or less right-to-left in the figure, or media-lateral on the brain (see inset). Going from above down, in the figure, orfrom posterior to anterior of the brain, is associated with anticlockwise rotation. Scale 1 mm;inset scale 1 cm. (Plate 2 (18)).
OCULAR DOMINANCE COLUMNS
A major finding in our 1959 and 1962 papers (10, 12), besides the orientationselectivity, was the presence in the striate cortex of a high proportion ofbinocular cells. Since recordings from the lateral geniculate body had made itclear that cells at that stage are for all practical purposes monocular, thisanswered the question of where, in the retinogeniculocortical pathway, cells
44 Physiology or Medicine 1981
first received convergent input from the two eyes. More interesting to us thanthe mere binocularity was the similarity of a given cell’s receptive fields in thetwo eyes, in size, complexity, orientation and position. Presumably this formsthe basis of the fusion of the images in the two eyes. It still seems remarkablethat a cell should not only be wired with the precision necessary to producecomplex or hypercomplex properties, but should have a duplicate set of suchconnections, one from each eye. (That this is hard wired at birth will form someof the material for Torsten Wiesel’s lecture.) Though the optimum stimulus isthe same for the two eyes, the responses evoked are not necessarily equal; for agiven cell one eye is often better than the other. It is as if the two sets ofconnections were qualitatively similar but, for many cells, different in density.W C termed this relative effectiveness of the two eyes “eye preference” or“relative ocular dominance”.
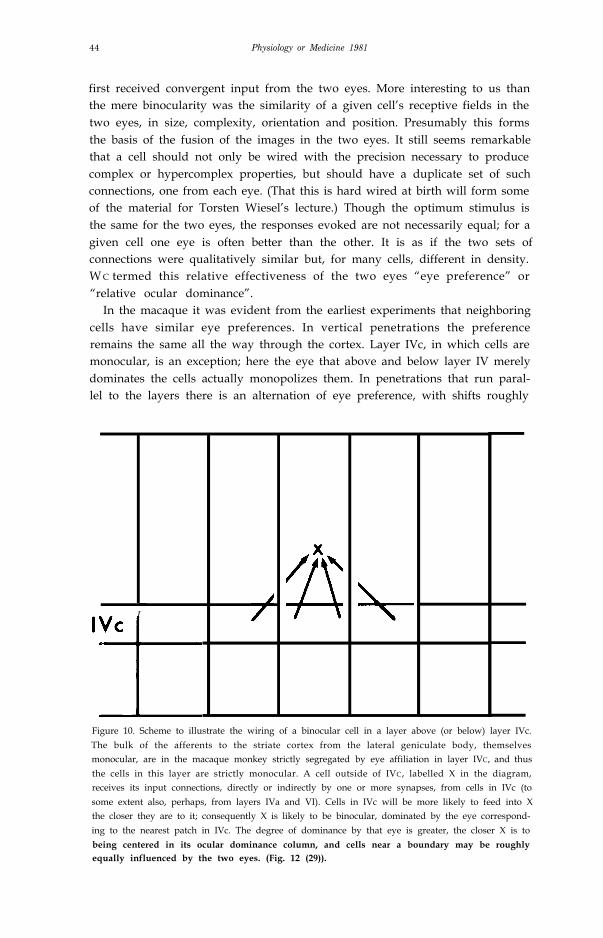
In the macaque it was evident from the earliest experiments that neighboringcells have similar eye preferences. In vertical penetrations the preferenceremains the same all the way through the cortex. Layer IVc, in which cells aremonocular, is an exception; here the eye that above and below layer IV merelydominates the cells actually monopolizes them. In penetrations that run paral-lel to the layers there is an alternation of eye preference, with shifts roughly
I
Figure 10. Scheme to illustrate the wiring of a binocular cell in a layer above (or below) layer IVc.The bulk of the afferents to the striate cortex from the lateral geniculate body, themselvesmonocular, are in the macaque monkey strictly segregated by eye affiliation in layer IVC, and thusthe cells in this layer are strictly monocular. A cell outside of IVC, labelled X in the diagram,receives its input connections, directly or indirectly by one or more synapses, from cells in IVc (tosome extent also, perhaps, from layers IVa and VI). Cells in IVc will be more likely to feed into Xthe closer they are to it; consequently X is likely to be binocular, dominated by the eye correspond-ing to the nearest patch in IVc. The degree of dominance by that eye is greater, the closer X is tobeing centered in its ocular dominance column, and cells near a boundary may be roughlyequally influenced by the two eyes. (Fig. 12 (29)).
Evolution of Ideas on the Primary Visual Cortex, 1955—I978 … 45
every 0.5 mm. The conclusion is that the terminals from cells of the lateralgeniculate distribute themselves in layer IVc according to eye of origin, inalternating patches about 0.5 mm wide. In the layers above and below layer IVhorizontal and diagonal connections lead to a mixing that is incomplete, so thata cell above a given patch is dominated by the eye supplying that patch butreceives subsidiary input from neigh boring patches (Fig. 10).
The geometry of these layer-IV patches interested us greatly, and was finallydetermined by several independent anatomical methods, the first of whichinvolved the Nauta method and modifications of the Nauta method for stainingterminals worked out first by Fink and Heimer and then by a most able andenergetic research assistant, Janet Wiitanen (23). By making small lesions insingle geniculate layers we were able to see the patchy distribution of degener-ating terminals in layer IV, which in a face-on view takes the form not ofcircumscribed patches but of parallel stripes. We also showed that the ventral(magnocellular) pair of layers projects to the upper half of IVc, (subsequentlycalled IVc a by Jennifer Lund), whereas the dorsal 4 layers project to the lowerhalf (IVc ß), and that the line of Gennari (IVb), once thought to receive thestrongest projection, is actually almost bereft of geniculate terminals.
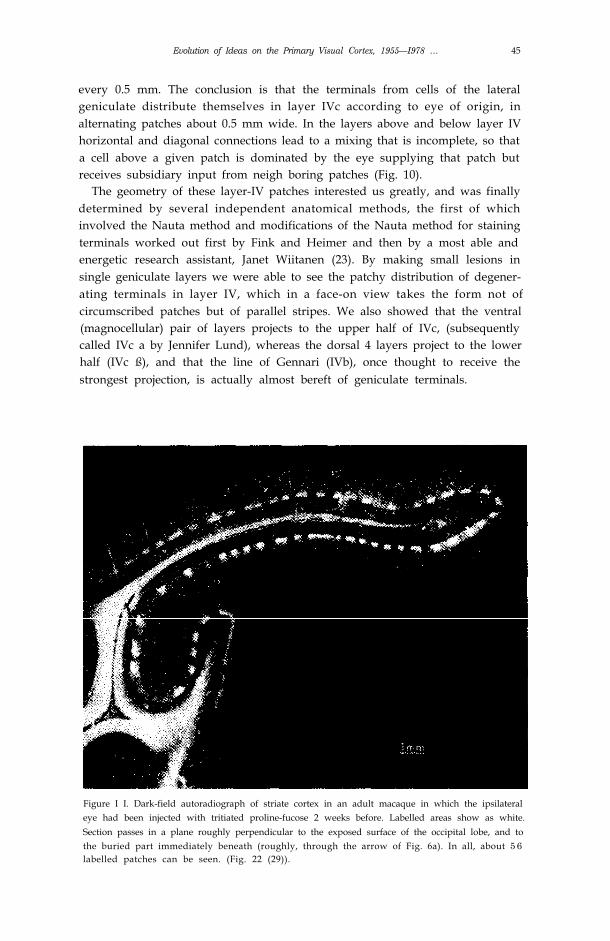
Figure I I. Dark-field autoradiograph of striate cortex in an adult macaque in which the ipsilateraleye had been injected with tritiated proline-fucose 2 weeks before. Labelled areas show as white.Section passes in a plane roughly perpendicular to the exposed surface of the occipital lobe, and tothe buried part immediately beneath (roughly, through the arrow of Fig. 6a). In all, about 5 6labelled patches can be seen. (Fig. 22 (29)).

46 l’hysiology or Medicine 1981
While the Nauta studies were still in progress we read a paper in whichBernice Grafstein reported that after injecting a radioactive aminoacid into theeye of a rat, radioactive label could be detected in the contralateral visualcortex, as though transneuronal transport had taken place in the geniculate(24). (The rat retinogeniculocortical pathway is mainly crossed.) It occurred tous that if we injected the eye of a monkey we might be able to see labelautoradiographically in area 17. We tried it, but could see nothing. Soon after,while visiting Ray Guillery in Wisconsin, I saw some aminoacid transportautoradiographs which showed nothing in light field but in which label wasperfectly obvious in dark field. I rushed back, we got out our slides, borrowed adark-field condenser, and found beautiful alternating patches throughout allthe binocular part of area 17 (25) (Fig. 11). This method allowed us toreconstruct ocular dominance columns over much wider expanses than couldbe mapped with the Nauta method (Fig. 12). It led to a study of the pre- andpostnatal visual development of ocular dominance columns, and the effects ofvisual deprivation on the columns, which Torsten will describe.
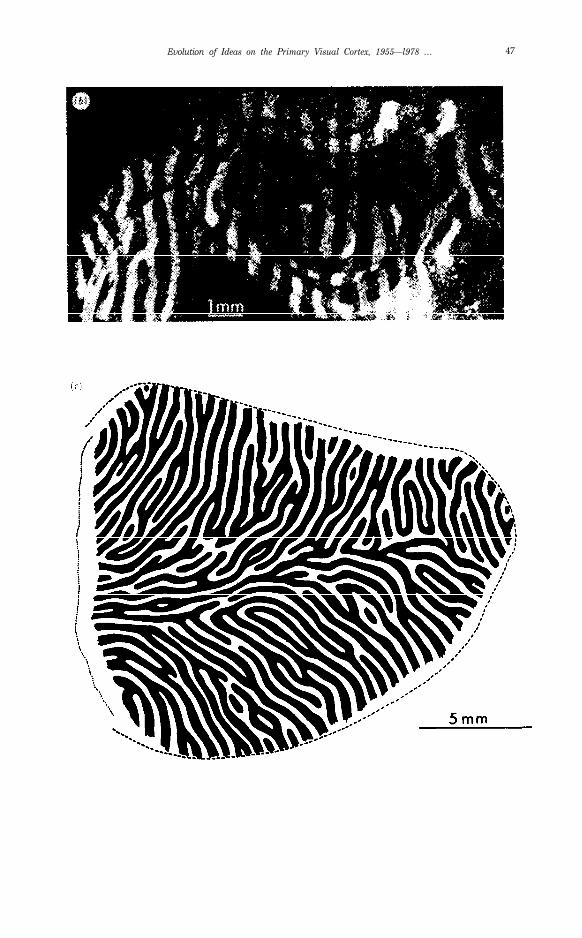
Figure 12. Autoradioagraphs from the same (normal) animal as Fig. 11, but hemispherecontralateral to the injected eye (dark field).
a) A section tangential to the exposed dome-like surface of the occipital lobe, just grazing layerV, which appears as an oval, surrounded by layer IVc. which appears as a ring containing thelabelled parallel bands: these appear as light against the dark background.
b) A composite made by cutting out layer IVc from a number of parallel sections such as the oneshown in (a), and pasting them together to show the bands over an area some millimeters in extent.
c) Reconstruction of layer IVc ocular dominance columns over the entire exposed part of area 17in the right occipital lobe, made from a series of reduced-silver sections (33). The region represent-ed is the same as the part of the right occipital lobe shown in Fig. 6a. Dotted line on the leftrepresents the midsagittal plane where the cortex bends around. Dashed c-shaped curve is the17-18 border, whose apex, to the extreme right, represents the fovea. Every other column hasbeen blackened in, so as to exhibit the twofold nature of the set of subdivisions. Note therelative constancy of column widths.
Evolution of Ideas on the Primary Visual Cortex, 1955—l978 … 47
48 Physiology or Medicine 1981
RELATIONSHIP BETWEEN COLUMNS, MAGNIFICATION ANDFIELD SIZE
To me the main pleasures of doing science are in getting ideas for experiments,doing surgery, designing and making equipment, and above all the rare mo-ments in which some apparently isolated facts click into place like a Chinesepuzzle. When a collaboration works, as ours has, the ideas and the clicking intoplace often occur simultaneously or collaboratively; usually neither of us hasknown (or cared) exactly where or from whom ideas came from, and sometimesone idea has occurred to one of us, only to be forgotten and later resurrected bythe other. One of the most exciting moments was the realization that ourorientation columns, extending through the full thickness of the cat cortex,contain just those simple and complex cells (later we could add the hypercom-plex) that our hierarchical schemes had proposed were interconnected (12).This gave the column a meaning: a little machine that takes care of contours ina certain orientation in a certain part of the visual field. If the cells of one set areto be interconnected, and to some extent isolated from neighboring sets, itmakes obvious sense to gather them together. As Lorente de Nó showed (26),most of the connections in the cortex run in an up-and-down direction; lateralor oblique connections tend to be short (mostly limited to 1 to 2 mm) and lessrich. These ideas were not entirely new, since Mountcastle had clearly enun-ciated the principle of the column as an independent unit of function. What wasnew in the visual cortex was a clear function, the transformation of informationfrom circularly symmetric form to orientation-specific form, and the stepwiseincrease in complexity.
A similar argument applies to the ocular dominance columns, a pair of whichconstitutes a machine for combining inputs from the two eyes-combining, butnot completely combining, in a peculiar grudging way and for reasons still notat all clear, but probably related in some way to stereopsis. (Whatever theexplanation of the systematically incomplete blending, it will have to take intoaccount the virtual but not complete absence of dominance columns in squirrelmonkeys.) If the eyes are to be kept functionally to some extent separate, it iseconomical of connections to pack together cells of a given eye preference.
To my mind our most aesthetically attractive and exciting formulation hasbeen the hypercolumn (not, I admit, a very attractive term!) and its relation tomagnification. The idea grew up gradually, but took an initial spurt as a resultof a question asked by Werner Reichardt during a seminar that I gave inTübingen. I had been describing the ordered orientation sequences found inmonkeys like George, when Werner asked how one avoided the difficultyarising from the fact that as you move across the cortex visual field position ischanging, in addition to orientation. Could this mean that if you looked closelyyou would find, in one small part of the visual field, only a small select group oforientations represented? The answer seemed obvious: I explained that in anyone part of the visual field all orientations are represented, in fact probablyseveral times over. Afterwards the question nagged me. There must be more toit than that. We began to put some seemingly isolated facts together. The visual

Evolution of Ideas on the Primary Visual Cortex, 1955—1978 … 49
fields map systematically onto the cortex but the map is distorted: the fovea isdisproportionately represented, with 1 mm about equivalent to l/6° of visualfield. As one goes out in the visual field the representation falls off, logarithmi-cally, as Daniel and Whitteridge had shown (27), so that in the far peripherythe relationship is more like 1 mm = 6°. Meanwhile the average size of recep-tive fields grows from center of gaze to periphery. This is not unexpected whenone considers that in the fovea our acuity is very much higher than in theperiphery. To do the job in more detail takes more cells, each looking after asmaller region; to accommodate the cells takes more cortical surface area. I hadalways been surprised that the part of the cortex representing the fovea is notobviously thicker than that representing the periphery: the surprise, I suppose,comes from the fact that in the retina near the fovea the ganglion cell layer ismany times thicker than in the periphery. The cortex must be going out of its
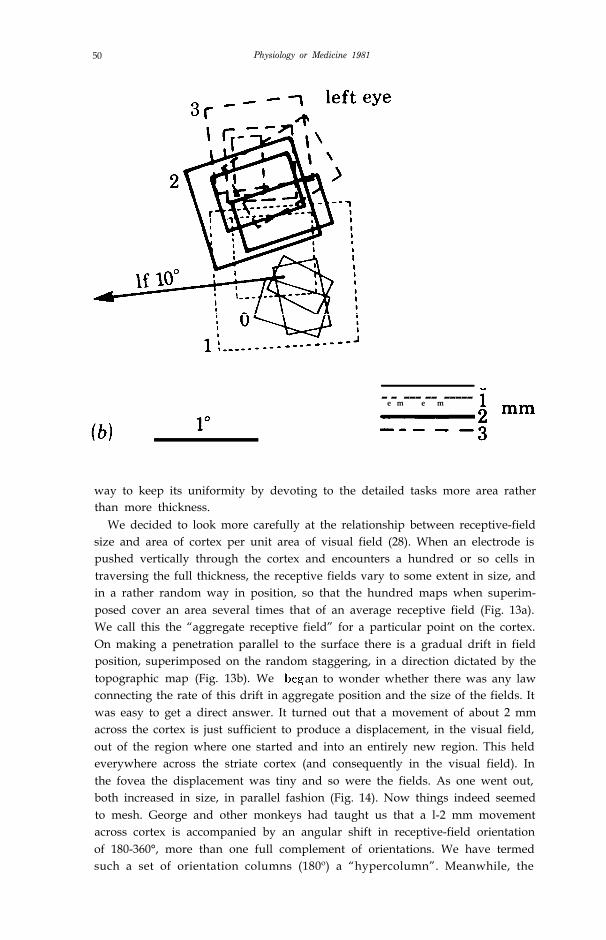
Figure 13. a) Receptive-field scatter: Receptive&Id boundaries of 17 cells recorded in a penetra-tion through monkey striate cortex in a direction perpendicular to the surface. Note the variation insize, and the more or less random scatter in the precise positions of the fields. The penetration wasmade in a part of the cortex corresponding to a visual field location 10º from the center of gaze, justabove the horizontal meridian. Fields are shown for one eye only. Numbers indicate the orderin which the cells were recorded. (Fig. 1 (28)).
b) Receptive-field drift: Receptive fields mapped during one oblique, almost tangential penetra-tion through striate cortex, in roughly the same region as in (a). A few fields were mapped alongeach of four 100 µm segments, spaced at 1 mm intervals. These four groups of fields are labelled 0,1, 2 and 3. Each new set of fields was slightly above the other, in the visual field, as predicted fromthe direction of movement of the electrode and from the topographic map of visual fields onto
cortex. Roughly a 2 mm movement through cortex was required to displace the fields fromone region to an entirely new region. (Fig. 2 (28)).
50 Physiology or Medicine 1981
-e-m---e--m-----
way to keep its uniformity by devoting to the detailed tasks more area ratherthan more thickness.
We decided to look more carefully at the relationship between receptive-fieldsize and area of cortex per unit area of visual field (28). When an electrode ispushed vertically through the cortex and encounters a hundred or so cells intraversing the full thickness, the receptive fields vary to some extent in size, andin a rather random way in position, so that the hundred maps when superim-posed cover an area several times that of an average receptive field (Fig. 13a).We call this the “aggregate receptive field” for a particular point on the cortex.On making a penetration parallel to the surface there is a gradual drift in fieldposition, superimposed on the random staggering, in a direction dictated by thetopographic map (Fig. 13b). We an to wonder whether there was any lawconnecting the rate of this drift in aggregate position and the size of the fields. Itwas easy to get a direct answer. It turned out that a movement of about 2 mmacross the cortex is just sufficient to produce a displacement, in the visual field,out of the region where one started and into an entirely new region. This heldeverywhere across the striate cortex (and consequently in the visual field). Inthe fovea the displacement was tiny and so were the fields. As one went out,both increased in size, in parallel fashion (Fig. 14). Now things indeed seemedto mesh. George and other monkeys had taught us that a l-2 mm movementacross cortex is accompanied by an angular shift in receptive-field orientationof 180-360°, more than one full complement of orientations. We have termedsuch a set of orientation columns (180º) a “hypercolumn”. Meanwhile, the

Evolution of Ideas on the Primary Visual Cortex, 1955—l978 …
CORTEX
VISUAL FIELD
51
Figure 14. Variation of receptive-field drift with eccentricity: The diagram represents one quadrantof the field of vision, and the circles represent aggregate receptive fields, the territory collectivelyoccupied by respective fields of cells encountered in a microelectrode penetration perpendicular tothe cortical surface. Each pair of circles illustrates the movement in aggregate receptive fieldaccompanying a movement along the cortex of I-2 mm. Both the displacemcnt and the aggregatefield size vary with distance from the fovea (eccentricity), but they do so in parallel fashion. Close tothe fovea the fields are tiny, but so is the displacement accompanying a 1-2 mm movement alongthe cortex. The greater the distance from the fovea, the greater the two become. hut they continueto remain roughly equal (28).
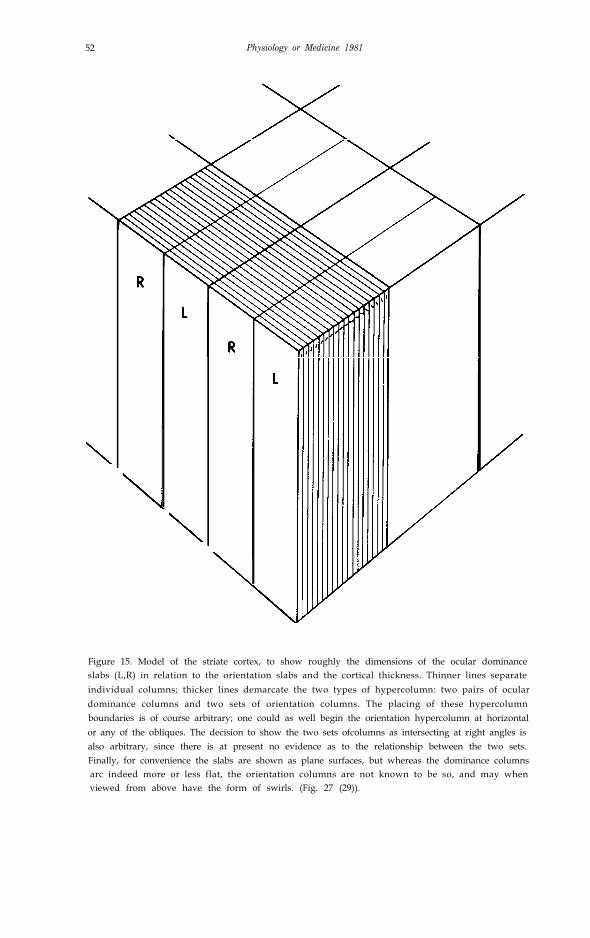
ocular dominance shifts back and forth so as to take care of both eyes everymillimeter – a hypercolumn for ocular dominance. Thus, in one or two squaremillimeters there seems to exist all the machinery necessary to look aftereverything the visual cortex is responsible for, in a certain small part of thevisual world. The machines arc the same everywhere; in some parts theinformation on which they do their job is less detailed, hut covers more visualfield (Fig. 15).
Uniformity is surely a huge advantage in development, for genetic specifica-tions need only be laid down for a l-2 mm block of neural tissue, together withthe instruction to make a thousand or so.
We could, incidentally, have called the entire machine a hypercolumn, butwe did not. The term as we define it refers to a complete set of columns of onetype. I mention this because uniformity has obvious advantages, not just for thecortex but also for terminology. Perhaps one could use “module” to refer to thecomplete machine
There arc two qualifications to all of this. I do not mean to imply that thereneed really be 2,000 separate definable entities. It need not matter whether onebegins a set of orientation columns at vertical, horizontal or any one of the
52 Physiology or Medicine 1981
Figure 15. Model of the striate cortex, to show roughly the dimensions of the ocular dominanceslabs (L,R) in relation to the orientation slabs and the cortical thickness. Thinner lines separateindividual columns; thicker lines demarcate the two types of hypercolumn: two pairs of oculardominance columns and two sets of orientation columns. The placing of these hypercolumnboundaries is of course arbitrary; one could as well begin the orientation hypercolumn at horizontalor any of the obliques. The decision to show the two sets ofcolumns as intersecting at right angles isalso arbitrary, since there is at present no evidence as to the relationship between the two sets.Finally, for convenience the slabs are shown as plane surfaces, but whereas the dominance columnsarc indeed more or less flat, the orientation columns are not known to be so, and may whenviewed from above have the form of swirls. (Fig. 27 (29)).

Evolution of Ideas on the Primary Visual Cortex, 1955—1978 …
obliques; the decision is arbitrary. One requires two dominance columns, a leftand a right, and it makes no difference which one begins with. (In fact, as I willsoon point out, it now looks as though the blocks of tissue may really bediscrete, to a degree that we could not have imagined two years ago.) Second,there may well be some differences in cortical machinery between the centerand periphery of the visual field. Color vision and stereopsis, for example,probably decline in importance far out in the visual fields. I say this not to beobsessively complete but because in the next few years someone will probablyfind some difference and pronounce the concept wrong. It may of course bewrong, but I hope it will be for interesting reasons.
I should perhaps point out that the retina must be nonuniform if it is to do amore detailed job in the center. To have more area devoted to the center thanto the periphery is not an option open to it, because it is a globe. Were itanything else the optics would be awkward and the eye could not rotate in itssocket.
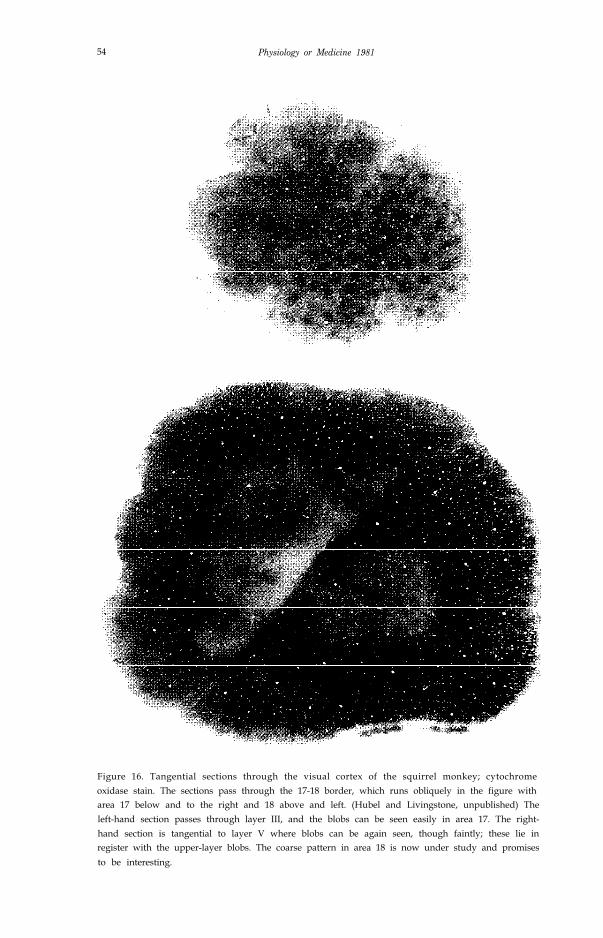
A few years ago, in a Ferrier Lecture (29), Torsten and I ended by sayingthat the striate cortex is probably now (was, then) in broad outline, under-stood. This was done deliberately: one did not want the well to dry up. Whenone wants rain the best strategy is to leave raincoat and umbrella at home. Sothe best way to guarantee future employment was to declare the job finished. Itcertainly worked. Two years ago Anita Hendrickson and her coworkers andour laboratory independently discovered that monkey striate cortex, whensectioned parallel to the surface and through layers II and III and stained forthe enzyme cytochrome oxidase, shows a polka-dot pattern of dark blobs quasi-regularly spaced l/2- 1 mm apart (Fig. 16) (30,21). It is as if the animal’sbrain had the measles. The pattern has been seen with several other enzymaticstains, suggesting that either the activity or the machinery is different in theblob regions. The pattern has been found in all primates examined, includingman, but not in any nonprimates. In macaque the blobs are clearly lined upalong ocular dominance columns (19). Over the past year Margaret Living-stone and I have shown that the cells in the blobs lack orientation selectivity,resembling, at least superficially, cells of layer IVc (31). They are selectivelylabeled after large injections of radioactive proline into the lateral geniculatebody, so it is clear that their inputs are not identical to the inputs to the rest oflayers II and III. Thus, an entire system has opened up whose existence we werepreviously quite unaware of and whose anatomy and functions we do notyet understand. We are especially anxious to learn what, if any, the relation-ship is between the cytochrome blobs and the orientation columns.
Things are at an exciting stage. There is no point leaving the umbrella home;it is raining, and raining hard.
54 Physiology or Medicine 1981
Figure 16. Tangential sections through the visual cortex of the squirrel monkey; cytochromeoxidase stain. The sections pass through the 17-18 border, which runs obliquely in the figure witharea 17 below and to the right and 18 above and left. (Hubel and Livingstone, unpublished) Theleft-hand section passes through layer III, and the blobs can be seen easily in area 17. The right-hand section is tangential to layer V where blobs can be again seen, though faintly; these lie inregister with the upper-layer blobs. The coarse pattern in area 18 is now under study and promisesto be interesting.
Evolution of Ideas on the Primary Visual Cortex, 1955—1978 …
REFERENCES
55
1. Hubel, D. H., (1958) Cortical unit responses to visual stimuli in nonanesthetized cats. Amer. J.Ophthal. 46:11O-122.
2. Barlow, H. B., FitzHugh, R. and Kuffler, S. W., (1957) Dark adaptation, absolute thresholdand Purkinje shift in single units of the cat’s retina. J. Physiol. 137: 327-337.
3. Talbot, S. A. and Kuffler, S. W., (1952) A multibeam ophthalmoscope for the study of retinalphysiology. J. Opt. Soc. Am. 42:931-936.
4. Talbot, S. A. and Marshall, W. H., (1941) Physiological studies on neural mechanisms ofvisual localization and discrimination. Am. J. Ophthal. 24:1255-1263.
5. Mountcastle, V. B., (1957) Modality and topographic properties of single neurons of cat’ssomatic sensory cortex. J. Neurophysiol. 20:408-434.
6. Davies, P. W., (1956) Chamber for microelectrode studies in the cerebral cortex. Science 124:179-180.
7. Sperry, R. W., Miner, N., and Meyers, R. E., (1955) Visual pattern perception followingsubpial slicing and tantalum wire implantations in the visual cortex. J. Comp. Physiol. Psych.4 8 : 5 0 - 5 8 .
8. Sperry, R. W. and Miner. N., (1955) Pattern perception following insertion of mica plates intovisual cortex. J. Comp. Physiol. Psych. 48:463-469.
9. Hubel, D. H. and Wiesel. T. N., (1959) Respective field organization of single units in thestriate cortex of cat. XXI Int. Congr. Physiol. Sci.. Buenos Aires, p.131.
IO. Hubel, D. H. and Wiesel. T. N., (1959) Receptive fields of single neurones in the cat’s striatecortex. J. Physiol. 148:574-591.
II. Cleland. B. G., Dubin, M. W., and Levick. W. R., (1971) Simultaneous recording of input andoutput oflateral geniculate neurones. Nature New Biol. 231:191-192.
12. Hubel, D. H. and Wiesel, T. N., (1962) Receptive fields. binocular interaction and functionalarchitecture in the cat’s visual cortex. J. Physiol. 160:106-154.
13. Barlow. H. B. and Levick. W. R., (1965) The mechanism of directionally selective units inrabbit’s retina. J. Physiol. 178:477-504.
14. Hubel, D. H. and Wiesel T. N., (1965) Receptivc fields and functional architecture in twonon-striate visual areas (18 and 19) of the cat. J. Neurophysiol. 28:229-289.
15. Dreher, B. (1972) Hypercomplex cells in the cat’s striate cortex. Invest. Ophth. II:355-356.16. Gilbert, C. D. (1977) Laminar differences in receptive field properties of cells in cat visual
cortex. J. Physiol. 268:391-421.17. Toyama, K., Matsunami, K., and Ohno, T., (1969) Antidromic identification of association,
commissural and corticofugal efferent cells in cat visual cortex. Brain Res. 14:513-517.18. Hubel, D. H. and Wiesel, T. N., (1963) Shape and arrangement of columns in cat’s striate
cortex. J. Physiol. 165:559-568.19. Hubel, D. H. and Wiesel. T. N., (1974) S qe uence regularity and geometry of orientation
columns in the monkey striate cortex. J. Comp. Neur. 158:267-294.20. Sokoloff, L., Reivich, M., Kennedy, C., DesRosiers, M. H., Patlak. C. S., Pettigrew, K. D.,
Sakurada, O. and Shinohara, M., (1977) The [14C] deoxyglucose method for the measure-ment of local cerebral glucose utilization: theory, procedure, and normal values in the con-scious and anesthetized albino rat. J. Neurochem. 28:897-916.
21. Horton, J. C. and Hubel. D H., (1981) Regular patchy distribution of cytochrome oxidasestaining in primary visual cortex of macaque monkey. Nature 292:762-764.
22. Humphrey, A. L., Skeen. L. G., and Norton, T. T., (1980) Topographic organization of theorientation column system in the striate cortex of the tree shrew (Tupaia glis). II. Deoxyglucosemapping. J. Comp. Neur. 192:549-566.
23. Hubel. D. H. and Wiesel, T. N., (1972) Laminar and columnar distribution of geniculo-cortical libers in the macaque monkey. J. Comp. Neur. 146:421-450.
24. Grafstein, B. (1971) Transneuronal transfer of radioactivity in the central nervous system.Science 172:177-179.

56 Physiology or Medicine 1981
25. Wiesel, T. N., Hubel, D. H., and Lam, D. M. K., (1974) Autoradiographic demonstration ofocular-dominance columns in the monkey striate cortex by means of transneuronal transport.Brain Res. 79:273-279.
26. Lorente de Nó, R. (1949) Cerebral cortex: architecture, intracortical connections, motorprojections. Chapt. 15 in Fulton. J. F.: Physiology of the Nervous System. 3rd edition, OxfordUniversity Press, New York and London.
27. Daniel, P. M. and Whitteridge, D., (1961) The representation of the visual field on the cerebralcortex in monkeys. J. Physiol., Lond. 159:203-221.
28. Hubel, D. H. and Wiesel, T. N., (1974) Uniformity of monkey striate cortex: a parallelrelationship between field size, scatter, and magnification factor. J. Comp. Neur. 158:295-306.
29. Hubel, D. H. and Wiesel, T. N., (1977) Ferrier Lecture. Functional architecture of macaquemonkey visual cortex. Proc. R. Soc. Lond. B. 198:1-59.
30. Hendrickson, A. E., Hunt, S. P., and Wu, J.-Y., (1981) I mmunocytochemical localization ofglutamic acid decarboxylase in monkey striate cortex. Nature 292:605-607.
31. Hubel, D. H. and Livingstone, M. S., (1981) Regions of poor orientation tuning coincide withpatches of cytochrome oxidase staining in monkey striate cortex. Neurosci. Abst. 1lth Ann.Meeting, Los Angeles, 118.12.
32. Hubel, D. H. and Wiesel, T. N., (1968) Receptive fields and functional architecture of monkeystriate cortex. J. Physiol. 195:215-243.
33. LeVay, S., Hubel, D. H., and Wiesel, T. N., (1975) The pattern of ocular dominance columnsin macaque visual cortex revealed by a reduced silver stain. J. Comp. Neur. 159:559-576.


![From Photons to Faces: An Overview of the Primate Visual ...€¦ · Fields (first step in stimulus generalization) ... [Talbot & Marshall; Hubel and Wiesel] •By the 70’s a multiplicity](https://static.fdocuments.net/doc/165x107/605adb020f78ea61344a73d4/from-photons-to-faces-an-overview-of-the-primate-visual-fields-first-step.jpg)