
Evolution of Economic Systems, Development … · Evolution of Economic Systems, Development...
27
1 1 Evolution of Economic Systems, Development Paradigms, and Economic Development From MDGs to SDGs (For GSID I2ID Part I Lecture) Prof. Shigeru T. OTSUBO GSID, Nagoya University April 2016 2 0. Revolutions and the Evolution of Economic Systems…..
Transcript of Evolution of Economic Systems, Development … · Evolution of Economic Systems, Development...

1
1
Evolution of Economic Systems, Development Paradigms, and
Economic Development
From MDGs to SDGs
(For GSID I2ID Part I Lecture)
Prof. Shigeru T. OTSUBO
GSID, Nagoya University
April 2016
2
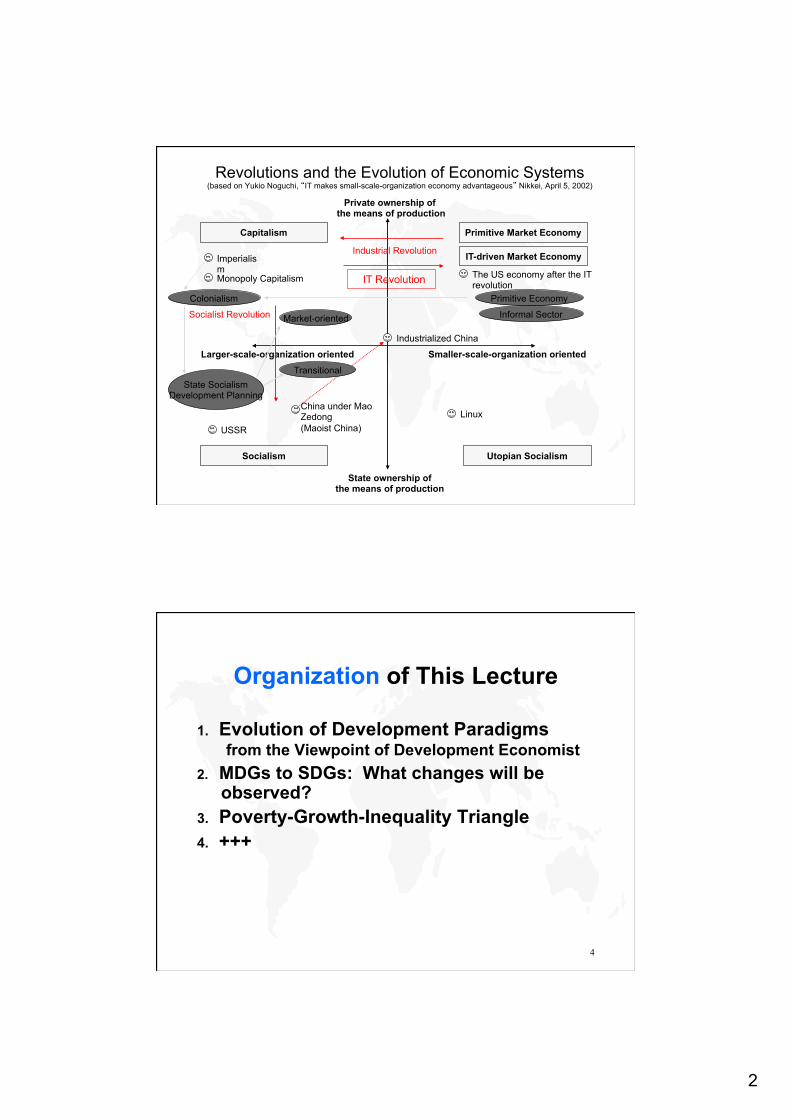
0. Revolutions and the Evolution of Economic Systems…..
2
Revolutions and the Evolution of Economic Systems (based on Yukio Noguchi, “IT makes small-scale-organization economy advantageous” Nikkei, April 5, 2002)
Private ownership of the means of production
State ownership of the means of production
Larger-scale-organization oriented Smaller-scale-organization oriented
Primitive Market Economy
IT-driven Market Economy
Capitalism
Socialism Utopian Socialism
Industrial Revolution
Socialist Revolution
IT Revolution
Imperialism Monopoly Capitalism The US economy after the IT
revolution
Linux
USSR
Industrialized China
China under Mao Zedong (Maoist China)
Colonialism
State Socialism Development Planning
Primitive Economy
Market-oriented
Transitional
Informal Sector
4
Organization of This Lecture
1. Evolution of Development Paradigms from the Viewpoint of Development Economist
2. MDGs to SDGs: What changes will be observed?
3. Poverty-Growth-Inequality Triangle 4. +++

3
5
1. Evolution of Development Paradigms…..
The Evolution of Development Paradigm: A Simplified Review
After WWII 1960s (early 1970s)
ISI
1980s
SAP
End of the 20th C. & Beyond
PRSP
New Political Economy of
Development ???
-2015
MDGs BHN
Role of Government
1985-
Globalization
1989-
Governance NIE
Social Capital
6

4
The Evolution of a Development Paradigm (Figure 1-1 & Table 1-3 in Chapter 1)
7
The Evolution: 1940s to 1960s
8

5
The Evolution: 1970s
9
The Evolution: 1980s
10

6
The Evolution: 1990s
11
The Evolution: into the 21st Century
12

7
13
Millennium Development Goals (MDGs)
◆ Goal 1: Eradicate Extreme Poverty & HungerTarget 1.A: Halve, between 1990 and 2015, the proportion of people whose income is less than $1.25 a day
◆ Goal 2: Achieve Universal Primary Education ◆ Goal 3: Promote Gender Equality and Empower Women
◆ Goal 4: Reduce Child Mortality
◆ Goal 5: Improve Maternal Health
◆ Goal 6: Combat HIV/AIDS, Malaria and Other Diseases◆ Goal 7: Ensure Environmental Sustainability
◆ Goal 8: Develop a Global Partnership for Development
14
Sustainable Development Goals (SDGs) ◆ Goal 1: End poverty in all its forms everywhere
◆ Goal 2: End hunger, achieve food security and improved nutrition and promote sustainable agriculture
◆ Goal 3: Ensure healthy lives and promote well-being for all at all ages
◆ Goal 4: End hunger, achieve food security and improved nutrition and promote sustainable agriculture
◆ Goal 5: Achieve gender equality and empower all women and girls
◆ Goal 6: Ensure availability and sustainable management of water and sanitation for all
◆ Goal 7: Ensure access to affordable, reliable, sustainable and modern energy for all

8
15
Sustainable Development Goals (SDGs) ◆ Goal 8: Promote sustained, inclusive and sustainable economic
growth, full and productive employment and decent work for all◆ Goal 9: Build resilient infrastructure, promote inclusive and
sustainable industrialization and foster innovation
◆ Goal 10: Reduce inequality within and among countries◆ Goal 11: Make cities and human settlements inclusive, safe,
resilient and sustainable
◆ Goal 12: Ensure sustainable consumption and production patterns
◆ Goal 13: Take urgent action to combat climate change and its impacts
◆ Goal 14: Conserve and sustainably use the oceans, seas and marine resources for sustainable development
16
Sustainable Development Goals (SDGs)
◆ Goal 15: Protect, restore and promote sustainable use of terrestrial ecosystems, sustainably manage forests, combat desertification, and halt and reverse land degradation and halt biodiversity loss
◆ Goal 16: Promote peaceful and inclusive societies for sustainable development, provide access to justice for all and build effective, accountable and inclusive institutions at all levels
◆ Goal 17: Strengthen the means of implementation and revitalize the global partnership for sustainable development

9
17
Major Shifts from MDGs to SDGs
◆ Ever expanding notion of “Sustainability” Sustainable Planet and Sustainable Society
◆ Determination to interfere “Internal Affairs” Dealing with (Structural) Inequality in order to save structurally poor (domestic governance incl. institutions, laws/regulations, even embedded social values
◆ Calls for Wider Participation & Networking Brain Power
18
2. Economic Development in “Development”…..

10
19
What is Economic Growth?
In the development economics field, the term “economic growth” and “economic development” are distinctively used. Strictly speaking, economic growth is the growth of the size of the real economy in a country, which is measured by the gross domestic product (GDP). The growth rate is what we call the economic growth rate. However, when discussing its effect to poverty reduction, there are times that increase in the average income per capita (GDP divided by population) is considered economic growth. In this case, the rate of per capita income increase is observed.
20
What is Economic Development? In economic development, “development” is perceived as a
process. Economic development is defined as a concept that involves the following structural changes and social transformation that accompany economic growth.
◆ Industrial transformation (shift from an agriculture-dominant society to an industry-dominant society), and economic structural changes such as developments in economic/social infrastructure and institutions;
◆ Social transformation and the changes in lifestyles that accompany urbanization (labor migration from rural areas to cities);
◆ Cultural transformation such as the shift from family/relative/tribe-oriented organization/relationship to a more merit-based, contractual organization/ relationship;
◆ Political transformation including democratization and (legal) institution building for the establishment of property rights, contract enforcement, and so forth.

11
21
What is Economic Development? When we see “development” as outcomes, it is considered
that development has happened or has been made, only when human well-being has improved along with economic growth (income growth).
Dadley Seers (1969) discusses as follows: The questions to ask about a country’s development are therefore: What has been happening to poverty? What has been happening to unemployment? What has been happening to inequality? If all three of these have declined from high levels, then beyond doubt this has been a period of development for the country concerned. If one or two of these central problems have been growing worse, especially if all three have, it would be strange to call the result “development” even if per capita income doubled. (P-G-I Triangle & Pro-Poor Growth)
22
Regional Poverty Estimates
Source: Author’s compilation using World Bank, World Development Indicators 2008 Supplement, Table 3.
Table1-1 (a) Poverty headcount ratios (%)
1981 1984 1987 1990 1993 1996 1999 2002 2005EastAsia&Pacific 77.7 65.5 54.2 54.7 50.8 36.0 35.5 27.6 16.8 China 84.0 69.4 54.0 60.2 53.7 36.4 35.6 28.4 15.9Europe&C entralAsia 1.7 1.3 1.1 2.0 4.3 4.6 5.1 4.6 3.7LatinAm erica&C aribbean 12.9 15.3 13.7 11.3 10.1 10.9 10.9 10.7 8.2M iddleEast&N orthAfrica 7.9 6.1 5.7 4.3 4.1 4.1 4.2 3.6 3.6SouthAsia 59.4 55.6 54.2 51.7 46.9 47.1 44.1 43.8 40.3 India 59.8 55.5 53.6 51.3 49.4 46.6 44.8 43.9 41.6Sub-SaharanAfrica 53.4 55.8 54.5 57.6 56.9 58.8 58.4 55.0 50.9LM IC 51.9 46.7 41.9 41.7 39.2 34.5 33.7 30.5 25.2

12
23
Regional Poverty Estimates
Source: Author’s compilation using World Bank, World Development Indicators 2008 Supplement, Table 3.
Table1-1(b) People living on less than 2005 PPP $1.25 a day (millions)
1981 1984 1987 1990 1993 1996 1999 2002 2005EastAsia&Pacific 1,071 947 822 873 845 622 635 507 316 China 835 720 586 683 633 443 447 363 208Europe&C entralAsia 7 6 5 9 20 22 24 22 17LatinAm erica&C aribbean 47 59 57 50 47 53 55 57 45M iddleEast&N orthAfrica 14 12 12 10 10 11 12 10 11SouthAsia 548 548 569 579 559 594 589 616 596 India 420 416 428 435 444 442 447 460 456Sub-SaharanAfrica 212 242 258 298 317 356 383 390 388LM IC 1,900 1,814 1,723 1,818 1,799 1,658 1,698 1,601 1,374
24
Regional Poverty Estimates (Updated)

13
25
Income Convergence?
Note: Country compositions of geographical regions are basically fixed. Country compositions of income groups, however, change over years. For tabulation, they are fixed using 2005 World Bank income groupings.
Source: Author’s compilation using World Bank, World Development Indicators 2007 CD-ROM.
Table1-2 Changes in Regional Real Per Capita GDP (2000 US$)
1965 1975 1985 1990 1995 2000 2005 2005/1965 2005/1985
EastAsia&Pacific 145 211 363 481 735 952 1,355 x9.3 x3.7
China 100 146 290 392 658 949 1,449 x14.5 x5.0
Europe&C entralAsia 2,257 1,763 2,037 2,615
LatinAm erica&C aribbean 2,275 3,088 3,285 3,259 3,554 3,852 4,044 x1.8 x1.2
M iddleEast&N orthAfrica 831 1,295 1,431 1,346 1,423 1,605 1,780 x2.1 x1.2
SouthAsia 199 221 275 328 379 450 566 x2.8 x2.1
India 188 215 260 317 372 453 588 x3.1 x2.3
Sub-SaharanAfrica 494 587 539 531 494 515 569 x1.2 x1.1
LM IC 550 752 901 963 1,036 1,191 1,440 x2.6 x1.6
HighIncom eC os. 10,911 15,044 18,959 21,917 23,466 26,368 28,242 x2.6 x1.5
W orld 2,840 3,596 4,158 4,565 4,758 5,241 5,647 x2.0 x1.4
26
Income Convergence? (σ-convergence)
Mean Income (2000US$) and Coefficinet of Variation (CV) 1965 1970 1975 1980 1985 1990 1995 2000 2005
Mean Income LowIncom eC os.(54) 219 241 246 257 273 312 340 393 481 LowerM iddleIncom eC os.(58) 361 442 570 689 768 861 1,047 1,250 1,614 UpperM iddleIncom eC os.(40) 2,631 3,016 3,516 3,447 3,498 3,416 3,897 4,480 LM IC (152) 550 644 752 867 901 963 1,036 1,191 1,440 HighIncom eC os.(56) 10,911 13,375 15,044 17,304 18,959 21,917 23,466 26,368 28,242H ighIncom eO EC D (24) 11,190 13,742 15,419 17,732 19,606 22,712 24,256 27,304 29,251 O therH ighIncom eC os.(32) 4,570 5,831 8,113 10,324 9,470 11,292 13,535 15,304 17,110W orld(208) 2,840 3,314 3,596 3,981 4,158 4,565 4,758 5,241 5,647
CV LowIncom eC os.(54) 0.51 0.54 0.56 0.55 0.51 0.49 0.55 0.49 0.49 LowerM iddleIncom eC os.(58) 0.55 0.62 0.56 0.51 0.47 0.45 0.53 0.47 0.43 UpperM iddleIncom eC os.(40) 0.63 0.58 0.51 0.50 0.45 0.35 0.41 0.36 0.30 LM IC (152) 1.13 1.14 1.06 1.01 0.99 0.96 1.04 1.05 1.04 HighIncom eC os.(56) 0.78 0.60 0.57 0.52 0.45 0.43 0.42 0.43 0.40H ighIncom eO EC D (24) 0.45 0.42 0.38 0.38 0.38 0.38 0.37 0.37 0.37 O therH ighIncom eC os.(32) 1.30 0.97 0.85 0.73 0.49 0.38 0.34 0.33 0.38W orld(208) 1.61 1.46 1.40 1.40 1.40 1.47 1.50 1.50 1.58
(Source) Author's own calculations from World Bank, World Development Indicators 2007 CD-ROM.
(from Otsubo (2009), Globalization and Development)

14
27
Income Convergence? (σ-convergence)
Mean Income (2000US$) and Coefficinet of Variation (CV) 1965 1970 1975 1980 1985 1990 1995 2000 2005
Mean Income LowIncom eC os.(54) 219 241 246 257 273 312 340 393 481 LowerM iddleIncom eC os.(58) 361 442 570 689 768 861 1,047 1,250 1,614 UpperM iddleIncom eC os.(40) 2,631 3,016 3,516 3,447 3,498 3,416 3,897 4,480 LM IC (152) 550 644 752 867 901 963 1,036 1,191 1,440 HighIncom eC os.(56) 10,911 13,375 15,044 17,304 18,959 21,917 23,466 26,368 28,242H ighIncom eO EC D (24) 11,190 13,742 15,419 17,732 19,606 22,712 24,256 27,304 29,251 O therH ighIncom eC os.(32) 4,570 5,831 8,113 10,324 9,470 11,292 13,535 15,304 17,110W orld(208) 2,840 3,314 3,596 3,981 4,158 4,565 4,758 5,241 5,647
CV LowIncom eC os.(54) 0.51 0.54 0.56 0.55 0.51 0.49 0.55 0.49 0.49 LowerM iddleIncom eC os.(58) 0.55 0.62 0.56 0.51 0.47 0.45 0.53 0.47 0.43 UpperM iddleIncom eC os.(40) 0.63 0.58 0.51 0.50 0.45 0.35 0.41 0.36 0.30 LM IC (152) 1.13 1.14 1.06 1.01 0.99 0.96 1.04 1.05 1.04 HighIncom eC os.(56) 0.78 0.60 0.57 0.52 0.45 0.43 0.42 0.43 0.40H ighIncom eO EC D (24) 0.45 0.42 0.38 0.38 0.38 0.38 0.37 0.37 0.37 O therH ighIncom eC os.(32) 1.30 0.97 0.85 0.73 0.49 0.38 0.34 0.33 0.38W orld(208) 1.61 1.46 1.40 1.40 1.40 1.47 1.50 1.50 1.58
(Source) Author's own calculations from World Bank, World Development Indicators 2007 CD-ROM.
(from Otsubo (2009), Globalization and Development)
3. 所得水準の相対的収束 (σ収束)
◆ 世界は, 高所得諸国間および高中所得途上諸国間の強い所得収束傾向と, 低中所得途上諸国間と低所得途上諸国間の弱い所得収束傾向を内包しつつ, 1980年代を境に途上国諸国全体として, そして世界全体として所得収束傾向から所得拡散傾向に転じていることになる. なにがしかの条件を共有する各所得グループの構成国間では所得収束が起きると同時に, 条件等が異なると思われる所得グループの間の隔たりは拡がっていると考えられる.
28
表1-7 1人当たり実質GDP水準と変動係数の推移(2000年米ドル値で計算)1965 1970 1975 1980 1985 1990 1995 2000 2005
変動係数 低所得諸国(54) 0.51 0.54 0.56 0.55 0.51 0.49 0.55 0.49 0.49
低中所得諸国(58) 0.55 0.62 0.56 0.51 0.47 0.45 0.53 0.47 0.43
高中所得諸国(40) 0.63 0.58 0.51 0.50 0.45 0.35 0.41 0.36 0.30
開発途上国全体(152) 1.13 1.14 1.06 1.01 0.99 0.96 1.04 1.05 1.04
先進国(高所得)(56) 0.78 0.60 0.57 0.52 0.45 0.43 0.42 0.43 0.40
高所得O EC D(24) 0.45 0.42 0.38 0.38 0.38 0.38 0.37 0.37 0.37
高所得O EC D外(32) 1.30 0.97 0.85 0.73 0.49 0.38 0.34 0.33 0.38
世界(208) 1.61 1.46 1.40 1.40 1.40 1.47 1.50 1.50 1.58
(出所) World Bank, World Development Indicators 2007 CD-ROMより筆者作成.

15
29
Income Convergence? (Absolute β-convergence)
(Source) Otsubo (2009), Globalization and Development.
-.04
-.02
.00
.02
.04
.06
.08
4 5 6 7 8 9 10
log(real per capita GDP in 1960)
Gro
wth
rate
, 196
0-20
05
.01
.02
.03
.04
.05
.06
6.8 7.2 7.6 8.0 8.4 8.8 9.2 9.6 10.0
log(real per capita GDP in 1960)G
row
th ra
te, 1
960-
2005
High Income OECD 24 Countries: 1960-2005All Countries: 1960-2005
(Barro’s Ad Hoc Growth Equation Estimation)
30
Factors for Higher Income Growth & Catch-Up?
DependentVariable
ExplanatoryVariables
Estim atedC oefficients StandardError
C onditionalIncom eC onvergence
(1)Initiallevelofincom e(inlog) -0.0254 0.0031
InitialHum anC apital
(2)M alesecondaryandhigheryearsofschooling(ofpersonsaged25andover)
0.0118 0.0025
(3)Lifeexpectancy(inlog) 0.0423 0.0137
(4)(1)X(2) -0.0062 0.0017
PopulationPressure
(5)Fertilityrate(inlog) -0.0161 0.0053
G overnance・Institutions
(6)G overnm entconsum ptiontoG DPratio(excl.spendingoneducationanddefense)
-0.136 0.026
(7)Ruleoflawindex(subjectivecom positeindicator)
0.0293 0.0054
(8)Dem ocracyindex(indexofpoliticalrights) 0.090 0.027
(9)Dem ocracyindexsquared -0.088 0.024
(10)Inflationrate(econom icgovernance/m anagem ent)
-0.043 0.008
O therC ontrolVariables
(11)Term softradechange(changesinexportprice/im portpriceratio)
0.137 0.030
R2(foreachperiod) .58.52.42
No.ofO bservations(foreachperiod) 808784
ofM eanRealPer-C apitaIncom e
Period-AverageG rowthRateTable 1-4
Estimated Ad Hoc Growth Equation (Human Capital, Governance, Institutions and Economic Growth)
Note: Dependent variables are the growth rates of real per capita GDP for 1965-75, 1975-85, and 1985-90. Estimation is carried out by three-stage least-squares (with different instrumental variables used for each period/equation). p value for joint significance of two democracy variables (items (8) and (9)) is 0.0006 (i.e. jointly significant). Dependent variables are classified by this author in order to facilitate readers’ understanding of the estimated results.Source: Barro (1997), Table 1.1, simplified and re-categorized by this author.

16
31
Money alone is not enough!!
But if that Money was not
available?
32
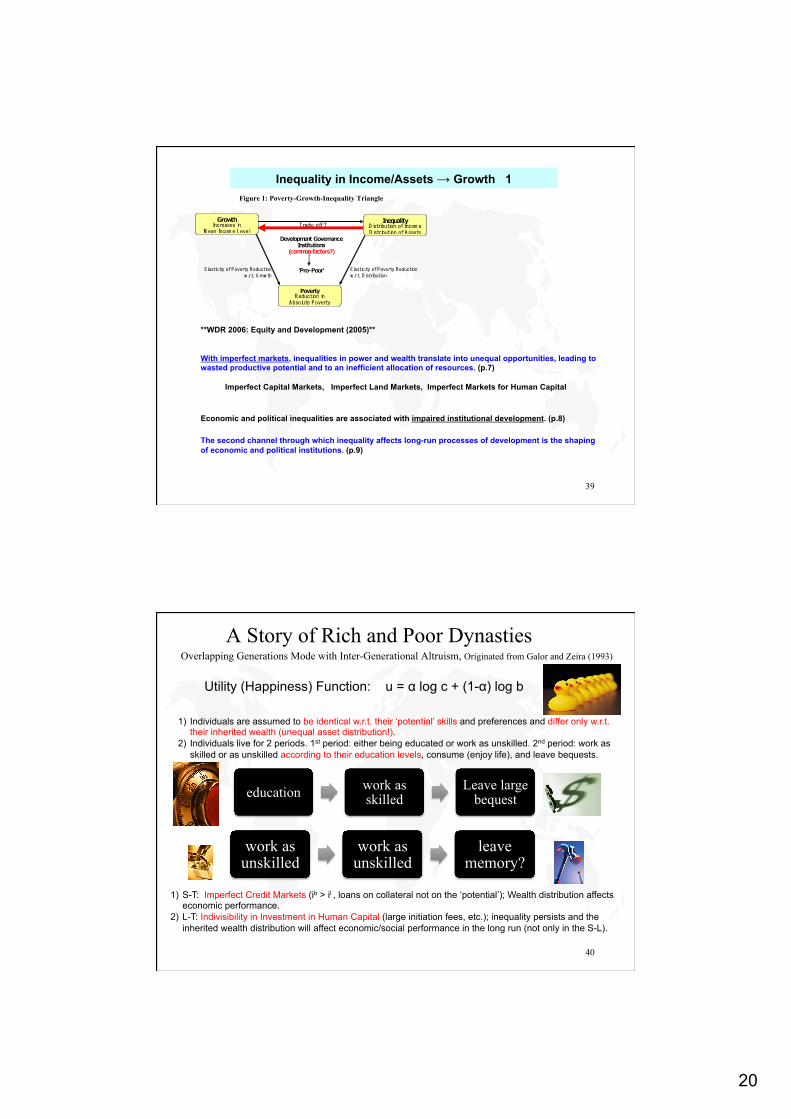
3. Poverty-Growth-Inequality Triangle

17
33
Trade-off?
Policies and FactorsX, Y, Z, … ?
ElasticityofPovertyReduction 'Pro-Poor' ElasticityofPovertyReductionw.r.t.G rowth w.r.t.Distribution
Source:Author
Figure 0: Poverty-Growth-Inequality Triangle
GrowthIncreasesin
M eanIncom eLevel
InequalityD istributionofIncom eD istributionofAssets
PovertyReductionin
AbsolutePoverty
34
Figure 0.5: Decomposition of change in distribution and poverty into growth and distribution effects
Source: Bourguignon (2003), Figure 1.2; Bourguignon (2004), Figure 1
Change in Poverty = F( growth, distribution, change in distribution) (assuming log-normal distribution)

18
35
Figure 4 : Growth is good for the poor (Figure 1-4 in Ch.1)
Source: Dollar and Kraay (2007), Figure 1
36
Trade-off?
Development GovernanceInstitutions
(common factors?)
ElasticityofPovertyReduction 'Pro-Poor' ElasticityofPovertyReductionw.r.t.G rowth w.r.t.Distribution
Source:Author
Figure 1: Poverty-Growth-Inequality Triangle
GrowthIncreasesin
M eanIncom eLevel
InequalityD istributionofIncom eD istributionofAssets
PovertyReductionin
AbsolutePoverty
Pro-Poor vs. Pro-Growth Pro-Poor Growth
Figure 1-3 Kuznets’ Inverted U-Curve
1
Giniindex
0Per-capitaincom elevel

19
37
Figure 3: Cross-country estimates of the Kuznets curve
Source: Bourguignon 2004, Figure 5
38
Elasticities of Poverty Reduction – Crossing Effects
Trade-off?
Development GovernanceInstitutions
(common factors?)
ElasticityofPovertyReduction 'Pro-Poor' ElasticityofPovertyReductionw.r.t.G rowth w.r.t.Distribution
GrowthIncreasesin
M eanIncom eLevel
InequalityDistributionofIncom eDistributionofAssets
PovertyReductionin
AbsolutePoverty
Ravallion (2005) “Inequality is Bad for the Poor” Rate of poverty reduction = [-9.33*(1-Inequality index)3.031 ] * Ordinary growth rate Applied to 62 sample cos. As Gini increases from 20 to 60, the Elasticity of Poverty Reduction w.r.t. Growth declines from -4.3 to -0.6.
20
39
Inequality in Income/Assets → Growth 1
Trade-off?
Development GovernanceInstitutions
(common factors?)
ElasticityofPovertyReduction 'Pro-Poor' ElasticityofPovertyReductionw.r.t.G rowth w.r.t.Distribution
Figure 1: Poverty-Growth-Inequality Triangle
GrowthIncreasesin
M eanIncom eLevel
InequalityD istributionofIncom eD istributionofAssets
PovertyReductionin
AbsolutePoverty
**WDR 2006: Equity and Development (2005)** With imperfect markets, inequalities in power and wealth translate into unequal opportunities, leading to wasted productive potential and to an inefficient allocation of resources. (p.7) Imperfect Capital Markets, Imperfect Land Markets, Imperfect Markets for Human Capital Economic and political inequalities are associated with impaired institutional development. (p.8) The second channel through which inequality affects long-run processes of development is the shaping of economic and political institutions. (p.9)
A Story of Rich and Poor Dynasties Overlapping Generations Mode with Inter-Generational Altruism, Originated from Galor and Zeira (1993)
40
Utility (Happiness) Function: u = α log c + (1-α) log b
1) Individuals are assumed to be identical w.r.t. their ‘potential’ skills and preferences and differ only w.r.t. their inherited wealth (unequal asset distribution!).
2) Individuals live for 2 periods. 1st period: either being educated or work as unskilled. 2nd period: work as skilled or as unskilled according to their education levels, consume (enjoy life), and leave bequests.
1) S-T: Imperfect Credit Markets (ib > il , loans on collateral not on the ‘potential’); Wealth distribution affects economic performance.
2) L-T: Indivisibility in Investment in Human Capital (large initiation fees, etc.); inequality persists and the inherited wealth distribution will affect economic/social performance in the long run (not only in the S-L).
educationwork as skilled
Leave large bequest
work as unskilled
work as unskilled
leave memory?

21
41
Recent Movements in Japan’s Gini Indices
Source : Author’s unscientific imagination !?
42
Figure 6 : Poverty incidence in China and India, 1981-2001
Source : Ravallion (2005), Figure 12

22
43
Figure 7 : Inequality and average income in India
Source : Bruno, Ravallion, and Squire (1996), Figure 1
44
Figure 8 : Inequality over time in India (more recent years)
Source : Ravallion (2005), Figure 9

23
45
Figure 9 : Income inequality in rural and urban areas and nationally (China)
Source : Ravallion and Chen (2004), Figure 5
46
5. In Conclusion …

24
47
What is Development? 1
Introduction to International Development Studies: An Interdisciplinary Approach co-editors: Prof. S. Otsubo, development economist Prof. H. Kimura, political scientist, Prof. S. Ito, development sociologist In this book, we define ‘development’ as the reform of the
whole structural system that produces material as well as non-material poverty.
48
What is Development? 2 When ‘proper incentives to get out of poverty’ so defined by a development economist are given to the ‘structural poor’, if they are equipped with ‘capabilities’ and ‘adaptability’ to respond, those who cannot easily benefit from ‘trickle-down’ may rise to their feet and overcome poverty by themselves. The ‘potential poor’ who may easily fall into poverty given external economic/social/natural shocks are equipped with resilience supported by social capital including social safety nets, they may not have to fall into poverty repeatedly. The poor have to be treated as active participants to development. For that end, people have to be ‘empowered’.

25
49
What is Development? 3
The state of ‘development’ should be the situation where people are empowered and a country is full of empowered human beings. ‘International development’ should be the international cooperation/collaboration heading for this end.
50
Trade-off?
Policies and FactorsX, Y, Z, … ?
ElasticityofPovertyReduction 'Pro-Poor' ElasticityofPovertyReductionw.r.t.G rowth w.r.t.Distribution
Source:Author
Figure 0: Poverty-Growth-Inequality Triangle
GrowthIncreasesin
M eanIncom eLevel
InequalityD istributionofIncom eD istributionofAssets
PovertyReductionin
AbsolutePoverty

26
51
Trade-off?
Development GovernanceInstitutions
(country specific)
ElasticityofPovertyReduction 'Pro-Poor' ElasticityofPovertyReductionw.r.t.G rowth w.r.t.Distribution
Source:Author
Figure 5: Expanded Analyses on the Poverty-Growth-Inequality Triangle
GrowthIncreasesin
M eanIncom eLevel
InequalityD istributionofIncom eD istributionofAssets
PovertyReductionin
AbsolutePoverty
GlobalizationTradeIntegrationFinancialIntegrationHRIntegration
Globalization
52
4. Association with Other Subject Areas (Human Capital incl. Education, Governance, Democracy, Human Development…)

27
53
Building ‘Interdisciplinary’ and ‘Active’ International Development Studies
Given issues/problems in the field: we are in need of Multidisciplinary Network Studies
54
“Poverty never sleeps…..
Thank you …..


