Evolu’on!of!the!Auto!Industry!! in!Mexico -...
63
Evolu’on of the Auto Industry in Mexico Jorge Carrillo [email protected] h;p://colef.net/ApWpJCarrillo/presentacion 1 GERPISA Journée du Gerpisa 199 11 Jan 2013 14:00 – 17:00 La Défense, Tour Voltaire, Paris
-
Upload
vuongkhanh -
Category
Documents
-
view
216 -
download
0
Transcript of Evolu’on!of!the!Auto!Industry!! in!Mexico -...

Evolu'on of the Auto Industry in Mexico
Jorge Carrillo
h;p://colef.net/ApWp-‐JCarrillo/presentacion
1
GERPISA Journée du Gerpisa 199 11 Jan 2013 14:00 – 17:00
La Défense, Tour Voltaire, Paris

Content How important is the auto industry in Mexico? How the auto industry is structured in Mexico? How the industry is integrated in Mexico? What kind of employment relationships exists in Mexico?

1
How important is the auto
industry in Mexico?

Economy 13th place.
8th Worldwide Producer (2011) 3 LV out of 100 world wide are assembled in Mexico 1 out of 4 vehicles sales in USA are assembled in Mexico 28 Billion dlls US imports comes from Mexico (# 1) 25% of US auto industry purchases comes from Mexico (2011) 2nd USA Trade Partner
MEXICO AUTO INDUSTRY. SOME EVIDENCE
Source: Banxico, INA
2008 2009 2010 2011 2012* 2013* 2014* Real GDP (%) 1.2 -‐6.0 5.5 3.9 3.8 3.6 3.1
GDP per cápita
$10,070 $8,001 $9,221 $10,105 $10,172 $10,694 $10,965

NAFTA: Vehicle production (%)
Sources: Automotive News; Market Data Yearbook; Statistics Canada; AMIA, OICA, Mexico Now-
- PERIPHERICAL MODEL (GERPISA) BUT DYNAMIC
Year
U.S.A. CANADA MEXICO % Total
1970 9,663 85.7 12.3 2.0 100 1980 9,869 81.2 13.9 5.0 100 1990 12,551 77.9 15.5 6.5 100 2000 17,699 72.6 16.7 10.7 100 2011 20,164 72.4 14.6 13.0 100 2016 16,731 68.8 10.6 20.6 100

Coahuila
New geography, 2007-08

Sources; Banxico, INA
- 2.9 millions vehicles produced in 2012 - 17% of Mexico’s GDP manufacture (2011) - 20% of total Mexican manufacture exports (2010) - 34.5 Billions of dlls. of foreign exchange (2012) 29% higher than petroleum;
184% than tourism - FDI –OEMs : 15 billion US dlls (2006-2012)
- Exports to more than 100 countries - 90 of the Top Best 100 global players are located in Mexico
Auto Industry. Mexico´s General Impact

Mexico General View Auto Industry: Long tradi'on started in 1925. ISI period 60´s & 70s, 80’S huge restructuring. Export plaXorm –vehicles and parts-‐ North-‐South convergence process 1994 NAFTA 2001 & 2009 important crisis (rapid recovery) 53% SALES W/FINANCE (55% FROM DEALERS). 47% SALES CASH
(JanOct 2012) 2010 and on. Very Important increase:
12% growth of LV in 2011-‐2012 8
2
HOW THE AUTO INDUSTRY IS STRUCTURED IN MEXICO?

10
0.0%
10.0%
20.0%
30.0%
40.0%
50.0%
60.0%
70.0%
2000 2004 2009 2011 2012 (Jan-‐Oct)
67.7%
59.9%
67.0% 67.4%
63.2%
31.7%
39.9%
33.0% 32.6% 36.8%
Produc'on by segments (% of Total)
Automoviles Camiones Ligeros Camiones Pesados
Sources: Author elaboration based on AMIA data base
11
AGS.
TLAX. MEX.
PUEBLA
QRO.
COAHUILA
HERMOSILLO FORD
(AUTOS) SALTILLO CHRYSLER
(MOTORES & UV)
NISSAN (AUTOS & MOTORES)
GTO.
GM (UV)
CHRYSLER (CAMIONES)
SILAO
AGS.
V.W. (AUTOS & MOTORES)
AUD*I PUEBLA
PUEBLA
HONDA GUADALAJARA
SONORA
FORD (MOTORES)
CHIHUAHUA
MOR.
NISSAN (AUTOS & UV) CUERNAVACA
DURANGO
ZACATECAS
S.L.P.
TAMPS.
COLIMA MICHOACAN
GUERRERO
OAXACA CHIAPAS
TABASCO
CAMPECHE
YUCATAN
HIDALGO
NUEVO LEON
RAMOS ARIZPE G.M.
(AUTOS & UV)
TOLUCA G.M. (MOTORES) TOLUCA CHRYSLER (AUTOS & UV)
TOLUCA BMW (AUTOS)
CUAUTITLAN FORD (AUTOS& UV)
CHIHUAHUA
TOLUCA
S.L.P.
JALISCO
G.M. (AUTOS)
GM (PRUEBAS)
MICHOACAN
CHRYSLER (AUTOBUSES)
TOYOTA (PICK UP) TIJUANA
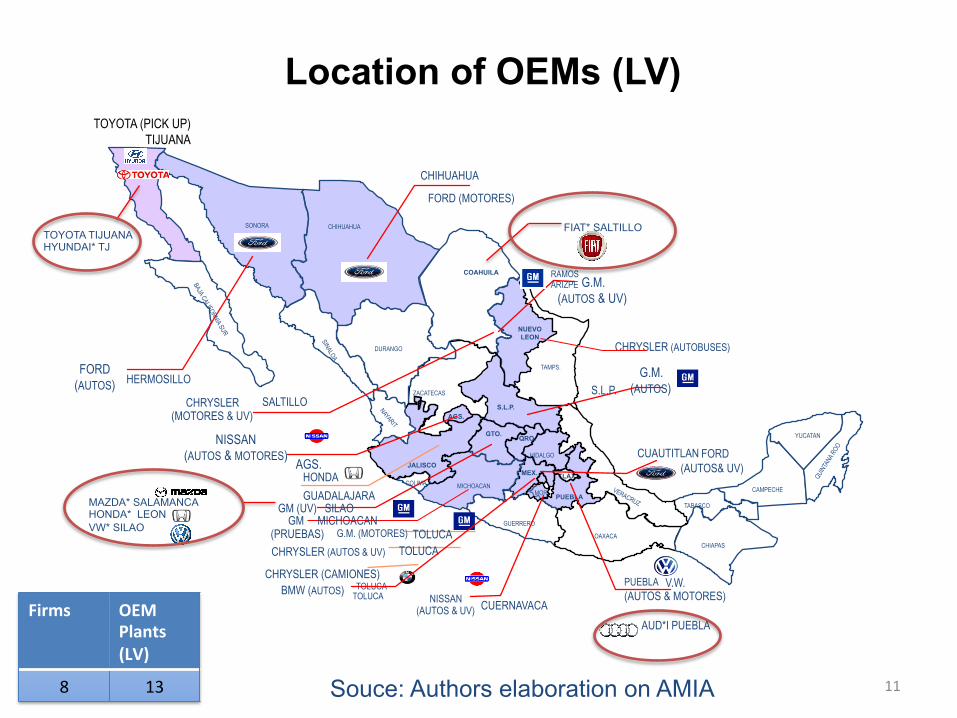
Location of OEMs (LV)
Souce: Authors elaboration on AMIA
FIAT* SALTILLO TOYOTA TIJUANA HYUNDAI* TJ
MAZDA* SALAMANCA HONDA* LEON VW* SILAO
Firms OEM Plants (LV)
8 13
AGS.
TLAX.
QRO.
COAHUILA
GTO.
SONORA CHIHUAHUA
MOR.
DURANGO
ZACATECAS S.L.P.
TAMPS.
COLIMA MICHOACAN
GUERRERO OAXACA
CHIAPAS
TABASCO CAMPECHE
YUCATAN HIDALGO
MEX.
PUEBLA
NUEVO LEON
JALISCO
BOSCH, HONEYWELL, AUTOLIV, MORGAN, POLIMER SEALS
ALIED SIGNAL, KATA, VELCRO,YAZAKI,TRW
DANA, DELPHI,
GOOD YEAR, LEAR CORP, VISTEON,
JCI
ALCOA, FUJIKURA,
FOAMEX CORP, JOHNSON CONROLS
MAGNA, LEAR SEATING,
DELPHI
DELPHI, ABS,
ALCOA FUJIKURA, AISIN SEIKI,
NEMAK, VISTEON-
CARPLASTIC, YAZAKI DELCO,
UNIROYAL, ALPINE, KIMKO,
SIEMENS, AVON
RUBBER
AIR SISTEM, AXA YAZAKI
CITSA PPG, BOMBARDIER
DELPHI, MEXICORVOS;
WALBRO, ENGINE MNGMT
ELECTRIC DGO, SUMITOMO,
YAZAKI
BUSSCAR, BOSCH, GESTAMP, JATCO, K&S MEXICANA,
KANTUS, MORESTANA
SHULMAN, ALFRED ENGELMAN,
ARVIN MERITOR, DELCO REMY,
DANA, CONTITEC, THYSSENKRUPP
AP TECHNOGLASS, ARALMEX, ATR,
CARBURAT, HELLA/HEMEX, JABIL CIRCUIT,
K&S WIRE HARNESS, TAKATA, YAMAVER
ARBOMEX, CELAY, ENERTEC MX,
MORESA, TENNECO AUTOMOTIVE,
VELCON, KASAI, LEAR CORP,
ARCOMEX, CONDUMEX,
SPICER, DELPHI, JCI
BERU, SAINT GOBAIN; SEKURIT
BENTELER, JCI, LUK, MAGNA GRP,
SKF, SIEMENS, TRW,
THYESSENKRUPP
AXA YAZAKI
BOSCH, CALSONIC, EATON, GONHER, MICHELIN, VITRO
ABS,BASF,BOSCH, EATON,DANA,
LEAR CORP,FPA, MAGNA,PARKER,
PERKINS,ZF
LINAMAR (MOTORES)
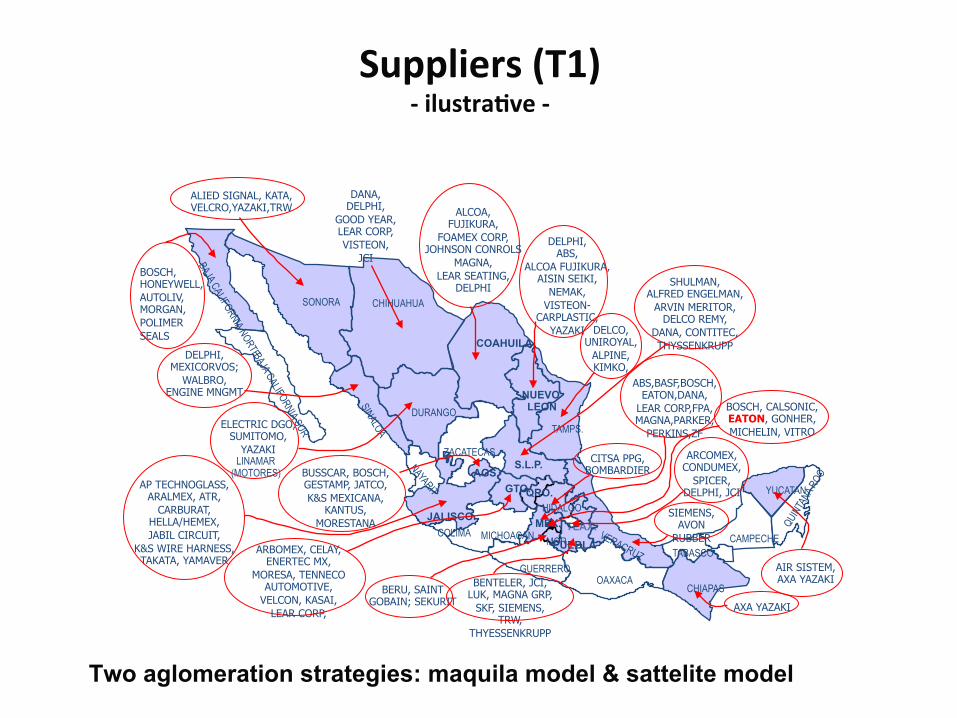
Suppliers (T1) -‐ ilustra've -‐
Two aglomeration strategies: maquila model & sattelite model

1990 1995 2000 2006 2012
(Jan-Oct)
Policy Orientation
Export promotion
policy
NAFTA: Mexico
economic crisis
NAFTA: US
Recession
NAFTA: Mexican recovery Recovery
Production (millions of units) 0.83 0.93 1.9 2.0 2.7
% Domestic 34% 17% 25% 21% 17%
% Exports 66% 83% 75% 79% 83%
% Imports (of total sales) 0% 3% 46% 63%
54%
MEXICO: Vehicles
Sources: Author elaboration based on AMIA data base (several years)

1990 1995 2000 2006 2012
(Jan-Oct)
Policy Orientation
Export promotion
policy
NAFTA: Mexico
economic crisis
NAFTA: US
Recession
NAFTA: Mexican recovery Recovery
% LV (of total production) 75 67.1 69 62.6 67.6
% Big Three U.S. 62% 65% 58% 59% 45.5%
% Big Three European 21% 18% 25.3%
% Big Three Japanese 19% 23% 29.2% No. of Models 58 370 295 No. of Brands 8 28 29
MEXICO: Vehicles,
Sources: Author elaboration based on AMIA data base (several years)

Annual Average
1978-1982 1983-1987 1988-1994 1995-2000 2001-2005 2008-09 2011-‐2012
ISI Export Promotion NAFTA NAFTA 2 CRISIS BOOM
Production (000) 478 352 872 1,280 1,647 2,100 2,293
Domestic (000) 458 295 518 322 415 414 378.1
Export (000) 20 56 353 958 1,232 1,661 1,914.8
Vehicles (of total of production) 62% 67% 75% 67% 59% 66% 65%
Trucks (of total production) 38% 33% 25% 33% 40% 34% 34%
% Imports (of total retail sales)
0 0 3% 30% 76% 58% 52%
Export radio 4% 16% 40% 75% 76% 79% 81%
Exports to NAFTA nd nd nd nd 96% 85% 70%
Participation of “The American Big Three” 48% 55% 62% 65% 60% 55% 52%
Sources: Author elaboration based on AMIA data base (several years)
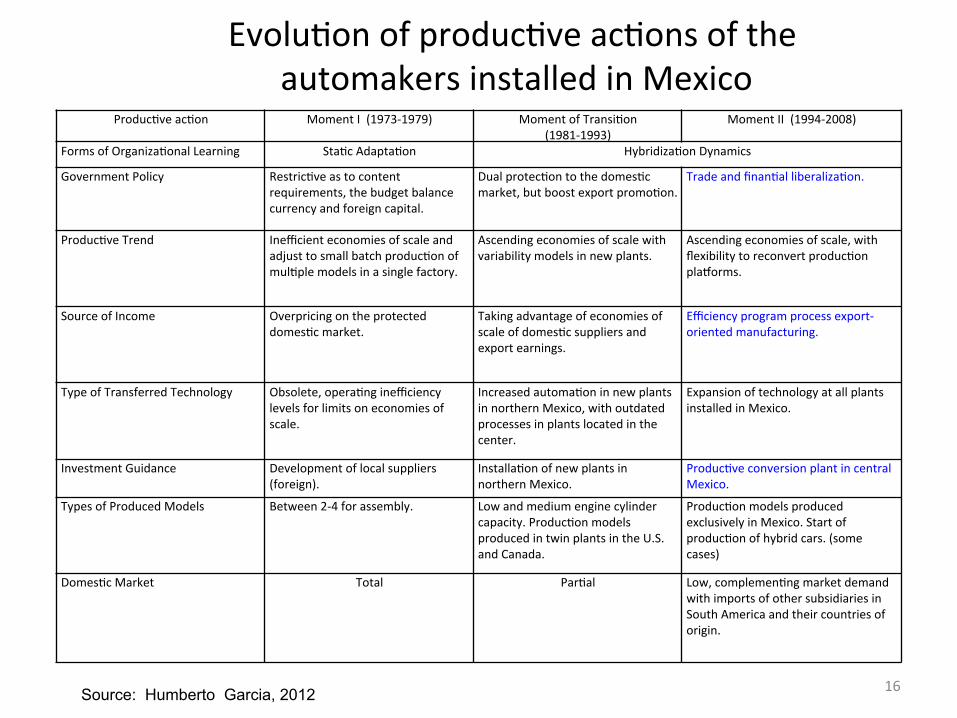
EvoluVon of producVve acVons of the automakers installed in Mexico
ProducVve acVon Moment I (1973-‐1979) Moment of TransiVon (1981-‐1993)
Moment II (1994-‐2008)
Forms of OrganizaVonal Learning StaVc AdaptaVon HybridizaVon Dynamics
Government Policy RestricVve as to content requirements, the budget balance currency and foreign capital.
Dual protecVon to the domesVc market, but boost export promoVon.
Trade and finanVal liberalizaVon.
ProducVve Trend Inefficient economies of scale and adjust to small batch producVon of mulVple models in a single factory.
Ascending economies of scale with variability models in new plants.
Ascending economies of scale, with flexibility to reconvert producVon plagorms.
Source of Income Overpricing on the protected domesVc market.
Taking advantage of economies of scale of domesVc suppliers and export earnings.
Efficiency program process export-‐oriented manufacturing.
Type of Transferred Technology Obsolete, operaVng inefficiency levels for limits on economies of scale.
Increased automaVon in new plants in northern Mexico, with outdated processes in plants located in the center.
Expansion of technology at all plants installed in Mexico.
Investment Guidance Development of local suppliers (foreign).
InstallaVon of new plants in northern Mexico.
ProducVve conversion plant in central Mexico.
Types of Produced Models Between 2-‐4 for assembly. Low and medium engine cylinder capacity. ProducVon models produced in twin plants in the U.S. and Canada.
ProducVon models produced exclusively in Mexico. Start of producVon of hybrid cars. (some cases)
DomesVc Market Total ParVal Low, complemenVng market demand with imports of other subsidiaries in South America and their countries of origin.
16 Source: Humberto Garcia, 2012

Source: Author elaboraVon based on Secretaría de Economía with informaVon from AMIA.
MEXICO: PRODUCTION, EXPORTS AND IMPORTS OF LV
(000s units)
0
500
1,000
1,500
2,000
2,500
3,000
2000 2001 2002 2003 2004 2005 2009 2010 2011 2012 (JAN-‐OCT)
ProducVon
Exports
Imports

43%
16% 4%
6% 1% 0% 0%
30%
MEXICO: Imports by country of origin, 2012 (Jan-‐Oct)
US
Germany
Spain
France
England
Italy
Switzerland
Japan
Source: Author elaboraVon based on Secretaría de Economía with informaVon from AMIA.

19
-‐ Export facts Export Ratio: 83% (2012) (of total production)
- 63% to US (22,000 dlls avg. per unit in 2010) - 14% of exports goes to Latin America (101% annual growth
2009-2011)
12 times Exports Growths (1980-2005)
Import facts
Import Ratio 54% (2012) (of total sales) (9,000 dlls avg. per unit in 2010) – Brands 300% growth – Models 700% growth
Source: AMIA, Banxico.

20
0.0%
5.0%
10.0%
15.0%
20.0%
25.0%
30.0%
35.0%
CHYSLER FORD GM HONDA NISSAN TOYOTA VW FIAT
LV Produc'on by firm (Porcenteges of Total)
2000 2004 2009 2011 2012 (Jan-‐Oct)
Source: Author elaboraVon based on AMIA data base.

0%
10%
20%
30%
40%
50%
60%
70%
80%
90%
100%
2008
2010
2012 (Jan-‐Oct)
2009
2011
2008
2010
2012 (Jan-‐Oct)
2009
2011
2008
2010
2012 (Jan-‐Oct)
2009
2011
2008
2010
2012 (Jan-‐Oct)
CHYSLER FORD GM HONDA NISSAN TOYOTA VW
Percentages
DomésVco Exportación
Mexico: Firm Strategy: Domes'c Produc'on and Exports
0
100
200
300
400
500
600
700
2008
2010
2012 (Jan-‐Oct)
2009
2011
2008
2010
2012 (Jan-‐Oct)
2009
2011
2008
2010
2012 (Jan-‐Oct)
2009
2011
2008
2010
2012 (Jan-‐Oct)
CHYSLER FORD GM HONDA NISSAN TOYOTA VW
000 units DomésVco
Exportación
Source: Author elaboraVon based on AMIA data base.
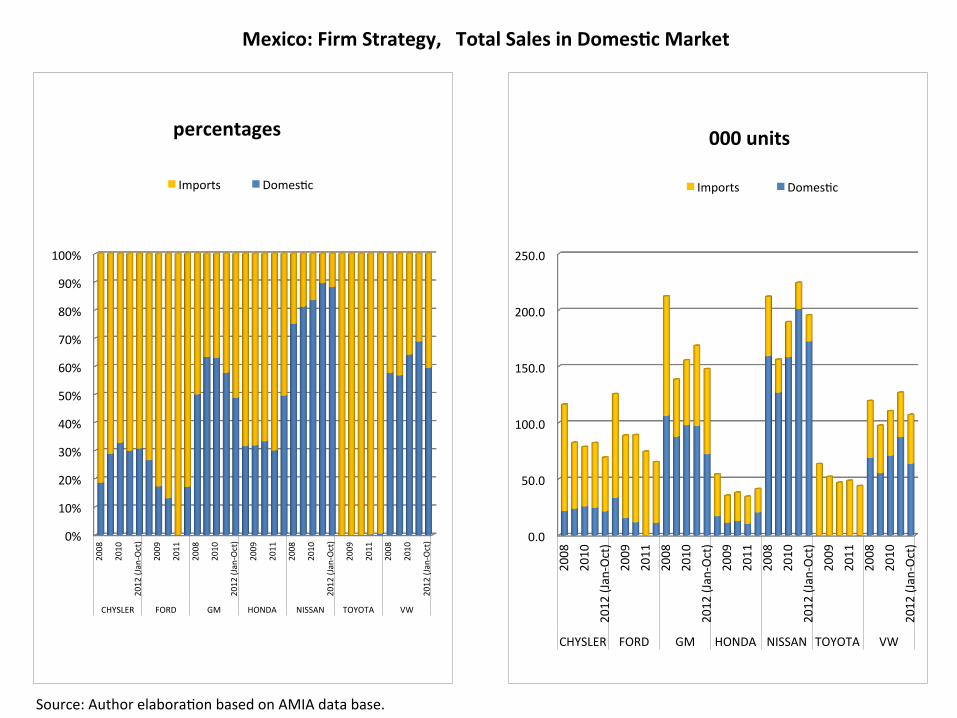
0%
10%
20%
30%
40%
50%
60%
70%
80%
90%
100%
2008
2010
2012 (Jan-‐Oct)
2009
2011
2008
2010
2012 (Jan-‐Oct)
2009
2011
2008
2010
2012 (Jan-‐Oct)
2009
2011
2008
2010
2012 (Jan-‐Oct)
CHYSLER FORD GM HONDA NISSAN TOYOTA VW
percentages
Imports DomesVc
0.0
50.0
100.0
150.0
200.0
250.0
2008
2010
2012 (Jan-‐Oct)
2009
2011
2008
2010
2012 (Jan-‐Oct)
2009
2011
2008
2010
2012 (Jan-‐Oct)
2009
2011
2008
2010
2012 (Jan-‐Oct)
CHYSLER FORD GM HONDA NISSAN TOYOTA VW
000 units
Imports DomesVc
Mexico: Firm Strategy, Total Sales in Domes'c Market
Source: Author elaboraVon based on AMIA data base.

Firms, plants and models (IlustraVve) Firm Plant Model
Kenworth Mexicali Heavy trucks
Ford Chihuahua Engines
Hermosillo LV
CuauVtlán LV, Precision tools
GM Ramos Arizpe, Coahuila LV, Engines
Silao, Guanajuato LV, engines
San Luis Potosí Trucks
Toluca Trucks
Chrysler Ramos Arizpe, Coahuila LV, engines
SalVllo, Coahuila. Pick-‐up Trucks
Toluca, Edo. México LV, engines
Source: AMIA.
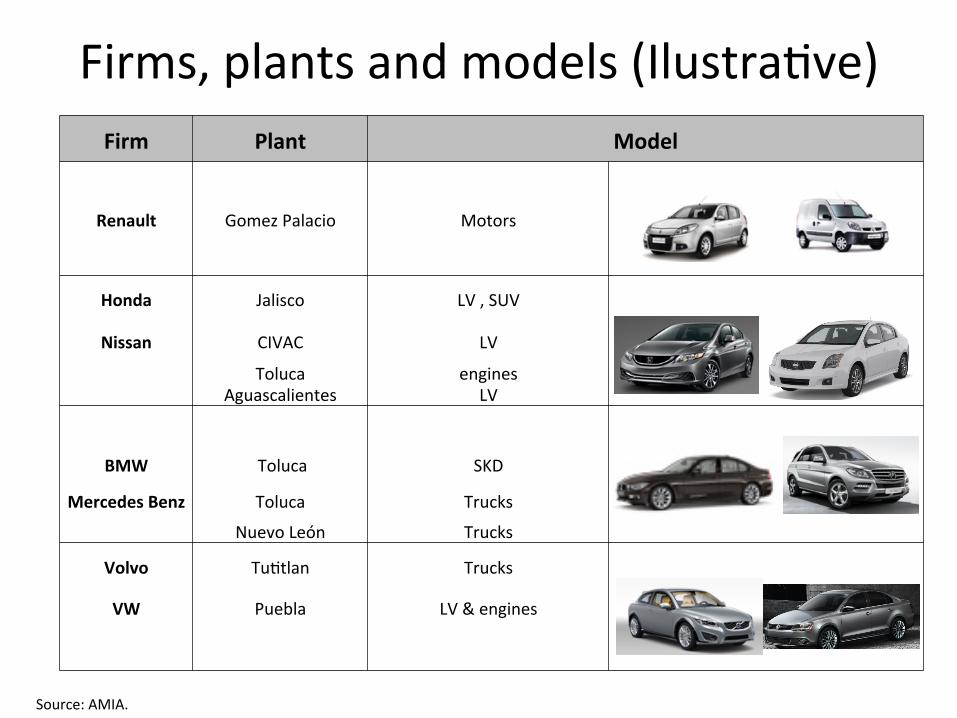
Firms, plants and models (IlustraVve) Firm Plant Model
Renault Gomez Palacio Motors
Honda Jalisco LV , SUV
Nissan CIVAC LV
Toluca Aguascalientes
engines LV
BMW Toluca SKD
Mercedes Benz Toluca Trucks
Nuevo León Trucks
Volvo TuVtlan Trucks
VW Puebla LV & engines
Source: AMIA.
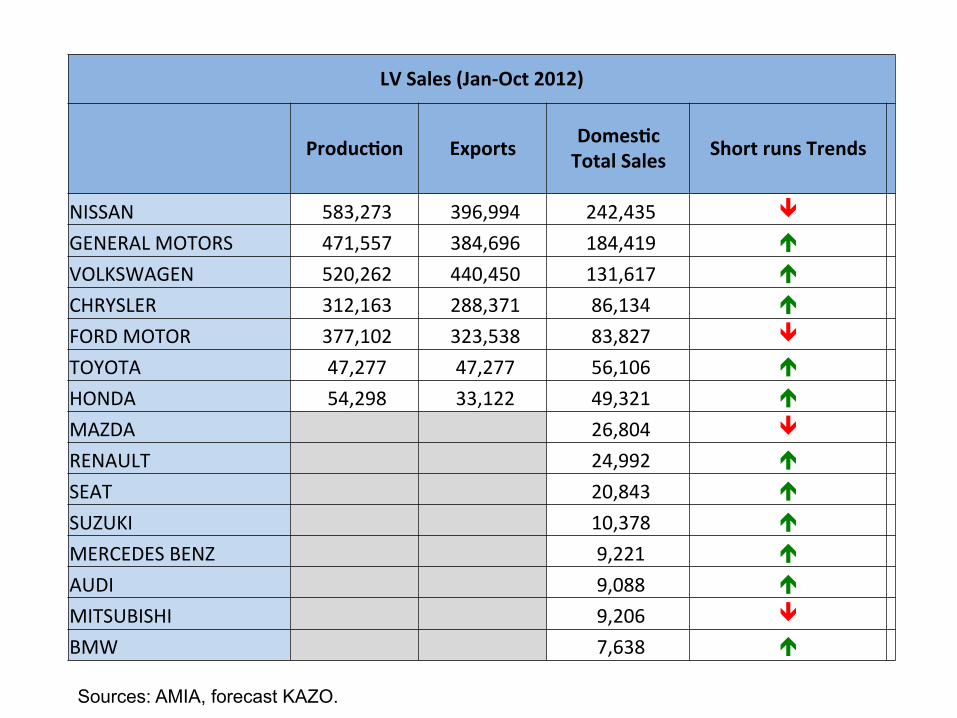
LV Sales (Jan-‐Oct 2012)
Produc'on Exports Domes'c Total Sales Short runs Trends
NISSAN 583,273 396,994 242,435 ê
GENERAL MOTORS 471,557 384,696 184,419 é
VOLKSWAGEN 520,262 440,450 131,617 é
CHRYSLER 312,163 288,371 86,134 é
FORD MOTOR 377,102 323,538 83,827 ê
TOYOTA 47,277 47,277 56,106 é
HONDA 54,298 33,122 49,321 é
MAZDA 26,804 ê
RENAULT 24,992 é
SEAT 20,843 é
SUZUKI 10,378 é
MERCEDES BENZ 9,221 é
AUDI 9,088 é
MITSUBISHI 9,206 ê
BMW 7,638 é
Sources: AMIA, forecast KAZO.
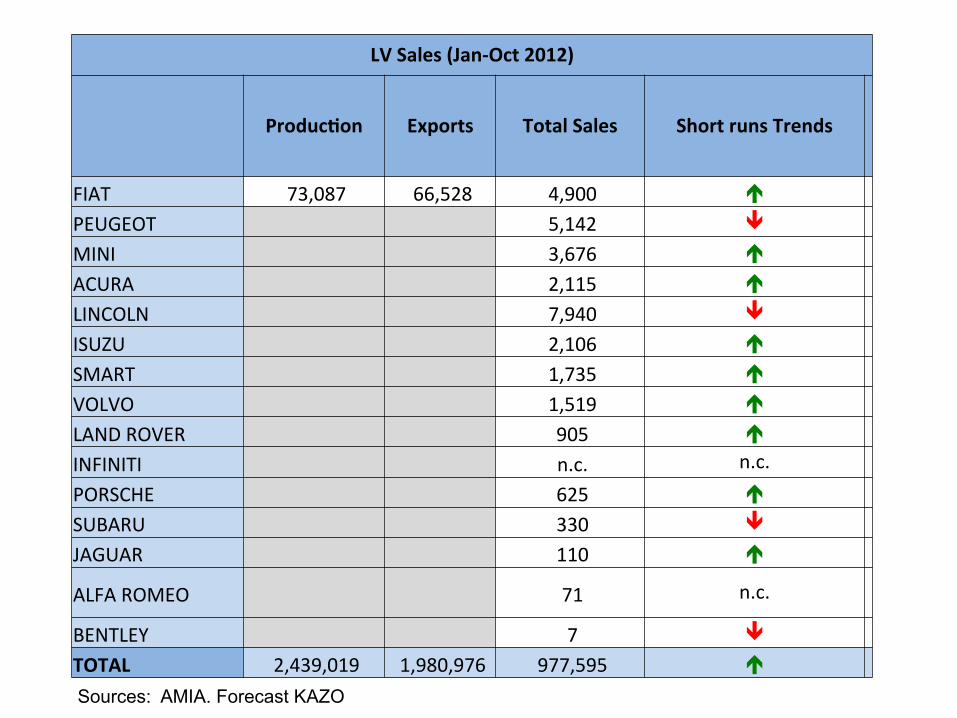
LV Sales (Jan-‐Oct 2012)
Produc'on Exports Total Sales Short runs Trends
FIAT 73,087 66,528 4,900 é
PEUGEOT 5,142 ê
MINI 3,676 é
ACURA 2,115 é
LINCOLN 7,940 ê
ISUZU 2,106 é
SMART 1,735 é
VOLVO 1,519 é
LAND ROVER 905 é
INFINITI n.c. n.c. PORSCHE 625 é
SUBARU 330 ê
JAGUAR 110 é
ALFA ROMEO 71 n.c.
BENTLEY 7 ê
TOTAL 2,439,019 1,980,976 977,595 é
Sources: AMIA. Forecast KAZO
27
0.000
0.200
0.400
0.600
0.800
1.000
1.200
1.400
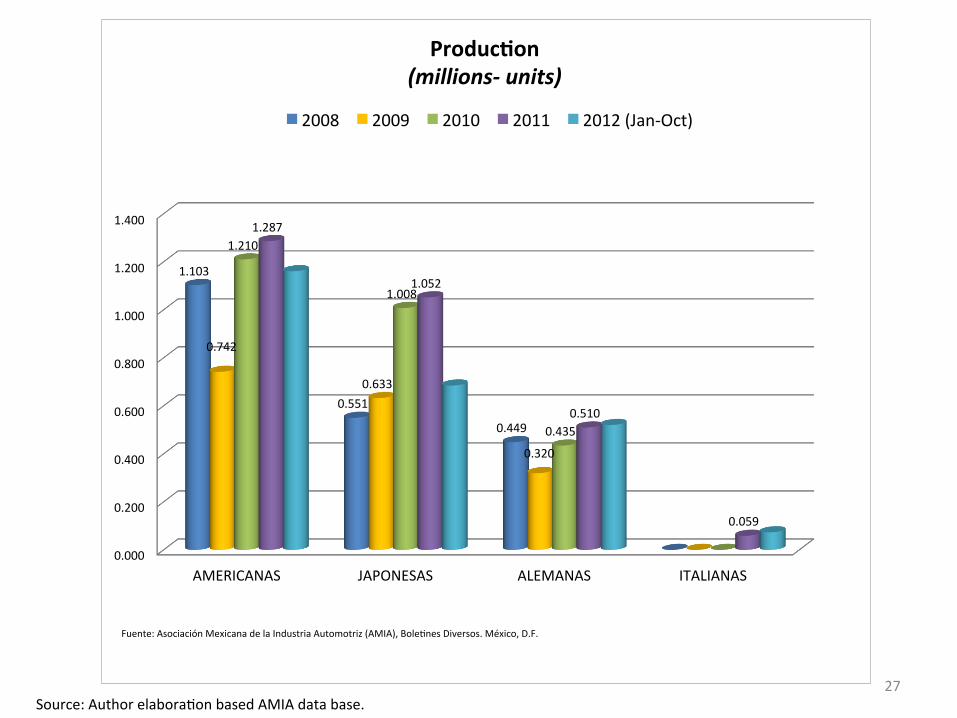
AMERICANAS JAPONESAS ALEMANAS ITALIANAS
1.103
0.551
0.449
0.742
0.633
0.320
1.210
1.008
0.435
1.287
1.052
0.510
0.059
Produc'on (millions-‐ units)
2008 2009 2010 2011 2012 (Jan-‐Oct)
Fuente: Asociación Mexicana de la Industria Automotriz (AMIA), BoleVnes Diversos. México, D.F.
Source: Author elaboraVon based AMIA data base.

28
931.7
788.3
646.7
1,149.0
1,069.1
161.3
149.6
307.7
494.4 593.6
340.1
163.7
272.1
429.3
684.8
0.0
200.0
400.0
600.0
800.0
1,000.0
1,200.0
1,400.0
2000 2004 2009 2011 2012 (Jan-‐Oct)
Export Produc'on (000 units)
AMERICANS JAPANESE
GERMANS
Source: AMIA 0.0%
10.0%
20.0%
30.0%
40.0%
50.0%
60.0%
2000 2004 2009 2011 2012 (Jan-‐Oct)
55.3%
49.0%
41.0%
37.2%
35.9%
23.1% 25.1%
31.2%
34.5%
40.8%
20.9% 19.0% 17.2% 18.6%
18.7%
% Domes'c Market
AMERICANAS JAPONESAS ALEMANAS Source: Author elaboraVon based AMIA data base.

2.1 SUPPLIERS
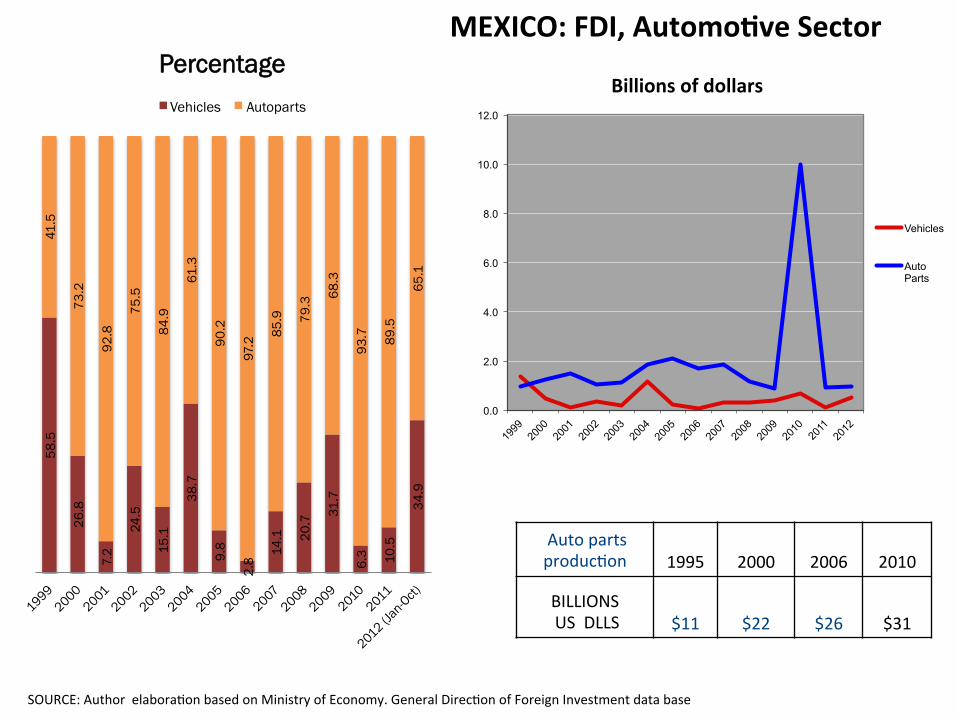
MEXICO: FDI, Automo've Sector
Auto parts producVon 1995 2000 2006 2010
BILLIONS US DLLS $11 $22 $26 $31
58.5
26.8
7.2
24.5
15.1
38.7
9.8
2.8
14.1
20.7
31.7
6.3 10
.5
34.9
41.5
73.2
92.8
75.5
84.9
61.3
90.2
97.2
85.9
79.3
68.3
93.7
89.5
65.1
Percentage Vehicles Autoparts
0.0
2.0
4.0
6.0
8.0
10.0
12.0
Billions of dollars
Vehicles
Auto Parts
SOURCE: Author elaboraVon based on Ministry of Economy. General DirecVon of Foreign Investment data base
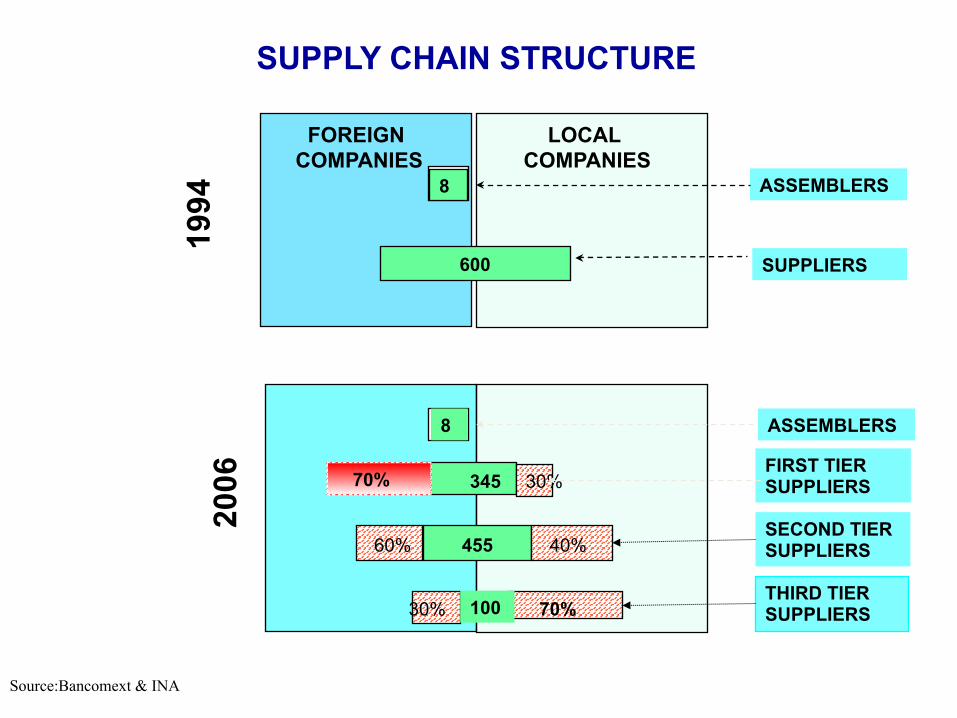
FOREIGN COMPANIES
LOCAL COMPANIES
ASSEMBLERS
FIRST TIER SUPPLIERS
SECOND TIER SUPPLIERS
THIRD TIER SUPPLIERS
8
600
ASSEMBLERS
SUPPLIERS
1994
20
06
8
345 30%
40% 60%
100 30% 70%
455
SUPPLY CHAIN STRUCTURE
Source:Bancomext & INA
70%

Auto Parts Facts Has become the hub for NAFTA: • 2,000 plants, aprox. in 2012 (1,100 in 2006; 650 in 1994) (Source: INA)
– 45% OES; 55% SMEs (2009) (Source: INA)
– 70% foreign 30% Mexicans (2009) (Source: INA)
• 80% of value goes to USA/Canada (2009) (Source: INA)
Spin-‐offs seen from the MNC MNC Ex-Managers that created their own company AUTO industry
38 (sample)
Average. New firms created
Total companies created AUTOS IND. 56 1.5
Became MNCs suppliers AUTO IND. 40%
Source:Bancomext & INA
Source: Contreras and Carrillo 2012

Source: Author elaboration based on CIEMEX-WEFA, 1991, 1997, 2004 y 2005.
MEXICO: Maquila Strategy? Maquila & IMMEX. Selected industries
1981-1989
27%
58%
15%
37%
43%
20% Garment
Electronics
Autoparts
2007-2010 (IMMEX) Plants
14%
62%
24%
23%
46%
31%
Employment % of Total Plants
1981 65 1991 50 2001 57 2006 54 2010 50
% Total Employ
80 68 74 72 70
3
HOW THE AUTO INDUSTRY IS
INTEGRATED IN MEXICO?
35
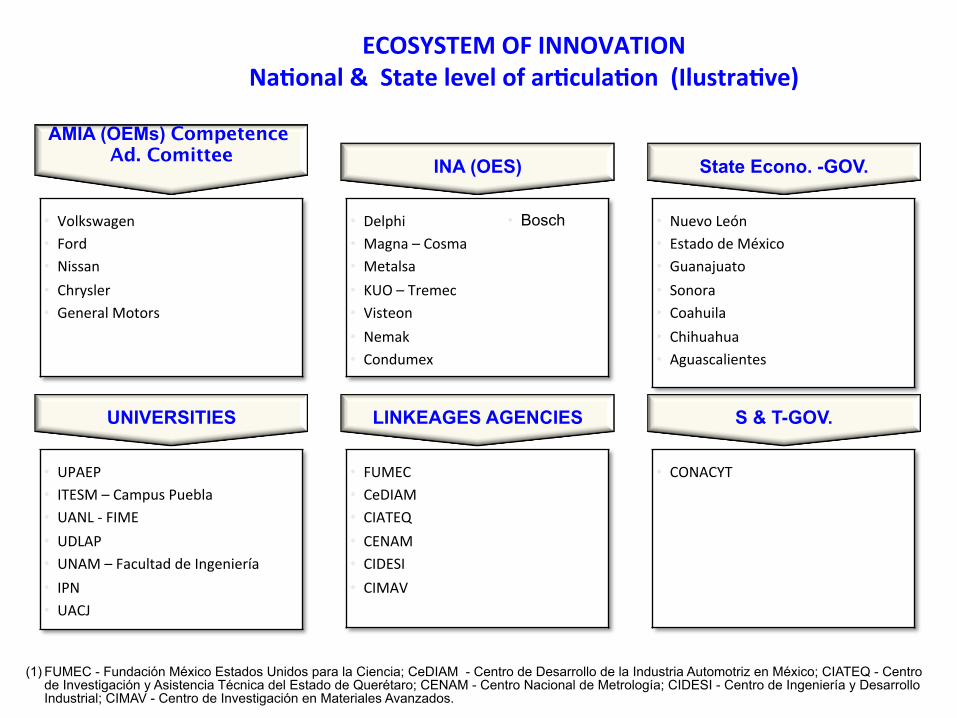
ECOSYSTEM OF INNOVATION Na'onal & State level of ar'cula'on (Ilustra've)
• Volkswagen • Ford • Nissan • Chrysler • General Motors
AMIA (OEMs) Competence Ad. Comittee
INA (OES) State Econo. -GOV.
• Delphi • Magna – Cosma • Metalsa • KUO – Tremec • Visteon • Nemak • Condumex
• Nuevo León • Estado de México • Guanajuato • Sonora • Coahuila • Chihuahua • Aguascalientes
• UPAEP • ITESM – Campus Puebla • UANL -‐ FIME • UDLAP • UNAM – Facultad de Ingeniería • IPN • UACJ
UNIVERSITIES LINKEAGES AGENCIES S & T-GOV.
• FUMEC • CeDIAM • CIATEQ • CENAM • CIDESI • CIMAV
• CONACYT
(1) FUMEC - Fundación México Estados Unidos para la Ciencia; CeDIAM - Centro de Desarrollo de la Industria Automotriz en México; CIATEQ - Centro de Investigación y Asistencia Técnica del Estado de Querétaro; CENAM - Centro Nacional de Metrología; CIDESI - Centro de Ingeniería y Desarrollo Industrial; CIMAV - Centro de Investigación en Materiales Avanzados.
• Bosch

Higher
Lower Lower
Technological development in Mexico
Higher
Capacities of Tech development Infraestructure − Design Centers − Test Labs.
• Human Resources − Concentration of
engineers by system
− Capabilities − Integration with
suppliers in Mexico
Current scope of tech. development • Value and number of projects-companies • Value and number of colaborative projects industry- universities • Value and number of projects with goverment funding
Power Train Vehicle Test
Materials
Exteriors
Interiors
Electric Electronic
Body
Chasis
Sample of firms & institutions interviewed, 2011
Source : ECLAC, 2012. Taken from. García 2012.
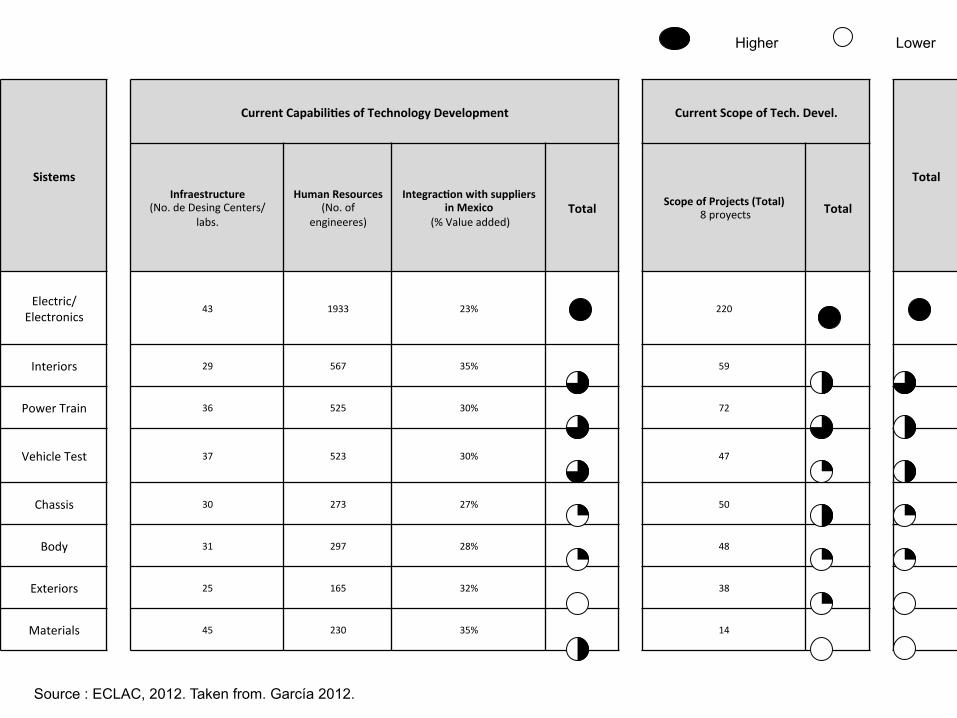
Sistems
Current Capabili'es of Technology Development Current Scope of Tech. Devel.
Total Infraestructure
(No. de Desing Centers/ labs.
Human Resources (No. of
engineeres)
Integrac'on with suppliers in Mexico
(% Value added) Total Scope of Projects (Total)
8 proyects Total
Electric/ Electronics
43 1933 23% 220
Interiors 29 567 35% 59
Power Train 36 525 30% 72
Vehicle Test 37 523 30% 47
Chassis 30 273 27% 50
Body 31 297 28% 48
Exteriors 25 165 32% 38
Materials 45 230 35% 14
Higher Lower
Source : ECLAC, 2012. Taken from. García 2012.

Design Centers (sample)
9
7
6
7
6
7
5
5
12
13
10
8
9
7
8
7
Electric-Electronics 21
Interiors 15
Power Train 16
Materials 20
Exteriors 12
Body 13
Chassis 14
Vehicle Test 15
Companies Universities
No of Design Centers = 28
Areas/ systems inside Design Centers
Universities / Research Centers = 14 Companies = 14
Source : ECLAC, 2012. Taken from. García 2012.

5 OEMS HAVE TEST CENTERS
Comments
• OEMS have their own test centers • At these sites, there are different types of tests, for
example: • Performance (acceleration, braking, Consumption,
Noise, A / C, Emissions) • Durability (life of the vehicle and its components) • Many tests are sent to Mexico to save costs • "It's cheaper testing in Mexico and is greatly
facilitated by the proximity to the U.S." - Director of OEM Engineering
• Almost all vehicle testing infrastructure works to less than 50% capacity.
• Some companies rent their facilities to third parties to perform tests. However this is not a common practice
Vehicle Test Centers in Mexico
Estado de México – 3 D.F. - 2
Puebla - 1
Aguascalientes - 1
Colima - 1
Vehicles Test Centers Centros = 9
Capacidad de desarrollo tecnológico - Infraestructura
Michoacán - 1
Source : ECLAC, 2012. Taken from. García 2012.

Sector opinions: "The work they do not require our engineers graduate" –
OEM Director of Engineering "To hire engineers by area there is no preference for
area of specialization, this is because no one meets the required specific profile" – OEM Director of Engineering
Human Resources. Engineers
The technological development of the sample is carried out mostly with undergraduate alumni
The system with the highest number of engineers in the sample is the Electric / Electronic
No. Of Engineers by system (Sample = 4,512)
Goverment opinions:
• En México se gradúan casi 100,000 ingenieros por año altamente calificados y compeVVvos
165230273297
523525567
1933
Vehcile Test
Power Train
Interiors
Electric /Electronic
Exteriors
Materials
Body
Chassis
PhD
2%
Master 11%
BA
87%
Source : ECLAC, 2012. Taken from. García 2012.
In Mexico, nearly 100,000 engineers graduating per year highly qualified and competitive

Research Projects, Sample
Technological Development Projects
• Electrical and Electronics • Thermal Resistance, electronic systems, embedded
systems, MEMS • Vehicle Testing • Vibration prototypes, improved noise, vibration and
roughness vehicle test stands, sensors, instrumentation, test methodology, emissions
• powertrain • Prediction of vibration, design new transmissions, motors
alternative energy • chassis • Lightweight structures, suspension, steering, axles • materials • Eco-friendly materials, light, efficient, strong • interiors • Validation interior plastic parts, interior design parts • Bodywork • Redesign of parts
Vehicle Test 9%
Exteriors 7%
Materials 3%
Power Train 13%
Chassis 9%
Interiors 11%
Electric/ Electronic 40%
Body 9%
Total = 548 projects
Distribu'on of Projects by System Examples
Source : ECLAC, 2012. Taken from. García 2012.

43
City with Delphi plants City with Delphi plants in joint venture City of Delphi plants and co-investment
Mexico Presence: 34 years in Mexico Present in 22 cities
More than 52,000 employees 46 Delphi plants
Three engineering centers 17 plants in joint venture
Over 100 customers Destination of products
90% to the U.S. and Canada
Source : Delphi presentation, 2012

Juárez Mexico Technical Center
44
Delphi Technical Centers
Querétaro Queretaro Techical Center in
co-investment Saltillo Tool Technical Center
§ More than 2,000 engineers
§ 284 patents § 3 Engineering Centers
CIATEQ, UACJ, ITESM
2011
Source : Delphi presentation, 2012

45
Mexican Technical Center (Juarez). Some Facts
• Mexico Technical Center is the largest Delphi technical center globally • Unique technical center with all divisions represented. • Opened in 1995 and expanded in 1997 • The "Launch Center" was annexed to the complex in 1999
Tests carried out in laboratories
• Materials analysis • calibraVon • ElectromagneVc CompaVbility • VibraVons and InstrumentaVon • Rapid prototyping • Substances care
– dimensional – durability – corrosion – Packaging Validation – analytical engineering
Source : Delphi presentation, 2012
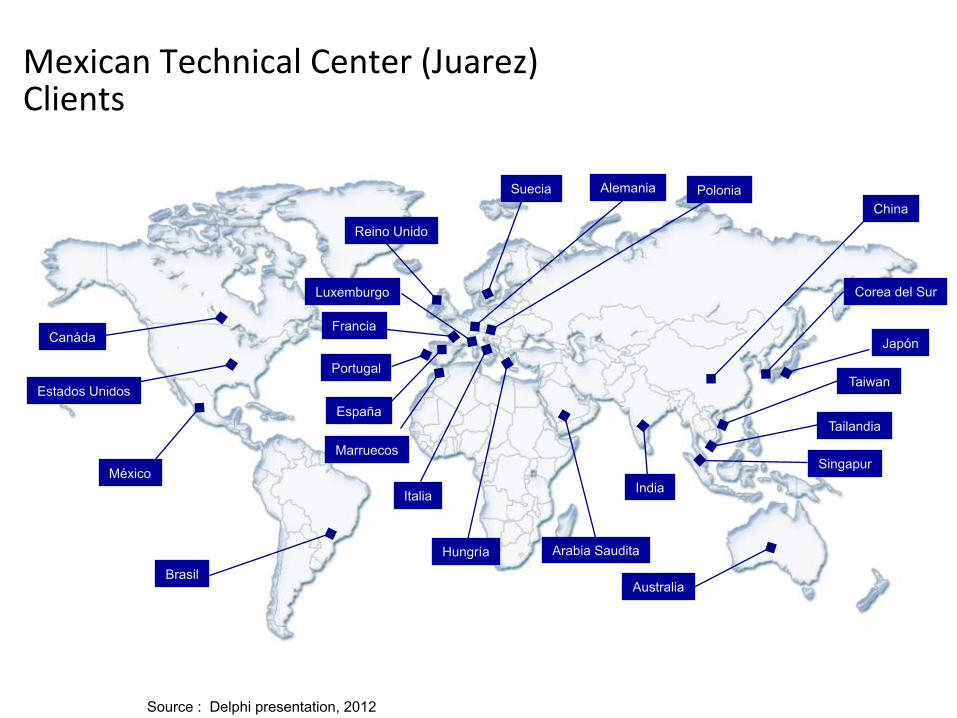
Mexican Technical Center (Juarez) Clients
Canáda
Estados Unidos
México
Brasil
España
Francia
Reino Unido
Suecia Alemania Polonia
Corea del Sur
Arabia Saudita Hungría
Italia
Luxemburgo
Singapur
Tailandia
Taiwan
China
India
Australia
Portugal
Japón
Marruecos
Source : Delphi presentation, 2012

4
WHAT TYPE OF EMPLOYMENT RELATIONS EXIST?

Index of the cost of manufacturing auto parts (Index 100=USA)
82.1
85.1
87
87.6
94.6
95
96.6
96.9
97
100
100.1
107.4
0 20 40 60 80 100 120
China
India
Mexico
Rusia
Brazil
UK
France
Canada
Italy
USA
Germany
Japan
Source: KASO & Asociados based on data from KPMG. Guide to international business location, 2012.

4.1 Employment
1997 2005 2012 500,000 (aprox.)
1’051,193
n.d.
CANADA + 500,000 US 3,500,000
5% OEMs 40% Auto Parts 8% Vehicle Dealers 16% Auto. Parts Stores 31% Auto. Repair Shops
50,000 OEMs 550,000 parts
49 Source: Author elaboration based on INEGI, AMIA, Secretará de Economía, INA

Par'cipa'on in the Global Value Chain
Ac'vi'es Par'cipa'on of Employment Automo've Manufacture
I. Pre Manufacture 2.19 2.90 II. Manufacture 69.80 67.30 III. Post Manufacture 28.01 29.70
100.0 100.0
Employment in the Global Value Chain (%)
Work areas Autos Manufacture R&D 2.2 3.0 ProducVon 69.8 67.3
MarkeVng & Sales 1.8 12.0
Customer Service 2.1 5.0
Accountancy & Management 8.4 9.1 Other AcVviVes 15.6 3.6 100 100
Mexico auto sector: GVC employment (Ilustrative)
Source: Carrillo, Contreras y Gomis, 2012. Multinational Survey in Mexico. Project COLEF-CONACYT # 55108, "Multinational Firms in Mexico: A study on organizational structure, innovation and employment practices", 2010
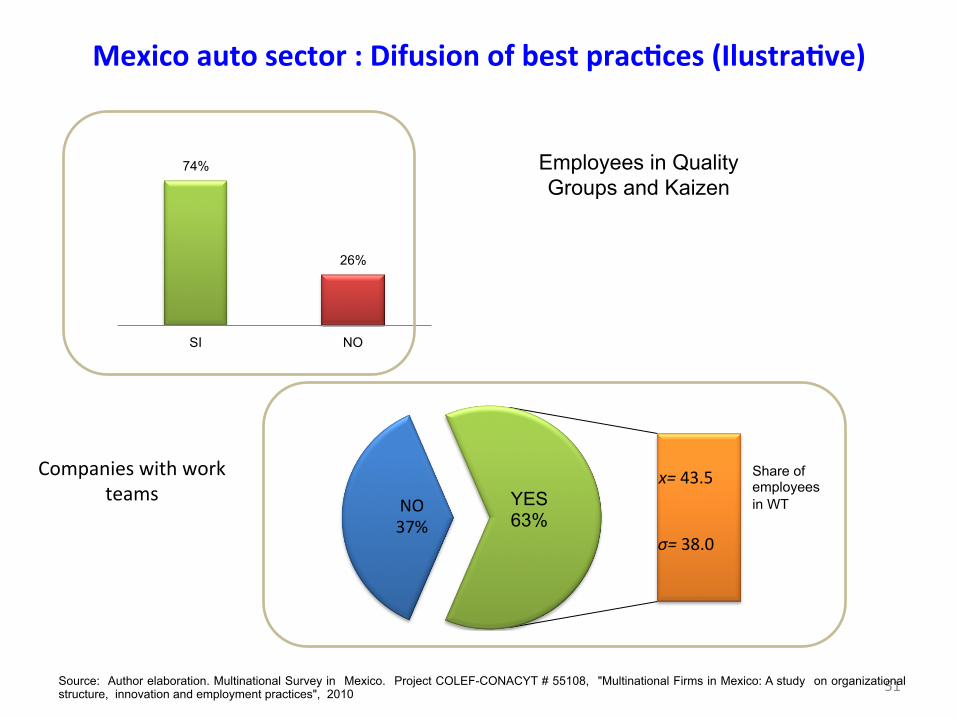
Mexico auto sector : Difusion of best prac'ces (Ilustra've)
74%
26%
SI NO
NO 37%
x= 43.5
σ= 38.0
YES 63%
Share of employees in WT
Companies with work teams
51
Employees in Quality Groups and Kaizen
Source: Author elaboration. Multinational Survey in Mexico. Project COLEF-CONACYT # 55108, "Multinational Firms in Mexico: A study on organizational structure, innovation and employment practices", 2010

4.2 Industrial RelaVons • Mexico’s automoVve supply base has developed into mature clusters of auto parts & OEMs satellite model, but...
• The compeVVveness and industrial upgrading of the automoVve sector is not reflected in salary levels of their workers.

Cost of Labor in Mexico in Automo've Mul'na'onals
MNC's Average Income Cost of labor a % 2007 of total cost
Employment Less than 500 2.72 32.5 More than 500 2.71 26.8 Total 2.71 28.3
Origin Mexico 3.73 28 United States 2.56 28.3 Rest of the World 2.72 28.4
Total 2.71 28.3
Cost of Labor in Mexico in Automo've Mul'na'onals
MNC's Minimum Wages < 5 mw > 5 mw
Employment Less than 500 63.10 36.40 More than 500 61.30 38.70
Origin Mexico 0.00 100.00 United States 75.00 25.00 Rest of the World 60.90 39.10
Total 61.90 38.10
Contrary to what is a common believe, the Mexican MNCs pays 45% more than MNC’s from the US and 37%
more than MNC’s from the rest of the
world
2012 Hour Wages averge (US dlls) OEMs 5-6 SUPPLIERS: 3-4
Source: Bensusán and,Carrillo, 2010. Multinational Survey in Mexico. Project COLEF-CONACYT # 55108, ‘Multinational Firms in Mexico: A study on organizational structure, innovation and employment practices’, 2010

Source: Besusán and Carrillo, 2010. Multinational Survey in Mexico. Project COLEF-CONACYT # 55108, ‘Multinational Firms in Mexico: A study on organizational structure, innovation and employment practices’, 2010
Level of employee representaVon (IlustraVve)
Yes
No
UNION
Union density 86% (19% EAP; 60% MNCs)
86%
14%

Annual average wages according level of employment representaVon
Source: Bensusán and Carrillo, 2010. Multinational Survey in Mexico. Project COLEF-CONACYT # 55108, ‘Multinational Firms in Mexico: A study on organizational structure, innovation and employment practices’, 2010

Capacity of individual business units to recognize unions
in Automotive Multinationals, 2008
MNC's Capacity (%) Nule Medium Total
Employment Less than 500 25.00 50.00 25.00 More than 500 24.00 56.00 20.00
Origin Mexico 0.00 100.00 0.00 United States 40.00 40.00 20.00 Rest of the World
12.00 65.00 24.00
Total 24.00 55.00 21.00
Managers Opinion: The company monitors the enforcement of labor rights of workers in supplier
companies or in each part of the processes outsourced
MNC's Capacity (%) Disagree No opinion In Accordance
Employment Less than 500 20.0 20.0 60.0 More than 500 6.9 13.8 79.3
Origin Mexico 0.0 33.3 66.7 United States 20.0 6.7 73.3 Rest of the World
4.8 19.0 76.2
Total 10.3 15.4 74.4
Managers opinion: The union representatives are cooperating to solve problems and achieve business
objectives
MNC's Capacity (%) Disagree No opinion In Accordance
Employment Less than 500 11.1 0.0 88.9 More than 500 7.4 11.1 81.5
Origin Mexico 0.0 0.0 100.0 United States 16.7 16.7 66.7 Rest of the World
4.8 4.8 90.5
Total 8.3 8.3 83.3
There is a correlation between medium recognition of Union and the level of wages…
Source: Bensusán and Carrillo, 2010. Multinational Survey in Mexico. Project COLEF-CONACYT # 55108, ‘Multinational Firms in Mexico: A study on organizational structure, innovation and employment practices’, 2010

5
CONCLUSIONS
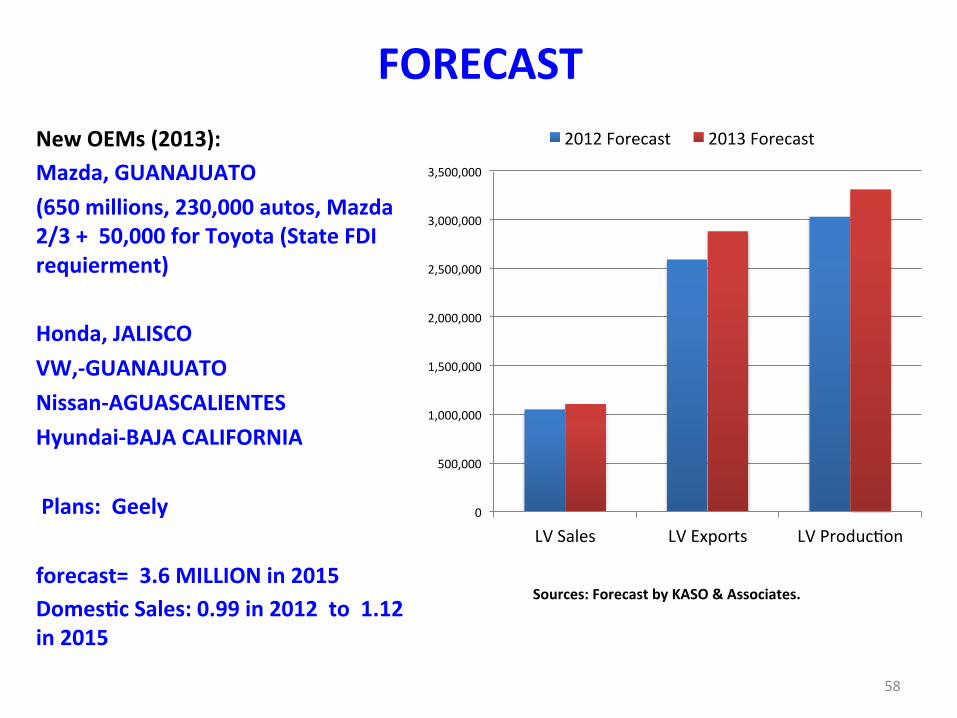
FORECAST New OEMs (2013): Mazda, GUANAJUATO (650 millions, 230,000 autos, Mazda 2/3 + 50,000 for Toyota (State FDI requierment) Honda, JALISCO VW,-‐GUANAJUATO Nissan-‐AGUASCALIENTES Hyundai-‐BAJA CALIFORNIA Plans: Geely forecast= 3.6 MILLION in 2015 Domes'c Sales: 0.99 in 2012 to 1.12 in 2015
58
0
500,000
1,000,000
1,500,000
2,000,000
2,500,000
3,000,000
3,500,000
LV Sales LV Exports LV ProducVon
2012 Forecast 2013 Forecast
Sources: Forecast by KASO & Associates.

2001 2008 2015* NAFTA 35 30 27 W.Europe 30 26 22 Japan 10 9 8 Subtotal 75 65 57 China 4 10 13 Rest of Asia 8 11 14 E. Europe 4 6 6 L. America 4 4 5 Other Markets 5 4 5 Subtotal 25 35 43
Light Vehicle Sales (%)
Sources: Automotive News; Global Insight; OICA;

• Path dependence
• Evolutive trajectory (Industrial Upgrading, intra-firm & inter-firm).
• Dynamism: Limited and slow. Need more enigneering design, research and development. More fiscal incentives
• Structural Heterogeneity. (Firm strategy; OEMs vs. suppliers; tiers 1, 2, 3; Regions; Ind. Relations enviroment)
Final thoughts (1)

Final thoughts (2)
• Overview from the data, mainly fro auto parts sector:
– High integraVon in the intra corporate global value chain
– Low-‐status posiVon in these strings: mandates specific producVve, highly specialized producVon, standardized products
– Guidance to external markets, but regional at global level
– Import of R &D rather than local made
Final thoughts (3) • This suggests that the GVC to which most auto firms are built in Mexico, are of a hierarchical type
• Dynamics associated with innovaVon are mainly outside Mexico
• But, learning process and upgrading local capabiliVes occurred (adaptaVve innovaVon –Ford/VW, etc.) Especially in 1st. Tier suppliers. Some tech. leaders such as Delphi.

References AMIA, Asociación de la Industria Automotriz Mexicana, México, data Base and Bulletins. www.amia.com.mx
Automotive News, (several months) www.autonews.com Bancomext, Banco Nacional de Comercio Exterior, México (several presentations) www.bancomext.com Banxico, Banco Nacional de Mexico (internal documents) www.banxico.com Graciela Bensusan, Jorge Carrillo and Ismael Plascencia, 2010, "Social Responsibility and Multinationals" XVIII International Gerpisa Coloquium, Berlin, June 9-11, Jorge Carrillo, Oscar Contreras and Gomis, 2012, “ Investment Strategies and Global Value Chain in the Automotive Industry", Paper presented at XX International Gerpisa Coloquium, Krakow, May 30-June1 Oscar Contreras, Jorge Carrillo y Jorge Alonso “Local Entrepreneurship within Global Value Chains: A case study in the Mexican Automotive Industry” World Development, Vol. 40, no. 5, pp.1013-1023, 2012 CIEMEX-WEFA, (several years) Forecasting company Delphi, Mexican Technical Center, Juarez (internal document), 2012 Eclac, Inversión Extranjera en América Latina, Comisión Económica para América Ltina, Santiago, 2012 www.eclac.org/ Global Insight (several years) www.ihs.com/products/global-insight INA, Instituto Nacional de Autopartes (bulletins and presentations) www.ina.org.mx KAZO & Asociados, Diagnóstico y perspectivas económicas de la indusria automotriz de México, Presentación parala Reunión de Evaluación de la Industria Automotriz RESA-INA, November 9, 2012. Mexico Now, Revista Bimensula de Maquiladoras y Negocios en Mexico, Chihuhua (several numbers) www.mexico-now.com Multinational Survey in Mexico. Project COLEF-CONACYT # 55108, "Multinational Firms in Mexico: A study on organizational structure, innovation and employment practices", 2010 OICA (several years) www.oica.net Secretaria de Economia, Goberino de Mexico, Mexico (data base) www.economia.gov.mx
63