Evidence Table 4. Patient/Provider Education: Asthma … · Patient/Provider Education: Asthma...
25
August 2007 Evidence Table 4. Patient/Provider Education: Asthma Self-Management Education for Children Abbreviations used in table: AHR airway hyperresponsiveness ED emergency department FEV 1 forced expiratory volume in 1 sec GEE generalized estimating equation GINA global initiative for asthma GP general practitioner ICS inhaled corticosteroid ITT intent-to-treat analysis logDRS logarithmically transformed dos-response slope of methacholine NAEPP-II National Asthma Education and Prevention Program OR Odds Ratio PEF peak expiratory flow PEFR peak expiratory flow rate pMDI pressurized metered-dose inhaler SMD standardized mean difference between intervention and control reported in meta analysis 95% CI 95% Confidence Interval * indicates primary outcome 1
Transcript of Evidence Table 4. Patient/Provider Education: Asthma … · Patient/Provider Education: Asthma...
August 2007
Evidence Table 4. Patient/Provider Education: Asthma Self-Management Education for Children Abbreviations used in table: AHR airway hyperresponsiveness ED emergency department FEV1 forced expiratory volume in 1 sec GEE generalized estimating equation GINA global initiative for asthma GP general practitioner ICS inhaled corticosteroid ITT intent-to-treat analysis logDRS logarithmically transformed dos-response slope of methacholine NAEPP-II National Asthma Education and Prevention Program OR Odds Ratio PEF peak expiratory flow PEFR peak expiratory flow rate pMDI pressurized metered-dose inhaler SMD standardized mean difference between intervention and control
reported in meta analysis 95% CI 95% Confidence Interval
* indicates primary outcome
1
August 2007
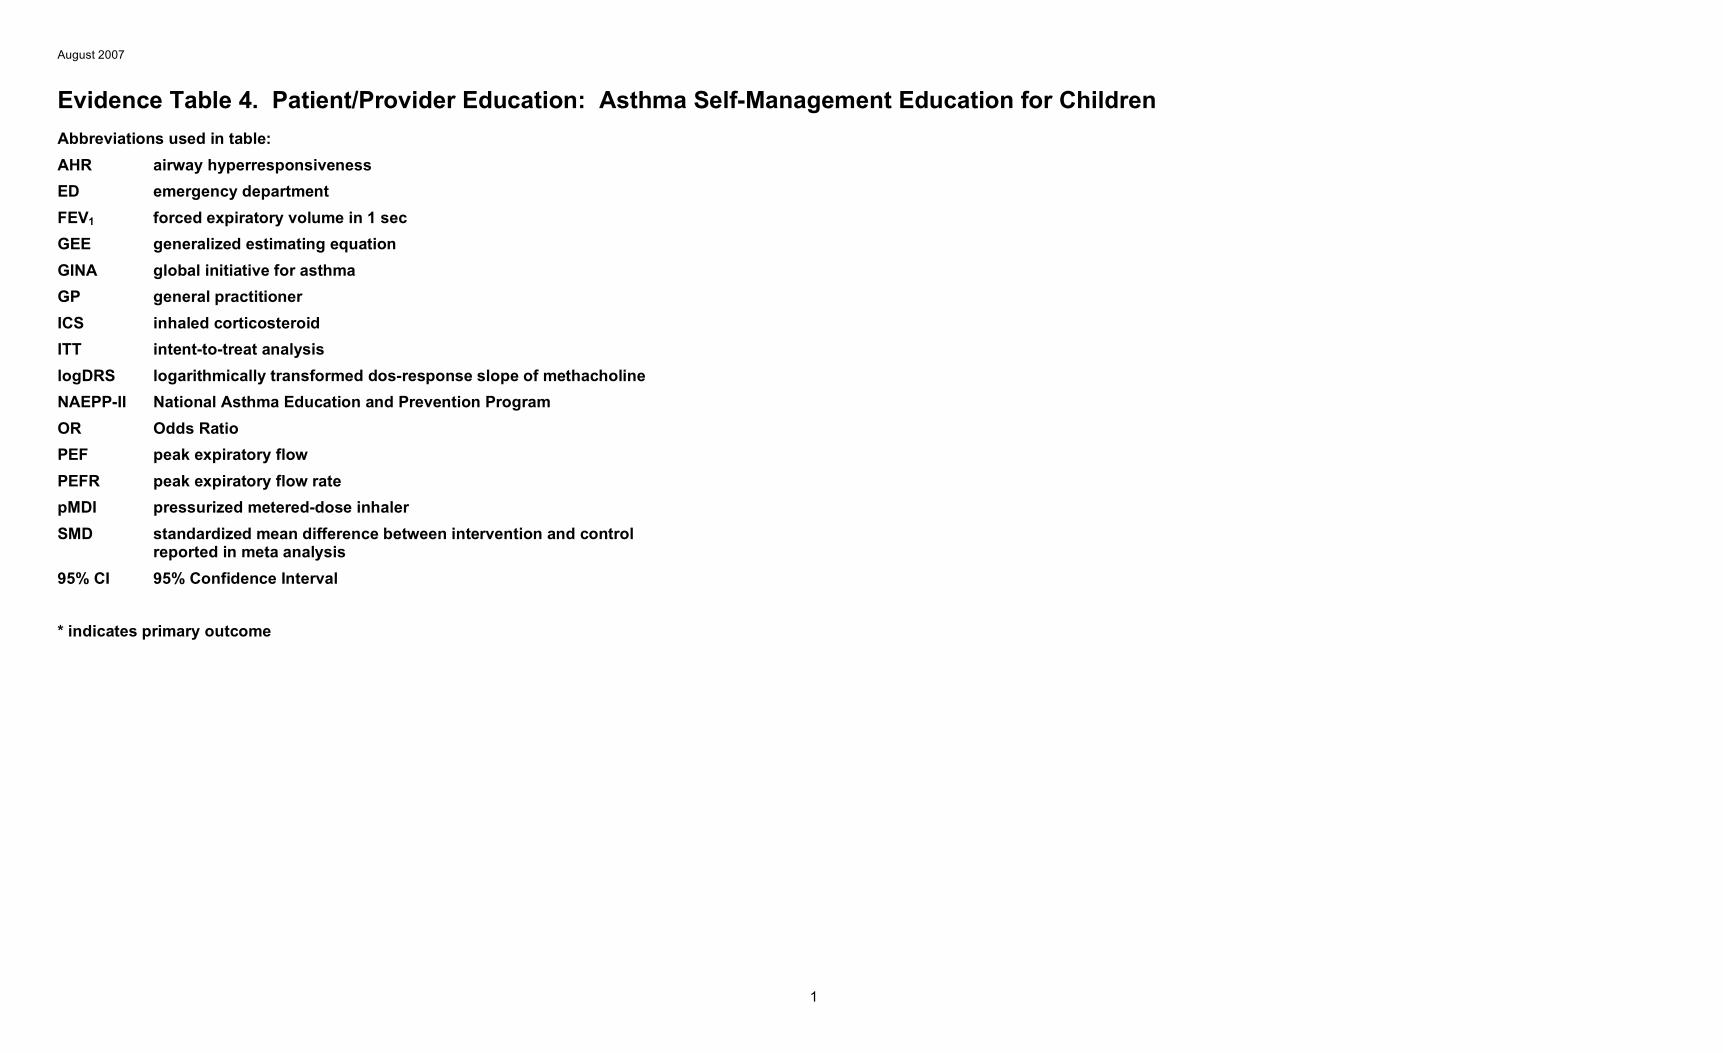
Evidence Table 4. Patient/Provider Education: Asthma Self-Management Education for Children A. ASTHMA SELF-MANAGEMENT EDUCATION FOR CHILDREN IN CLINIC-BASED SETTINGS
Citation (Sponsor)
Study Design Purpose/ Objective
Study N (Number
Evaluable)
Population Characteristics
Asthma Severity at Baseline (if reported)
Treatment Duration of Active Treatment; Duration of
Post-Intervention/ Off-Treatment
Followup
Lung Function Vital Signs/ Cardiovascular/
Clinical Laboratory Values
Morbidity Knowledge/Quality of Life
Ronchetti et al. Asthma self-management programmes in a population of Italian children: a multicentric study. Eur Respir J 1997;10(6): 1248–1253. (Progetto Finalizzato Medicina Preventiva, Subprogetto Medicina Perinatale, Consiglio Nazionale delle Ricerche (CNR) Italy )
Randomized, controlled trial (14 medical centers specialized in care of pediatric asthma; random assignment within centers by severity, gender, and age; 2 centers did not follow protocol and dropped out of study)
To test whether 2 well-known programs would be similarly effective in reducing asthma morbidity and whether shortening the 2 programs to 4 sessions each would reduce their cost without diminishing their effectiveness
312 (209)
Age 6–14 yr, mean = 9.6 yr Gender 65% male, 35% female
FEV1 % pred., mean = 92 Asthma attacks, mean = 0.7 events/patient/2 months Hospitalizations, mean = 0.04 Emergency treatments, mean = 0.21 Medications taken, mean = 54.4 (number of drug x daily doses x days) Severity score, range 5–15, mean = 7.4
Intervention group (LwA) Basic information delivered in a group format with extensive use of written diaries (n=40 Phase I; n=58 Phase II) Intervention group (OA) Basic information in an approach that encouraged sharing problems and developing solutions together (n=74 Phase I; n=56 Phase II) Comparison group (C): Standard care without education program (n=28 Phase I, n=56 Phase II within LwA centers; n=67 Phase I, n=39 Phase II within OA centers) (LwA and OA across both phases are considered experimental group E.)
8 weeks Phase I; 4 weeks Phase II; followup 11–12 months after end of educational programs
OA had fewer emergency treatments than C (p<0.03); no difference in emergency treatments for LwA vs. C. Emergency treatments differed for E vs. C in Phase I (p<0.04), but not in Phase II. Difference in emergency treatment for E vs. C for those with severe asthma (p<0.05). In E, children with severe asthma consumed more medications than those with milder asthma (p<0.001). No difference based on length of program.
2
August 2007
Citation (Sponsor)
Study Design Purpose/ Objective
Study N (Number
Evaluable)
Population Characteristics
Asthma Severity at Baseline (if reported)
Treatment Duration of Active Treatment; Duration of
Post-Intervention/ Off-Treatment
Followup
Lung Function Vital Signs/ Cardiovascular/
Clinical Laboratory Values
Morbidity Knowledge/Quality of Life
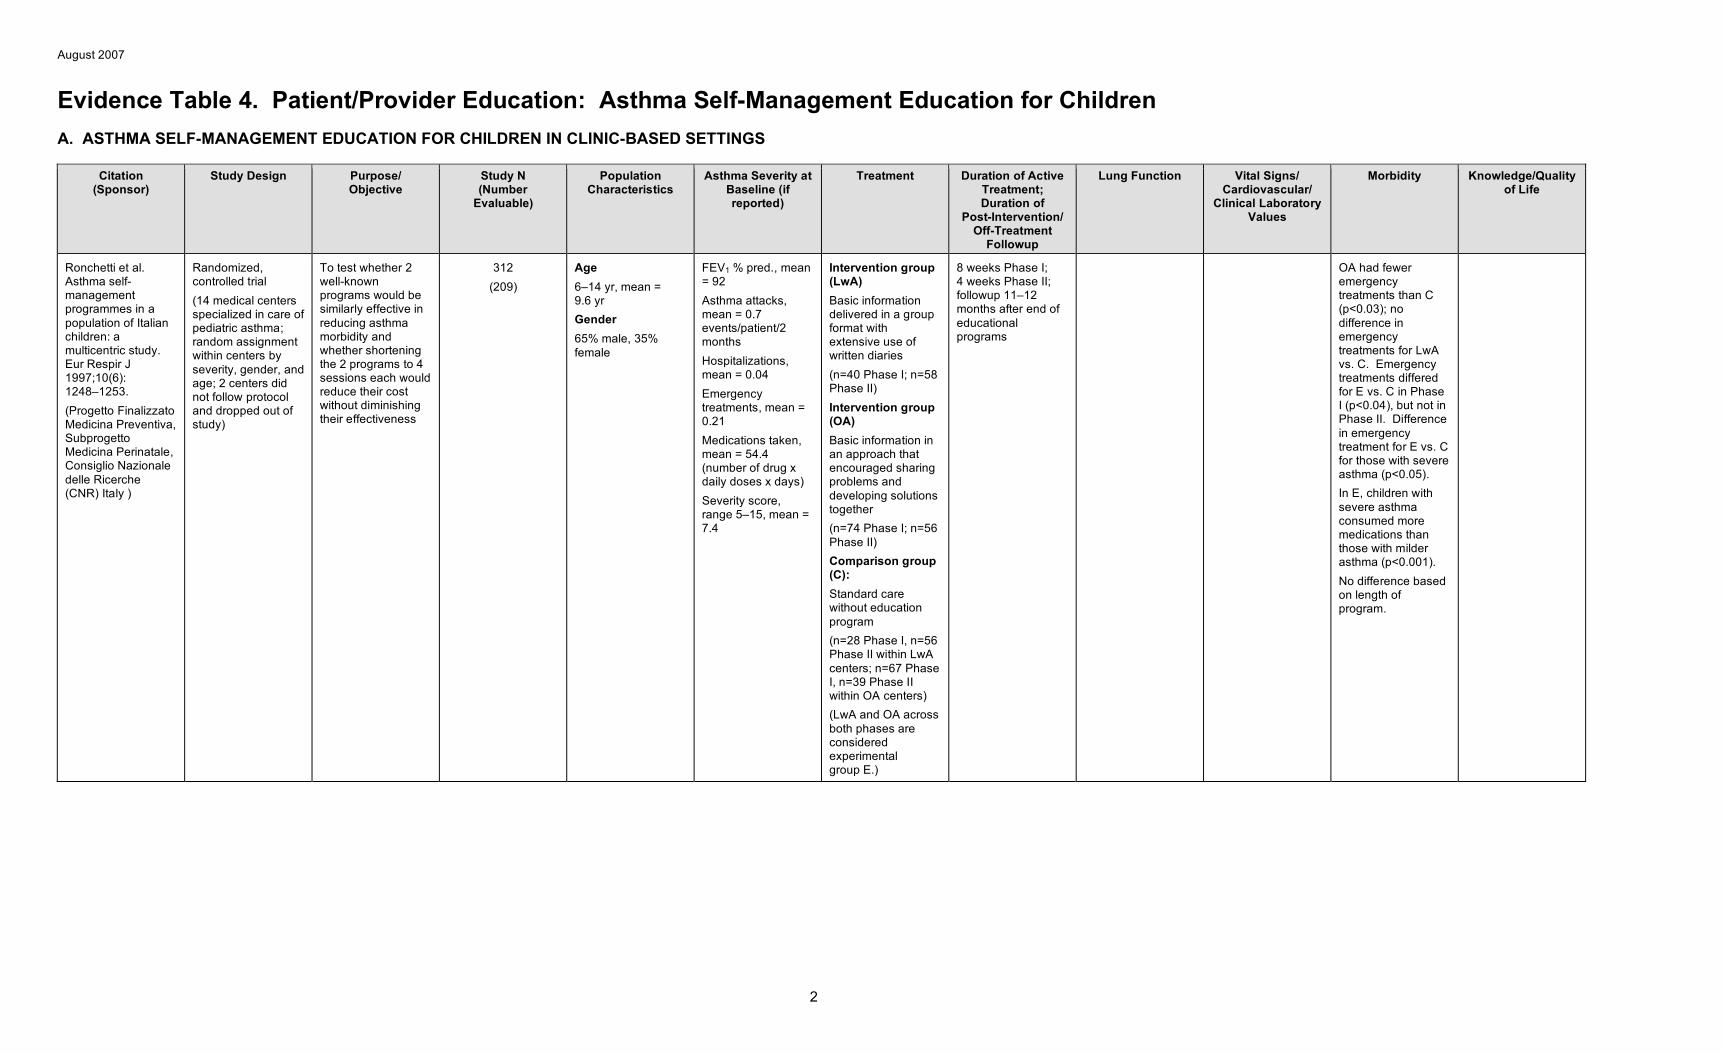
Agertoft & Pedersen. Importance of training for correct Turbuhaler use in preschool children. Acta Paediatr 1998;87(8): 842–847.
Prospective, randomized, controlled, single-blind, parallel-group study
To assess whether training and experience improve the peak inspiratory flow rates of young children who are generally considered incapable of consistently producing effective inspiratory flow rates
72 (71)
Age 3–5.9 yr, mean = 4.5 yr Gender 58% male, 42% female Height 92.5–118.5 cm, mean = 106 cm Weight 12.9–33.2 kg, mean = 18.3 kg
All had bronchial asthma and were receiving inhaled anti-inflammatory therapy through a pMDI and spacer None with acute wheeze None experienced using dry powder inhalers
Intervention group (E): Training at hospital, individualized training, and placebo Turbuhaler for practice at home (n=36) Control group (C): Training at hospital (n=36; n=35 completers) (Stratified random assignment by age)
Assessment 2 weeks after training
*After training, E showed higher increase in PIF vs. C (mean diff 10 l/min, p=0.014). Change observed among 4-and 5-year-olds; no difference among 3-year-olds. No difference in change in IVC for E vs. C (mean diff. 0.11, p=0.055). Home training associated with greater change in PIF for E vs. C (mean diff. = 7.6 l/min, p=0.015) with change greater for 4- and 5-year-olds vs. 3-year-olds. Mean change in IVC favored E vs. C (diff. = 0.12 liters, p=0.014) with smaller increases among young children. (Mean frequency of home training was 5.2 times/day.)
3
August 2007
Citation (Sponsor)
Study Design Purpose/ Objective
Study N (Number
Evaluable)
Population Characteristics
Asthma Severity at Baseline (if reported)
Treatment Duration of Active Treatment; Duration of
Post-Intervention/ Off-Treatment
Followup
Lung Function Vital Signs/ Cardiovascular/
Clinical Laboratory Values
Morbidity Knowledge/Quality of Life
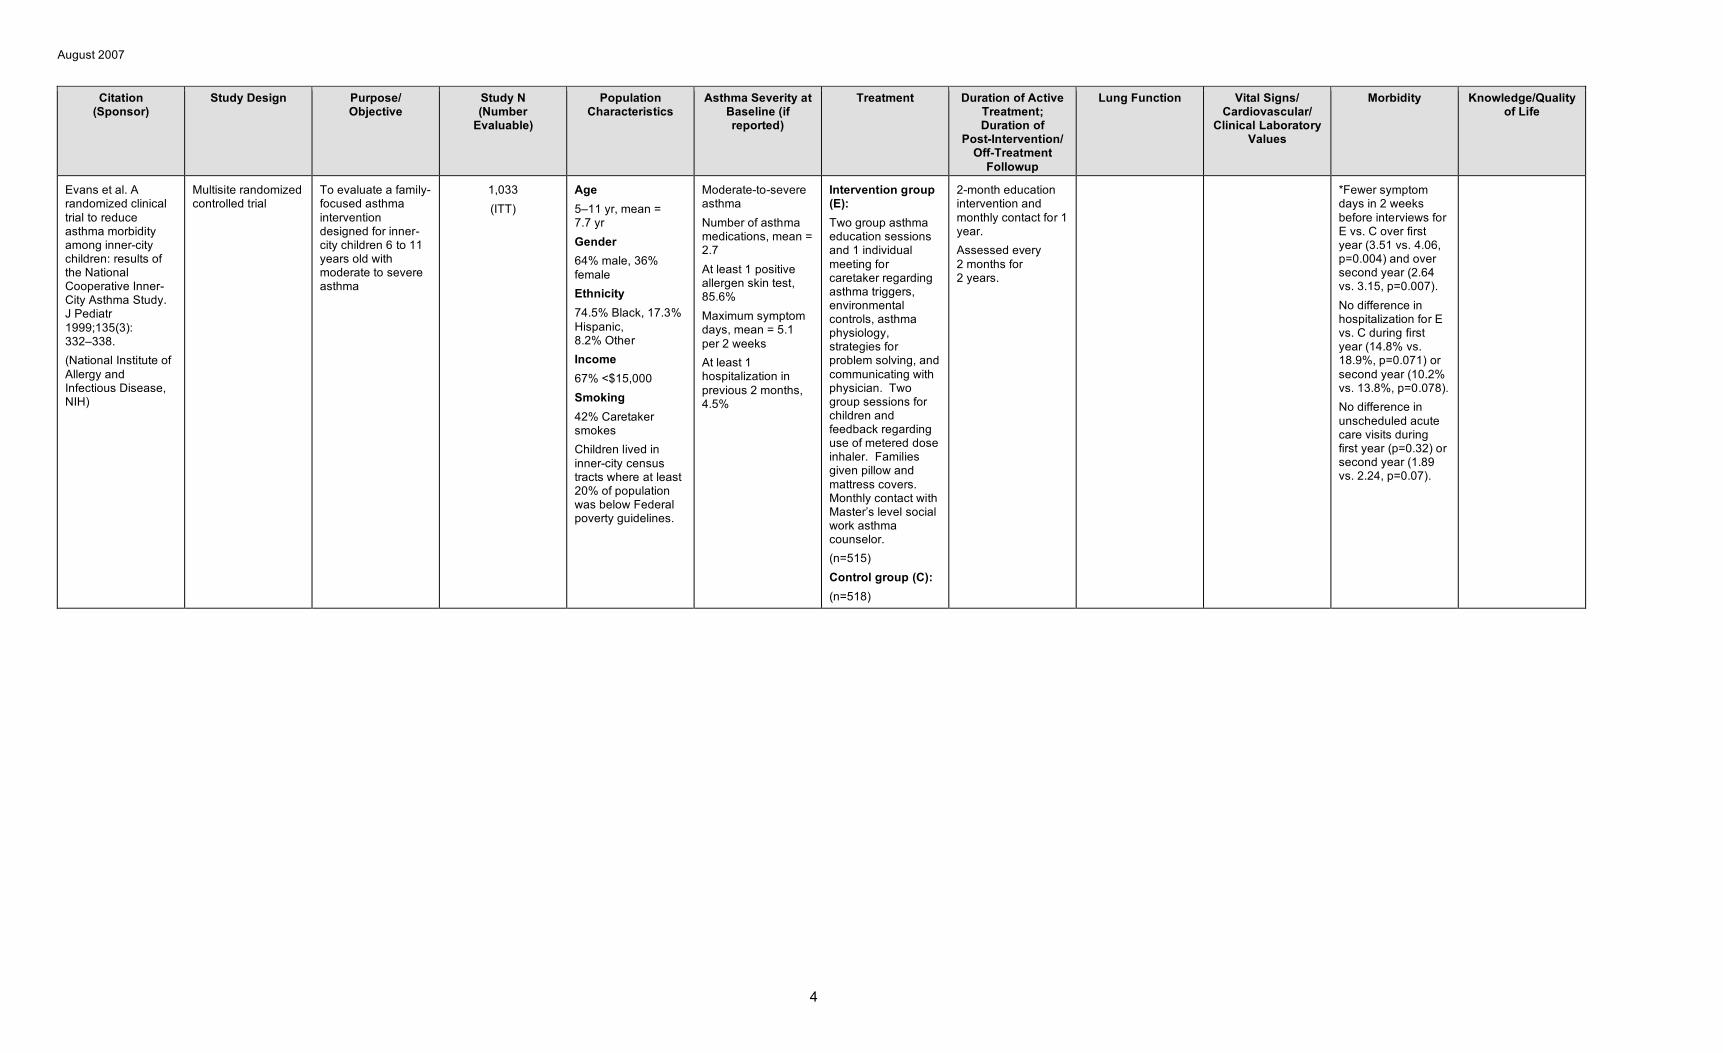
Evans et al. A randomized clinical trial to reduce asthma morbidity among inner-city children: results of the National Cooperative Inner-City Asthma Study. J Pediatr 1999;135(3): 332–338. (National Institute of Allergy and Infectious Disease, NIH)
Multisite randomized controlled trial
To evaluate a family-focused asthma intervention designed for inner-city children 6 to 11 years old with moderate to severe asthma
1,033 (ITT)
Age 5–11 yr, mean = 7.7 yr Gender 64% male, 36% female Ethnicity 74.5% Black, 17.3% Hispanic, 8.2% Other Income 67% <$15,000 Smoking 42% Caretaker smokes Children lived in inner-city census tracts where at least 20% of population was below Federal poverty guidelines.
Moderate-to-severe asthma Number of asthma medications, mean = 2.7 At least 1 positive allergen skin test, 85.6% Maximum symptom days, mean = 5.1 per 2 weeks At least 1 hospitalization in previous 2 months, 4.5%
Intervention group (E): Two group asthma education sessions and 1 individual meeting for caretaker regarding asthma triggers, environmental controls, asthma physiology, strategies for problem solving, and communicating with physician. Two group sessions for children and feedback regarding use of metered dose inhaler. Families given pillow and mattress covers. Monthly contact with Master’s level social work asthma counselor. (n=515) Control group (C): (n=518)
2-month education intervention and monthly contact for 1 year. Assessed every 2 months for 2 years.
*Fewer symptom days in 2 weeks before interviews for E vs. C over first year (3.51 vs. 4.06, p=0.004) and over second year (2.64 vs. 3.15, p=0.007). No difference in hospitalization for E vs. C during first year (14.8% vs. 18.9%, p=0.071) or second year (10.2% vs. 13.8%, p=0.078). No difference in unscheduled acute care visits during first year (p=0.32) or second year (1.89 vs. 2.24, p=0.07).
4
August 2007
Citation (Sponsor)
Study Design Purpose/ Objective
Study N (Number
Evaluable)
Population Characteristics
Asthma Severity at Baseline (if reported)
Treatment Duration of Active Treatment; Duration of
Post-Intervention/ Off-Treatment
Followup
Lung Function Vital Signs/ Cardiovascular/
Clinical Laboratory Values
Morbidity Knowledge/Quality of Life
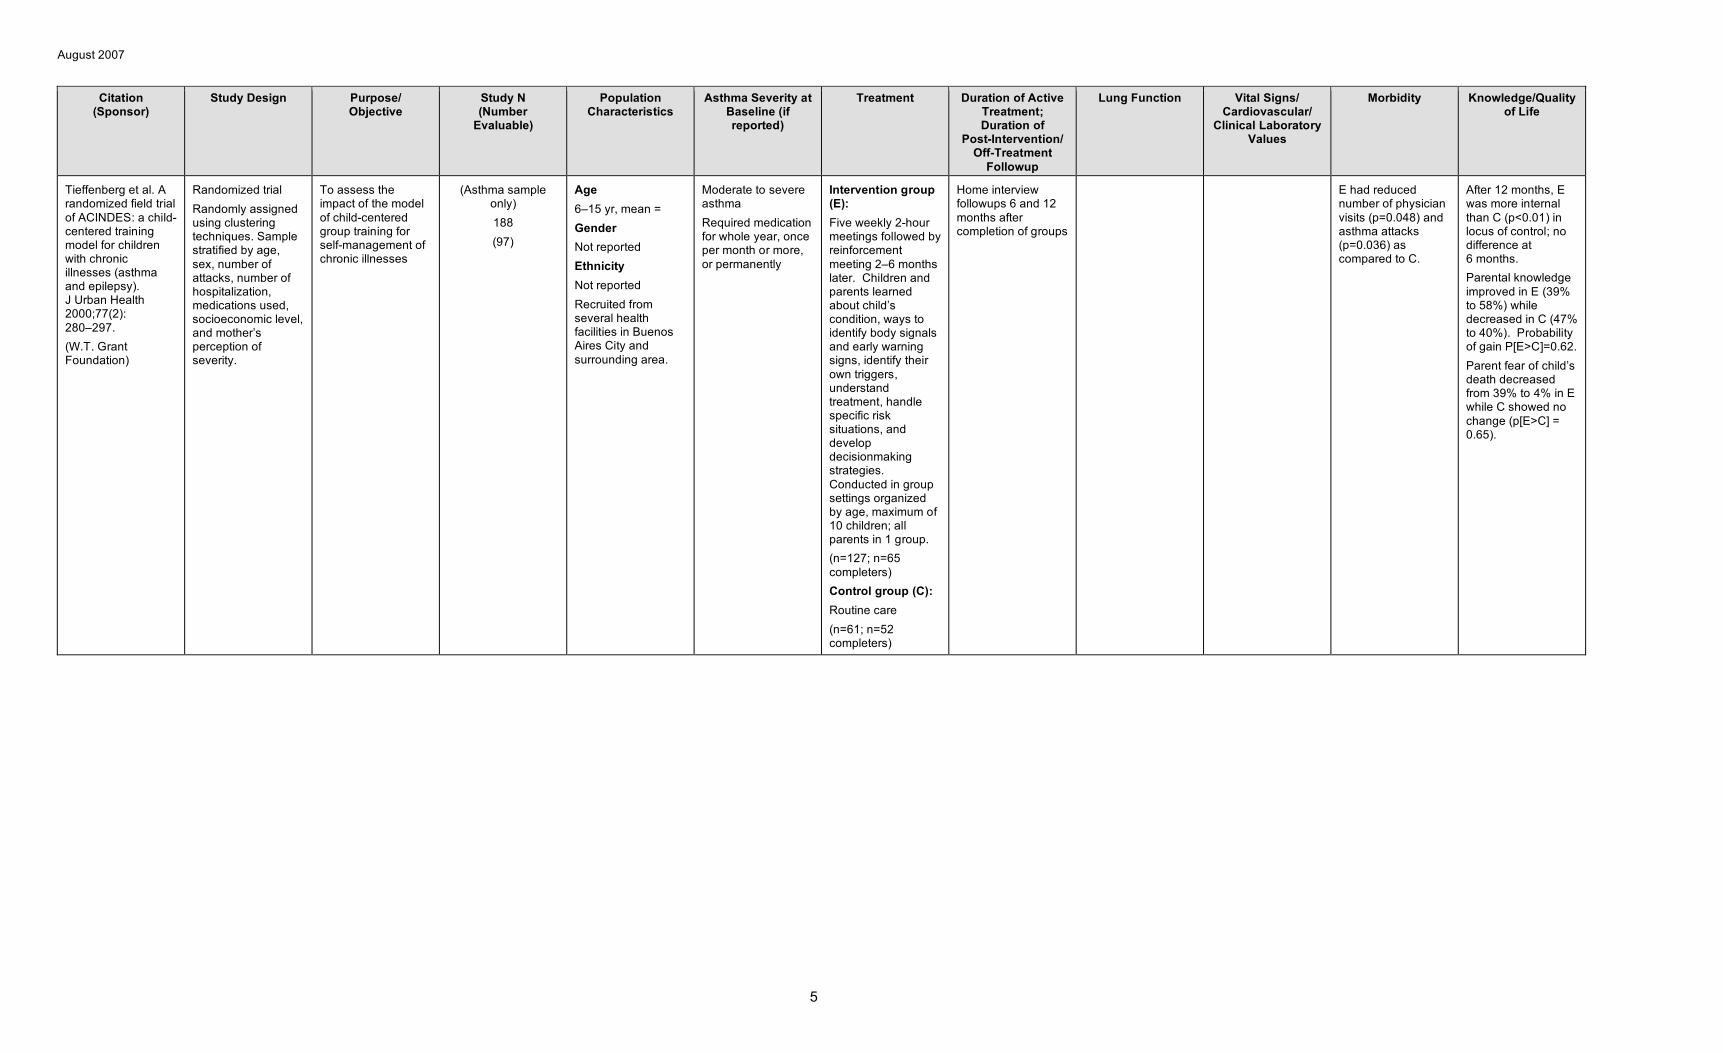
Tieffenberg et al. A randomized field trial of ACINDES: a child-centered training model for children with chronic illnesses (asthma and epilepsy). J Urban Health 2000;77(2): 280–297. (W.T. Grant Foundation)
Randomized trial Randomly assigned using clustering techniques. Sample stratified by age, sex, number of attacks, number of hospitalization, medications used, socioeconomic level, and mother’s perception of severity.
To assess the impact of the model of child-centered group training for self-management of chronic illnesses
(Asthma sample only) 188 (97)
Age 6–15 yr, mean = Gender Not reported Ethnicity Not reported Recruited from several health facilities in Buenos Aires City and surrounding area.
Moderate to severe asthma Required medication for whole year, once per month or more, or permanently
Intervention group (E): Five weekly 2-hour meetings followed by reinforcement meeting 2–6 months later. Children and parents learned about child’s condition, ways to identify body signals and early warning signs, identify their own triggers, understand treatment, handle specific risk situations, and develop decisionmaking strategies. Conducted in group settings organized by age, maximum of 10 children; all parents in 1 group. (n=127; n=65 completers) Control group (C): Routine care (n=61; n=52 completers)
Home interview followups 6 and 12 months after completion of groups
E had reduced number of physician visits (p=0.048) and asthma attacks (p=0.036) as compared to C.
After 12 months, E was more internal than C (p<0.01) in locus of control; no difference at 6 months. Parental knowledge improved in E (39% to 58%) while decreased in C (47% to 40%). Probability of gain P[E>C]=0.62. Parent fear of child’s death decreased from 39% to 4% in E while C showed no change (p[E>C] = 0.65).
5
August 2007
Citation (Sponsor)
Study Design Purpose/ Objective
Study N (Number
Evaluable)
Population Characteristics
Asthma Severity at Baseline (if reported)
Treatment Duration of Active Treatment; Duration of
Post-Intervention/ Off-Treatment
Followup
Lung Function Vital Signs/ Cardiovascular/
Clinical Laboratory Values
Morbidity Knowledge/Quality of Life
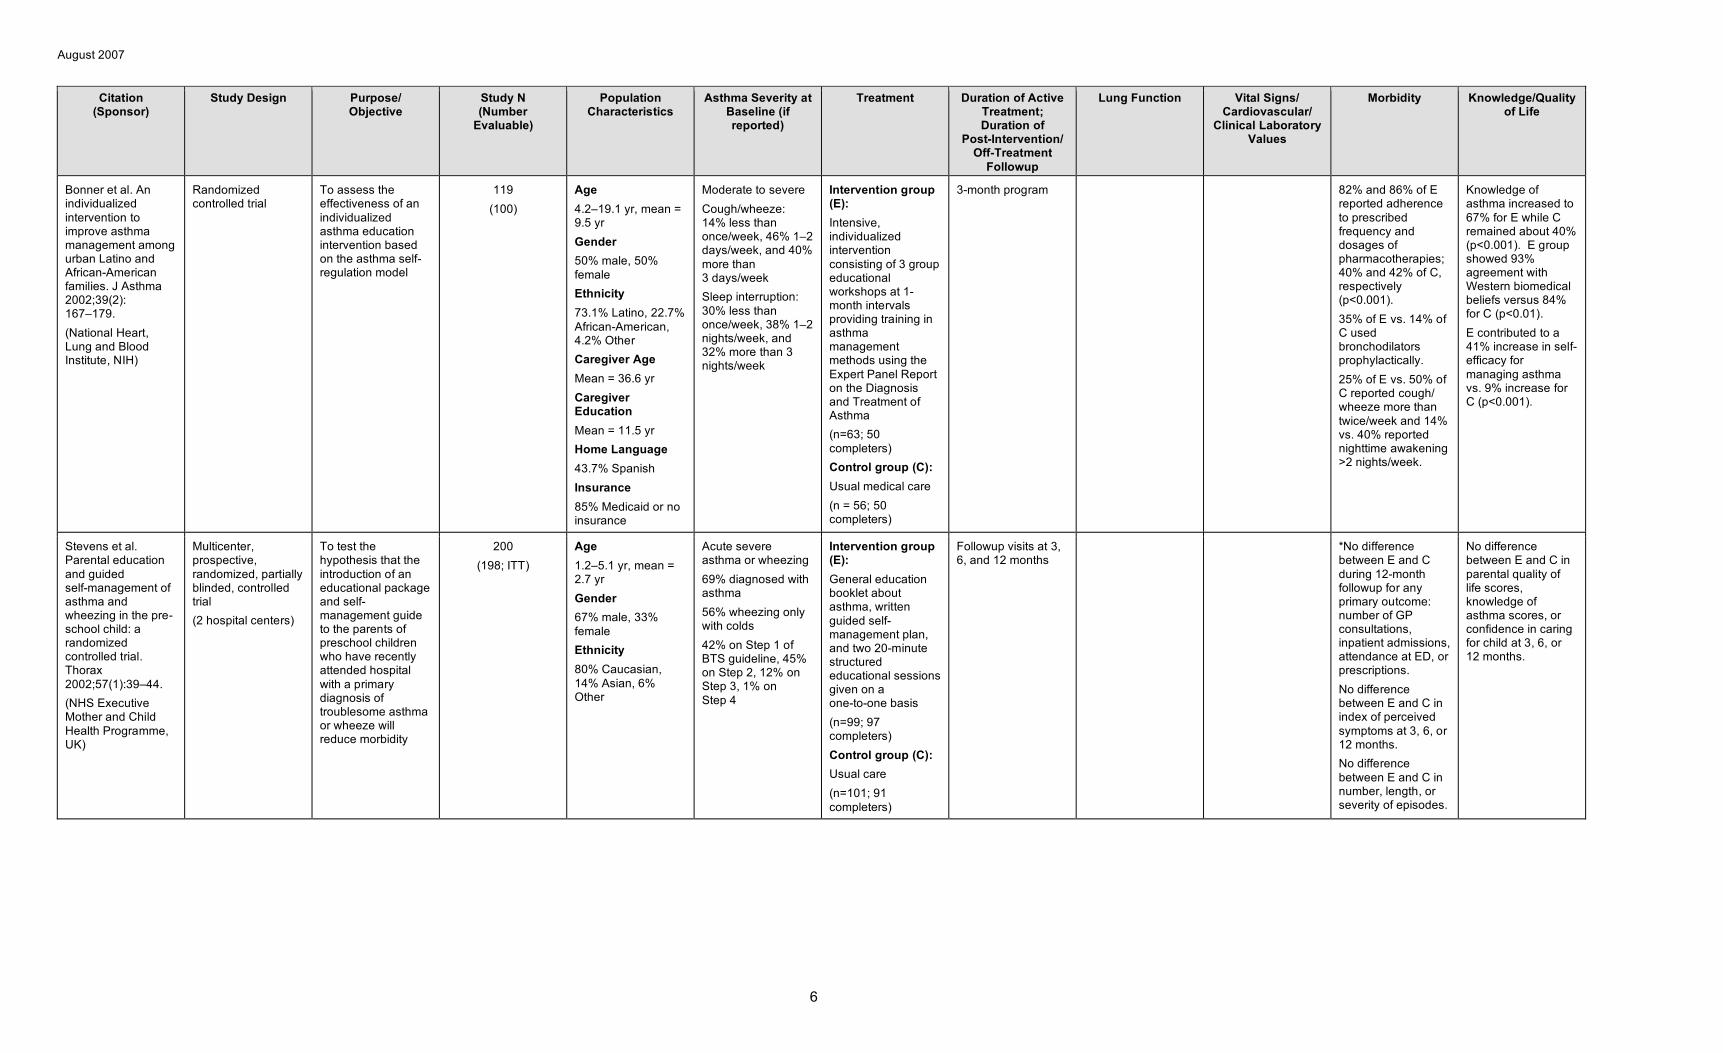
Bonner et al. An individualized intervention to improve asthma management among urban Latino and African-American families. J Asthma 2002;39(2): 167–179. (National Heart, Lung and Blood Institute, NIH)
Randomized controlled trial
To assess the effectiveness of an individualized asthma education intervention based on the asthma self-regulation model
119 (100)
Age 4.2–19.1 yr, mean = 9.5 yr Gender 50% male, 50% female Ethnicity 73.1% Latino, 22.7% African-American, 4.2% Other Caregiver Age Mean = 36.6 yr Caregiver Education Mean = 11.5 yr Home Language 43.7% Spanish Insurance 85% Medicaid or no insurance
Moderate to severe Cough/wheeze: 14% less than once/week, 46% 1–2 days/week, and 40% more than 3 days/week Sleep interruption: 30% less than once/week, 38% 1–2 nights/week, and 32% more than 3 nights/week
Intervention group (E): Intensive, individualized intervention consisting of 3 group educational workshops at 1-month intervals providing training in asthma management methods using the Expert Panel Report on the Diagnosis and Treatment of Asthma (n=63; 50 completers) Control group (C): Usual medical care (n = 56; 50 completers)
3-month program 82% and 86% of E reported adherence to prescribed frequency and dosages of pharmacotherapies; 40% and 42% of C, respectively (p<0.001). 35% of E vs. 14% of C used bronchodilators prophylactically. 25% of E vs. 50% of C reported cough/ wheeze more than twice/week and 14% vs. 40% reported nighttime awakening >2 nights/week.
Knowledge of asthma increased to 67% for E while C remained about 40% (p<0.001). E group showed 93% agreement with Western biomedical beliefs versus 84% for C (p<0.01). E contributed to a 41% increase in self-efficacy for managing asthma vs. 9% increase for C (p<0.001).
Stevens et al. Parental education and guided self-management of asthma and wheezing in the pre-school child: a randomized controlled trial. Thorax 2002;57(1):39–44. (NHS Executive Mother and Child Health Programme, UK)
Multicenter, prospective, randomized, partially blinded, controlled trial (2 hospital centers)
To test the hypothesis that the introduction of an educational package and self-management guide to the parents of preschool children who have recently attended hospital with a primary diagnosis of troublesome asthma or wheeze will reduce morbidity
200 (198; ITT)
Age 1.2–5.1 yr, mean = 2.7 yr Gender 67% male, 33% female Ethnicity 80% Caucasian, 14% Asian, 6% Other
Acute severe asthma or wheezing 69% diagnosed with asthma 56% wheezing only with colds 42% on Step 1 of BTS guideline, 45% on Step 2, 12% on Step 3, 1% on Step 4
Intervention group (E): General education booklet about asthma, written guided self-management plan, and two 20-minute structured educational sessions given on a one-to-one basis (n=99; 97 completers) Control group (C): Usual care (n=101; 91 completers)
Followup visits at 3, 6, and 12 months
*No difference between E and C during 12-month followup for any primary outcome: number of GP consultations, inpatient admissions, attendance at ED, or prescriptions. No difference between E and C in index of perceived symptoms at 3, 6, or 12 months. No difference between E and C in number, length, or severity of episodes.
No difference between E and C in parental quality of life scores, knowledge of asthma scores, or confidence in caring for child at 3, 6, or 12 months.
6
August 2007
Citation (Sponsor)
Study Design Purpose/ Objective
Study N (Number
Evaluable)
Population Characteristics
Asthma Severity at Baseline (if reported)
Treatment Duration of Active Treatment; Duration of
Post-Intervention/ Off-Treatment
Followup
Lung Function Vital Signs/ Cardiovascular/
Clinical Laboratory Values
Morbidity Knowledge/Quality of Life
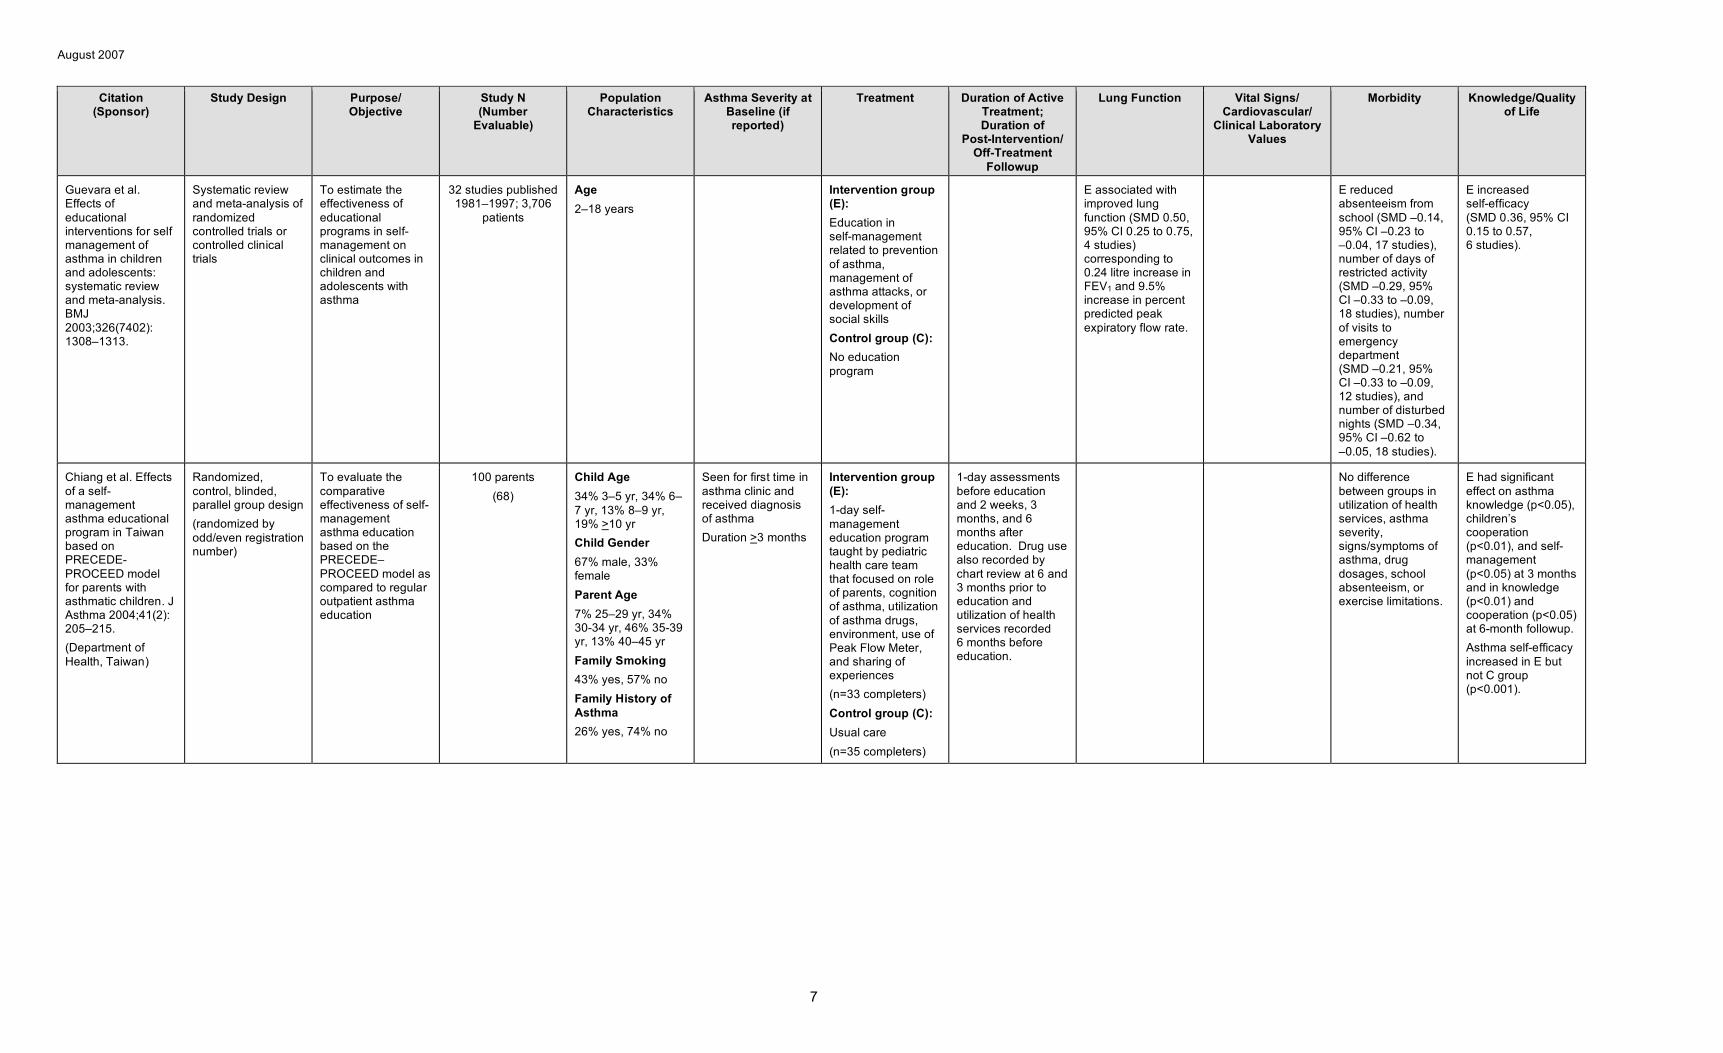
Guevara et al. Effects of educational interventions for self management of asthma in children and adolescents: systematic review and meta-analysis. BMJ 2003;326(7402): 1308–1313.
Systematic review and meta-analysis of randomized controlled trials or controlled clinical trials
To estimate the effectiveness of educational programs in self-management on clinical outcomes in children and adolescents with asthma
32 studies published 1981–1997; 3,706
patients
Age 2–18 years
Intervention group (E): Education in self-management related to prevention of asthma, management of asthma attacks, or development of social skills Control group (C): No education program
E associated with improved lung function (SMD 0.50, 95% CI 0.25 to 0.75, 4 studies) corresponding to 0.24 litre increase in FEV1 and 9.5% increase in percent predicted peak expiratory flow rate.
E reduced absenteeism from school (SMD –0.14, 95% CI –0.23 to –0.04, 17 studies), number of days of restricted activity (SMD –0.29, 95% CI –0.33 to –0.09, 18 studies), number of visits to emergency department (SMD –0.21, 95% CI –0.33 to –0.09, 12 studies), and number of disturbed nights (SMD –0.34, 95% CI –0.62 to –0.05, 18 studies).
E increased self-efficacy (SMD 0.36, 95% CI 0.15 to 0.57, 6 studies).
Chiang et al. Effects of a self-management asthma educational program in Taiwan based on PRECEDE-PROCEED model for parents with asthmatic children. J Asthma 2004;41(2): 205–215. (Department of Health, Taiwan)
Randomized, control, blinded, parallel group design (randomized by odd/even registration number)
To evaluate the comparative effectiveness of self-management asthma education based on the PRECEDE– PROCEED model as compared to regular outpatient asthma education
100 parents (68)
Child Age 34% 3–5 yr, 34% 6– 7 yr, 13% 8–9 yr, 19% >10 yr Child Gender 67% male, 33% female Parent Age 7% 25–29 yr, 34% 30-34 yr, 46% 35-39 yr, 13% 40–45 yr Family Smoking 43% yes, 57% no Family History of Asthma 26% yes, 74% no
Seen for first time in asthma clinic and received diagnosis of asthma Duration >3 months
Intervention group (E): 1-day self-management education program taught by pediatric health care team that focused on role of parents, cognition of asthma, utilization of asthma drugs, environment, use of Peak Flow Meter, and sharing of experiences (n=33 completers) Control group (C): Usual care (n=35 completers)
1-day assessments before education and 2 weeks, 3 months, and 6 months after education. Drug use also recorded by chart review at 6 and 3 months prior to education and utilization of health services recorded 6 months before education.
No difference between groups in utilization of health services, asthma severity, signs/symptoms of asthma, drug dosages, school absenteeism, or exercise limitations.
E had significant effect on asthma knowledge (p<0.05), children’s cooperation (p<0.01), and self-management (p<0.05) at 3 months and in knowledge (p<0.01) and cooperation (p<0.05) at 6-month followup. Asthma self-efficacy increased in E but not C group (p<0.001).
7
August 2007
Citation (Sponsor)
Study Design Purpose/ Objective
Study N (Number
Evaluable)
Population Characteristics
Asthma Severity at Baseline (if reported)
Treatment Duration of Active Treatment; Duration of
Post-Intervention/ Off-Treatment
Followup
Lung Function Vital Signs/ Cardiovascular/
Clinical Laboratory Values
Morbidity Knowledge/Quality of Life
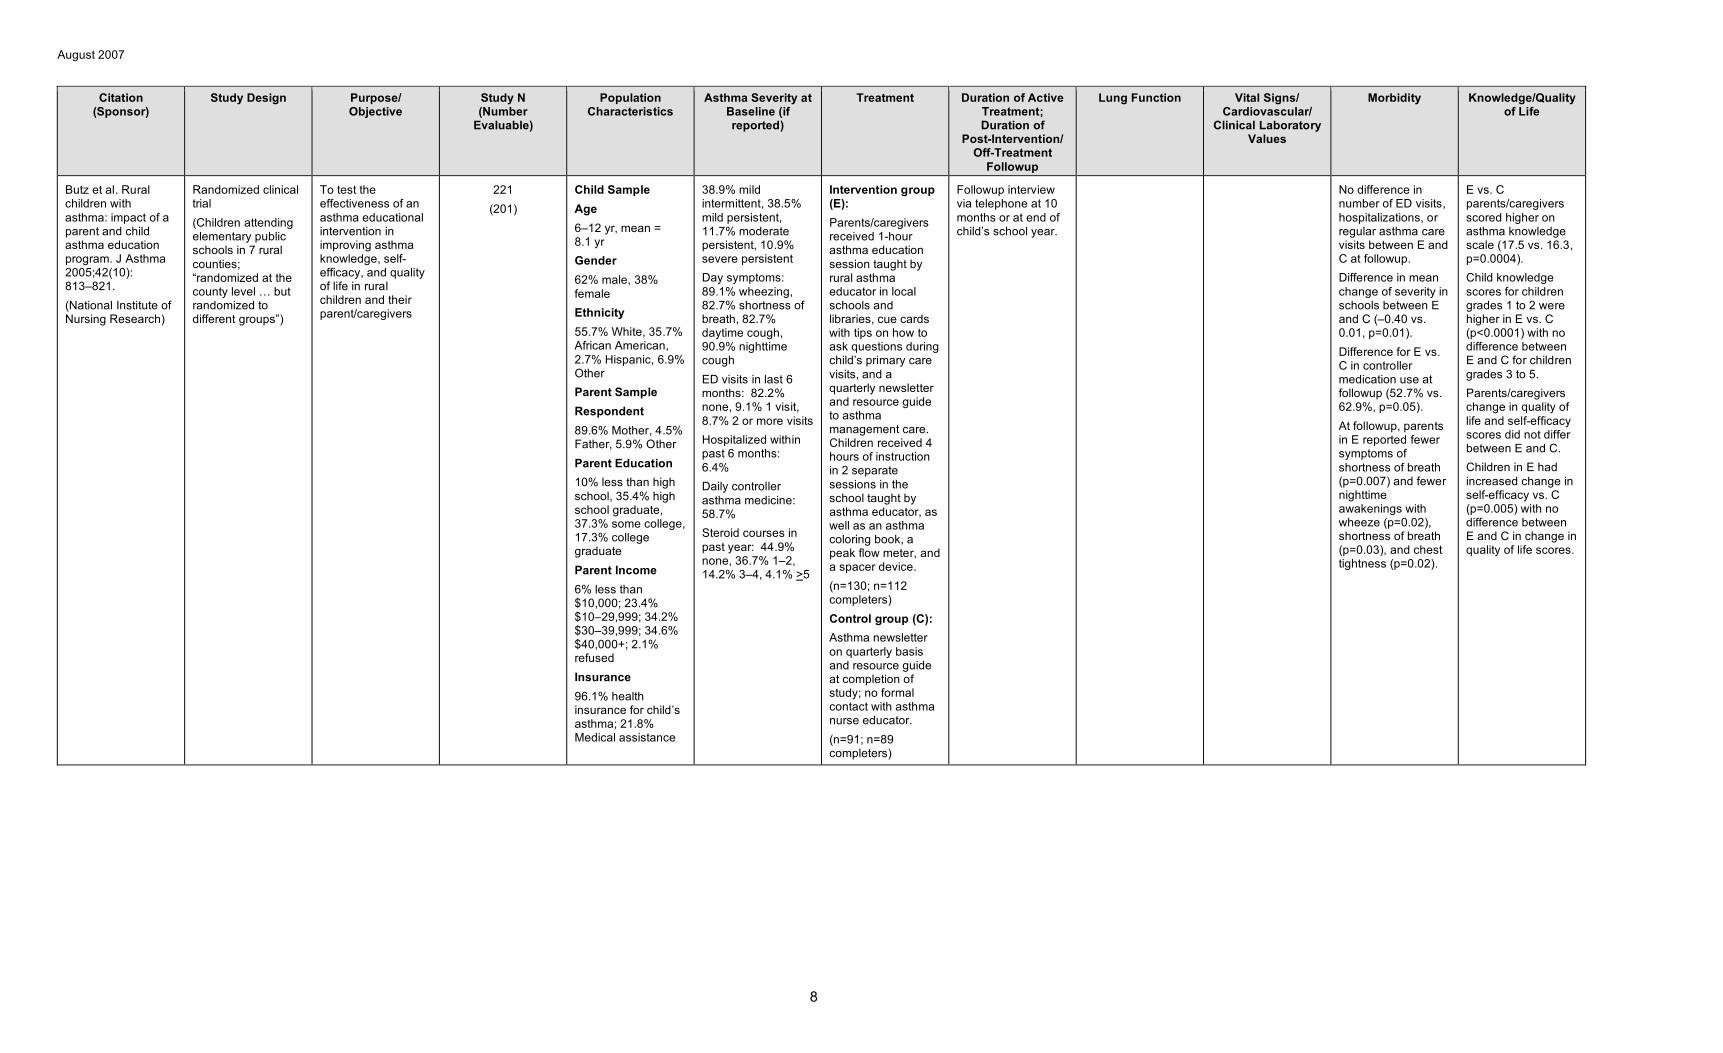
Butz et al. Rural children with asthma: impact of a parent and child asthma education program. J Asthma 2005;42(10): 813–821. (National Institute of Nursing Research)
Randomized clinical trial (Children attending elementary public schools in 7 rural counties; “randomized at the county level … but randomized to different groups”)
To test the effectiveness of an asthma educational intervention in improving asthma knowledge, self-efficacy, and quality of life in rural children and their parent/caregivers
221 (201)
Child Sample Age 6–12 yr, mean = 8.1 yr Gender 62% male, 38% female Ethnicity 55.7% White, 35.7% African American, 2.7% Hispanic, 6.9% Other Parent Sample Respondent 89.6% Mother, 4.5% Father, 5.9% Other Parent Education 10% less than high school, 35.4% high school graduate, 37.3% some college, 17.3% college graduate Parent Income 6% less than $10,000; 23.4% $10–29,999; 34.2% $30–39,999; 34.6% $40,000+; 2.1% refused Insurance 96.1% health insurance for child’s asthma; 21.8% Medical assistance
38.9% mild intermittent, 38.5% mild persistent, 11.7% moderate persistent, 10.9% severe persistent Day symptoms: 89.1% wheezing, 82.7% shortness of breath, 82.7% daytime cough, 90.9% nighttime cough ED visits in last 6 months: 82.2% none, 9.1% 1 visit, 8.7% 2 or more visits Hospitalized within past 6 months: 6.4% Daily controller asthma medicine: 58.7% Steroid courses in past year: 44.9% none, 36.7% 1–2, 14.2% 3–4, 4.1% >5
Intervention group (E): Parents/caregivers received 1-hour asthma education session taught by rural asthma educator in local schools and libraries, cue cards with tips on how to ask questions during child’s primary care visits, and a quarterly newsletter and resource guide to asthma management care. Children received 4 hours of instruction in 2 separate sessions in the school taught by asthma educator, as well as an asthma coloring book, a peak flow meter, and a spacer device. (n=130; n=112 completers) Control group (C): Asthma newsletter on quarterly basis and resource guide at completion of study; no formal contact with asthma nurse educator. (n=91; n=89 completers)
Followup interview via telephone at 10 months or at end of child’s school year.
No difference in number of ED visits, hospitalizations, or regular asthma care visits between E and C at followup. Difference in mean change of severity in schools between E and C (–0.40 vs. 0.01, p=0.01). Difference for E vs. C in controller medication use at followup (52.7% vs. 62.9%, p=0.05). At followup, parents in E reported fewer symptoms of shortness of breath (p=0.007) and fewer nighttime awakenings with wheeze (p=0.02), shortness of breath (p=0.03), and chest tightness (p=0.02).
E vs. C parents/caregivers scored higher on asthma knowledge scale (17.5 vs. 16.3, p=0.0004). Child knowledge scores for children grades 1 to 2 were higher in E vs. C (p<0.0001) with no difference between E and C for children grades 3 to 5. Parents/caregivers change in quality of life and self-efficacy scores did not differ between E and C. Children in E had increased change in self-efficacy vs. C (p=0.005) with no difference between E and C in change in quality of life scores.
8
August 2007
Citation (Sponsor)
Study Design Purpose/ Objective
Study N (Number
Evaluable)
Population Characteristics
Asthma Severity at Baseline (if reported)
Treatment Duration of Active Treatment; Duration of
Post-Intervention/ Off-Treatment
Followup
Lung Function Vital Signs/ Cardiovascular/
Clinical Laboratory Values
Morbidity Knowledge/Quality of Life
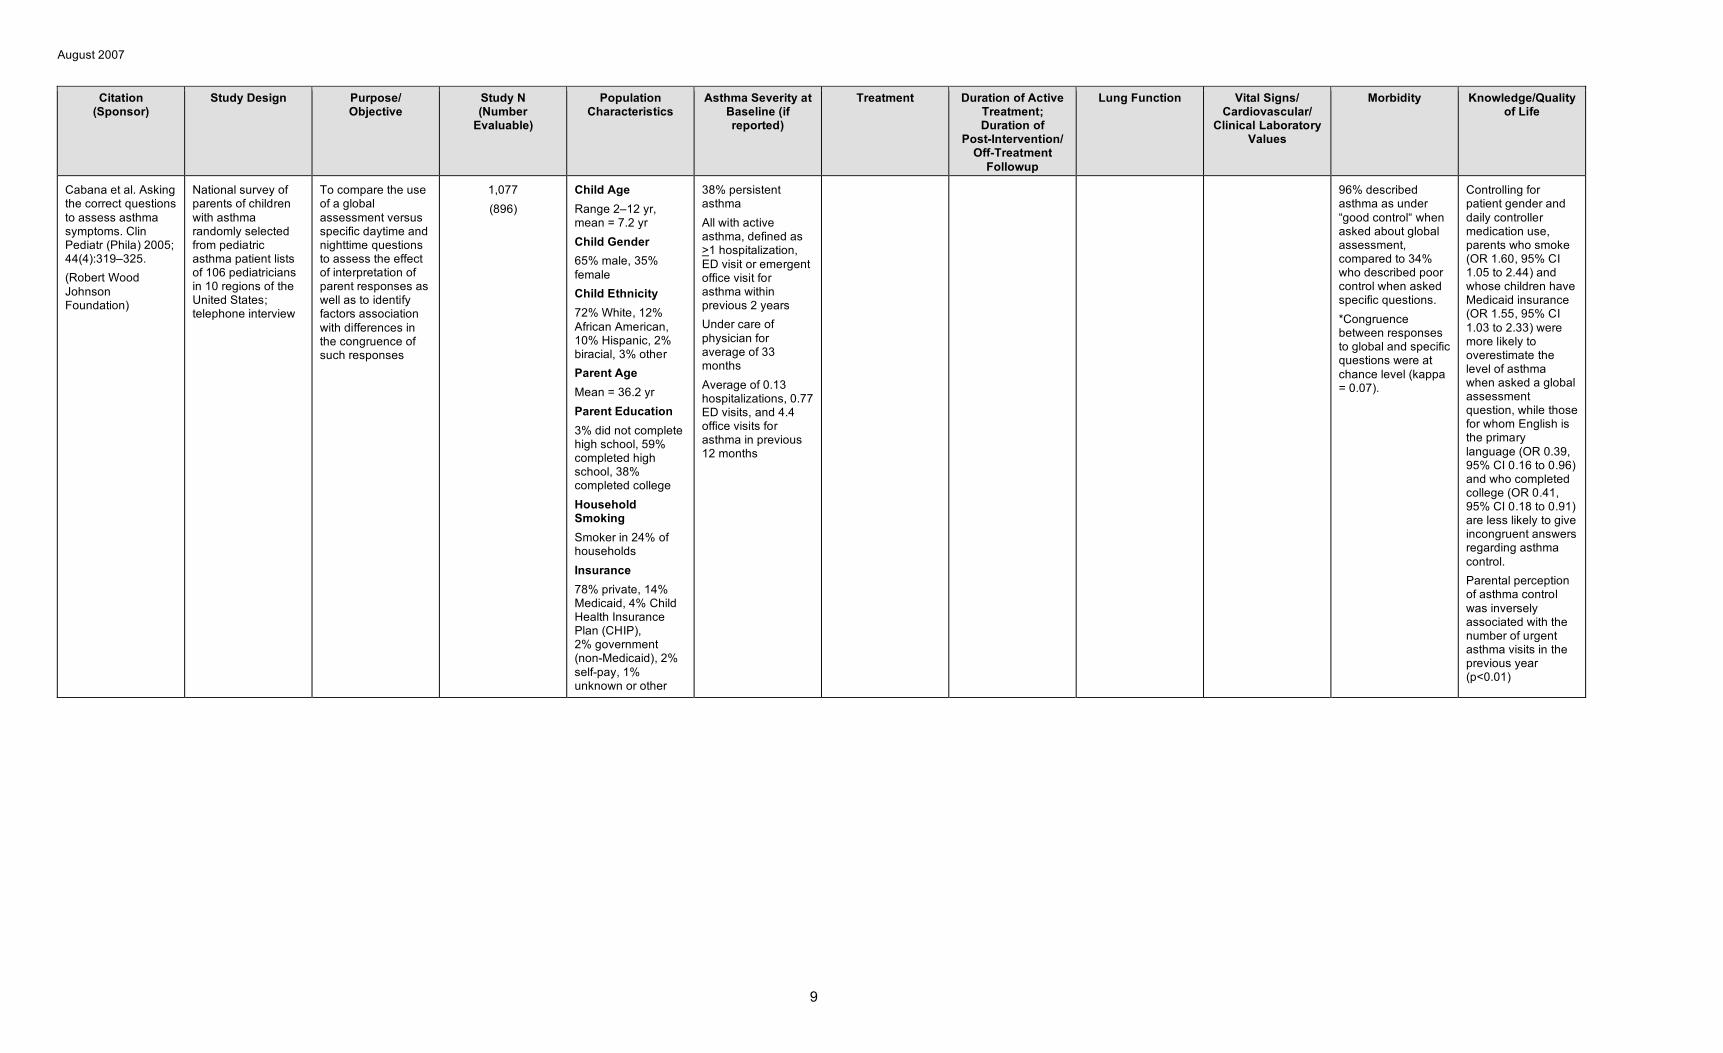
Cabana et al. Asking the correct questions to assess asthma symptoms. Clin Pediatr (Phila) 2005; 44(4):319–325. (Robert Wood Johnson Foundation)
National survey of parents of children with asthma randomly selected from pediatric asthma patient lists of 106 pediatricians in 10 regions of the United States; telephone interview
To compare the use of a global assessment versus specific daytime and nighttime questions to assess the effect of interpretation of parent responses as well as to identify factors association with differences in the congruence of such responses
1,077 (896)
Child Age Range 2–12 yr, mean = 7.2 yr Child Gender 65% male, 35% female Child Ethnicity 72% White, 12% African American, 10% Hispanic, 2% biracial, 3% other Parent Age Mean = 36.2 yr Parent Education 3% did not complete high school, 59% completed high school, 38% completed college Household Smoking Smoker in 24% of households Insurance 78% private, 14% Medicaid, 4% Child Health Insurance Plan (CHIP), 2% government (non-Medicaid), 2% self-pay, 1% unknown or other
38% persistent asthma All with active asthma, defined as >1 hospitalization, ED visit or emergent office visit for asthma within previous 2 years Under care of physician for average of 33 months Average of 0.13 hospitalizations, 0.77 ED visits, and 4.4 office visits for asthma in previous 12 months
96% described asthma as under “good control“ when asked about global assessment, compared to 34% who described poor control when asked specific questions. *Congruence between responses to global and specific questions were at chance level (kappa = 0.07).
Controlling for patient gender and daily controller medication use, parents who smoke (OR 1.60, 95% CI 1.05 to 2.44) and whose children have Medicaid insurance (OR 1.55, 95% CI 1.03 to 2.33) were more likely to overestimate the level of asthma when asked a global assessment question, while those for whom English is the primary language (OR 0.39, 95% CI 0.16 to 0.96) and who completed college (OR 0.41, 95% CI 0.18 to 0.91) are less likely to give incongruent answers regarding asthma control. Parental perception of asthma control was inversely associated with the number of urgent asthma visits in the previous year (p<0.01)
9
August 2007
Citation (Sponsor)
Study Design Purpose/ Objective
Study N (Number
Evaluable)
Population Characteristics
Asthma Severity at Baseline (if reported)
Treatment Duration of Active Treatment; Duration of
Post-Intervention/ Off-Treatment
Followup
Lung Function Vital Signs/ Cardiovascular/
Clinical Laboratory Values
Morbidity Knowledge/Quality of Life
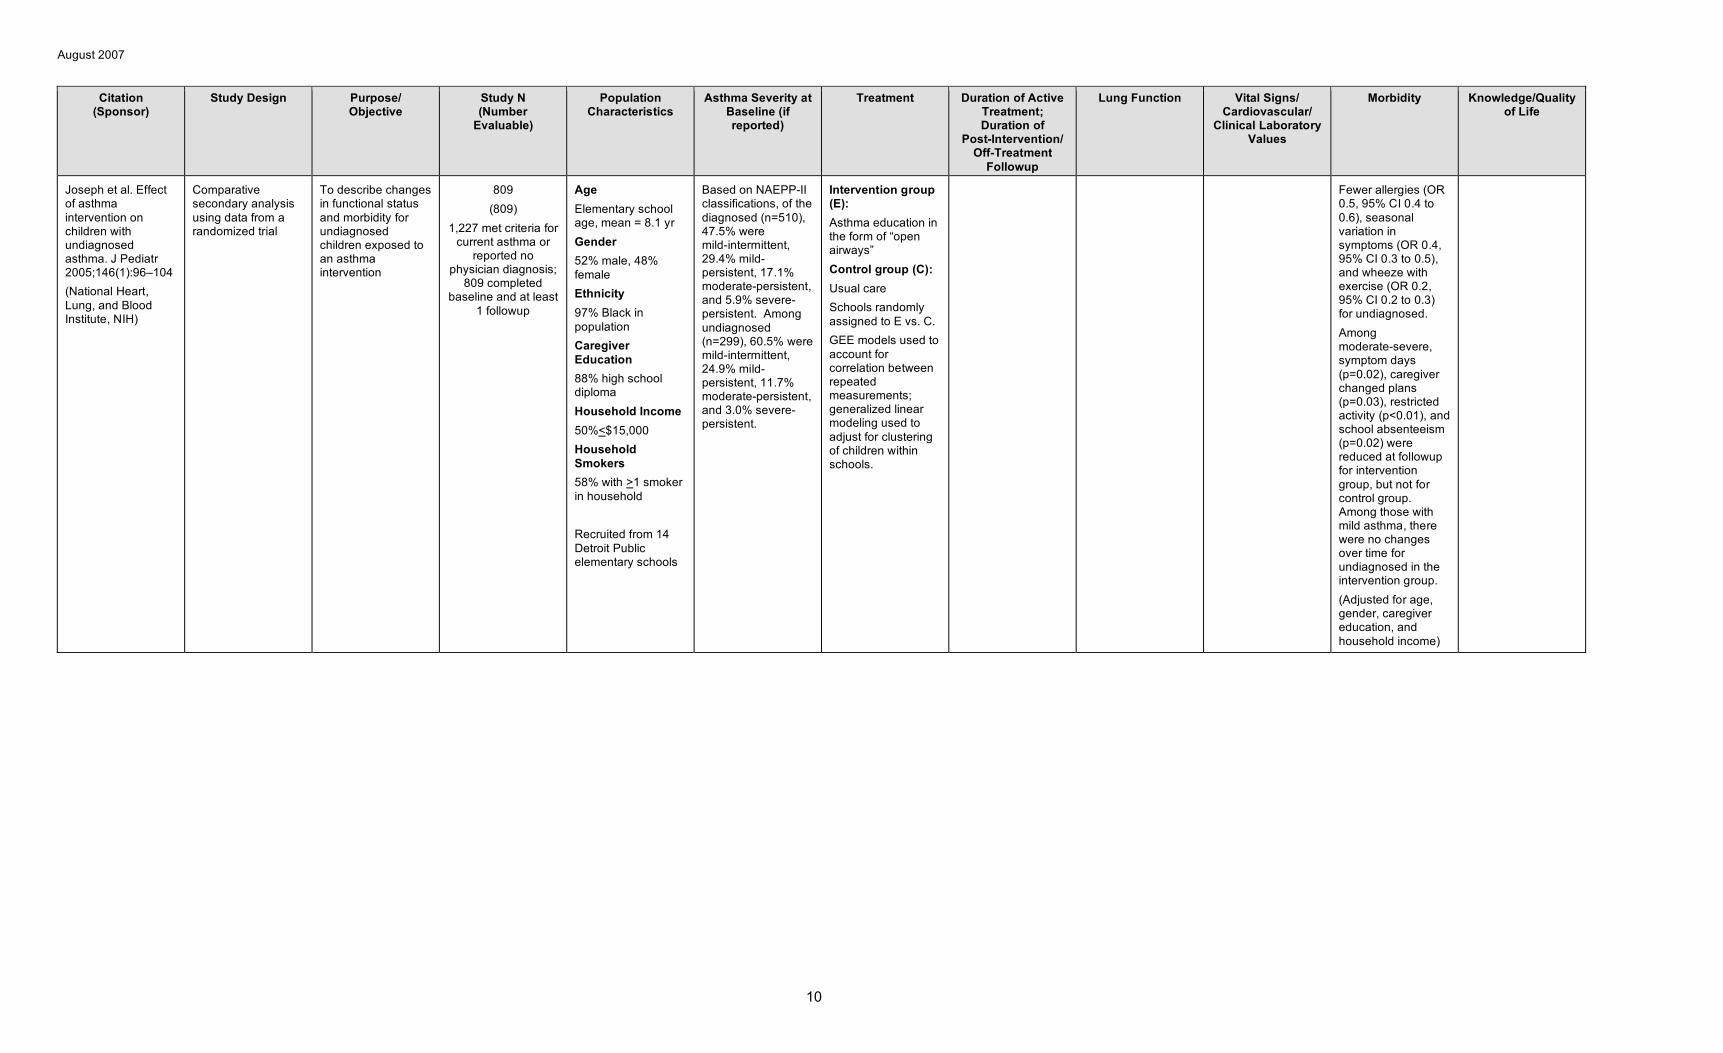
Joseph et al. Effect of asthma intervention on children with undiagnosed asthma. J Pediatr 2005;146(1):96–104 (National Heart, Lung, and Blood Institute, NIH)
Comparative secondary analysis using data from a randomized trial
To describe changes in functional status and morbidity for undiagnosed children exposed to an asthma intervention
809 (809)
1,227 met criteria for current asthma or
reported no physician diagnosis;
809 completed baseline and at least
1 followup
Age Elementary school age, mean = 8.1 yr Gender 52% male, 48% female Ethnicity 97% Black in population Caregiver Education 88% high school diploma Household Income 50%<$15,000 Household Smokers 58% with >1 smoker in household
Recruited from 14 Detroit Public elementary schools
Based on NAEPP-II classifications, of the diagnosed (n=510), 47.5% were mild-intermittent, 29.4% mild-persistent, 17.1% moderate-persistent, and 5.9% severe-persistent. Among undiagnosed (n=299), 60.5% were mild-intermittent, 24.9% mild-persistent, 11.7% moderate-persistent, and 3.0% severe-persistent.
Intervention group (E): Asthma education in the form of “open airways” Control group (C): Usual care Schools randomly assigned to E vs. C. GEE models used to account for correlation between repeated measurements; generalized linear modeling used to adjust for clustering of children within schools.
Fewer allergies (OR 0.5, 95% CI 0.4 to 0.6), seasonal variation in symptoms (OR 0.4, 95% CI 0.3 to 0.5), and wheeze with exercise (OR 0.2, 95% CI 0.2 to 0.3) for undiagnosed. Among moderate-severe, symptom days (p=0.02), caregiver changed plans (p=0.03), restricted activity (p<0.01), and school absenteeism (p=0.02) were reduced at followup for intervention group, but not for control group. Among those with mild asthma, there were no changes over time for undiagnosed in the intervention group. (Adjusted for age, gender, caregiver education, and household income)
10

August 2007
Citation (Sponsor)
Study Design Purpose/ Objective
Study N (Number
Evaluable)
Population Characteristics
Asthma Severity at Baseline (if reported)
Treatment Duration of Active Treatment; Duration of
Post-Intervention/ Off-Treatment
Followup
Lung Function Vital Signs/ Cardiovascular/
Clinical Laboratory Values
Morbidity Knowledge/Quality of Life
Walders et al. An interdisciplinary intervention for undertreated pediatric asthma. Chest 2006; 129(2):292–299. (American Lung Association; National Institute of Mental Health; The Cleveland Foundation; American Psychological Association; Association for the Advancement of Behavior Therapy)
Randomized, controlled study (permuted block randomization scheme with random block sizes stratified by age of child: 4–9 vs. 10–12 yr)
To examine whether an interdisciplinary intervention that combined medical, educational, and psychosocial techniques would improve asthma management
175 (175 ITT)
Age 4–12 yr, mean = 7.3 yr Gender 72% male, 28% female Ethnicity 85% African American, 14% White, 1% Other
15.4% mild intermittent, 40.0% mild persistent, 32.6% moderate persistent, 12.0% severe persistent Duration >3 months Asthma hospitalization in past year: 20.7% none, 74.7% 1-2 times, 4.6% >3 times Asthma ED visits in past year: 4.7% none, 57.6% 1–2 times, 32.6% 3–6 times, 5.2% >6 times
Intervention group (E): Additional 1-hour session of asthma education with nurse or asthma social worker, cognitive-behavioral problem-solving session based on their asthma risk profile results, access to a 24-hour nurse advice line (n=86) Comparison group (C): Standard care (n=89)
Symptoms and health care monitored at 2-month intervals; quality of life monitored at 6 and 12 months. All participants received written asthma treatment plan based on asthma severity using NIH guidelines, a valued holding chamber for use with a metered-dose inhaler, a peak flowmeter, and a prescription for a 1-month supply of medication to be refilled by primary care provider.
*No difference between E and C in number of symptom days and symptom scores at 6 and 12 months as well as averaged across 2 to 6 months and over 2 to 12 months. *Across all visits, symptom days decreased by an average of 1.84 days/4-week period (p=0.006) in C and by average of 1.99 days/4-week period (p=0.003) in E (p=0.87 for E vs. C). Symptom scores decreased by average of 0.66 (p<0.0001) in C and by 0.71 (p<0.0001) in E (p=0.71 for E vs. C). No difference for C vs. E in ED visits and/or admissions for asthma (27% vs. 23%, OR=–1.34, 95% CI 0.66 to 2.70, p=0.42). Over 12-month period, 41% of C vs. 28% of E had ED visit and/or hospital admission for asthma (OR 1.92, 95% CI 1.00 to 3.69, p=0.05). Only 26% of E used nurse advice line.
No difference in change in scores for asthma-related quality of life at 6 and 12 months. Both groups showed improvement (p<0.05) in 2 scales at 6 months and all 4 scales at 12 months.
Our interdisciplinary intervention did not decrease asthma symptoms or improve quality of life but was successful in decreasing health care utilization.
11
August 2007
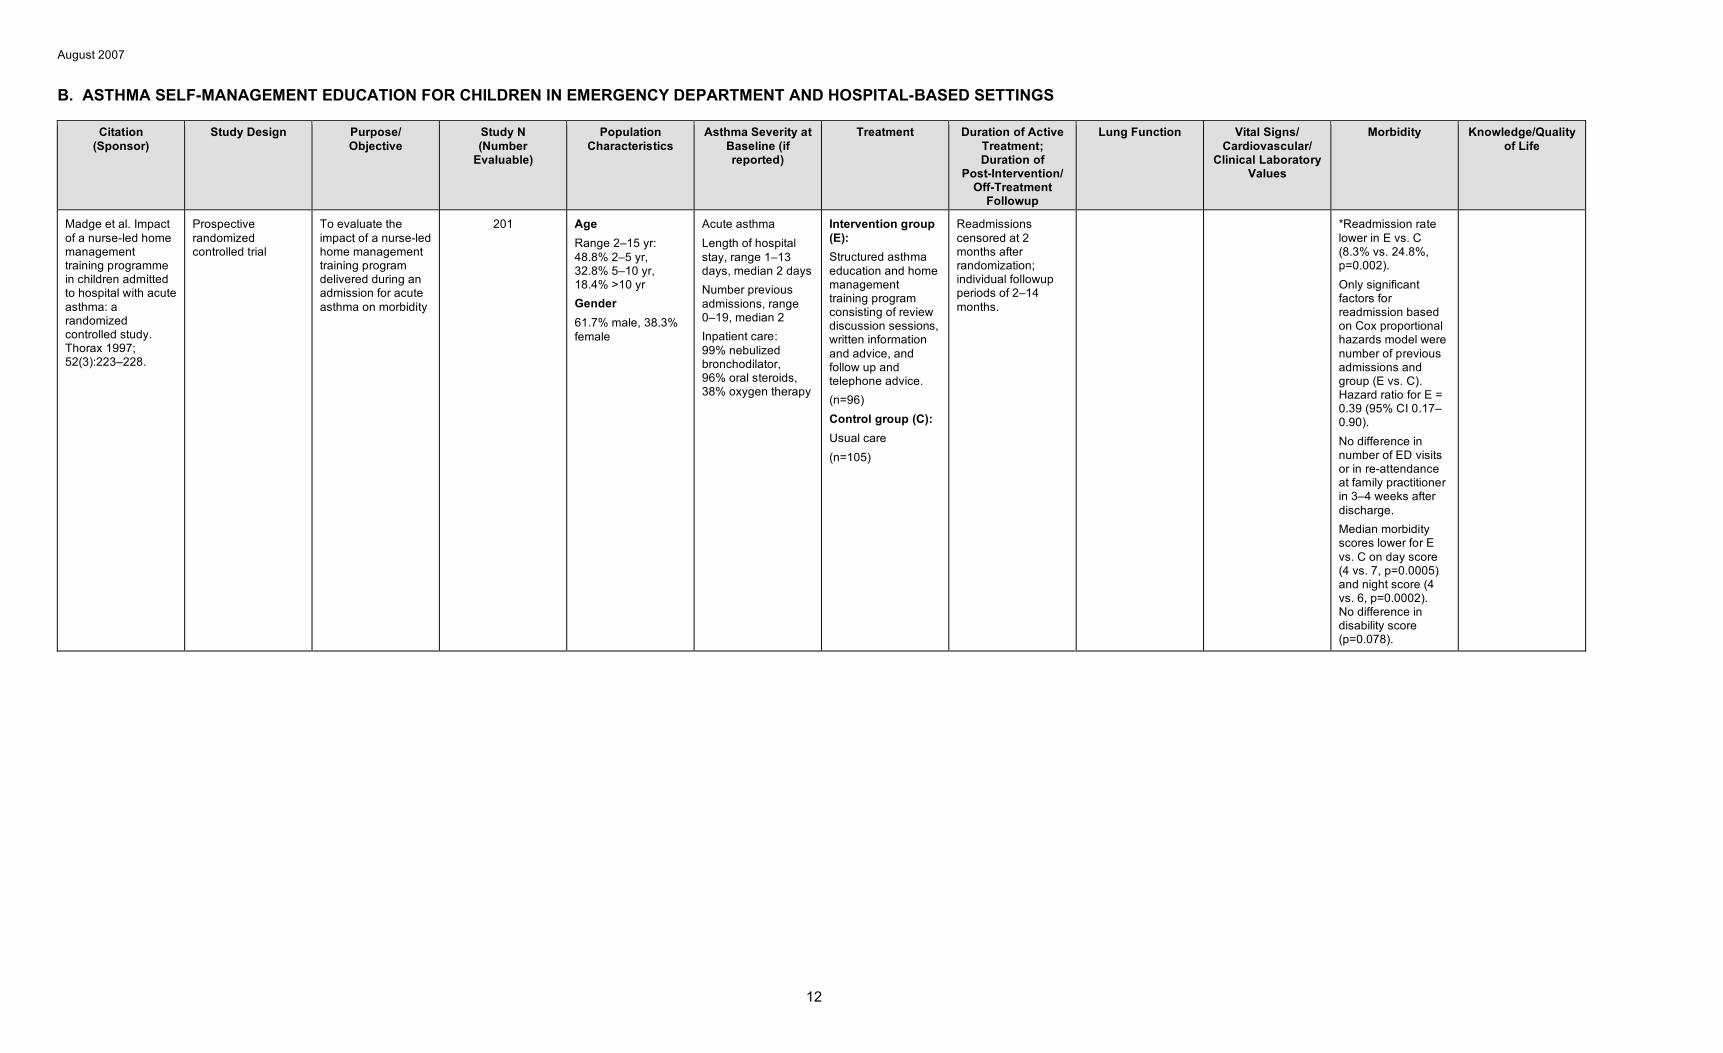
B. ASTHMA SELF-MANAGEMENT EDUCATION FOR CHILDREN IN EMERGENCY DEPARTMENT AND HOSPITAL-BASED SETTINGS
Citation (Sponsor)
Study Design Purpose/ Objective
Study N (Number
Evaluable)
Population Characteristics
Asthma Severity at Baseline (if reported)
Treatment Duration of Active Treatment; Duration of
Post-Intervention/ Off-Treatment
Followup
Lung Function Vital Signs/ Cardiovascular/
Clinical Laboratory Values
Morbidity Knowledge/Quality of Life
Madge et al. Impact of a nurse-led home management training programme in children admitted to hospital with acute asthma: a randomized controlled study. Thorax 1997; 52(3):223–228.
Prospective randomized controlled trial
To evaluate the impact of a nurse-led home management training program delivered during an admission for acute asthma on morbidity
201 Age Range 2–15 yr: 48.8% 2–5 yr, 32.8% 5–10 yr, 18.4% >10 yr Gender 61.7% male, 38.3% female
Acute asthma Length of hospital stay, range 1–13 days, median 2 days Number previous admissions, range 0–19, median 2 Inpatient care: 99% nebulized bronchodilator, 96% oral steroids, 38% oxygen therapy
Intervention group (E): Structured asthma education and home management training program consisting of review discussion sessions, written information and advice, and follow up and telephone advice. (n=96) Control group (C): Usual care (n=105)
Readmissions censored at 2 months after randomization; individual followup periods of 2–14 months.
*Readmission rate lower in E vs. C (8.3% vs. 24.8%, p=0.002). Only significant factors for readmission based on Cox proportional hazards model were number of previous admissions and group (E vs. C). Hazard ratio for E = 0.39 (95% CI 0.17– 0.90). No difference in number of ED visits or in re-attendance at family practitioner in 3–4 weeks after discharge. Median morbidity scores lower for E vs. C on day score (4 vs. 7, p=0.0005) and night score (4 vs. 6, p=0.0002). No difference in disability score (p=0.078).
12
August 2007
Citation (Sponsor)
Study Design Purpose/ Objective
Study N (Number
Evaluable)
Population Characteristics
Asthma Severity at Baseline (if reported)
Treatment Duration of Active Treatment; Duration of
Post-Intervention/ Off-Treatment
Followup
Lung Function Vital Signs/ Cardiovascular/
Clinical Laboratory Values
Morbidity Knowledge/Quality of Life
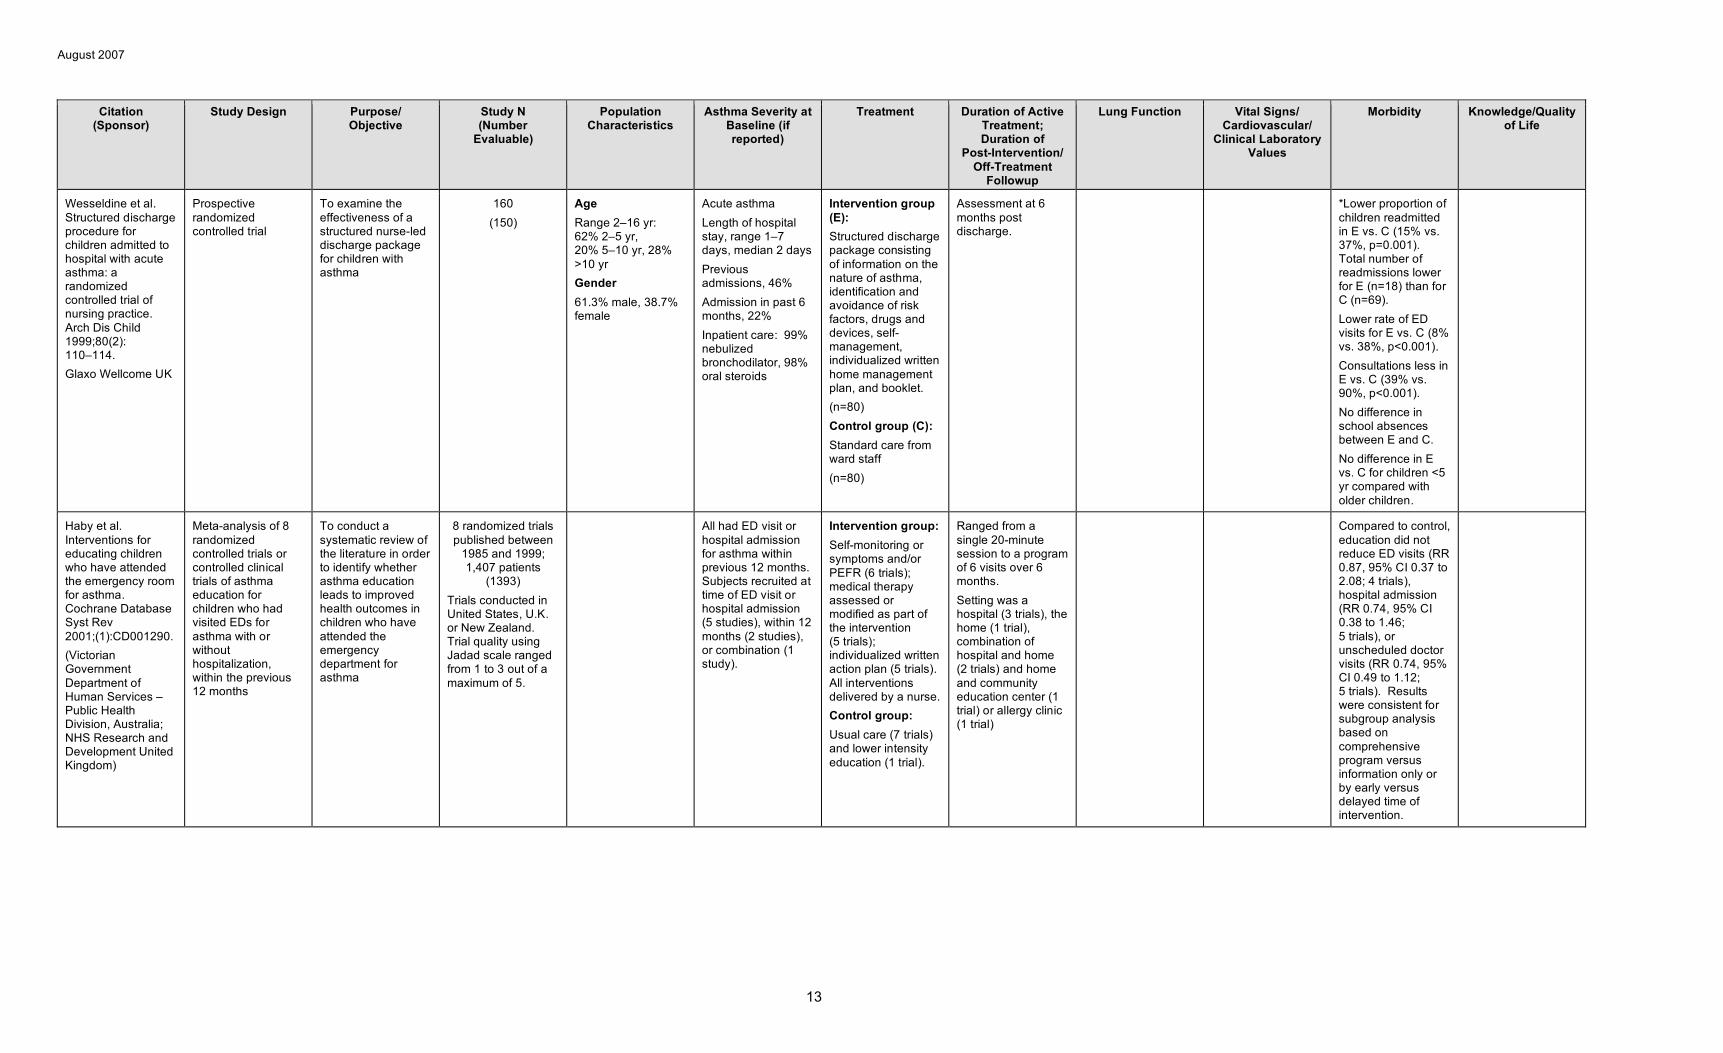
Wesseldine et al. Structured discharge procedure for children admitted to hospital with acute asthma: a randomized controlled trial of nursing practice. Arch Dis Child 1999;80(2): 110–114. Glaxo Wellcome UK
Prospective randomized controlled trial
To examine the effectiveness of a structured nurse-led discharge package for children with asthma
160 (150)
Age Range 2–16 yr: 62% 2–5 yr, 20% 5–10 yr, 28% >10 yr Gender 61.3% male, 38.7% female
Acute asthma Length of hospital stay, range 1–7 days, median 2 days Previous admissions, 46% Admission in past 6 months, 22% Inpatient care: 99% nebulized bronchodilator, 98% oral steroids
Intervention group (E): Structured discharge package consisting of information on the nature of asthma, identification and avoidance of risk factors, drugs and devices, self-management, individualized written home management plan, and booklet. (n=80) Control group (C): Standard care from ward staff (n=80)
Assessment at 6 months post discharge.
*Lower proportion of children readmitted in E vs. C (15% vs. 37%, p=0.001). Total number of readmissions lower for E (n=18) than for C (n=69). Lower rate of ED visits for E vs. C (8% vs. 38%, p<0.001). Consultations less in E vs. C (39% vs. 90%, p<0.001). No difference in school absences between E and C. No difference in E vs. C for children <5 yr compared with older children.
Haby et al. Interventions for educating children who have attended the emergency room for asthma. Cochrane Database Syst Rev 2001;(1):CD001290. (Victorian Government Department of Human Services – Public Health Division, Australia; NHS Research and Development United Kingdom)
Meta-analysis of 8 randomized controlled trials or controlled clinical trials of asthma education for children who had visited EDs for asthma with or without hospitalization, within the previous 12 months
To conduct a systematic review of the literature in order to identify whether asthma education leads to improved health outcomes in children who have attended the emergency department for asthma
8 randomized trials published between
1985 and 1999; 1,407 patients
(1393) Trials conducted in United States, U.K. or New Zealand. Trial quality using Jadad scale ranged from 1 to 3 out of a maximum of 5.
All had ED visit or hospital admission for asthma within previous 12 months. Subjects recruited at time of ED visit or hospital admission (5 studies), within 12 months (2 studies), or combination (1 study).
Intervention group: Self-monitoring or symptoms and/or PEFR (6 trials); medical therapy assessed or modified as part of the intervention (5 trials); individualized written action plan (5 trials). All interventions delivered by a nurse. Control group: Usual care (7 trials) and lower intensity education (1 trial).
Ranged from a single 20-minute session to a program of 6 visits over 6 months. Setting was a hospital (3 trials), the home (1 trial), combination of hospital and home (2 trials) and home and community education center (1 trial) or allergy clinic (1 trial)
Compared to control, education did not reduce ED visits (RR 0.87, 95% CI 0.37 to 2.08; 4 trials), hospital admission (RR 0.74, 95% CI 0.38 to 1.46; 5 trials), or unscheduled doctor visits (RR 0.74, 95% CI 0.49 to 1.12; 5 trials). Results were consistent for subgroup analysis based on comprehensive program versus information only or by early versus delayed time of intervention.
13
August 2007
Citation (Sponsor)
Study Design Purpose/ Objective
Study N (Number
Evaluable)
Population Characteristics
Asthma Severity at Baseline (if reported)
Treatment Duration of Active Treatment; Duration of
Post-Intervention/ Off-Treatment
Followup
Lung Function Vital Signs/ Cardiovascular/
Clinical Laboratory Values
Morbidity Knowledge/Quality of Life
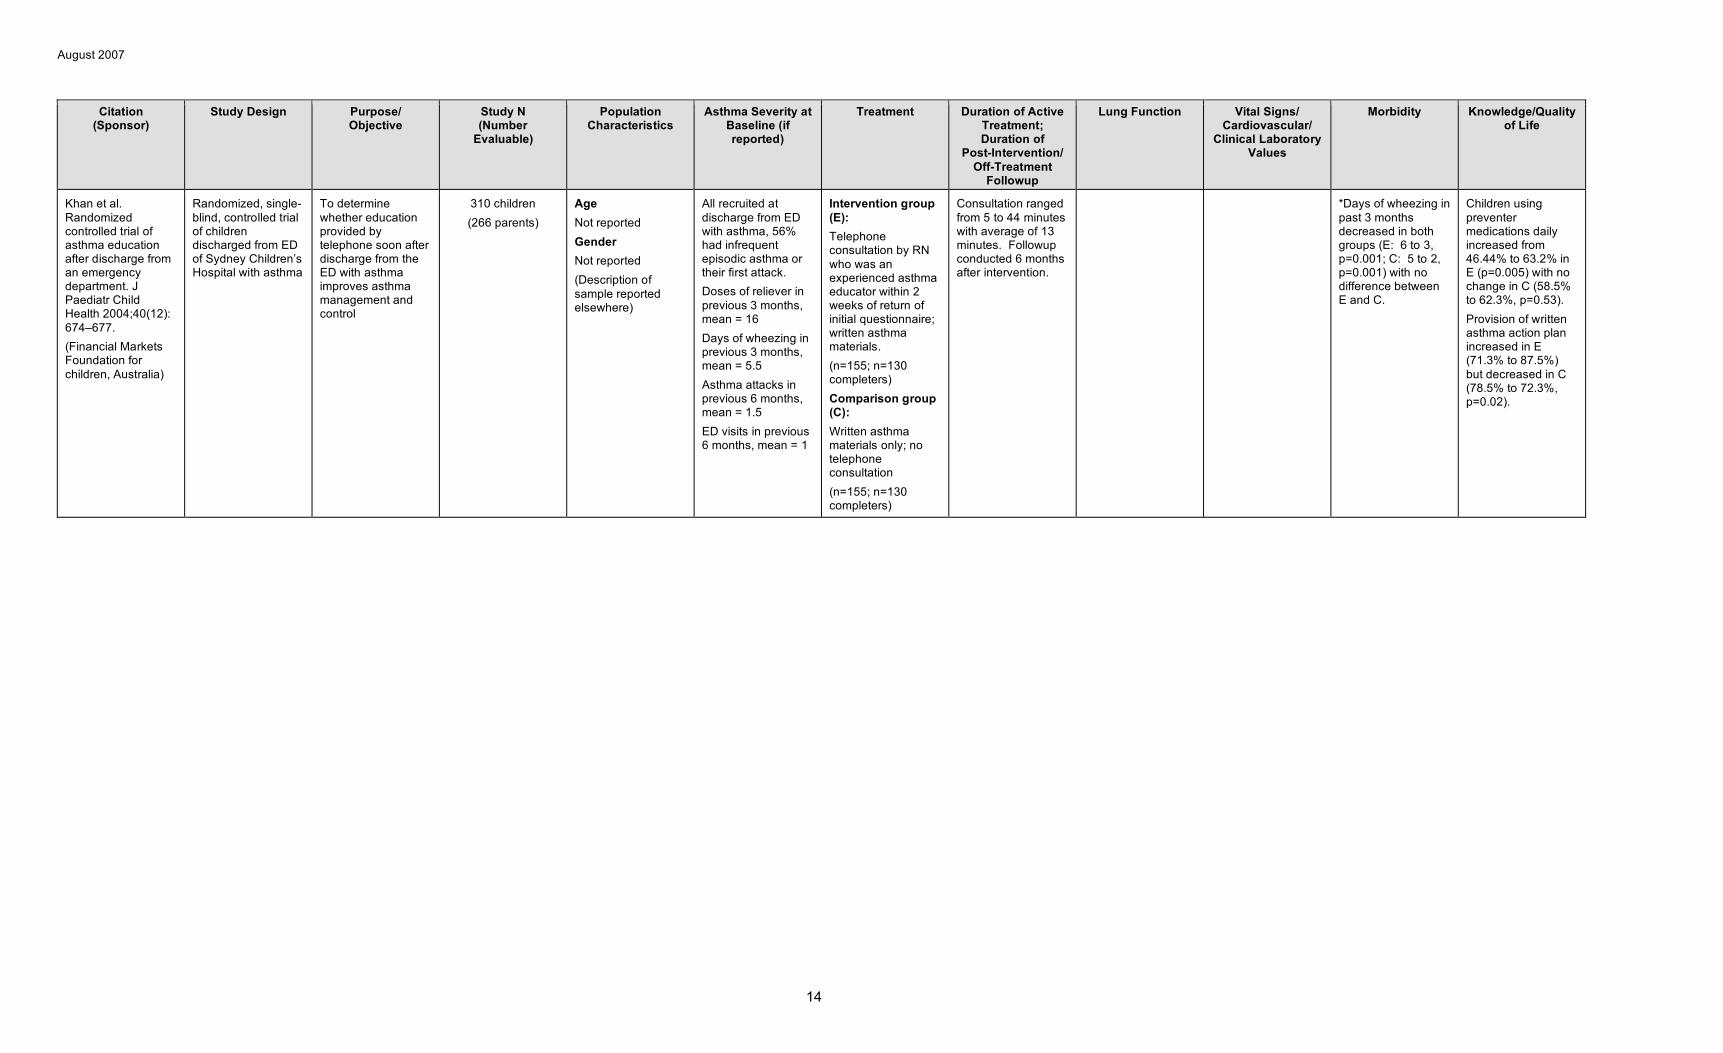
Khan et al. Randomized controlled trial of asthma education after discharge from an emergency department. J Paediatr Child Health 2004;40(12): 674–677. (Financial Markets Foundation for children, Australia)
Randomized, single-blind, controlled trial of children discharged from ED of Sydney Children’s Hospital with asthma
To determine whether education provided by telephone soon after discharge from the ED with asthma improves asthma management and control
310 children (266 parents)
Age Not reported Gender Not reported (Description of sample reported elsewhere)
All recruited at discharge from ED with asthma, 56% had infrequent episodic asthma or their first attack. Doses of reliever in previous 3 months, mean = 16 Days of wheezing in previous 3 months, mean = 5.5 Asthma attacks in previous 6 months, mean = 1.5 ED visits in previous 6 months, mean = 1
Intervention group (E): Telephone consultation by RN who was an experienced asthma educator within 2 weeks of return of initial questionnaire; written asthma materials. (n=155; n=130 completers) Comparison group (C): Written asthma materials only; no telephone consultation (n=155; n=130 completers)
Consultation ranged from 5 to 44 minutes with average of 13 minutes. Followup conducted 6 months after intervention.
*Days of wheezing in past 3 months decreased in both groups (E: 6 to 3, p=0.001; C: 5 to 2, p=0.001) with no difference between E and C.
Children using preventer medications daily increased from 46.44% to 63.2% in E (p=0.005) with no change in C (58.5% to 62.3%, p=0.53). Provision of written asthma action plan increased in E (71.3% to 87.5%) but decreased in C (78.5% to 72.3%, p=0.02).
14
August 2007
Citation (Sponsor)
Study Design Purpose/ Objective
Study N (Number
Evaluable)
Population Characteristics
Asthma Severity at Baseline (if reported)
Treatment Duration of Active Treatment; Duration of
Post-Intervention/ Off-Treatment
Followup
Lung Function Vital Signs/ Cardiovascular/
Clinical Laboratory Values
Morbidity Knowledge/Quality of Life
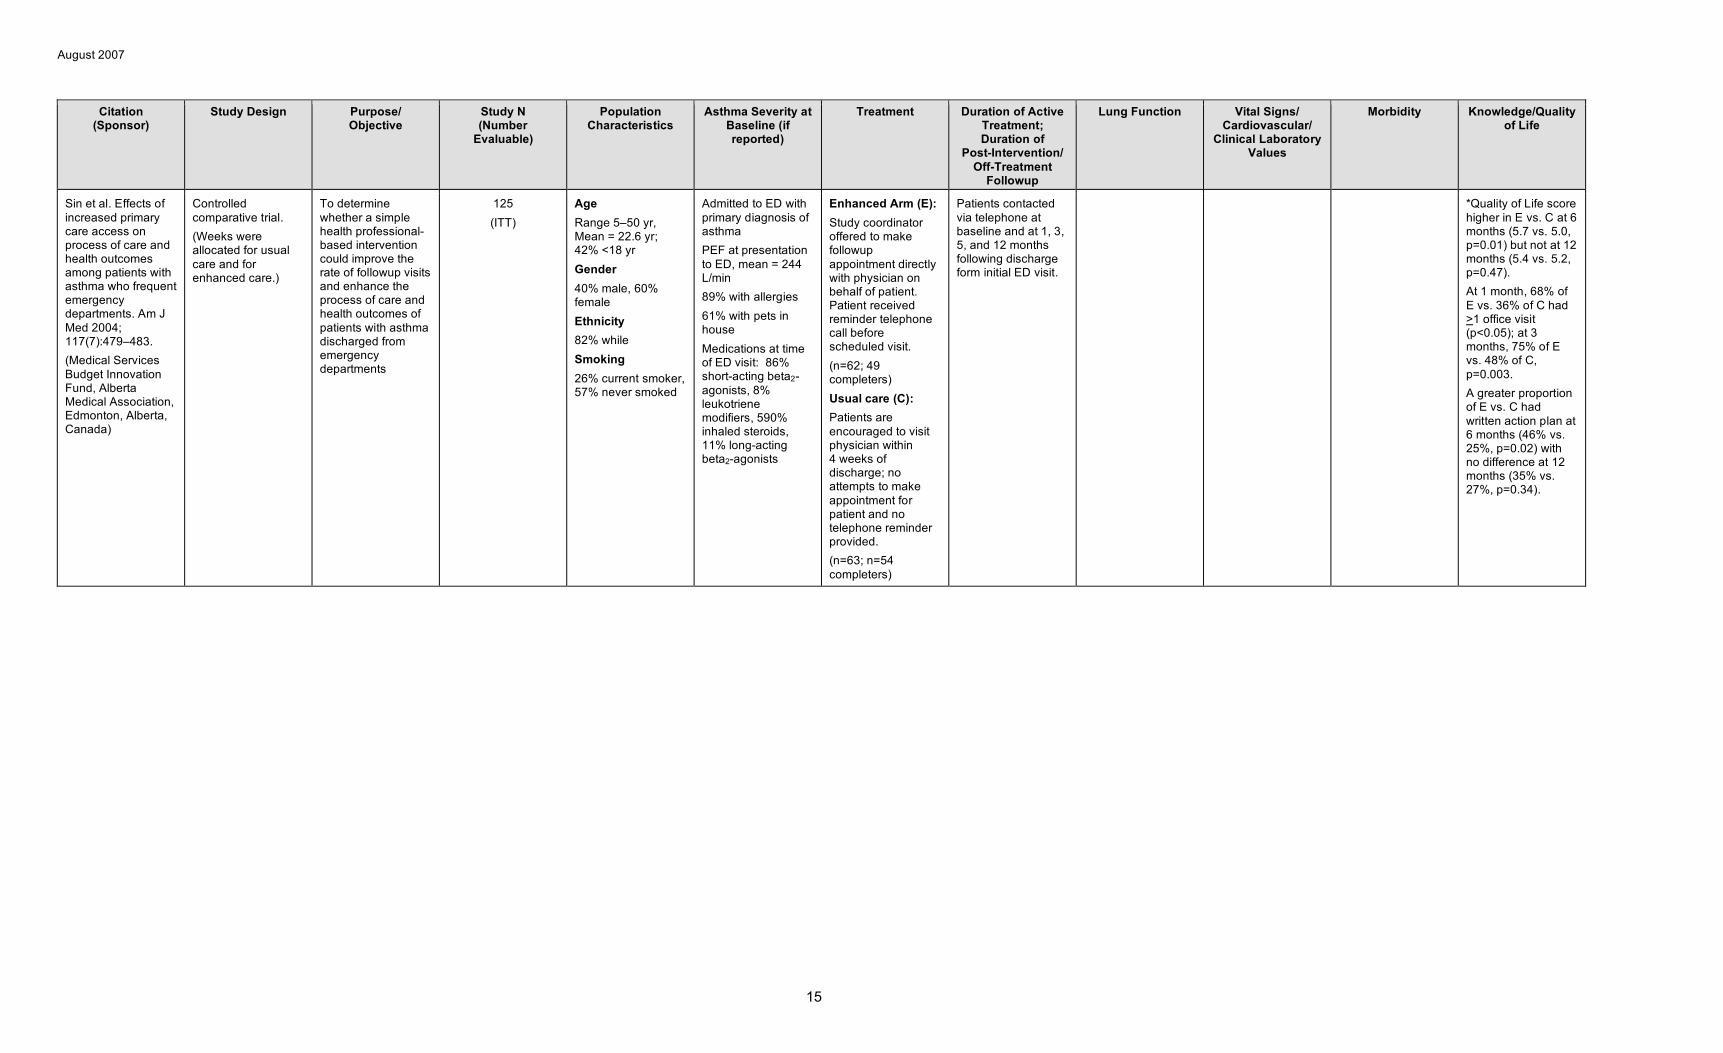
Sin et al. Effects of increased primary care access on process of care and health outcomes among patients with asthma who frequent emergency departments. Am J Med 2004; 117(7):479–483. (Medical Services Budget Innovation Fund, Alberta Medical Association, Edmonton, Alberta, Canada)
Controlled comparative trial. (Weeks were allocated for usual care and for enhanced care.)
To determine whether a simple health professional-based intervention could improve the rate of followup visits and enhance the process of care and health outcomes of patients with asthma discharged from emergency departments
125 (ITT)
Age Range 5–50 yr, Mean = 22.6 yr; 42% <18 yr Gender 40% male, 60% female Ethnicity 82% while Smoking 26% current smoker, 57% never smoked
Admitted to ED with primary diagnosis of asthma PEF at presentation to ED, mean = 244 L/min 89% with allergies 61% with pets in house Medications at time of ED visit: 86% short-acting beta2-agonists, 8% leukotriene modifiers, 590% inhaled steroids, 11% long-acting beta2-agonists
Enhanced Arm (E): Study coordinator offered to make followup appointment directly with physician on behalf of patient. Patient received reminder telephone call before scheduled visit. (n=62; 49 completers) Usual care (C): Patients are encouraged to visit physician within 4 weeks of discharge; no attempts to make appointment for patient and no telephone reminder provided. (n=63; n=54 completers)
Patients contacted via telephone at baseline and at 1, 3, 5, and 12 months following discharge form initial ED visit.
*Quality of Life score higher in E vs. C at 6 months (5.7 vs. 5.0, p=0.01) but not at 12 months (5.4 vs. 5.2, p=0.47). At 1 month, 68% of E vs. 36% of C had >1 office visit (p<0.05); at 3 months, 75% of E vs. 48% of C, p=0.003. A greater proportion of E vs. C had written action plan at 6 months (46% vs. 25%, p=0.02) with no difference at 12 months (35% vs. 27%, p=0.34).
15
August 2007
Citation (Sponsor)
Study Design Purpose/ Objective
Study N (Number
Evaluable)
Population Characteristics
Asthma Severity at Baseline (if reported)
Treatment Duration of Active Treatment; Duration of
Post-Intervention/ Off-Treatment
Followup
Lung Function Vital Signs/ Cardiovascular/
Clinical Laboratory Values
Morbidity Knowledge/Quality of Life
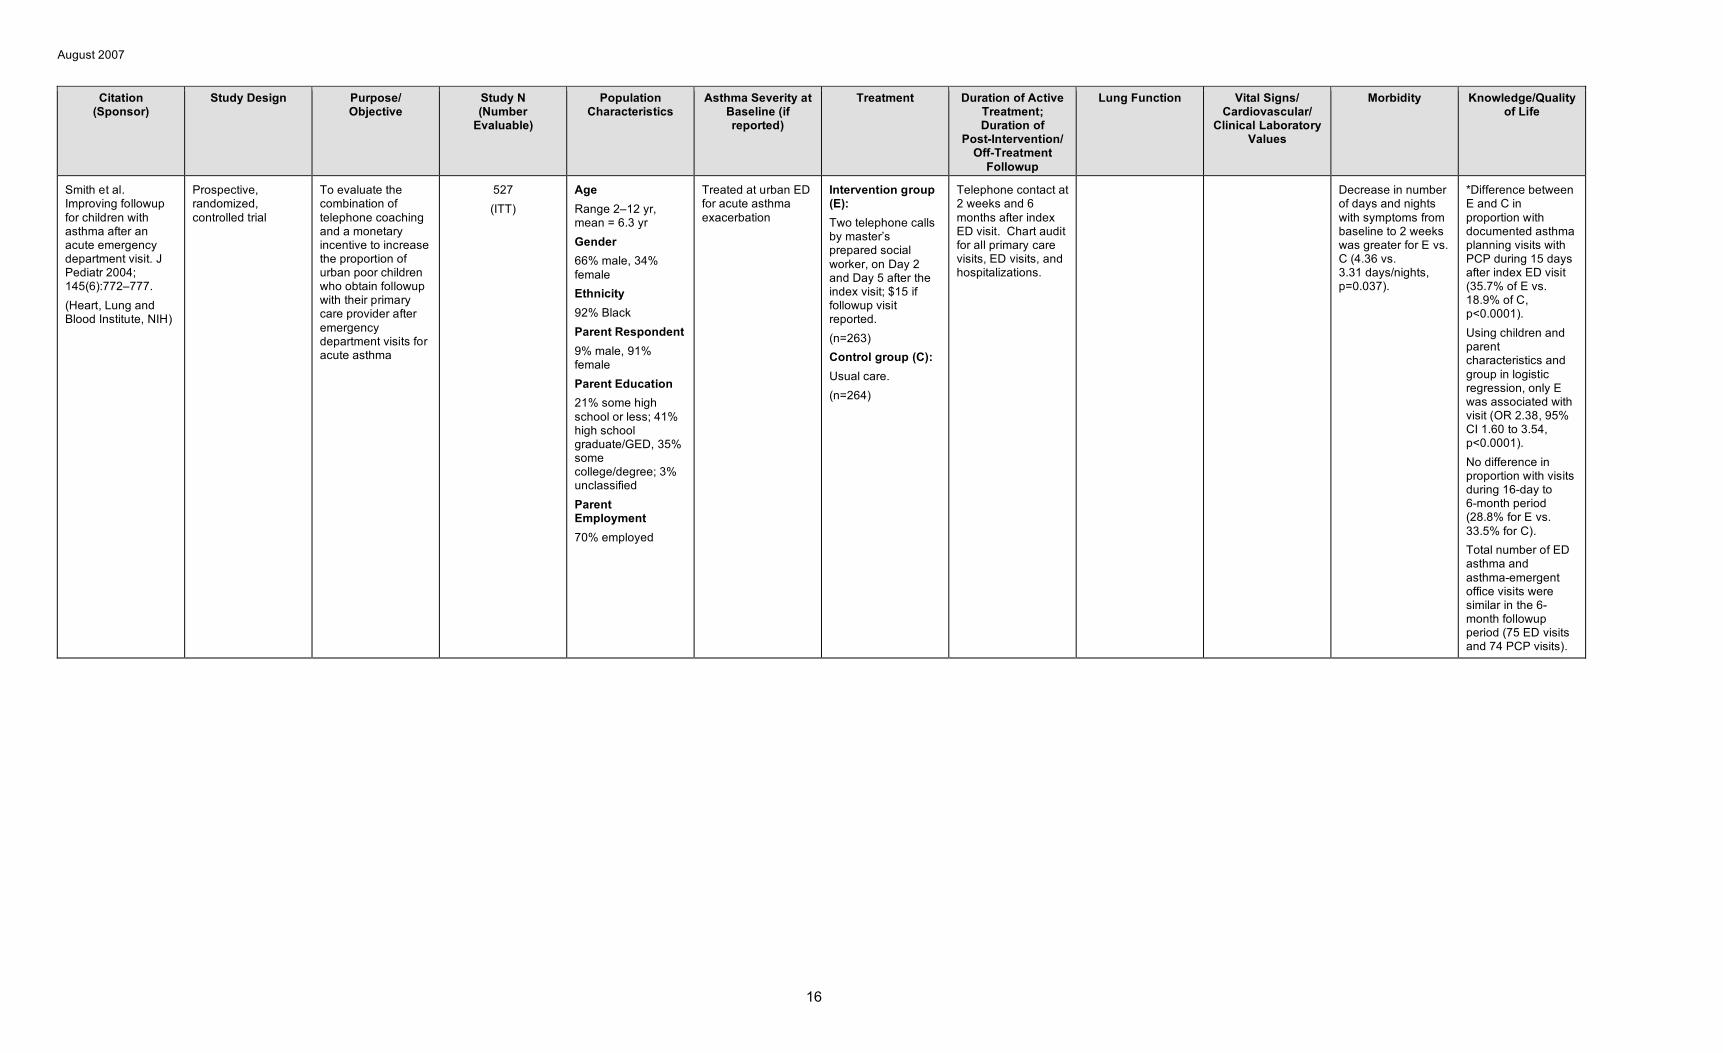
Smith et al. Improving followup for children with asthma after an acute emergency department visit. J Pediatr 2004; 145(6):772–777. (Heart, Lung and Blood Institute, NIH)
Prospective, randomized, controlled trial
To evaluate the combination of telephone coaching and a monetary incentive to increase the proportion of urban poor children who obtain followup with their primary care provider after emergency department visits for acute asthma
527 (ITT)
Age Range 2–12 yr, mean = 6.3 yr Gender 66% male, 34% female Ethnicity 92% Black Parent Respondent 9% male, 91% female Parent Education 21% some high school or less; 41% high school graduate/GED, 35% some college/degree; 3% unclassified Parent Employment 70% employed
Treated at urban ED for acute asthma exacerbation
Intervention group (E): Two telephone calls by master’s prepared social worker, on Day 2 and Day 5 after the index visit; $15 if followup visit reported. (n=263) Control group (C): Usual care. (n=264)
Telephone contact at 2 weeks and 6 months after index ED visit. Chart audit for all primary care visits, ED visits, and hospitalizations.
Decrease in number of days and nights with symptoms from baseline to 2 weeks was greater for E vs. C (4.36 vs. 3.31 days/nights, p=0.037).
*Difference between E and C in proportion with documented asthma planning visits with PCP during 15 days after index ED visit (35.7% of E vs. 18.9% of C, p<0.0001). Using children and parent characteristics and group in logistic regression, only E was associated with visit (OR 2.38, 95% CI 1.60 to 3.54, p<0.0001). No difference in proportion with visits during 16-day to 6-month period (28.8% for E vs. 33.5% for C). Total number of ED asthma and asthma-emergent office visits were similar in the 6-month followup period (75 ED visits and 74 PCP visits).
16
August 2007
Citation (Sponsor)
Study Design Purpose/ Objective
Study N (Number
Evaluable)
Population Characteristics
Asthma Severity at Baseline (if reported)
Treatment Duration of Active Treatment; Duration of
Post-Intervention/ Off-Treatment
Followup
Lung Function Vital Signs/ Cardiovascular/
Clinical Laboratory Values
Morbidity Knowledge/Quality of Life
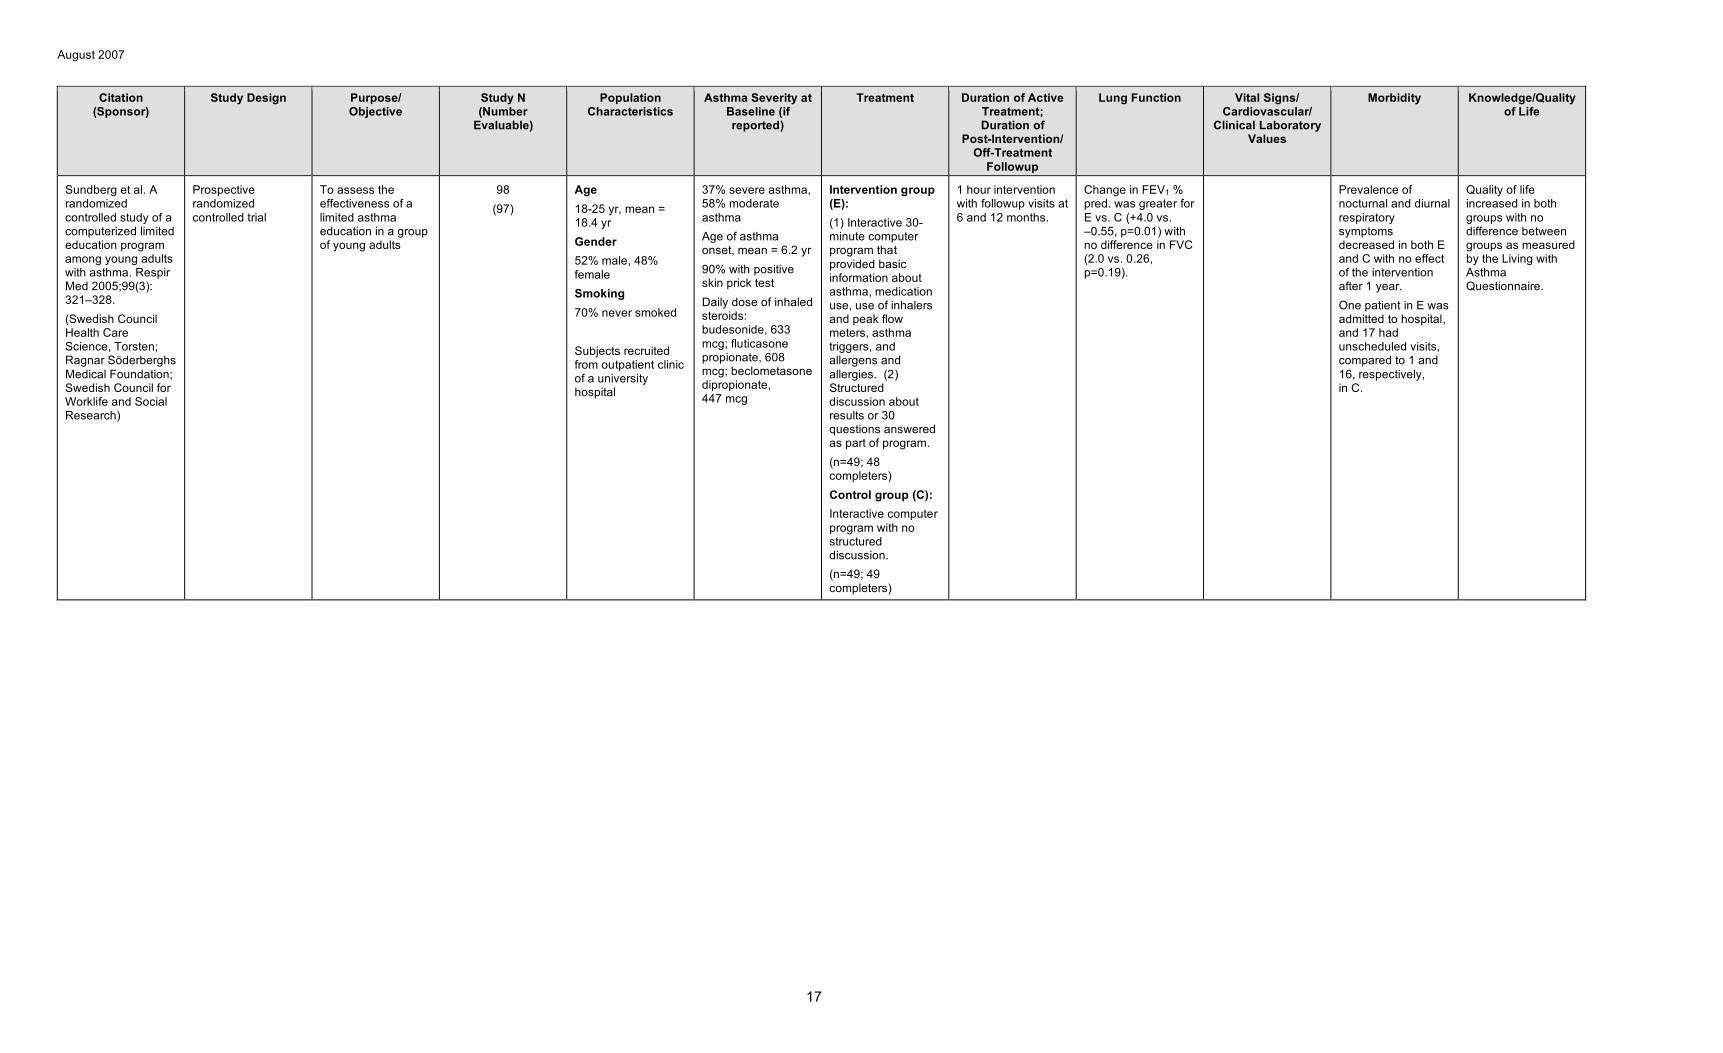
Sundberg et al. A randomized controlled study of a computerized limited education program among young adults with asthma. Respir Med 2005;99(3): 321–328. (Swedish Council Health Care Science, Torsten; Ragnar Söderberghs Medical Foundation; Swedish Council for Worklife and Social Research)
Prospective randomized controlled trial
To assess the effectiveness of a limited asthma education in a group of young adults
98 (97)
Age 18-25 yr, mean = 18.4 yr Gender 52% male, 48% female Smoking 70% never smoked
Subjects recruited from outpatient clinic of a university hospital
37% severe asthma, 58% moderate asthma Age of asthma onset, mean = 6.2 yr 90% with positive skin prick test Daily dose of inhaled steroids: budesonide, 633 mcg; fluticasone propionate, 608 mcg; beclometasone dipropionate, 447 mcg
Intervention group (E): (1) Interactive 30-minute computer program that provided basic information about asthma, medication use, use of inhalers and peak flow meters, asthma triggers, and allergens and allergies. (2) Structured discussion about results or 30 questions answered as part of program. (n=49; 48 completers) Control group (C): Interactive computer program with no structured discussion. (n=49; 49 completers)
1 hour intervention with followup visits at 6 and 12 months.
Change in FEV1 % pred. was greater for E vs. C (+4.0 vs. –0.55, p=0.01) with no difference in FVC (2.0 vs. 0.26, p=0.19).
Prevalence of nocturnal and diurnal respiratory symptoms decreased in both E and C with no effect of the intervention after 1 year. One patient in E was admitted to hospital, and 17 had unscheduled visits, compared to 1 and 16, respectively, in C.
Quality of life increased in both groups with no difference between groups as measured by the Living with Asthma Questionnaire.
17
August 2007
C. ASTHMA SELF-MANAGEMENT FOR EDUCATION DELIVERED TO CHILDREN USING NEW METHODS & TECHNOLOGY
Citation (Sponsor)
Study Design Purpose/ Objective
Study N (Number
Evaluable)
Population Characteristics
Asthma Severity at Baseline (if reported)
Treatment Duration of Active Treatment; Duration of
Post-Intervention/ Off-Treatment
Followup
Lung Function Vital Signs/ Cardiovascular/
Clinical Laboratory Values
Morbidity Knowledge/Quality of Life
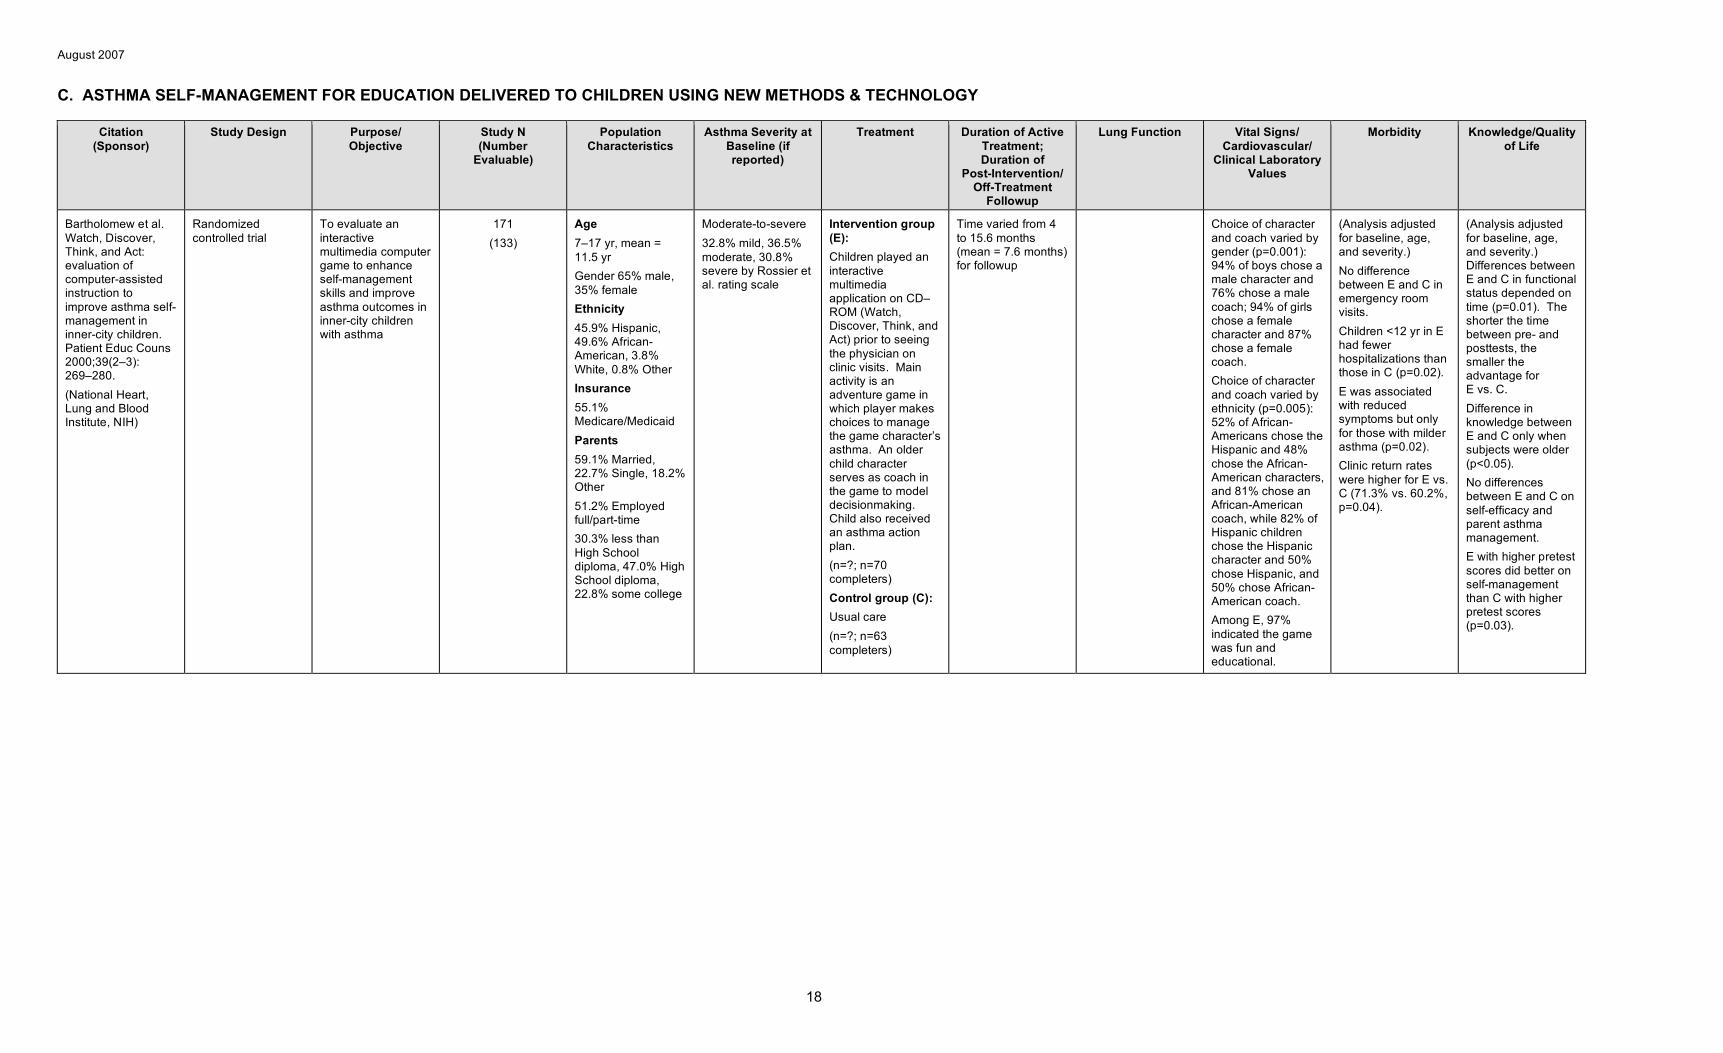
Bartholomew et al. Watch, Discover, Think, and Act: evaluation of computer-assisted instruction to improve asthma self-management in inner-city children. Patient Educ Couns 2000;39(2–3): 269–280. (National Heart, Lung and Blood Institute, NIH)
Randomized controlled trial
To evaluate an interactive multimedia computer game to enhance self-management skills and improve asthma outcomes in inner-city children with asthma
171 (133)
Age 7–17 yr, mean = 11.5 yr Gender 65% male, 35% female Ethnicity 45.9% Hispanic, 49.6% African-American, 3.8% White, 0.8% Other Insurance 55.1% Medicare/Medicaid Parents 59.1% Married, 22.7% Single, 18.2% Other 51.2% Employed full/part-time 30.3% less than High School diploma, 47.0% High School diploma, 22.8% some college
Moderate-to-severe 32.8% mild, 36.5% moderate, 30.8% severe by Rossier et al. rating scale
Intervention group (E): Children played an interactive multimedia application on CD– ROM (Watch, Discover, Think, and Act) prior to seeing the physician on clinic visits. Main activity is an adventure game in which player makes choices to manage the game character’s asthma. An older child character serves as coach in the game to model decisionmaking. Child also received an asthma action plan. (n=?; n=70 completers) Control group (C): Usual care (n=?; n=63 completers)
Time varied from 4 to 15.6 months (mean = 7.6 months) for followup
Choice of character and coach varied by gender (p=0.001): 94% of boys chose a male character and 76% chose a male coach; 94% of girls chose a female character and 87% chose a female coach. Choice of character and coach varied by ethnicity (p=0.005): 52% of African-Americans chose the Hispanic and 48% chose the African-American characters, and 81% chose an African-American coach, while 82% of Hispanic children chose the Hispanic character and 50% chose Hispanic, and 50% chose African-American coach. Among E, 97% indicated the game was fun and educational.
(Analysis adjusted for baseline, age, and severity.) No difference between E and C in emergency room visits. Children <12 yr in E had fewer hospitalizations than those in C (p=0.02). E was associated with reduced symptoms but only for those with milder asthma (p=0.02). Clinic return rates were higher for E vs. C (71.3% vs. 60.2%, p=0.04).
(Analysis adjusted for baseline, age, and severity.) Differences between E and C in functional status depended on time (p=0.01). The shorter the time between pre- and posttests, the smaller the advantage for E vs. C. Difference in knowledge between E and C only when subjects were older (p<0.05). No differences between E and C on self-efficacy and parent asthma management. E with higher pretest scores did better on self-management than C with higher pretest scores (p=0.03).
18
August 2007
Citation (Sponsor)
Study Design Purpose/ Objective
Study N (Number
Evaluable)
Population Characteristics
Asthma Severity at Baseline (if reported)
Treatment Duration of Active Treatment; Duration of
Post-Intervention/ Off-Treatment
Followup
Lung Function Vital Signs/ Cardiovascular/
Clinical Laboratory Values
Morbidity Knowledge/Quality of Life
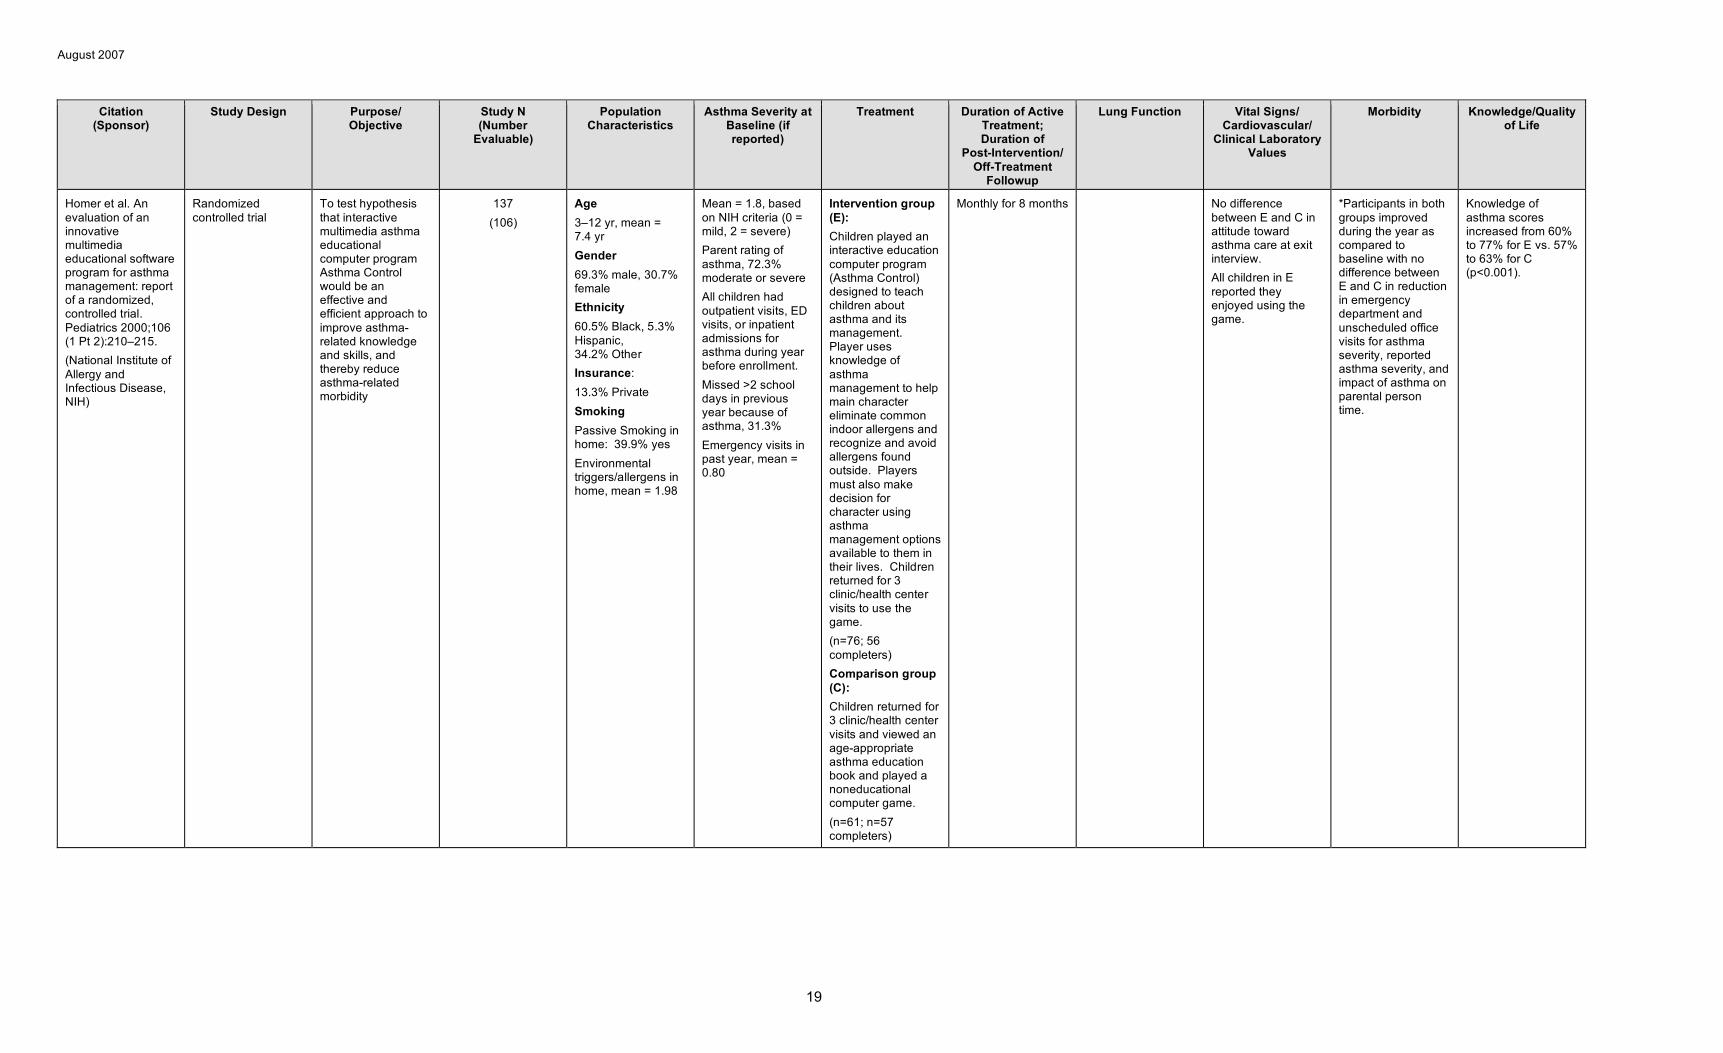
Homer et al. An evaluation of an innovative multimedia educational software program for asthma management: report of a randomized, controlled trial. Pediatrics 2000;106 (1 Pt 2):210–215. (National Institute of Allergy and Infectious Disease, NIH)
Randomized controlled trial
To test hypothesis that interactive multimedia asthma educational computer program Asthma Control would be an effective and efficient approach to improve asthma-related knowledge and skills, and thereby reduce asthma-related morbidity
137 (106)
Age 3–12 yr, mean = 7.4 yr Gender 69.3% male, 30.7% female Ethnicity 60.5% Black, 5.3% Hispanic, 34.2% Other Insurance: 13.3% Private Smoking Passive Smoking in home: 39.9% yes Environmental triggers/allergens in home, mean = 1.98
Mean = 1.8, based on NIH criteria (0 = mild, 2 = severe) Parent rating of asthma, 72.3% moderate or severe All children had outpatient visits, ED visits, or inpatient admissions for asthma during year before enrollment. Missed >2 school days in previous year because of asthma, 31.3% Emergency visits in past year, mean = 0.80
Intervention group (E): Children played an interactive education computer program (Asthma Control) designed to teach children about asthma and its management. Player uses knowledge of asthma management to help main character eliminate common indoor allergens and recognize and avoid allergens found outside. Players must also make decision for character using asthma management options available to them in their lives. Children returned for 3 clinic/health center visits to use the game. (n=76; 56 completers) Comparison group (C): Children returned for 3 clinic/health center visits and viewed an age-appropriate asthma education book and played a noneducational computer game. (n=61; n=57 completers)
Monthly for 8 months No difference between E and C in attitude toward asthma care at exit interview. All children in E reported they enjoyed using the game.
*Participants in both groups improved during the year as compared to baseline with no difference between E and C in reduction in emergency department and unscheduled office visits for asthma severity, reported asthma severity, and impact of asthma on parental person time.
Knowledge of asthma scores increased from 60% to 77% for E vs. 57% to 63% for C (p<0.001).
19

August 2007
Citation (Sponsor)
Study Design Purpose/ Objective
Study N (Number
Evaluable)
Population Characteristics
Asthma Severity at Baseline (if reported)
Treatment Duration of Active Treatment; Duration of
Post-Intervention/ Off-Treatment
Followup
Lung Function Vital Signs/ Cardiovascular/
Clinical Laboratory Values
Morbidity Knowledge/Quality of Life
Rich et al. Asthma in life context: Video Intervention/Preventi on Assessment (VIA). Pediatrics 2000;105 (3 Pt 1): 469–477. (John W. Alten Trust; Arthur Vining Davis Foundations; Gerondelis Foundation; Agnes M. Lindsay Trust; Mary A. and John M. McCarthy Foundation; Deborah Munroe Noonan Memorial Fund; Maternal and Child Health Bureau, Health Resources and Services Administration, Department of Health and Human Services)
Combined qualitative (visual illness narrative and video diary) and quantitative (standardized medical history interview)
To determine whether medical information gathering might be augmented by video diaries created by patients
23 (20)
Age Range 8 to 25 yr, median age 15 yr Gender 50% male, 50% female Ethnicity 50% Black, 35% White, 15% mixed race, 30% of Latino ethnicity
55% moderate and 45% severe persistent asthma
Participants were asked to use video to reveal their experiences living with and managing asthma for a period of 4 to 8 weeks.
19 of 20 who reported specific triggers for their asthma had the triggers documented on video. Exposure to tobacco smoke denied in the interview was revealed on video in 63%. Of participants who revealed medication use, 33% exceeded prescribed doses, 38% discontinued medication with consulting clinician, and 72% used ineffective inhaler technique.
20
August 2007
Citation (Sponsor)
Study Design Purpose/ Objective
Study N (Number
Evaluable)
Population Characteristics
Asthma Severity at Baseline (if reported)
Treatment Duration of Active Treatment; Duration of
Post-Intervention/ Off-Treatment
Followup
Lung Function Vital Signs/ Cardiovascular/
Clinical Laboratory Values
Morbidity Knowledge/Quality of Life
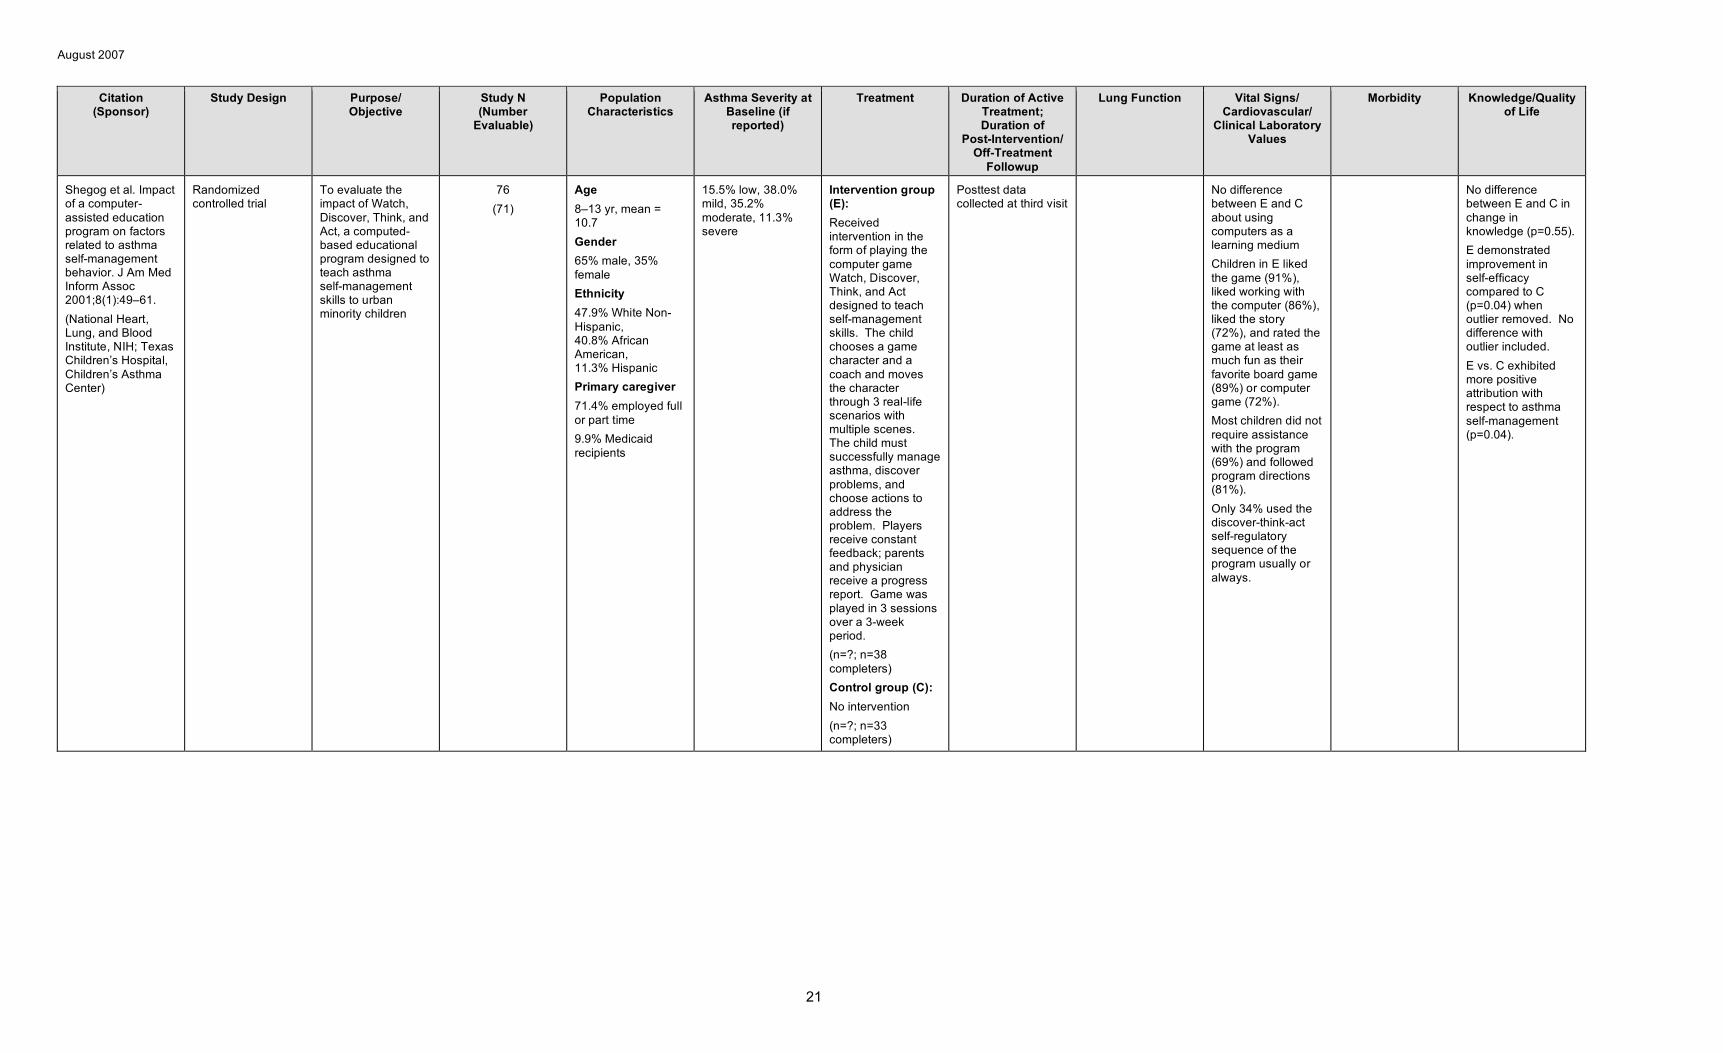
Shegog et al. Impact of a computer-assisted education program on factors related to asthma self-management behavior. J Am Med Inform Assoc 2001;8(1):49–61. (National Heart, Lung, and Blood Institute, NIH; Texas Children’s Hospital, Children’s Asthma Center)
Randomized controlled trial
To evaluate the impact of Watch, Discover, Think, and Act, a computed-based educational program designed to teach asthma self-management skills to urban minority children
76 (71)
Age 8–13 yr, mean = 10.7 Gender 65% male, 35% female Ethnicity 47.9% White Non-Hispanic, 40.8% African American, 11.3% Hispanic Primary caregiver 71.4% employed full or part time 9.9% Medicaid recipients
15.5% low, 38.0% mild, 35.2% moderate, 11.3% severe
Intervention group (E): Received intervention in the form of playing the computer game Watch, Discover, Think, and Act designed to teach self-management skills. The child chooses a game character and a coach and moves the character through 3 real-life scenarios with multiple scenes. The child must successfully manage asthma, discover problems, and choose actions to address the problem. Players receive constant feedback; parents and physician receive a progress report. Game was played in 3 sessions over a 3-week period. (n=?; n=38 completers) Control group (C): No intervention (n=?; n=33 completers)
Posttest data collected at third visit
No difference between E and C about using computers as a learning medium Children in E liked the game (91%), liked working with the computer (86%), liked the story (72%), and rated the game at least as much fun as their favorite board game (89%) or computer game (72%). Most children did not require assistance with the program (69%) and followed program directions (81%). Only 34% used the discover-think-act self-regulatory sequence of the program usually or always.
No difference between E and C in change in knowledge (p=0.55). E demonstrated improvement in self-efficacy compared to C (p=0.04) when outlier removed. No difference with outlier included. E vs. C exhibited more positive attribution with respect to asthma self-management (p=0.04).
21

August 2007
Citation (Sponsor)
Study Design Purpose/ Objective
Study N (Number
Evaluable)
Population Characteristics
Asthma Severity at Baseline (if reported)
Treatment Duration of Active Treatment; Duration of
Post-Intervention/ Off-Treatment
Followup
Lung Function Vital Signs/ Cardiovascular/
Clinical Laboratory Values
Morbidity Knowledge/Quality of Life
Guendelman et al. Improving asthma outcomes and self-management behaviors of inner-city children. Arch Pediatr Adolesc Med 2002;156(2): 114–120. (Health Management Services, Merck & Co., Inc., Whitehouse Station, NJ)
Randomized controlled trial
To evaluate the efficacy of a new interactive device, the Health Buddy, programmed for the care of innercity children with asthma
134 (122)
Age 8–16 yr, mean = 12.1 yr Gender 57% male, 43% female Ethnicity 76% African American, 10% White, 14% Other Insurance 93% Public, 7% Private Parent Education 46% high school diploma or below, 54% at least some college or technical school Smoking Passive smoking in household, 53% yes
26% mild persistent, 62% moderate persistent, 12% severe persistent Daily puffs of quick-relief medication, mean = 1.5 ED visits in past 12 months, mean = 2.25 Nights in hospital in past 12 months, mean = 0.60
Intervention group (E): Monitoring symptoms with The Health Buddy, a personal and interactive communication device in which children are asked questions based on the National Heart, Lung, and Blood Institute clinical practice guidelines and receive immediate feedback. Children accessed the device once a day for 90 days. (n=66; n=62 completers) Control group (C): Children monitored symptoms using a standard asthma diary. (n=68; n=60 completers)
Followup visits at 6 and 12 weeks
Fewer children in E vs. C had peak flow readings in the yellow or red zone during the 14 days before the 6-week visit (p=0.02). Odds of peak flow reading in yellow or red zone were lower for E vs. C (OR=0.43, 95% CI 0.23-0.82, p=0.01).
(Analyses adjusted for severity and baseline) *E less likely to have limitation in activities (OR=0.52, 95% CI 0.29–0.94, p=0.03). *Use of health services did not vary for E vs. C except for urgent calls (OR=0.43, 95% CI 0.18–0.99, p=0.05). No difference between E and C in wheezing (p=0.23), trouble sleeping (p=0.83), or missed school in past 6 weeks (p=0.41). Those who always used monitor without reminder were less likely to report coughing or wheeze (OR 0.70, 95% CI 0.50–0.99) and had lower probability of limitation in activities (OR 0.70, 95% CI 0.50–0.90).
At 12 weeks, E vs. C more likely to take medicines without reminders (p=0.04) and E likely to use Health Buddy with few or no reminders (p=0.001).
22
August 2007
Citation (Sponsor)
Study Design Purpose/ Objective
Study N (Number
Evaluable)
Population Characteristics
Asthma Severity at Baseline (if reported)
Treatment Duration of Active Treatment; Duration of
Post-Intervention/ Off-Treatment
Followup
Lung Function Vital Signs/ Cardiovascular/
Clinical Laboratory Values
Morbidity Knowledge/Quality of Life
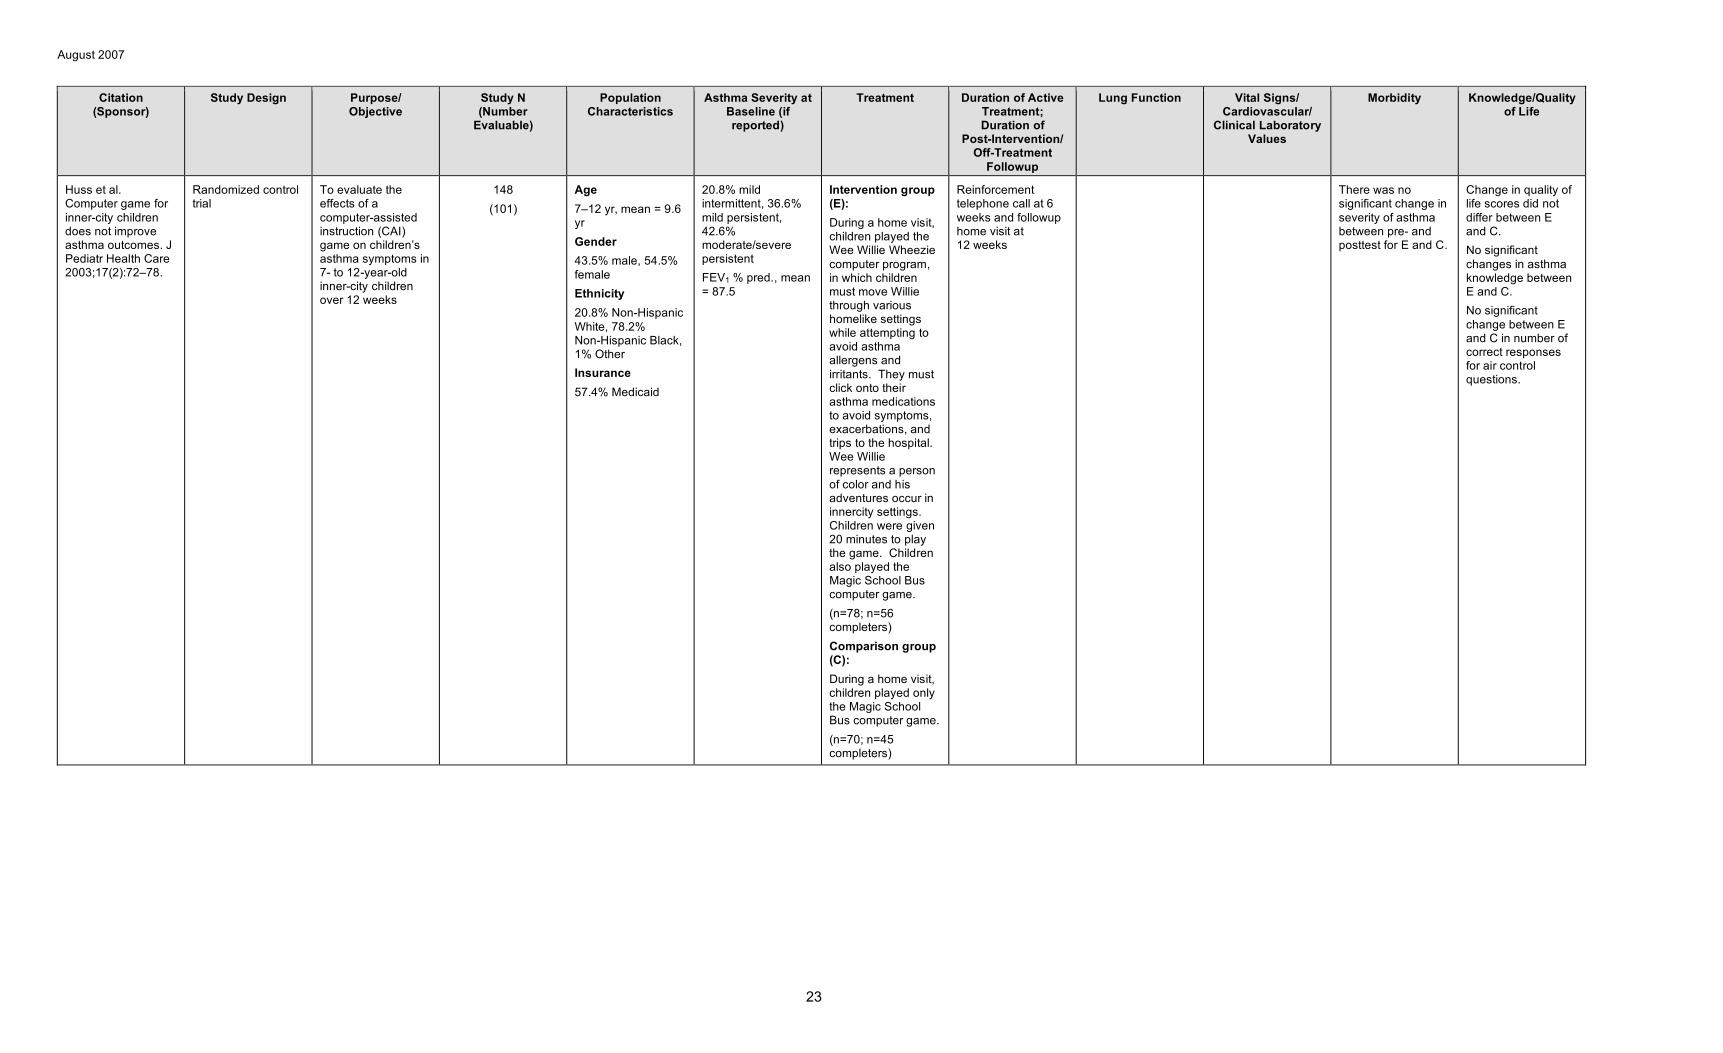
Huss et al. Computer game for inner-city children does not improve asthma outcomes. J Pediatr Health Care 2003;17(2):72–78.
Randomized control trial
To evaluate the effects of a computer-assisted instruction (CAI) game on children’s asthma symptoms in 7- to 12-year-old inner-city children over 12 weeks
148 (101)
Age 7–12 yr, mean = 9.6 yr Gender 43.5% male, 54.5% female Ethnicity 20.8% Non-Hispanic White, 78.2% Non-Hispanic Black, 1% Other Insurance 57.4% Medicaid
20.8% mild intermittent, 36.6% mild persistent, 42.6% moderate/severe persistent FEV1 % pred., mean = 87.5
Intervention group (E): During a home visit, children played the Wee Willie Wheezie computer program, in which children must move Willie through various homelike settings while attempting to avoid asthma allergens and irritants. They must click onto their asthma medications to avoid symptoms, exacerbations, and trips to the hospital. Wee Willie represents a person of color and his adventures occur in innercity settings. Children were given 20 minutes to play the game. Children also played the Magic School Bus computer game. (n=78; n=56 completers) Comparison group (C): During a home visit, children played only the Magic School Bus computer game. (n=70; n=45 completers)
Reinforcement telephone call at 6 weeks and followup home visit at 12 weeks
There was no significant change in severity of asthma between pre- and posttest for E and C.
Change in quality of life scores did not differ between E and C. No significant changes in asthma knowledge between E and C. No significant change between E and C in number of correct responses for air control questions.
23
August 2007
Citation (Sponsor)
Study Design Purpose/ Objective
Study N (Number
Evaluable)
Population Characteristics
Asthma Severity at Baseline (if reported)
Treatment Duration of Active Treatment; Duration of
Post-Intervention/ Off-Treatment
Followup
Lung Function Vital Signs/ Cardiovascular/
Clinical Laboratory Values
Morbidity Knowledge/Quality of Life
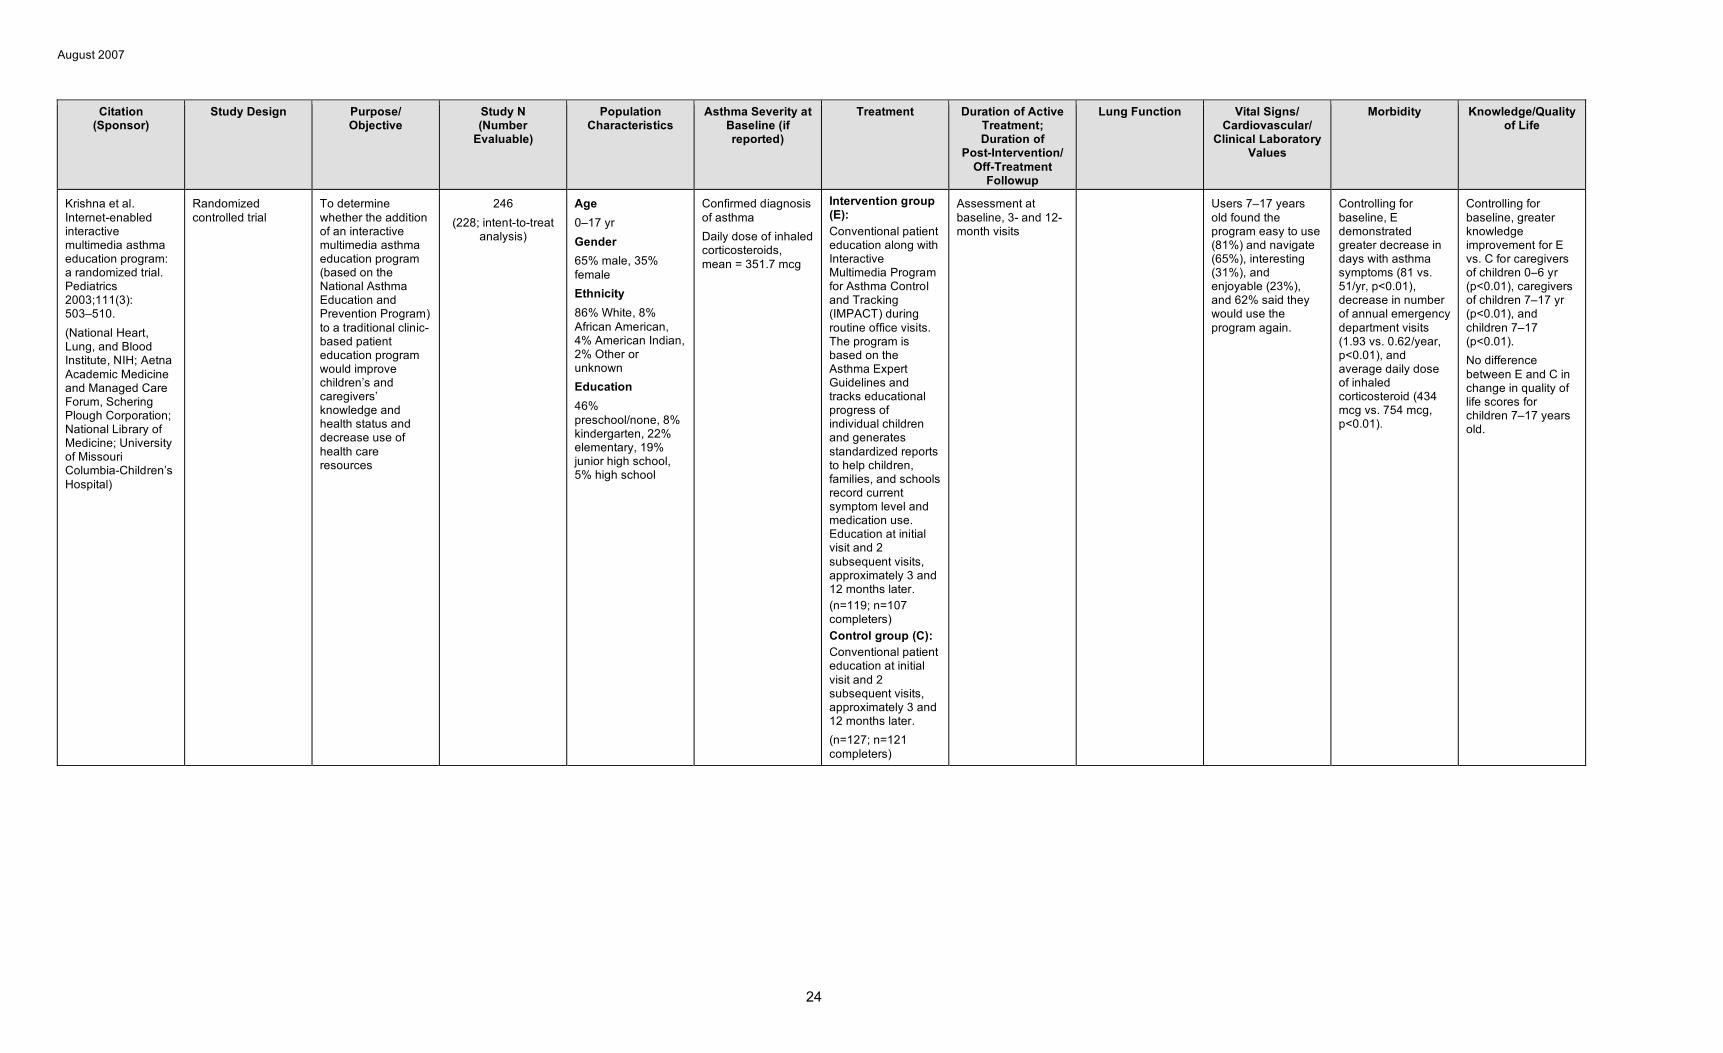
Krishna et al. Internet-enabled interactive multimedia asthma education program: a randomized trial. Pediatrics 2003;111(3): 503–510. (National Heart, Lung, and Blood Institute, NIH; Aetna Academic Medicine and Managed Care Forum, Schering Plough Corporation; National Library of Medicine; University of Missouri Columbia-Children’s Hospital)
Randomized controlled trial
To determine whether the addition of an interactive multimedia asthma education program (based on the National Asthma Education and Prevention Program) to a traditional clinic-based patient education program would improve children’s and caregivers’ knowledge and health status and decrease use of health care resources
246 (228; intent-to-treat
analysis)
Age 0–17 yr Gender 65% male, 35% female Ethnicity 86% White, 8% African American, 4% American Indian, 2% Other or unknown Education 46% preschool/none, 8% kindergarten, 22% elementary, 19% junior high school, 5% high school
Confirmed diagnosis of asthma Daily dose of inhaled corticosteroids, mean = 351.7 mcg
Intervention group (E): Conventional patient education along with Interactive Multimedia Program for Asthma Control and Tracking (IMPACT) during routine office visits. The program is based on the Asthma Expert Guidelines and tracks educational progress of individual children and generates standardized reports to help children, families, and schools record current symptom level and medication use. Education at initial visit and 2 subsequent visits, approximately 3 and 12 months later. (n=119; n=107 completers) Control group (C): Conventional patient education at initial visit and 2 subsequent visits, approximately 3 and 12 months later. (n=127; n=121 completers)
Assessment at baseline, 3- and 12-month visits
Users 7–17 years old found the program easy to use (81%) and navigate (65%), interesting (31%), and enjoyable (23%), and 62% said they would use the program again.
Controlling for baseline, E demonstrated greater decrease in days with asthma symptoms (81 vs. 51/yr, p<0.01), decrease in number of annual emergency department visits (1.93 vs. 0.62/year, p<0.01), and average daily dose of inhaled corticosteroid (434 mcg vs. 754 mcg, p<0.01).
Controlling for baseline, greater knowledge improvement for E vs. C for caregivers of children 0–6 yr (p<0.01), caregivers of children 7–17 yr (p<0.01), and children 7–17 (p<0.01). No difference between E and C in change in quality of life scores for children 7–17 years old.
24

August 2007
Citation (Sponsor)
Study Design Purpose/ Objective
Study N (Number
Evaluable)
Population Characteristics
Asthma Severity at Baseline (if reported)
Treatment Duration of Active Treatment; Duration of
Post-Intervention/ Off-Treatment
Followup
Lung Function Vital Signs/ Cardiovascular/
Clinical Laboratory Values
Morbidity Knowledge/Quality of Life
Rasmussen et al. Internet-based monitoring of asthma: a long-term, randomized clinical study of 300 asthmatic subjects. J Allergy Clin Immunol 2005;115(6):1137– 1142. (H:S Corporation of University Hospital of Copenhagen; AstraZeneca)
Prospective, randomized, parallel groups comparative design
To assess the outcome (symptoms, quality of life, lung function, and airway responsiveness) of an Internet-based management tool in comparison with conventional asthma treatment
300 (253)
Age 18–45 yr, median 30 yr Gender 34% male, 66% female
Symptoms grading: 2% very mild, 48% mild, 24% moderate, 26% severe FEV1 % pred., mean = 92 AHR logDRS, mean = 1.05 51% not taking asthma medication, 18.3% taking ICS
Internet group (IG): Asthma management tool consisting of an electronic diary, action plan for patients, and decision-support system for the physician; peak flow meter provided. Treated according to Global Initiative for Asthma (GINA) guidelines. (n=100; n=85 completers) Specialist group (SG): Patients treated according to current severity level. Patients taught how to adjust their medication; peak flow meter; written action plan provided. (n=100; n=88 completers) General practitioner group (GP): Patients asked to contact GP immediately after enrollment and pass on letter describing the study and giving test results. (n=100; n=80 completers)
6 months treatment with 2 scheduled visits 6 months apart
Improvement in FEV1 was 0.187 mL in IG, 0.035 mL in SG, and 0.004 mL in GP (p<0.001) with IG > SP (p<0.001) and GP (p<0.001). Improvement in AHR was 21% for IG, 17% for SG, and 8% for GP. OR for IG vs. GP was 3.06 (95%CI 1.13 to 8.31).
Acute unscheduled visits were made by 3.7% of patients in IG vs. 2.1% of patient in SG and 1.3% of patients in GP (p=0.05) on monthly basis.
*Odds for improvement in Asthma Quality of Life Questionnaire favored Internet group (IG vs. SG: OR 2.21, 95% CI 1.09 to 4.47; IG vs. GP: OR 2.10, 95% CI 1.02 to 4.31).
25