Evidence of Positive Student Outcomes in JROTC Career ...Most notable among them are Tom Wilson,...
25
National Defense Research Institute Evidence of Positive Student Outcomes in JROTC Career Academies Marc N. Elliott, Lawrence M. Hanser, Curtis L. Gilroy Prepared for the Office of the Secretary of Defense R Approved for public release; distribution unlimited
Transcript of Evidence of Positive Student Outcomes in JROTC Career ...Most notable among them are Tom Wilson,...

National Defense Research Institute
Evidence of PositiveStudent Outcomes inJROTC Career Academies
Marc N. Elliott, Lawrence M. Hanser, Curtis L. Gilroy
Prepared for the Office of the Secretary of Defense
R
Approved for public release; distribution unlimited
i
Preface
In 1992, the U.S. Departments of Defense and Education joined together to createa new high school program aimed at encouraging at-risk youth to remain inschool until graduation. The program is a marriage of the defense-sponsoredJunior Reserve Officers Training Corps (JROTC) program and a comprehensivehigh school reform initiative referred to as career academies.
This report focuses on an examination of the effects of the JROTC CareerAcademy program on student outcomes, including grades, attendance, andgraduation. It is a companion report to MR-741-OSD, Implementing JROTC High
School Career Academies. The intended audience for this report includes theprogram’s sponsors as well as those working or interested in the field ofeducational reform, including researchers, school district administrators,teachers, parents, and business and community leaders.
This research was sponsored by the Director, Special Projects and Research, inthe Office of the Under Secretary of Defense for Personnel and Readiness. It wasconducted within the Forces and Resources Policy Center of RAND’s NationalDefense Research Institute (NDRI). NDRI is a federally funded research anddevelopment center sponsored by the Office of the Secretary of Defense, the JointStaff, the unified commands, and the defense agencies.
iii
Contents
Preface iii
Tables ...................................................................................................... vii
Summary ................................................................................................... ix
Acknowledgments...................................................................................... xi
1. INTRODUCTION ............................................................................... 1
2. METHOD ........................................................................................... 5Data ................................................................................................... 5Dependent/Outcome Variables............................................................ 5Independent Variables......................................................................... 7Adjustment for Selection Effects ........................................................... 9
3. RESULTS............................................................................................ 11Propensity Weighting Models .............................................................. 11Outcome Models ................................................................................. 12
4. DISCUSSION...................................................................................... 15
References.................................................................................................. 17
v
Tables
1. Total Number of Students and Proportion of Male Students, byAnalytic Group and by Program...................................................... 6
2. Proportion of African American and Hispanic Students, byAnalytic Group and by Program...................................................... 6
3. Summary of Propensity Models of Selection into the JROTCCareer Academy............................................................................. 11
4. GPA and Absenteeism Outcomes by Analytic Group, Adjustedfor JROTC Career Academy Student Mix.......................................... 13
5a. Percentage of 1994–1995 Cohort at Site A with Given SeniorOutcomes, Adjusted for JROTCCA Student Mix ............................... 14
5b. Percentage of 1994–1995 Cohort at Site B with Given SeniorOutcomes, Adjusted for JROTCCA Student Mix ............................... 14
vii
Summary
Career academies, school-within-a-school high school programs organizedaround a vocational theme, have become a popular approach for addressing theneeds of at-risk students. Few published studies have evaluated theireffectiveness, and most of these studies have focused on the same small set ofacademies. This research examines student outcomes for 18 cohorts of enteringstudents enrolled in a total of eight pairs of schools in five major urban schooldistricts across the United States. Pairs of schools were chosen to help rule outselectivity bias. We focus on student attendance, grades, and graduation status,using a propensity weighting technique to adjust for selection into the careeracademy.
In 1992, the Departments of Defense and Education sponsored the developmentof career academies in a number of urban centers, enhancing the traditionalcareer academy model with the addition of required enrollment in the JuniorReserve Officers Training Corps (JROTC) program of instruction. The eightcareer academies in this study are a subset of the thirty-eight academies begununder this initiative. These academies came to be called JROTC CareerAcademies (JROTCCA).
Data consisted of administrative records for two to three complete cohorts ofstudents in each of the eight pairs of urban high schools in the United Stateschosen for this analysis. For seven of these pairs, the cohorts consisted of ninth-grade students; in one pair the cohort consisted of tenth-grade students. Thecohorts contained a total of 27,490 students. Students in the JROTCCA programwere more likely to have taken standardized tests, but were also more likely tohave had poor previous academic performance, both in the classroom and onstandardized tests.
Grade-point averages (GPAs) for the JROTCCA students were significantlyhigher following enrollment in the program than would have been expected ifthey had been enrolled in the general academic program in six of ten cases. Thedifferences were generally substantial, with most in the range of one-quarter toone-half of a grade point higher on a four-point scale. Also, absenteeism for theJROTCCA students was significantly lower than what would have been expectedfor these same students in the general academic program in seven of ten cases.In the two cases for which four-year graduation information was available,
viii
nearly twice as many of the students enrolled in the JROTCCA program in theninth grade graduated as would have been expected to graduate had they beenin the general academic program. In many cases, GPA and absenteeism in theJROTCCA program were also significantly better than what would have beenexpected in the standard JROTC program, as well. Discussions with studentssuggest that high student satisfaction may be responsible for the low rates ofabsenteeism among JROTCCA students.
ix
Acknowledgments
The authors would like to thank first and most the students, teachers, andadministrators who generously contributed their time to support this project.
Several individuals from within the federal government provided informationand assistance. Most notable among them are Tom Wilson, Barbara Lee, MikeHayes, and Donna Rice from the Department of the Army; Hans Krucke from theDepartment of the Navy; Ken Daly from the Department of the Air Force; andSandra Furey, Mark Schwartz, and Cleveland Randle from the Department ofEducation.
Abby Robyn and Phil Devin assisted us in obtaining data from the schooldistricts, and Hong-Jun Kan organized the data and assisted in the analysis of it.Brian Stecher and Dan McCaffery provided very helpful comments on an earlierversion of this report. Sue Hosek provided support that was helpful in thedevelopment of this work.
The authors bear responsibility for any errors that remain in the manuscript.
3
1. Introduction
In 1992, the Departments of Defense and Education began a program to sponsorthe development of enhanced career academies in 38 schools. These academiesbuilt on the traditional career academy model developed in Philadelphia in thelate 1960s by adding a third dimension—an increased emphasis on civic values,responsibility, citizenship, discipline, and leadership that comes from the JuniorReserve Officers Training Corps (JROTC) program of instruction.1 These JROTCCareer Academies (JROTCCA) include the following components:
Structure of a School Within a School: A team of teachers linked with a groupof students forms a distinct unit within a school. The teachers remain with thestudent group throughout high school. Teachers are dedicated to the success ofthe student group and together plan curricula and activities that promote theacademy’s goals.
Block Scheduling of Classes and Students:2 Classes are scheduled
consecutively and students move together from class to class. The blocktypically consumes either the entire morning or afternoon. Academy teachersdecide how to use the block of class time. Block scheduling provides flexibilityin class length, allowing classes to be scheduled, as needed, for more or less thanone regular class period.
Common Planning Time for Teachers: Academy teachers meet daily or weeklyto develop curriculum, plan activities, and share reports of student problems andprogress.
Occupational Focus: The academy curriculum and activities focus on a specificoccupational area such as health care, business and finance, building trades, andinformation technology. There is a sequence of courses and activities designed to
_________________1The regular JROTC program already in place in over 2,600 high schools nationwide consists of
one additional class each year taught by an individual who has retired from military service and beenapproved by that service as a JROTC instructor. The Navy JROTC course, for example, includesinstruction in leadership, Naval history, maritime geography, and basic seamanship. The programalso includes after-school extracurricular activities such as drill teams, color guards, and at someschools, rifle marksmanship teams.
2Block scheduling sometimes refers to a single class, such as algebra, that is scheduled for twoback-to-back periods so that an entire year of instruction is completed in one semester. This is not thesame as block scheduling in Career Academies, where students move together as a block from oneclass to another and where three or four different academy classes are scheduled back-to-back. Inacademy block-scheduling, the academy staff is free to divide and use the three-to-four-hour block oftime in any configuration of subjects they desire.
4
acquaint students with the entire breadth of a career field and to provide work-related experiences in some portion of it. The JROTC Career Academies have avaried array of occupational focuses, ranging from media and arts to health,assistive technology, maritime science and transportation, and aviation.
Integrated Academic and Vocational Curriculum: Topics and projects crossindividual course lines—the curriculum is integrated thematically by theacademy’s occupational focus.
Reduced Student-Teacher Ratio: Class sizes are small (typically 25 or fewerstudents), permitting greater attention to individual students.
Business Partners: Business partners (often local employers) assist in designingthe academy program. They participate in setting goals, developing curricula,planning and hosting activities, providing workplace experiences, developingand renovating facilities, and providing classroom equipment. They mayprovide resources for the academy and identify and enlist other sources ofsupport and can offer summer or even permanent jobs to academy students.
To this model, the JROTC Career Academies add the following component:
Integration with JROTC: Enrollment in JROTC has been required for studentsin the academy. JROTC personnel are integral members of the academy teamcontributing to both planning and instructional processes. JROTC coursework isintegrated with the academy program.
Career academies have become a popular educational reform initiative withinpublic high schools, yet published studies that evaluate their effectiveness inimproving measurable student outcomes have been restricted to only a fewprograms (see Academy for Educational Development, 1990; Dayton and Stern,1990; Dayton, Weisberg, and Stern, 1989; Dayton et al., 1988; Guthrie, Guthrie,and van Heusden, 1990; Reller, 1984, 1985, 1987; Snyder and McMullan, 1987;and Stern et al., 1989). In addition, most of these studies have been done on onesubset of academies in California. Research has provided some evidence forlower dropout rates, higher attendance rates, higher grade-point-averages(GPAs), and more credits earned among career academy participants whencompared with other students in the same schools. For example, Dayton et al.(1988) reported significant improvements in objective measures of schoolperformance in three of ten sites.
However, as Stern, Raby, and Dayton (1992) have pointed out, all of the researchto date on career academies has been quasi-experimental and selection effectscannot be ruled out as possible explanations for the positive results found thus
5
far. Unfortunately, to our knowledge only one experimental study on the effectsof career academies on student outcomes has been undertaken (see Kemple andRock, 1996, for a description).
High school career academies are organized around a vocational theme. Inaddition to courses and experiences related to this theme, there is a coreacademic curriculum (mathematics, English, social science, and natural science).Academic and vocational courses are integrated by organizing each class in sucha way that students see the connection between what they are doing in theiracademic and vocational courses (see California Department of Education, 1994;Robyn and Hanser, 1995; Stern, Raby, and Dayton, 1992).
This approach was originally designed to address the needs of “at-risk” students(Stern, Raby, and Dayton, 1992). Students may self-select into a career academybut are typically referred to an academy by teachers and counselors because ofsub-par performance in traditional academic coursework—having low grades,exhibiting poor attendance, and earning few credits towards graduation. Theselection process may differ somewhat among schools and perhaps by cohortswithin schools. Students enter academies in either the ninth or tenth grade andcontinue through high school graduation, having taken all or most of theircourses together from a group of teachers dedicated to the academy.
In JROTC Career Academies, students are typically recruited, rather than beingassigned to them. In these Career Academies, students and their parents may berequired to sign an agreement stipulating acceptable behaviors and performanceif the student is to remain in the academy. Academy teachers also usually chooseto participate in the program, although local customs or constraints (e.g.,unionization) may define whether teachers are assigned or volunteer toparticipate. Finally, the JROTC Career Academy coordinator is usually a seniorteacher who has been released from some teaching responsibilities to manage theacademy. As in other major school reform programs, the model describes anideal, which is often not achieved in practice. In an evaluation of theimplementation of the JROTC Career Academies through their first two years ofoperation, Hanser and Robyn (2000) reported that goals for structural changewere more likely to be met than goals for pedagogical change. For example, siteswere more likely to have identified a team of teachers and provided them withflexible class scheduling and a common planning period than they were to havedeveloped a core curriculum for the academy or to have integrated vocationaland academic classes. Kemple and Rock (1996) revealed a similar situation ininitial implementation among the career academies they studied.
6
Nonetheless, career academies contain a mix of restructuring and pedagogicalreforms that should have positive effects on at-risk student populations. Forexample, McPartland (1994) has argued that there are four essential qualities ofschool climate that motivate at-risk students to succeed: opportunities forsuccess in schoolwork, a climate of human caring and support, relevance ofschool to students’ community and future, and help with students’ personalproblems. Career academies contain elements that address each of theseessential qualities, except for a specific component focused on students’ personalproblems. The school-within-a-school structure of career academies creates thepotential for a caring and supportive climate to develop and function, and thecareer-oriented nature of academy instruction can bring relevance to schoolwork.
The JROTC Career Academies were initiated in selected high schools in urbanschool districts from across the United States. Most of the schools had specialprograms in place at the time the JROTC Career Academies began operation.The larger of these programs included other career academies and magnetprograms—none of the schools were new to implementing large-scale reformprograms. Our analysis reports specifically on comparisons of the performanceof students in the JROTC Career Academies with (1) the performance of studentsin other career academies or magnet programs, (2) students in regular JROTCprograms, and (3) students in general academic programs.
Our research serves to broaden the base of empirical analyses focusing on theefficacy of career academies but, more importantly, uses a new and unique dataset and employs an innovative technique to deal with the critical statistical issueof selectivity bias. This study examines student outcomes for 18 cohorts ofentering students enrolled in a total of eight pairs of schools in five major urbanschool districts across the United States. We focus on the effects of JROTC CareerAcademy enrollment on student attendance, grades, and graduation, and use apropensity weighting technique (cf. Rosenbaum and Rubin, 1983) to adjust fordifferences between JROTC Career Academy and comparison students.
7
2. Method
Data
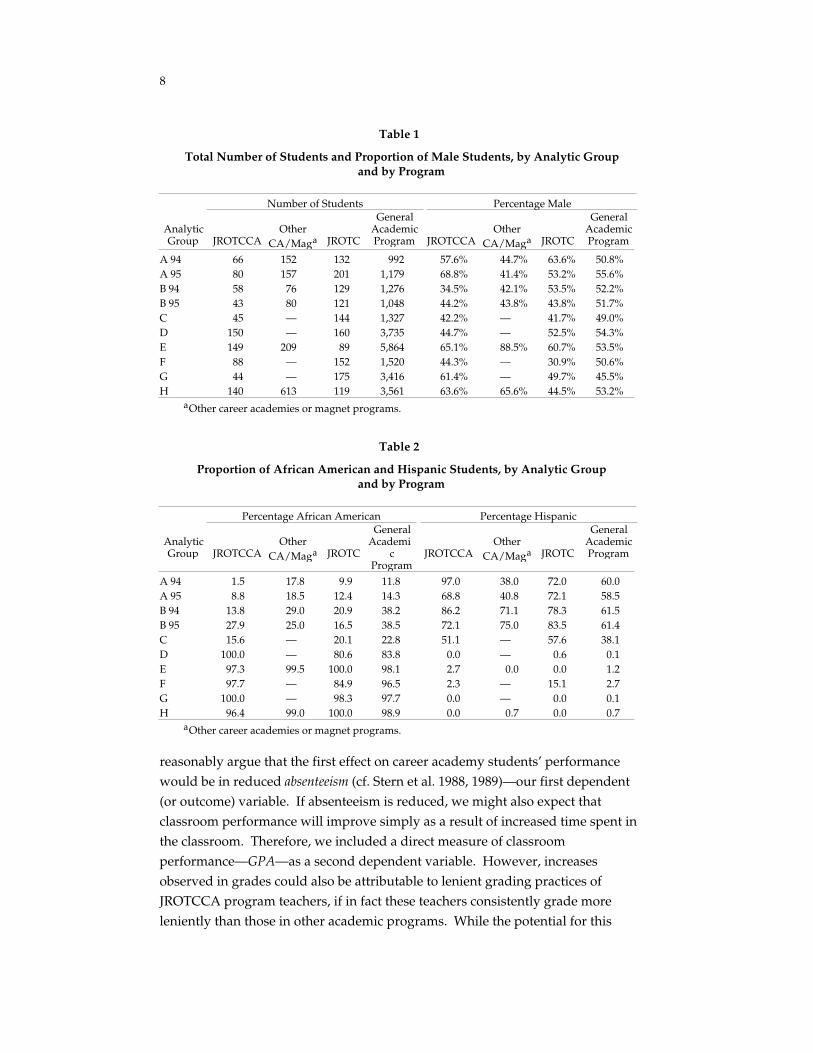
Our data consisted of administrative records for two to three complete cohorts ofstudents in each of eight pairs (sites) of urban high schools in the United States.For seven of these pairs, the cohorts consisted of ninth-grade students; in onepair the cohort consisted of tenth-grade students. The 18 cohorts contained atotal of 27,490 students. For six of eight sites, cohorts were combined within asite for purposes of analyses. For the remaining two sites, which contained twocohorts each, the cohorts were analyzed separately.3 This resulted in a total often analytic groups.
In terms of race-ethnicity composition, five sites (five analytic groups) hadalmost exclusively African American students, two sites (four analytic groups)had a Hispanic majority, and one site (one analytic group) had a Hispanicplurality (see Tables 1 and 2).
Data were available for gender, ethnicity, GPAs, attendance, graduation status(for one cohort of students at each of two pairs of schools), standardized testscores in math and reading (from the most recent district test administrationprior to ninth grade for students in the ninth grade sample and the most recentadministration prior to tenth grade for students in the tenth grade sample), andprogram enrollment information. For the tenth grade sample, additional ninth-grade performance data were collected, including attendance, GPA, creditsattempted, and credits earned. Similar eighth-grade data were not available forthe sites that began the JROTCCA program in the ninth grade.
Dependent/Outcome Variables
Academy programs create small, nurturing learning environments in otherwiselarge and often impersonal high schools, and then attempt to endow theseenvironments with learning experiences that impress upon students theconnection between success in school and success in life. As a result, one might
_________________3As discussed subsequently, cohorts within a site were treated separately if there was evidence
of different selection processes into the JROTCCA program from one cohort to the next.
8
Table 1
Total Number of Students and Proportion of Male Students, by Analytic Groupand by Program
Number of Students Percentage Male
AnalyticGroup JROTCCA
OtherCA/Maga JROTC
GeneralAcademicProgram JROTCCA
OtherCA/Maga JROTC
GeneralAcademicProgram
A 94 66 152 132 992 57.6% 44.7% 63.6% 50.8%A 95 80 157 201 1,179 68.8% 41.4% 53.2% 55.6%B 94 58 76 129 1,276 34.5% 42.1% 53.5% 52.2%B 95 43 80 121 1,048 44.2% 43.8% 43.8% 51.7%C 45 — 144 1,327 42.2% — 41.7% 49.0%D 150 — 160 3,735 44.7% — 52.5% 54.3%E 149 209 89 5,864 65.1% 88.5% 60.7% 53.5%F 88 — 152 1,520 44.3% — 30.9% 50.6%G 44 — 175 3,416 61.4% — 49.7% 45.5%H 140 613 119 3,561 63.6% 65.6% 44.5% 53.2%
aOther career academies or magnet programs.
Table 2
Proportion of African American and Hispanic Students, by Analytic Groupand by Program
Percentage African American Percentage Hispanic
AnalyticGroup JROTCCA
OtherCA/Maga JROTC
GeneralAcademi
cProgram
JROTCCAOther
CA/Maga JROTC
GeneralAcademicProgram
A 94 1.5 17.8 9.9 11.8 97.0 38.0 72.0 60.0A 95 8.8 18.5 12.4 14.3 68.8 40.8 72.1 58.5B 94 13.8 29.0 20.9 38.2 86.2 71.1 78.3 61.5B 95 27.9 25.0 16.5 38.5 72.1 75.0 83.5 61.4C 15.6 — 20.1 22.8 51.1 — 57.6 38.1D 100.0 — 80.6 83.8 0.0 — 0.6 0.1E 97.3 99.5 100.0 98.1 2.7 0.0 0.0 1.2F 97.7 — 84.9 96.5 2.3 — 15.1 2.7G 100.0 — 98.3 97.7 0.0 — 0.0 0.1H 96.4 99.0 100.0 98.9 0.0 0.7 0.0 0.7
aOther career academies or magnet programs.
reasonably argue that the first effect on career academy students’ performancewould be in reduced absenteeism (cf. Stern et al. 1988, 1989)—our first dependent(or outcome) variable. If absenteeism is reduced, we might also expect thatclassroom performance will improve simply as a result of increased time spent inthe classroom. Therefore, we included a direct measure of classroomperformance—GPA—as a second dependent variable. However, increasesobserved in grades could also be attributable to lenient grading practices ofJROTCCA program teachers, if in fact these teachers consistently grade moreleniently than those in other academic programs. While the potential for this
9
cannot be discounted, and we have no data with which to examine this issue, asimilar argument for bias in grades could be applied to any special academicprogram. Finally, since we are primarily interested in investigating whether theJROTC Career Academy programs keep students in school and increase theirprobability of graduating—the primary purpose of career academies—weinclude graduation as our third outcome variable (although graduation data wereavailable only for one analytic group at each of two sites). These were the threedependent variables in multiple regression equations using the followingindependent or explanatory variables:4
• GPA: Four-point grade point average during the current year.
• Absences: The square root of the proportion of enrolled days not attendedduring the current year. This somewhat unintuitive transformation of theattendance variable was necessary to approximate the normal distributionassumed for the analyses because the distribution of absences themselves ishighly skewed, with most students having a low rate of absences.
• Graduation: A multinomial outcome variable with five categories: (1) lossfrom the school district or failure to graduate, (2) known graduation fromanother high school but without GPA information, (3) graduation from theprogram or comparison high school with a GPA less than 2.0, (4) graduationfrom the program or comparison high school with a GPA between 2.0 and3.0, and (5) graduation from the program or comparison high school with aGPA greater than 3.0.
Independent Variables
Students in the 16 schools in our sample were enrolled in a number of relativelydistinct programs that we were able to identify in our data. We categorizedstudents into one of four program groups using late fall of the freshman year(ninth-grade sample) and late fall of the sophomore year (tenth-grade sample) asthe date on which program enrollment status was determined. Our categorieswere (1) students enrolled in the JROTC Career Academy (treatment schoolsonly), (2) students enrolled in other academy or magnet programs (sometreatment and control schools), (3) students not enrolled in any academy ormagnet program but enrolled in a regular JROTC program (all treatment and
_________________4While a measure of “dropping out” prior to graduation would be an important outcome to
consider, data regarding this outcome were of poor quality. Dropout measures required activenotification of the school of the decision to dropout, resulting in severe underestimates of the actualdropout rate. For two sites, it was possible to determine whether students remained enrolled in anyschool in the district represented by these sites; the “graduation” variable makes use of these data.
10
control schools), and (4) students not enrolled in any special programs (alltreatment and control schools). This classification allows each program to becompared with a general academic program (those in no special program) andallows for the programs to be compared with one another. The varied nature ofthe occupational focuses of the academies in our sample precluded analysesbased on occupational focus.
We also included a set of demographic and standardized achievement measurevariables in our analyses: (1) race/ethnicity, (2) gender, (3) school in whichenrolled, (4) student cohort school-year (1994–1995, 1995–1996, etc.), (5) a mathpercentile score from a standardized achievement test, (6) a reading percentilescore from a standardized achievement test, and (7) an indicator variableidentifying whether a student had standardized test scores available. The lastvariable was needed because standardized test scores were unavailable for 35percent of all students.
A detailed description of all variables follows:
Independent Variables List
• Program: Three dummy variables identify the four mutually exclusive schoolprogram categories:— JROTCCA: JROTC Career Academy enrollees.— Magnet: Magnet and/or enrollees in other career academy programs.— JROTC: Enrollees in a regular non–career academy JROTC program.— Students not enrolled in any of the above programs.
Demographic Variables and Test-Score Variables
• Race/ethnicity (dummy coded): African American, white, Asian American,Hispanic (omitted). For purposes of analysis, the Native Americans (29 total)were coded as Hispanic, and Filipinos (80 total) and Pacific Islanders (8 total)were coded as Asian American.
• Male gender: (Female omitted).
• Cohort (dummy coded): (Earliest cohort omitted).
• Intervention school: An indicator equal to one for students enrolled in schoolswith the JROTC Career Academy program; zero otherwise.
• Math percentile: National percentile of last math achievement test score priorto cohort year.
• Reading percentile: National percentile of last reading achievement test scoreprior to cohort year.
11
• Test scores unavailable: An indicator equal to one for students for whom therewas no achievement test score prior to the cohort year; zero otherwise.
• Prior absences: The square root of the proportion of enrolled days notattended in the prior year.
• Prior GPA: Four-point GPA for courses passed in prior year.
• Prior credits attempted: Credits attempted in prior year.
• Prior credits earned: Proportion of attempted credits in prior year that wereearned (passed).
Adjustment for Selection Effects
A major threat to the validity of nonexperimental research is from selectioneffects. Students in the JROTC Career Academies either self-selected into theprogram or were placed into the program by parents or guidance counselors forany number of reasons. Selection effects make it difficult to discern whetherobserved differences in performance are the result of pre-intervention differencesin the groups being compared or whether they are attributable to the effect of thetreatment. Experimental designs that include random assignment to conditionseliminate this problem by ensuring that groups are not systematically differentprior to treatment. To minimize potential bias from selection effects, we usedpropensity weighting (see Rosenbaum and Rubin, 1983; Hirano, Imbens, andRidder, 2000).
Propensity weighting is a technique that attempts to weight the samples fromeach of several groups in such a way that they resemble the sample in aparticular group of interest. Propensity weights are simply weights that areproportionate to the predicted odds of a given student being selected into aparticular program group (here the odds of a student being selected into theJROTC Career Academy program). In this way, higher weights are produced forstudents most like those who were selected into the JROTC Career Academy. Astudent very different from those who actually were selected into the JROTCCareer Academy would receive a weight near zero in the analyses and wouldhave very little influence on results. These predicted probabilities are typicallygenerated from a multiple logistic regression model that predicts the event ofselection into the program of interest (i.e., the JROTC Career Academy) for thepopulation of all students who might have selected into the program, usingstudent characteristics that were measured prior to that selection.
By using propensity weights, we attempt to reproduce in the other programgroups the selection process that actually occurred in the program group of
12
interest (i.e., JROTC Career Academy students), thus enabling us to answer thequestion, “What would have happened to the same students who were selectedinto the JROTC Career Academies if they were enrolled instead in another careeracademy or magnet program, a regular JROTC program, or in a generalacademic program in these schools?”5 In our analyses, we use propensityweights to model the selection of students into the JROTC Career Academyprogram, thus weighting the students within other programs in such a way thatthey resemble those students who entered the JROTC Career Academy program.These propensity weights were then used as analytic weights in our regressionequations comparing programs. Thus, our results can be interpreted as reflectinghow the students enrolled in a JROTC Career Academy would have been expected
to perform if they had been enrolled in another program or in no specific programat all.
Although all JROTC Career Academy sites were given the same generalguidance to target “at-risk” students, it is quite possible that the selectionmechanisms differed across sites in practice. For this reason, we felt it importantto model selection separately for each site, and potentially for different cohortswithin a site. For sites with multiple cohorts, we initially estimated selectionseparately for the cohorts within a site, then pooled cohorts for efficiency inestimation if there was no statistically significant evidence of differences incoefficients between the cohort models, using an omnibus test at α = 0.05. Asdiscussed earlier, there was evidence of different selection processes by cohortsat two of the eight sites. As a result, ten analytic groups were created.
Comparison schools were within the same district as each JROTCCA school andwere selected by district officials as the school most similar in studentcomposition to the JROTCCA school. Because of this similarity, it is reasonableto assume that the students in the two schools at a given site came from the samegeneral population and therefore were all eligible for JROTC Career Academyentry prior to assignment to a particular school within the pair. For this reason,the multiple logistic regression models predict selection into the JROTC CareerAcademy from all of the demographic and academic variables available for thesite except for the intervention-school variable.
_________________5It should be noted that only observed differences and differences correlated with observed
differences can be accounted for by this method.
13
3. Results
Propensity Weighting Models
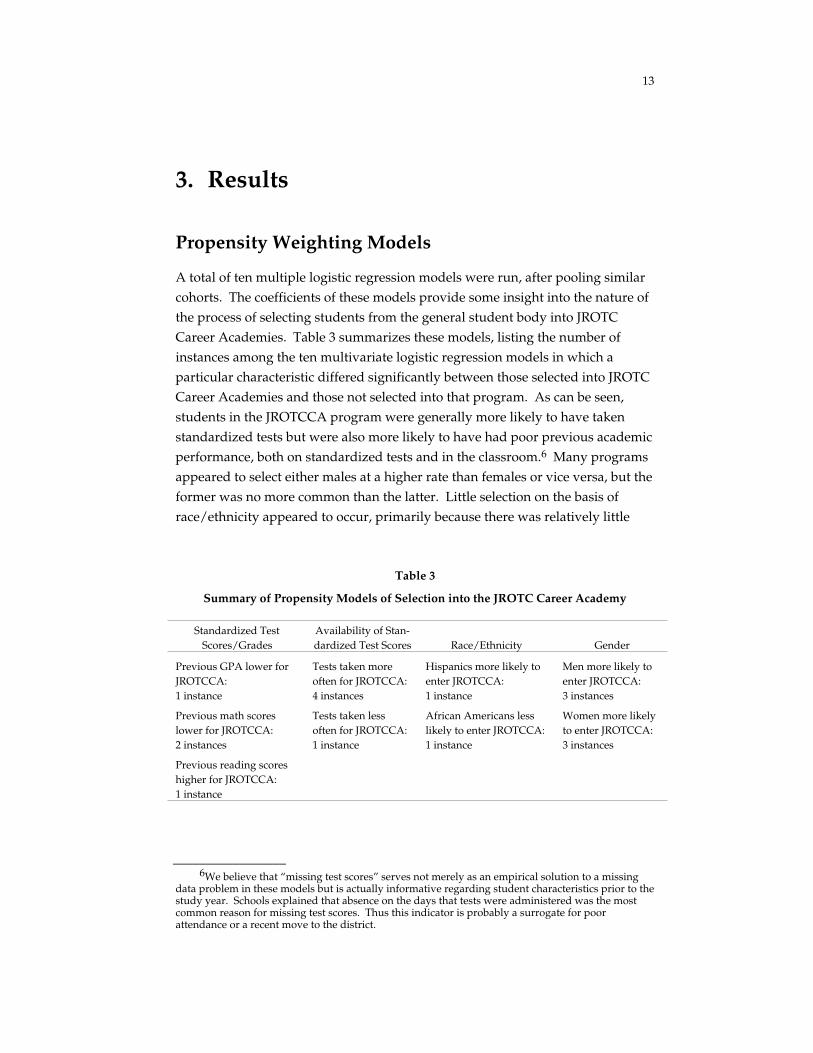
A total of ten multiple logistic regression models were run, after pooling similarcohorts. The coefficients of these models provide some insight into the nature ofthe process of selecting students from the general student body into JROTCCareer Academies. Table 3 summarizes these models, listing the number ofinstances among the ten multivariate logistic regression models in which aparticular characteristic differed significantly between those selected into JROTCCareer Academies and those not selected into that program. As can be seen,students in the JROTCCA program were generally more likely to have takenstandardized tests but were also more likely to have had poor previous academicperformance, both on standardized tests and in the classroom.6 Many programsappeared to select either males at a higher rate than females or vice versa, but theformer was no more common than the latter. Little selection on the basis ofrace/ethnicity appeared to occur, primarily because there was relatively little
Table 3
Summary of Propensity Models of Selection into the JROTC Career Academy
Standardized TestScores/Grades
Availability of Stan-dardized Test Scores Race/Ethnicity Gender
Previous GPA lower forJROTCCA:1 instance
Tests taken moreoften for JROTCCA:4 instances
Hispanics more likely toenter JROTCCA:1 instance
Men more likely toenter JROTCCA:3 instances
Previous math scoreslower for JROTCCA:2 instances
Tests taken lessoften for JROTCCA:1 instance
African Americans lesslikely to enter JROTCCA:1 instance
Women more likelyto enter JROTCCA:3 instances
Previous reading scoreshigher for JROTCCA:1 instance
_________________6We believe that “missing test scores” serves not merely as an empirical solution to a missing
data problem in these models but is actually informative regarding student characteristics prior to thestudy year. Schools explained that absence on the days that tests were administered was the mostcommon reason for missing test scores. Thus this indicator is probably a surrogate for poorattendance or a recent move to the district.
14
racial/ethnic heterogeneity at many of the sites. All effects reported asstatistically significant (both here and elsewhere in this report) are significant atthe 0.05 level of significance with a two-sided test, after adjustment for designeffects due to weighting.
Outcome Models
For the outcomes of GPA and absenteeism, propensity-weighted ordinary-least-square-regression models were fit for each of the ten analytic groups that wereused in the propensity modeling. For the graduation outcome, similarpropensity-weighted multinomial regression models were fit for the two analyticgroups among the above ten for which graduation data were available. Programdummies, an intervention school dummy, and cohort dummies7 (when multiplecohorts were pooled) were the independent variables used. This specificationallowed us to estimate the absenteeism, GPA, and graduation rates that thestudents in the JROTCCA program would have had in each of the otherprograms, including the general academic program. The specification alsoallowed different intercepts by school and cohort within each analytic group.8
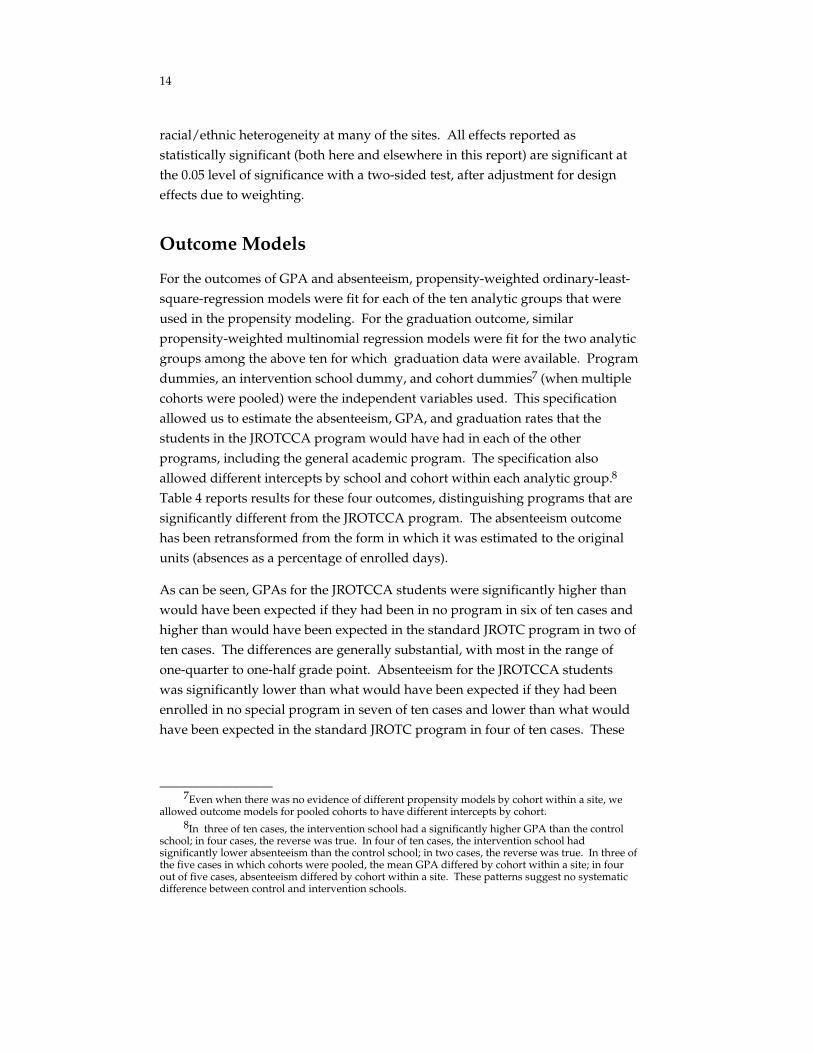
Table 4 reports results for these four outcomes, distinguishing programs that aresignificantly different from the JROTCCA program. The absenteeism outcomehas been retransformed from the form in which it was estimated to the originalunits (absences as a percentage of enrolled days).
As can be seen, GPAs for the JROTCCA students were significantly higher thanwould have been expected if they had been in no program in six of ten cases andhigher than would have been expected in the standard JROTC program in two often cases. The differences are generally substantial, with most in the range ofone-quarter to one-half grade point. Absenteeism for the JROTCCA studentswas significantly lower than what would have been expected if they had beenenrolled in no special program in seven of ten cases and lower than what wouldhave been expected in the standard JROTC program in four of ten cases. These
_________________7Even when there was no evidence of different propensity models by cohort within a site, we
allowed outcome models for pooled cohorts to have different intercepts by cohort.8In three of ten cases, the intervention school had a significantly higher GPA than the control
school; in four cases, the reverse was true. In four of ten cases, the intervention school hadsignificantly lower absenteeism than the control school; in two cases, the reverse was true. In three ofthe five cases in which cohorts were pooled, the mean GPA differed by cohort within a site; in fourout of five cases, absenteeism differed by cohort within a site. These patterns suggest no systematicdifference between control and intervention schools.
15
Table 4
GPA and Absenteeism Outcomes by Analytic Group, Adjusted for JROTC CareerAcademy Student Mix
Selection-Adjusted Mean GPA Selection-Adjusted Absenteeism
AnalyticGroup JROTCCA
OtherCA/Maga JROTC
GeneralAcademicProgram JROTCCA
OtherCA/Maga JROTC
GeneralAcademicProgram
A 94 1.58 2.37* 1.21* 1.43* 9% 7% 22%* 18%*A 95 1.87 1.64* 1.65* 1.44* 6% 12%* 14%* 16%*B 94 1.54 2.28 1.58 1.37* 19% 12%* 21% 28%*B 95 1.60 2.64 1.69 1.47 18% 9%* 19% 23%C 1.90 — 1.81 1.77 8% — 12%* 10%D 1.23 — 1.26 0.93* 15% — 21%* 33%*E 1.15 1.25 0.95 0.99 28% 32% 30% 43%*F 2.41 — 1.90 1.93* 3% — 15% 13%*G 1.54 — 1.27 1.10* 22% — 21% 30%H 1.37 1.36 1.18 1.12 21% 24% 26% 40%*
*Entries differ from the JROTCCA at p < 0.05.aOther career academies or magnet programs.
differences were even more dramatic, with absenteeism less than half of whatwould have been expected in many cases. Comparisons with the magnets andother career academies in the six cases where they existed were generally evenlymixed. Taken together, these results suggest that in a majority of analytic groups(and sites), JROTCCA students performed better both in terms of GPA andabsenteeism than similar students who were not in special programs. In about athird of the cases, students performed better than similar students in standardJROTC programs, suggesting some additional benefit from the career academycomponent. In general, improvements in attendance were more dramatic thanimprovements in GPA.
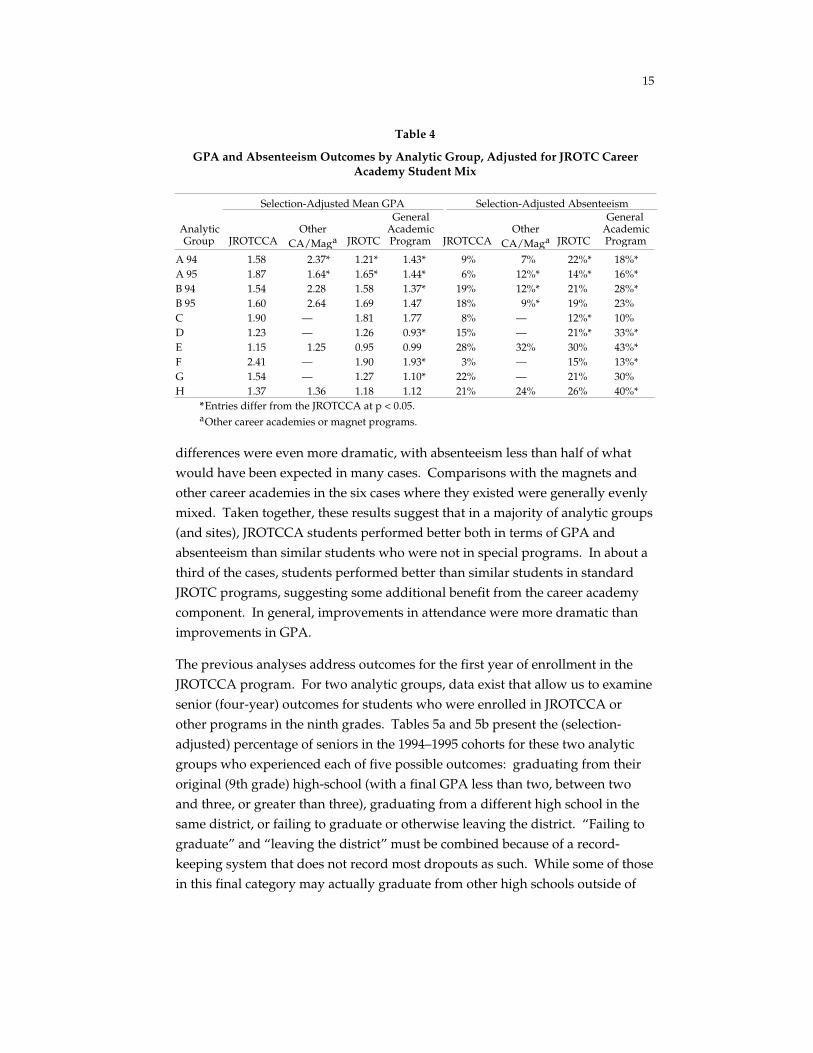
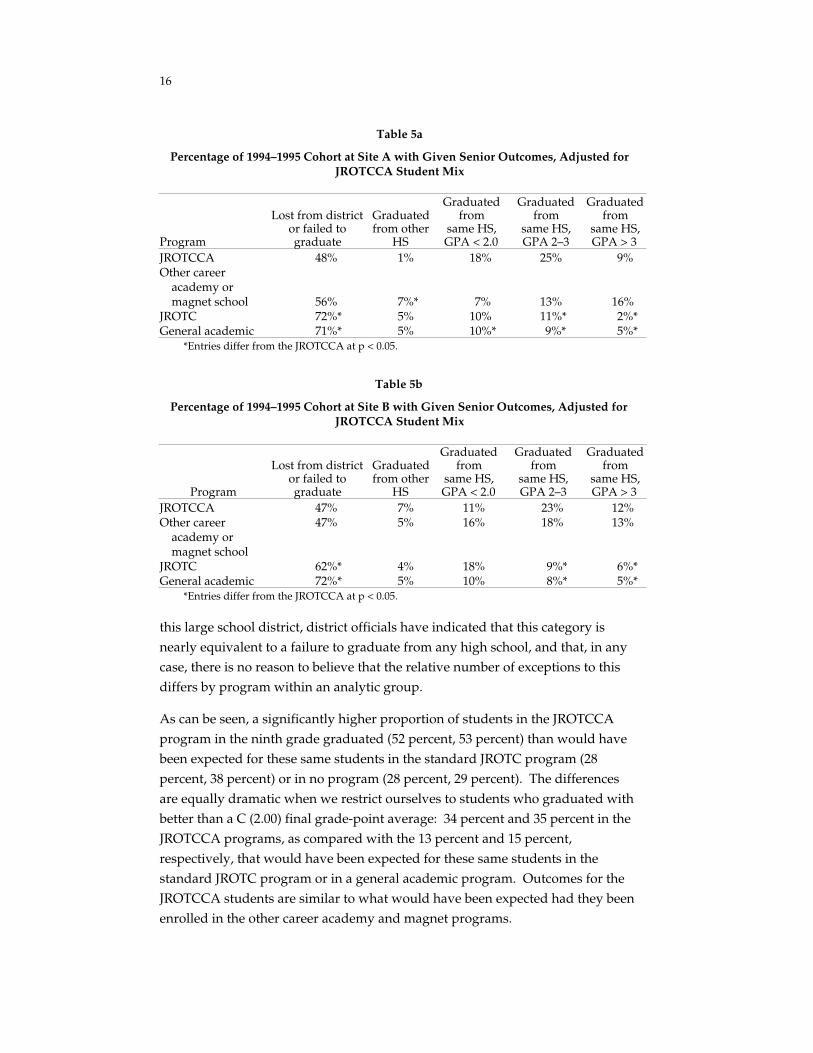
The previous analyses address outcomes for the first year of enrollment in theJROTCCA program. For two analytic groups, data exist that allow us to examinesenior (four-year) outcomes for students who were enrolled in JROTCCA orother programs in the ninth grades. Tables 5a and 5b present the (selection-adjusted) percentage of seniors in the 1994–1995 cohorts for these two analyticgroups who experienced each of five possible outcomes: graduating from theiroriginal (9th grade) high-school (with a final GPA less than two, between twoand three, or greater than three), graduating from a different high school in thesame district, or failing to graduate or otherwise leaving the district. “Failing tograduate” and “leaving the district” must be combined because of a record-keeping system that does not record most dropouts as such. While some of thosein this final category may actually graduate from other high schools outside of
16
Table 5a
Percentage of 1994–1995 Cohort at Site A with Given Senior Outcomes, Adjusted forJROTCCA Student Mix
Program
Lost from districtor failed tograduate
Graduatedfrom other
HS
Graduatedfrom
same HS,GPA < 2.0
Graduatedfrom
same HS,GPA 2–3
Graduatedfrom
same HS,GPA > 3
JROTCCA 48% 1% 18% 25% 9%Other career
academy ormagnet school 56% 7%* 7% 13% 16%
JROTC 72%* 5% 10% 11%* 2%*General academic 71%* 5% 10%* 9%* 5%*
*Entries differ from the JROTCCA at p < 0.05.
Table 5b
Percentage of 1994–1995 Cohort at Site B with Given Senior Outcomes, Adjusted forJROTCCA Student Mix
Program
Lost from districtor failed tograduate
Graduatedfrom other
HS
Graduatedfrom
same HS,GPA < 2.0
Graduatedfrom
same HS,GPA 2–3
Graduatedfrom
same HS,GPA > 3
JROTCCA 47% 7% 11% 23% 12%Other career
academy ormagnet school
47% 5% 16% 18% 13%
JROTC 62%* 4% 18% 9%* 6%*General academic 72%* 5% 10% 8%* 5%*
*Entries differ from the JROTCCA at p < 0.05.
this large school district, district officials have indicated that this category isnearly equivalent to a failure to graduate from any high school, and that, in anycase, there is no reason to believe that the relative number of exceptions to thisdiffers by program within an analytic group.
As can be seen, a significantly higher proportion of students in the JROTCCAprogram in the ninth grade graduated (52 percent, 53 percent) than would havebeen expected for these same students in the standard JROTC program (28percent, 38 percent) or in no program (28 percent, 29 percent). The differencesare equally dramatic when we restrict ourselves to students who graduated withbetter than a C (2.00) final grade-point average: 34 percent and 35 percent in theJROTCCA programs, as compared with the 13 percent and 15 percent,respectively, that would have been expected for these same students in thestandard JROTC program or in a general academic program. Outcomes for theJROTCCA students are similar to what would have been expected had they beenenrolled in the other career academy and magnet programs.
17
4. Discussion
Our results provide substantial evidence of the efficacy of the JROTC CareerAcademies for improving attendance, grades, and graduation rates among at-risk students relative to students who were in the general academic program orin the standard JROTC program. The small differences in student outcomesbetween the JROTCCA program and the other magnet or career academyprograms are difficult to interpret conclusively. One simple explanation mightbe that these latter programs are similar in effectiveness to the JROTCCAprogram. On the other hand, since these other magnet and career academyprograms have a very different selection process than the JROTCCAprogram—generally selecting the most academically promising students, ratherthan the least promising—students in magnet programs may benefit frompositive “context effects” from the atmosphere of other high-achieving students.9
Bearing this in mind, the modeling of selection may not fully account for theadvantages present in magnet and other career academy programs. If so, theJROTCCA programs may actually be more effective than these programs.
Compared with similar students in general academic programs in these schools,the JROTCCA program appears to have increased attendance by approximately10–20 percentage points. In a normal school year with 180 days, this means thatstudents in the JROTC Career Academies had from three to seven additionalweeks of classroom instruction. It is perhaps not surprising that their grades andgraduation rates increased as a result.10 The conclusion that JROTC CareerAcademies have a strong effect on attendance and graduation, and a weaker,perhaps indirect effect on grades is consistent with a recent large-scale study ofcareer academies using random assignment by the Manpower DemonstrationResearch Corporation (Kemple and Snipes, 2000).
But what is it about a career academy that draws students to school? Littleattention in the literature has been paid to understanding the mechanisms thataccount for the effectiveness of academies. Stern et al. (1988, 1989) suggest that
_________________9Although these results are not reported here, students in the other career academy and magnet
programs had statistically significantly higher prior academic performance (i.e., GPA andstandardized test scores) than students in the general academic programs for a majority of analyticgroups.
10Additional analyses by the authors demonstrated that, after controlling for attendance,observed differences between the JROTC Career Academies and the general academic program ingrade-point average were no longer statistically significant, and approached zero in magnitude.
18
the positive effects of career academies arise from their vocational educationcomponent, and the 1988 study emphasized the importance of the vocationalcomponent of career academies for keeping students in school; undoubtedlysome of the students who enroll in vocational classes might not remain in schoolif vocational classes were not offered.
Our experience, however, suggests an additional explanation. In a report on theimplementation of the JROTC Career Academies, Hanser and Robyn (2000, p. 33)noted:
All sites [JROTCCA schools] established an identifiable core of teachersand students distinct from the rest of the school in their first year ofimplementation. In each school, a group of teachers reported that theyidentified themselves with the academy, regardless of whether they hadclasses containing purely academy students. They knew who the academystudents were, shared information about them, and intensively trackedstudents’ absences and behavior—more so than is done for other studentsin the school.
Even more than the teachers, the students identified themselves as being ina special program. In focus groups at several sites [JROTCCA schools],students described the academy as “one big family.” At all sites, theyknew teachers were sharing information about them and that teacherscared about their progress and development. Students saw the academy asdifferent because of the increased attention they received both in and outof the classroom. For example, during focus groups students reported:
“They [teachers] call [home] not just for bad, but if you’redoing good.” “You get more help here.” “The teacherscare.” “The teachers take time out to talk to you instead ofsending you to the office automatically.” “This year, I’mgetting better grades and hanging with a different crowd.They keep me out of trouble. I’m more respectful with myparents.” “You see everybody [other academy students] allthe time.” “Someone cares enough to call home if you’re notthere.” “They teach you responsible things. I got likeaddicted to it.”
Indeed, the major factor that students in focus groups mentioned was thenurturing environment the academy afforded them, and not the future jobprospects that they envisioned as a result of the career focus of the academy.Although vocational classes that are part of career academies have the potentialto motivate students by creating opportunities for success in schoolwork thatsome students might not otherwise have, and they may also increase therelevance of school to students’ community and future, it is the human climate ofcaring and support (see McPartland’s fourfold typology discussed earlier) thatappears to be the heart of the JROTC Career Academy success.
19
References
Academy for Educational Development. (1990). Employment and EducationalExperiences of Academy of Finance Graduates. New York: Academy forEducational Development.
California Department of Education. (1994). California Partnership AcademiesHandbook: A Guide to Success. Sacramento, CA.
Dayton, C., and Stern, D. (1990). Graduate Follow-Up Survey of the June 1988Graduates of the California Partnership Academies, Policy Paper No. 90-1-1.Berkeley, CA: Policy Analysis for California Education.
Dayton, C., Weisberg, A., and Stern, D. (1989). California Partnership Academies:1987–88 Evaluation Report, Policy Paper No. 89-9-1. Berkeley, CA: PolicyAnalysis for California Education.
Dayton, C., Weisberg, A., Stern, D., and Evans, J. (1988). Peninsula AcademiesReplications: 1986–87 Evaluation Report, Policy Paper No. PP88-4-3. Berkeley,CA: Policy Analysis for California Education.
Guthrie, L. F., Guthrie, G. P., and van Heusden, S. (1990). Providing Options forAt-Risk Youth: The Health and Media Academies in Oakland. Final Report. SanFrancisco: Far West Laboratories for Educational Research and Development.
Hanser, L. M. and Elliott, M. N. (1997). Preliminary Survey Results from theJROTC Career Academies. Unpublished manuscript.
Hanser, L. M. and Robyn, A. E. (2000). Implementing High School JROTC CareerAcademies (MR-741-OSD). Santa Monica, CA: RAND.
Hirano, K., Imbens, G.W., and Ridder, G. (2000). Estimation of Average TreatmentEffects Using the Estimated Propensity Score, NBER Technical Working Paper.
Kemple, J. J. and Rock, J. L. (1996). Career Academies: Early ImplementationLessons from a 10-Site Evaluation. New York: Manpower DemonstrationResearch Corporation.
Kemple, J. J. and Snipes, J. C. (2000). Career Academies: Impacts on Students’Engagement and Performance in High School. New York: ManpowerDemonstration Research Corporation.
McPartland, J. M. (1994). “Dropout Prevention in Theory and Practice.” In R. J.Rossi (Ed.), Schools and Students at Risk: Context and Framework for PositiveChange (pp. 255–276). New York: Teachers College Press.
Reller, D. J. (1984). The Peninsula Academies: Final Technical Evaluation Report.Palo Alto, CA: American Institutes for Research in the Behavioral Sciences.
20
Reller, D. J. (1985). The Peninsula Academies, Interim Evaluation Report, 1984-85School Year. Palo Alto, CA: American Institutes for Research in the BehavioralSciences.
Reller, D. J. (1987). A Longitudinal Study of the Graduates of the PeninsulaAcademies: Final Report. Palo Alto, CA: American Institutes for Research inthe Behavioral Sciences.
Robyn, A. E., and Hanser, L. M. (1995). JROTC Career Academies’ Guidebook:With Materials from the California Partnership Academies Handbook: A Guide toSuccess (MR-573-OSD). Santa Monica, CA: RAND.
Rosenbaum, P.R., and Rubin, D.R. (1983). “The Central Role of the PropensityScore in Observational Studies for Causal Effects.” Biometrika, Vol. 70, pp.41–55.
Snyder, P., and McMullan, B. J. (1987). Allies in Education: A Profile ofPhiladelphia High School Academies, Philadelphia, Pennsylvania. Philadelphia:Public/Private Ventures.
Stern, D., Dayton, C., Il-Woo, P., Weisberg, A., and Evans, J. (1988). “CombiningAcademic and Vocational Courses in an Integrated Program to Reduce HighSchool Dropout Rates: Second-Year Results from Replications of theCalifornia Peninsula Academies.” Educational Evaluation and Policy Analysis,Vol. 10, pp. 161–170.
Stern, D., Dayton, C., Paik, I., and Weisberg, A. (1989). “Benefits and Costs ofDropout Prevention in a High School Program Combining Academic andVocational Education: Third-Year Results from Replications of the CaliforniaPeninsula Academies.” Educational Evaluation and Policy Analysis, Vol. 11, pp.405–416.
Stern, D., Raby M., and Dayton, C., (1992). Career Academies: Partnerships forReconstructing American High Schools. San Francisco, CA: Jossey-BassPublishers.