Evidence from China - World Bank · Evidence from China* ... - Could establish branches of custom...
24
Policy Research Working Paper 7193 Empowering Cities: Good for Growth? Evidence from China T. Juni Zhu Megha Mukim Trade and Competitiveness Global Practice Group & Social, Urban, Rural and Resilience Global Practice Group February 2015 WPS7193 Public Disclosure Authorized Public Disclosure Authorized Public Disclosure Authorized Public Disclosure Authorized Public Disclosure Authorized Public Disclosure Authorized Public Disclosure Authorized Public Disclosure Authorized
Transcript of Evidence from China - World Bank · Evidence from China* ... - Could establish branches of custom...
Policy Research Working Paper 7193
Empowering Cities: Good for Growth?
Evidence from China
T. Juni Zhu Megha Mukim
Trade and Competitiveness Global Practice Group &Social, Urban, Rural and Resilience Global Practice GroupFebruary 2015
WPS7193P
ublic
Dis
clos
ure
Aut
horiz
edP
ublic
Dis
clos
ure
Aut
horiz
edP
ublic
Dis
clos
ure
Aut
horiz
edP
ublic
Dis
clos
ure
Aut
horiz
edP
ublic
Dis
clos
ure
Aut
horiz
edP
ublic
Dis
clos
ure
Aut
horiz
edP
ublic
Dis
clos
ure
Aut
horiz
edP
ublic
Dis
clos
ure
Aut
horiz
ed

Produced by the Research Support Team
Abstract
The Policy Research Working Paper Series disseminates the findings of work in progress to encourage the exchange of ideas about development issues. An objective of the series is to get the findings out quickly, even if the presentations are less than fully polished. The papers carry the names of the authors and should be cited accordingly. The findings, interpretations, and conclusions expressed in this paper are entirely those of the authors. They do not necessarily represent the views of the International Bank for Reconstruction and Development/World Bank and its affiliated organizations, or those of the Executive Directors of the World Bank or the governments they represent.
Policy Research Working Paper 7193
This paper is a product of the Trade and Competitiveness Global Practice Group and the Social, Urban, Rural and Resilience Global Practice Group. It is part of a larger effort by the World Bank to provide open access to its research and make a contribution to development policy discussions around the world. Policy Research Working Papers are also posted on the Web at http://econ.worldbank.org. The authors may be contacted at [email protected].
This paper utilizes a countrywide, county-to-city upgrade in the 1990s to identify whether extending the powers of urban local governments leads to better firm outcomes. The paper hypothesizes that since local leaders in newly-promoted cities have an incentive to utilize their new administrative remit to maximize gross domestic product and employment growth, there should be improvements in economic out-comes. The analysis finds that aggregate firm-level outcomes do not necessarily improve after county-to-city graduation. However, it does find that state-owned enterprises perform better post-graduation, with increased access to credit
through state-owned banks as a possible explanation for the improvement in performance. The most important finding is that newly-promoted cities with high capacity generally produce better aggregate firm outcomes compared with newly-promoted cities with low capacity. The conclusions are twofold. First, in terms of access to credit, the paper provides evidence that relaxing credit constraints for firms could lead to large increases in firm operation and employ-ment. Second, increasing local government’s administrative remit is not enough to lead to better firm and economic outcomes; local capacity is of paramount importance.
Empowering Cities: Good for Growth?
Evidence from China*
T. Juni Zhu and Megha Mukim†
Keywords: Urbanization, Decentralization, Credit allocation, Capacity, Firm-level data, China
JEL Classification: G21, H81, L11, R11, R51
* The authors are grateful to several World Bank Group staff who contributed their time generously to this
paper, providing feedback, comments and suggestions – Stefano Negri, Bob Rijkers, Ana Aguilera, Leo
Iacavone and Bilal Zia. Ritam Chaurey worked side-by-side with us and provided constructive and timely
comments at every stage of the process. The authors received constructive feedback from seminar
participants in Washington DC and in Beijing, including Bert Hofman, Paul Procee, Karlis Smits, Min
Zhao, Shahid Yusuf, David Robalino, David Mason, Chandan Deuskar, and Guilherme Lichand. And
finally, we are extremely grateful to Xiaobo Zhang (IFPRI) and Lixing Li (Peking University) for
providing us access to data, for answering many, many questions and for their feedback. Funding from
the Competitive Industries and Innovation Program is very gratefully acknowledged. † T. Juni Zhu is a consultant (Economist) with the Competitive Cities Knowledge Base (CCKB) project.
Megha Mukim is an Economist and TTL of the CCKB Project. CCKB is a joint-collaboration between
the Trade & Competitiveness GP and the Social, Urban, Rural and Resilience GP.

2
1 Introduction
In an effort to promote urbanization, the Chinese government began to upgrade counties to become
county-level cities between the 1980s and up until 1997. Counties were eligible to graduate into
county-cities if they met certain minimum requirements (Ministry of Civil Affairs, 1993). An
English version of this policy document can be found in Zhang and Zhao (1998). To become cities,
counties needed to show that (1) their levels of industrialization were above certain thresholds, (2)
the share of population engaged in non-agricultural activities was above a certain threshold, and
(3) its fiscal status (as measured by total fiscal revenues and per-capita fiscal revenue) were in
good shape – see Table 1 for the full list (taken from Fan, Li, & Zhang, 2012).
Table 1: County to county-level-city minimum upgrading requirements
Population Density (person/km2) >400 100-400 <100
Percentage of
counties in this
category
25% 45% 30%
Industrialization
level
Industrial output (yuan) 1.5 billon 1.2 billion 0.8 billion
Share of industrial output value
in gross value of industrial and
agricultural output
80% 70% 60%
Population engages
in non-agricultural
activities
Size of non-agricultural
population
150 K 120 K 100 K
Share of non-agricultural
population in total population
30% 25% 20%
Fiscal Strength Fiscal revenue (yuan) 60 million 50 million 40 million
Per capita fiscal revenue (yuan) 100 80 60
In reality, these three requirements were not strictly enforced, partly because of large regional
disparities across the country, wherein even after accounting for factors such as population density,
counties in western and inland regions would still have trouble meeting these requirements.
Instead, it seems that the decision to upgrade a county to a county-level city was based on rates of
economic growth as well as the central government’s discretion (Li, 2011). Thus, this led to a
situation where counties that did not meet any of the three requirements were upgraded, while
some counties that met all three requirements were not upgraded – see Table 2 (taken from Fan,
Li, & Zhang, 2012).

3
Table 2: County to county-level-city upgrade
Number of county-year observations by upgrading status and number of requirements satisfied
(1994-1997)
Number of requirements satisfied Total 0 1 2 3
Non-upgrading cases 6401 4583 1317 465 36
Upgrading cases 99 24 30 39 6
Graduation into city status came with a number of benefits, relating to four main categories: (1)
tax and fees, (2) land-related policies, (3) administrative powers, and (4) local government size,
rank, salary and reputation - see Table 3 (taken from Fan, Li, & Zhang, 2012).
Table 3: Benefits of being a city: An incomplete list
Category Benefits
Tax and fees - Cities enjoyed a higher urban construction tax (7%
compared to 5% for counties).
- Could collect the surcharges levied on the issuing of
motorcycle registration.
- In Liaoning province, cities could get 1-2 million additional
subsidies each year after upgrading.
Land-related policies - Cities generally convert more land to construction use and
retain a larger share of revenue from land sale.
Administrative powers - Cities have more authority on foreign trade and exchange
management.
- Could establish branches of custom and large state-owned
banks.
- Could approve projects with a higher investment cap.
- Gain authority over police recruitment and vehicle
administration.
- After achieving the status of “line item under province”
(Shengji Jihua Dalie), cities could report directly to the
provincial administration to ask for investment projects.
Government size; Rank and
salary; Reputation
- Cities could establish more branches of government and
have a larger number of government employees.
- Sometimes the bureaucratic rank and salary of officials are
raised after upgrading.
- Cities generally carry greater prestige and are more
attractive to investors from outside.
In this paper, we investigate if newly-promoted county-level cities in China utilize these new
powers to attract new firms and help firms grow. We study macro-level city outcomes and micro-

4
level firm outcomes. We hypothesize that since local government officials wanted to achieve high
GDP and employment growth, they would have an incentive to utilize their new administrative
remit to promote firm growth and hence we should observe better firm-level outcomes in the newly
upgraded cities versus their similar counties. We exploit the ad hoc nature in which the county-
upgrading takes place to identify the effect of an increase in city powers on firms’ economic
outcomes. The paper adds to the existing literature in two ways – it identifies whether and to what
extent firm-level outcomes improve post-upgrading, and importantly, it attempts to identify the
channels through which these outcomes take place. In addition, this paper uses two proxies to
measure local government capacity and documents the extent to which local government capacity
matters for firm and job growth in China. The rest of the paper is organized as follows. Section
2 describes the data sets and how these were prepared. Section 3 presents the empirical strategy
used to identify the effects of city-upgrading on firm outcomes. Section 4 reports the econometric
results for city-level outcomes and firm-level outcomes and Section 5 concludes.
2 Data Sets and Data Treatment
This paper utilizes two panel data sets, one at the level of counties and the other at the level of
firms. We use variables from 1993 to 2004 from the annual series of the Public Finance Statistical
Materials of Prefectures, Cities, and Counties published by the Ministry of Finance of China to
construct a county-level public finance data set (henceforth public finance data set). As of 1998,
when the policy of county-to-city upgrading had come to an end, there were 99 counties that were
upgraded from counties to county-level cities between 1994 and 1997.
The firm-level data set spans from 1998 to 2009 and is compiled from the Annual Survey of
Industrial Firms (ASIF) collected by the National Bureau of Statistics of China. This data set is
often referred to as the 5 Million RMB data set, since it contains non-SOE firms with main
operating revenue (i.e., sales) of more than five million RMB, and all state-owned enterprises
(SOEs) regardless of sales volume. Thus, the ASIF survey data set tracks the performance of all
SOEs and all big non-SOEs. The ASIF data set details all operational, financial, and managerial
facts of firms in three broad categories: (1) mining, (2) manufacturing, and (3) production and
distribution of electricity, gas, and water, and classifies each firm to 6-digit sub-industries.
Compared with the 2004 China Economic Census, the firms covered by this data set represented
89.5% of the total main operating revenue (sales) from all enterprises in China (Nie, Jiang, & Yang,
2012).
The 1998-2009 ASIF data set covers a period when some major structural reforms happened in
China, such as the SOE reform in the mid-to-late 1990s. Following the end of the county-to-city
upgrading policy in 1997, China carried out a major reform of SOEs between 1998 and 2000. The
aim of the reform was to privatize or close down small and unprofitable SOEs (Song and Hsieh,
2013). In 2004, an economic census covering all firms regardless of size was carried out and more
detailed information on firms was collected.1 To mitigate the effects of the above SOE changes,
and since we are only interested in understanding the effect of county-to-city upgrading, we restrict
1 For example, in this year, breakdown of employment by education level, gender, technical titles was
collected (Brandt, Van Biesebroeck, & Zhang, 2014).

5
our analysis to incumbents from 1998 to 2004, hence excluding all new firm entries and exits. We
create a balanced panel of 36,778 firms, located in 793 counties and 58 newly promoted county-
level cities. Table 4 summarizes the breakdown of firms by ownership.
Table 4: Number of firms by ownership type
Firms Number of firms As a % of total
SOE 15,413 42.12%
Non-SOEs (e.g. collective, private, mix) 21,183 57.88%
Total 36,596 100%
3 Empirical Strategy
To properly identify the effect of a change in city-level powers on economic outcomes, we need
to control for selection bias. Simply put, if better performing or better managed counties were more
likely to be upgraded to county-level-cities, then a comparison of outcomes across counties and
cities would be upwardly biased. Our aim is to evaluate the causal effect of city upgrading on
economic outcomes.
We exploit the ad hoc nature of county-to-city upgrading to find an appropriate counterfactual.
We do this by matching newly-promoted cities with counties that are similar to these cities (and if
the upgrading requirements were properly applied, would have been promoted). The
counterfactual allows us to analyze how economic outcomes within a city would have evolved if
it had not been upgraded to city status.
Propensity Score Matching (PSM)
Let’s assume that a county is promoted to a county-level city at time 0s . Let
is be the economic
outcome at time
s (the outcomes for county
i at period
s) following upgrading to city status at
s 0 and the variable iCITY takes on the value one if county
i becomes a city. The causal effect
can be verified by looking at the difference: (
is
1 is
0 ), where the superscript denotes the
promotion. The crucial problem is that
is
0 is not observable. We follow the micro-econometric
evaluation literature (Heckman, Ichimura, & Todd, 1997) and define the average effect of
upgrading on economic outcomes as:
]1|[]1|[]1|[ 0101 iisiisiisis CITYECITYECITYE (1)
The key difficulty is to identify a counterfactual for the last term in Equation (1). This is the
economic outcome that a city would have experienced, on average, had it not been promoted to a
city. What is mainly of interest is the magnitude of the ‘impact’, labelled in red in Figure 1, and
the main problem is the calculation of the counterfactual that is to be deducted from the total
change.

6
This counterfactual is estimated by the corresponding average value of counties that remain as
counties (and are not upgraded): ]0|[ i
o
is CITYE . An important feature of the construction of
the counterfactual is the selection of a valid comparison group. In order to identify this group it is
assumed that all the differences in economic outcomes (except that caused by upgrading) between
cities and the appropriately selected county comparison group are captured by a vector of
observables, including the pre-upgrade county economic outcomes. The intuition behind selecting
the appropriate comparison group is to find a group that is as close as possible to the upgraded
county in terms of its predicted probability to be upgraded.
Following Fan, Li, & Zhang (2012), we control for the selection bias by matching cities that were
upgraded with similar counties that could have been upgraded (but were not). Since the county-
to-city upgrade policy came to an end in 1997, we use county-level variables from 1993 to 1997
to carry out the matching. We drop cities that were upgraded before 1994 (since the public finance
data only start from 1993). We carry out the matching exercise using observable county-level
economic outcomes in 1994 – we match cities (i.e. counties that will be promoted to county-level
cities) with counties (i.e. counties that were not promoted to cities).
Figure 1: Identification of impact of upgrading to city status
More formally, we apply the propensity score matching (PSM) method as proposed by Rosenbaum
and Rubin (1984). This boils down to estimating a probit model with a dependent variable equal
to one if the county is upgraded and zero otherwise, on lagged variables. The probability of being
upgraded is modelled as follows. CITY is a dummy variable that equals one if a county is
upgraded. The probability of being promoted, i.e. the propensity score, can be represented as
follows:
)()1Pr( 1993,1994, ii xFCITY (2)
7
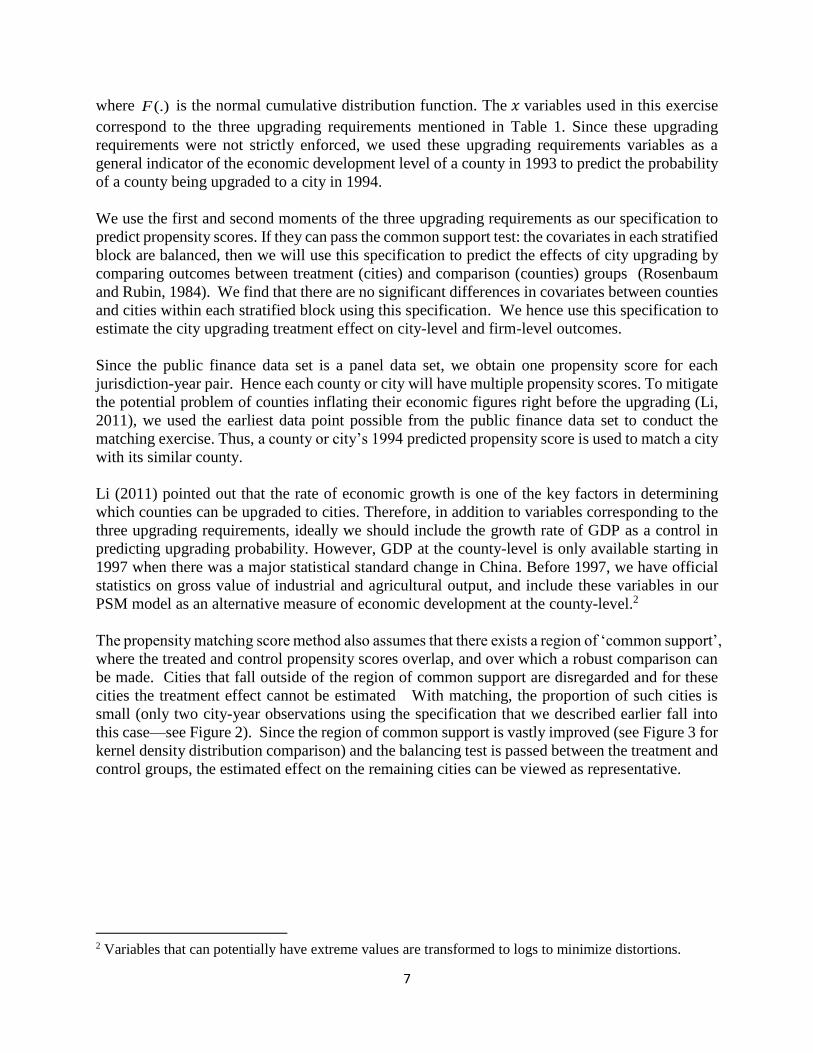
where (.)F is the normal cumulative distribution function. The 𝑥 variables used in this exercise
correspond to the three upgrading requirements mentioned in Table 1. Since these upgrading
requirements were not strictly enforced, we used these upgrading requirements variables as a
general indicator of the economic development level of a county in 1993 to predict the probability
of a county being upgraded to a city in 1994.
We use the first and second moments of the three upgrading requirements as our specification to
predict propensity scores. If they can pass the common support test: the covariates in each stratified
block are balanced, then we will use this specification to predict the effects of city upgrading by
comparing outcomes between treatment (cities) and comparison (counties) groups (Rosenbaum
and Rubin, 1984). We find that there are no significant differences in covariates between counties
and cities within each stratified block using this specification. We hence use this specification to
estimate the city upgrading treatment effect on city-level and firm-level outcomes.
Since the public finance data set is a panel data set, we obtain one propensity score for each
jurisdiction-year pair. Hence each county or city will have multiple propensity scores. To mitigate
the potential problem of counties inflating their economic figures right before the upgrading (Li,
2011), we used the earliest data point possible from the public finance data set to conduct the
matching exercise. Thus, a county or city’s 1994 predicted propensity score is used to match a city
with its similar county.
Li (2011) pointed out that the rate of economic growth is one of the key factors in determining
which counties can be upgraded to cities. Therefore, in addition to variables corresponding to the
three upgrading requirements, ideally we should include the growth rate of GDP as a control in
predicting upgrading probability. However, GDP at the county-level is only available starting in
1997 when there was a major statistical standard change in China. Before 1997, we have official
statistics on gross value of industrial and agricultural output, and include these variables in our
PSM model as an alternative measure of economic development at the county-level.2
The propensity matching score method also assumes that there exists a region of ‘common support’,
where the treated and control propensity scores overlap, and over which a robust comparison can
be made. Cities that fall outside of the region of common support are disregarded and for these
cities the treatment effect cannot be estimated With matching, the proportion of such cities is
small (only two city-year observations using the specification that we described earlier fall into
this case—see Figure 2). Since the region of common support is vastly improved (see Figure 3 for
kernel density distribution comparison) and the balancing test is passed between the treatment and
control groups, the estimated effect on the remaining cities can be viewed as representative.
2 Variables that can potentially have extreme values are transformed to logs to minimize distortions.
8
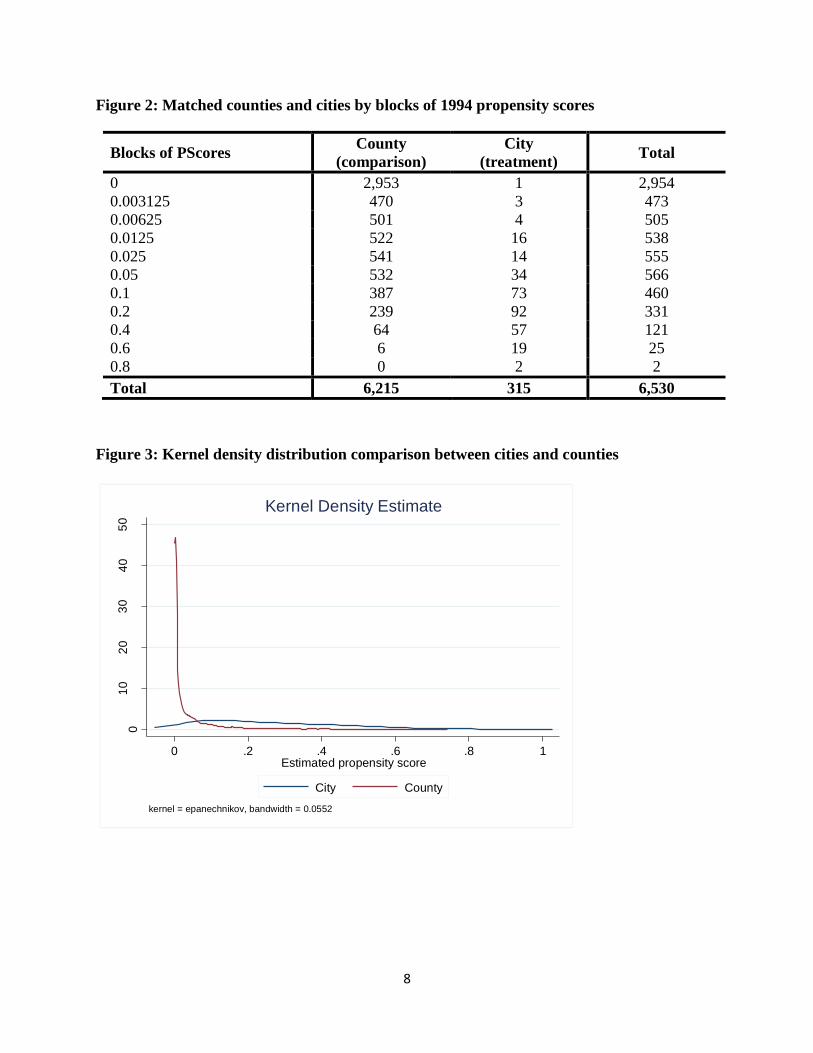
Figure 2: Matched counties and cities by blocks of 1994 propensity scores
Blocks of PScores County
(comparison)
City
(treatment) Total
0 2,953 1 2,954
0.003125 470 3 473
0.00625 501 4 505
0.0125 522 16 538
0.025 541 14 555
0.05 532 34 566
0.1 387 73 460
0.2 239 92 331
0.4 64 57 121
0.6 6 19 25
0.8 0 2 2
Total 6,215 315 6,530
Figure 3: Kernel density distribution comparison between cities and counties
01
02
03
04
05
0
Den
sity
0 .2 .4 .6 .8 1Estimated propensity score
City County
kernel = epanechnikov, bandwidth = 0.0552
Kernel Density Estimate

9
Identification of City-Level and Firm-Level Treatment Outcome
We use the treatment and counterfactual groups to carry out two distinct exercises to identify the
effect of city-level upgrading. First, we identify changes in city-level outcomes post-upgrading.
Fan, Li, & Zhang (2012) used a county and year fixed effects model to identify post-upgrading
effects. We use a propensity score model and compare our results with their findings. To identify
city-level outcomes, we stratify the county-level data according to their propensity scores, and
compare outcomes between treatment and comparison groups within each block and identify the
average upgrading effect (Dehejia and Wahba, 1999).3
Second, we identify changes in firm-level outcomes post-upgrading. We compare the performance
of firms located in cities versus the performance of firms located in matched counties. Ideally, we
would have liked to use difference-in-difference estimation in addition to the PSM, however we
are constrained by data limitations (firm-level data begin in 1998, after counties had already been
upgraded). We try to minimize the selection bias problem by limiting the results to incumbents,
i.e. firms that were already operating in 1997.4 We also control for year, industry, and time-
varying industry fixed effects in addition to the propensity score method to compare the robustness
of our firm-level outcome.
3 We considered weighting the samples to identify the average treatment effect. However, since there is not
a consensus which weighting method is the best in identifying the average treatment effect, we decide
not to weight the samples, simply controlling for block and year fixed effects. 4 This assumes that firms in counties and newly-promoted counties were similar previous to the upgrade.
10
4 Econometric Results
City-Level Outcomes
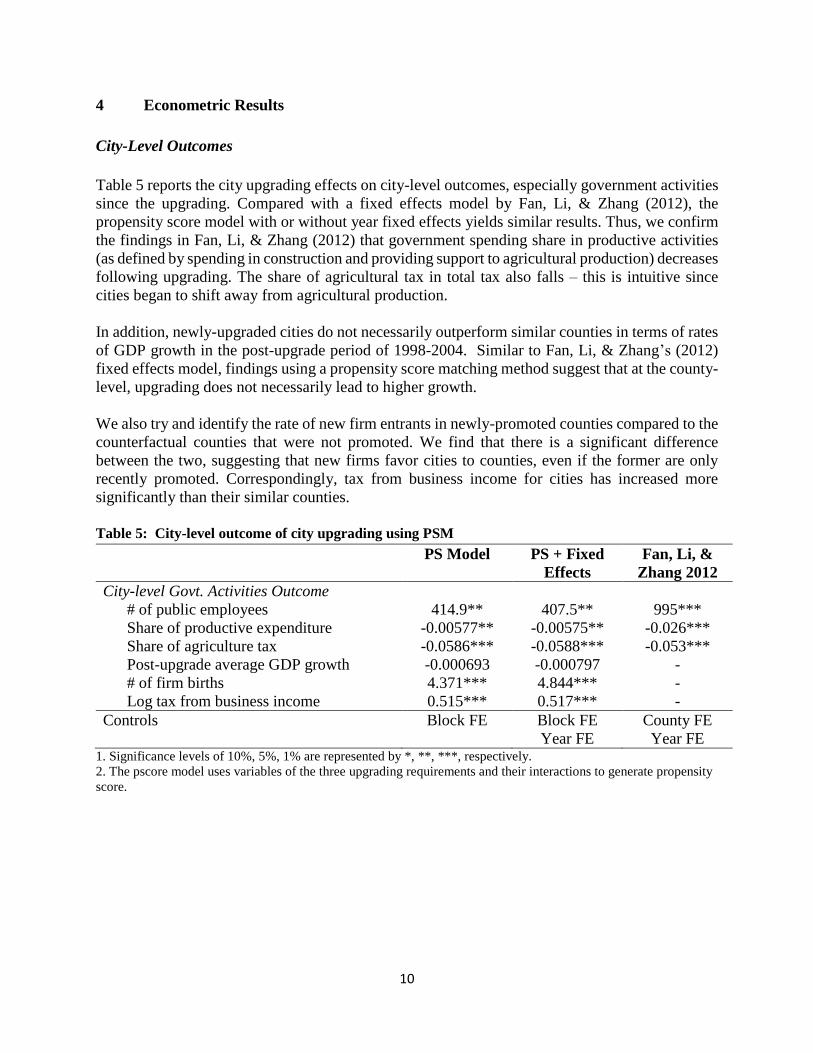
Table 5 reports the city upgrading effects on city-level outcomes, especially government activities
since the upgrading. Compared with a fixed effects model by Fan, Li, & Zhang (2012), the
propensity score model with or without year fixed effects yields similar results. Thus, we confirm
the findings in Fan, Li, & Zhang (2012) that government spending share in productive activities
(as defined by spending in construction and providing support to agricultural production) decreases
following upgrading. The share of agricultural tax in total tax also falls – this is intuitive since
cities began to shift away from agricultural production.
In addition, newly-upgraded cities do not necessarily outperform similar counties in terms of rates
of GDP growth in the post-upgrade period of 1998-2004. Similar to Fan, Li, & Zhang’s (2012)
fixed effects model, findings using a propensity score matching method suggest that at the county-
level, upgrading does not necessarily lead to higher growth.
We also try and identify the rate of new firm entrants in newly-promoted counties compared to the
counterfactual counties that were not promoted. We find that there is a significant difference
between the two, suggesting that new firms favor cities to counties, even if the former are only
recently promoted. Correspondingly, tax from business income for cities has increased more
significantly than their similar counties.
Table 5: City-level outcome of city upgrading using PSM
PS Model PS + Fixed
Effects
Fan, Li, &
Zhang 2012
City-level Govt. Activities Outcome
# of public employees 414.9** 407.5** 995***
Share of productive expenditure -0.00577** -0.00575** -0.026***
Share of agriculture tax -0.0586*** -0.0588*** -0.053***
Post-upgrade average GDP growth -0.000693 -0.000797 -
# of firm births 4.371*** 4.844*** -
Log tax from business income 0.515*** 0.517*** -
Controls Block FE Block FE
Year FE
County FE
Year FE 1. Significance levels of 10%, 5%, 1% are represented by *, **, ***, respectively.
2. The pscore model uses variables of the three upgrading requirements and their interactions to generate propensity
score.

11
Firm-Level Outcomes
We are also keen to understand how upgrading to city status affects firm-level outcomes. Before
we employ the propensity score matching method to identify the upgrading effects on firms, please
see below a summary of descriptive statistics between firms located in county-level cities versus
firms located in counties. At first glance, firms located in newly-upgraded cities on average
seemed to significantly outperform firms located in counties.
Table 6: Descriptive statistics of mean aggregate firm-level outcomes
All Firms Firms in
Cities
Firms in
Counties t-test
Firm-level Outcome
Log main operating revenue 9.462 9.866 9.380 0.487***
Log main operating cost 9.228 9.649 9.142 0.507***
Log main operating profit 7.330 7.624 7.270 0.355***
Log # of employees 5.153 5.300 5.123 0.177***
Log labor vocational 2.502 2.439 2.514 -0.075
Log wage per employee 8.792 8.871 8.776 0.095***
Log paid-in capital 8.349 8.425 8.334 0.091***
Log export output value 9.489 9.613 9.456 0.157*** 1. Significance levels of 10%, 5%, 1% are represented by *, **, ***, respectively.
In the next sections, we report firm-level outcomes using the propensity score matching method.
City-level outcomes suggest that firms tend to favor cities over counties. To avoid distortion of
statistical results, we first restrict our firm sample to incumbents (i.e. firms that were established
before 1997) and report their firm-level outcomes after the upgrade. To better understand the full
extent of firm-level outcomes, we also look at new firms’ performance and examine whether
locating in cities helps them perform better. Since there is an inherent selection bias while studying
new entrants to cities versus counties, we also study the effect of city upgrading on incumbents.
Firm-Level Outcomes (for Incumbents)
After matching county-level cities with similar counties using propensity scores, Table 7 shows
that, at the aggregate level, firms that are located in upgraded cities do not necessarily perform
better than firms located in similar counties. Standard errors are clustered at the county-level.
Although Fan, Li, & Zhang (2012) do not use firm level data, our estimates for aggregate firm-
level outcomes are in line with their findings that upgrading from county to county-level city does
not necessarily generate better city-level economic performance and public service provision. Our
results suggest that newly-formed cities are not using their increased powers to help Chinese firms
perform better.

12
Table 7: Firm-level outcomes of city upgrading using PSM for incumbents
Incumbent Firms (1) (2) (3)
Firm-level Outcome
Log main operating revenue 0.126 0.109 0.109
Log main operating cost 0.127 0.108 0.108
Log main operating profit 0.0673 0.0275 0.0275
Log # of employees -0.0195 -0.0859 -0.0859
Log labor vocational -0.0780 -0.0531 -0.0531
Log wage per employee -0.0528 -0.0409 -0.0395
Log paid-in capital -0.116 -0.117 -0.117
Log export output value -0.102 -0.118 -0.126
Controls Block FE Block FE
Industry FE
Year FE
Block FE
Industry × Year
FE 1. Significance levels of 10%, 5%, 1% are represented by *, **, ***, respectively.
2. When we report the firm-level results after PScore matching, we control for block fixed effects where samples are
stratified and compared against each other in each block.
3. Analysis is restricted to firms opened before 1997.
4. Vocational labor data is only available in 2004.
To ensure that the above aggregate results are not sensitive to different matching methods, we
report below the aggregate firm-level outcomes using three different matching methods commonly
used in the propensity score literature. We used the same propensity scores generated above to
conduct the matching. We can see that compared with Table 7, similar conclusions can be reached.
Upgrading counties into county-level cities alone has very limited effects on aggregate firm level
outcomes in terms of firm profits, export, and employment.
Table 8: Firm-level outcomes using different propensity score matching methods
Incumbent Firms Kernel
Local Linear
Regression 5-Nearest Neighbor
Firm-level Outcome
Log main operating revenue 0.116*** 0.340 0.457***
Log main operating cost 0.125*** 0.378 0.552***
Log main operating profit 0.052 0.162 0.077
Log # of employees -0.027 -0.096 -0.308***
Log labor vocational -0.108 -0.114 -0.206
Log wage per employee -0.064*** 0.085 0.206***
Log paid-in capital -0.158*** -0.214 -0.452***
Log export output value -0.062 0.206 0.359 1. Significance levels of 10%, 5%, 1% are represented by *, **, ***, respectively.
2. Average treatment on treated effects are reported, i.e. upgraded cities and their counterfactual counties are
compared to obtain the upgrading effects.

13
Are there winners and losers?
Next, we try and disaggregate this result using data on firm ownership. Firms are classified as
state-owned enterprises (SOEs) and other (which includes collectives, private firms, and firms with
mixed ownership). We are interested in understanding if SOEs seem to outperform their non-SOE
counterparts after upgrading to city status. We find that although the aggregate results across all
firms seem to suggest that cities are not using their powers to help firms, it turns out that SOEs in
newly-upgraded cities do significantly better than non-SOEs, compared to those in matched
counties. SOEs sell more and employ more (skilled) labor, although they are no more profitable.
Table 9: Firm-level outcome of city upgrading by ownership type using PSM for incumbents
Incumbent
Firms
Log main
operating
revenue
Log main
operating
cost
Log main
operating
profit
Log # of
employees
Log labor
vocational
Log wage
per
employee
Log
export
City -0.0828 -0.0827 -0.118 -0.268*** -0.241** -0.0776 -0.160
(0.106) (0.106) (0.125) (0.0812) (0.0978) (0.0519) (0.233)
SOE -0.911*** -0.908*** -0.573*** -0.0435 -0.00604 -0.293*** -0.630***
(0.0720) (0.0730) (0.0740) (0.0559) (0.0713) (0.0326) (0.157)
City × SOE 0.305** 0.304** 0.249 0.390*** 0.404*** 0.0584 0.332
(0.150) (0.151) (0.163) (0.102) (0.143) (0.0552) (0.368)
Constant 11.10*** 10.64*** 9.303*** 6.038*** 2.724*** 8.623*** 9.259***
(0.600) (0.576) (0.690) (0.256) (0.149) (0.563) (0.469)
Observations 32,517 32,428 21,283 18,193 3,892 17,496 4,759
R-squared 0.296 0.304 0.186 0.203 0.169 0.197 0.152
Block FE Yes Yes Yes Yes Yes Yes Yes
Industry × Year
FE Yes Yes Yes Yes Yes Yes Yes 1. Significance levels of 10%, 5%, 1% are represented by *, **, ***, respectively.
2. Standard errors are in parentheses and clustered at county-level.
3. Analysis is restricted to firms opened before 1997.
4. Vocational labor data is only available in 2004.
Why do SOEs outperform their private counterparts?
In this section, we try to solve the puzzle of why SOEs gain disproportionately compared with
other types of firms. Going back to Table 3, one of the main benefits of city upgrading is that a
city can now establish branches of state-owned banks (SOBs). According to Wei and Wang (1997),
bank loans made from state-owned banks clearly favored SOEs. In the 1990s, many state-owned
banks imposed softer budget constraints on SOEs than in the 1980s, such that bank finance and
firm productivity were no longer linked (Cull and Xu, 2000). In other words, the literature provides
evidence of favorable lending from SOBs to SOEs.
We go back to firm-level data and examine whether SOEs receive more credit from SOBs than
other firms. Ideally, we would like to identify the source of the increase in credit to SOEs –
however, the data do not provide a breakdown of the sources of debt financing. Instead, we use
current debt and total debt as proxies to measure credit from SOBs and assume that most of the
14
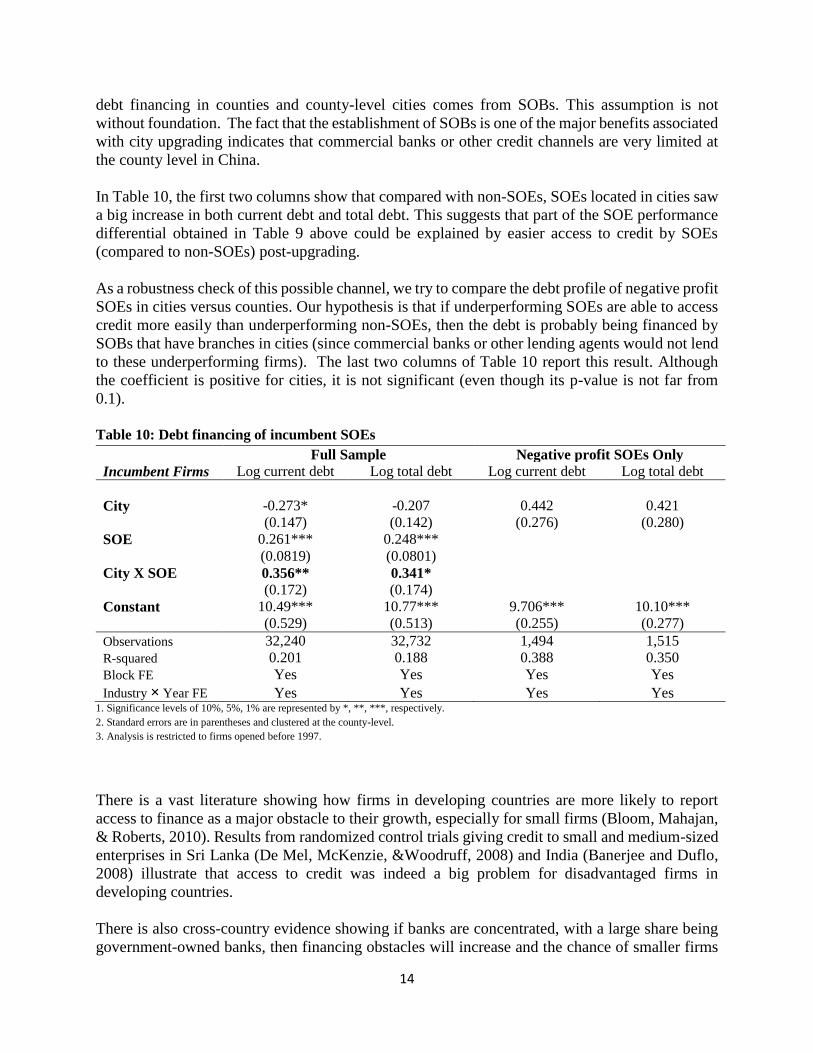
debt financing in counties and county-level cities comes from SOBs. This assumption is not
without foundation. The fact that the establishment of SOBs is one of the major benefits associated
with city upgrading indicates that commercial banks or other credit channels are very limited at
the county level in China.
In Table 10, the first two columns show that compared with non-SOEs, SOEs located in cities saw
a big increase in both current debt and total debt. This suggests that part of the SOE performance
differential obtained in Table 9 above could be explained by easier access to credit by SOEs
(compared to non-SOEs) post-upgrading.
As a robustness check of this possible channel, we try to compare the debt profile of negative profit
SOEs in cities versus counties. Our hypothesis is that if underperforming SOEs are able to access
credit more easily than underperforming non-SOEs, then the debt is probably being financed by
SOBs that have branches in cities (since commercial banks or other lending agents would not lend
to these underperforming firms). The last two columns of Table 10 report this result. Although
the coefficient is positive for cities, it is not significant (even though its p-value is not far from
0.1).
Table 10: Debt financing of incumbent SOEs
Full Sample Negative profit SOEs Only
Incumbent Firms Log current debt Log total debt Log current debt Log total debt
City -0.273* -0.207 0.442 0.421
(0.147) (0.142) (0.276) (0.280)
SOE 0.261*** 0.248***
(0.0819) (0.0801)
City X SOE 0.356** 0.341*
(0.172) (0.174)
Constant 10.49*** 10.77*** 9.706*** 10.10***
(0.529) (0.513) (0.255) (0.277)
Observations 32,240 32,732 1,494 1,515
R-squared 0.201 0.188 0.388 0.350
Block FE Yes Yes Yes Yes
Industry × Year FE Yes Yes Yes Yes 1. Significance levels of 10%, 5%, 1% are represented by *, **, ***, respectively.
2. Standard errors are in parentheses and clustered at the county-level.
3. Analysis is restricted to firms opened before 1997.
There is a vast literature showing how firms in developing countries are more likely to report
access to finance as a major obstacle to their growth, especially for small firms (Bloom, Mahajan,
& Roberts, 2010). Results from randomized control trials giving credit to small and medium-sized
enterprises in Sri Lanka (De Mel, McKenzie, &Woodruff, 2008) and India (Banerjee and Duflo,
2008) illustrate that access to credit was indeed a big problem for disadvantaged firms in
developing countries.
There is also cross-country evidence showing if banks are concentrated, with a large share being
government-owned banks, then financing obstacles will increase and the chance of smaller firms

15
to access credit will decrease (Beck, Demirguc-Kunt, and Maksimovic, 2004). With the new micro
firm-level data from China, it seems this argument is even stronger that compared with SOEs, even
large non-SOEs are disadvantaged in accessing credit at the county level.
Does capacity matter?
Even though the city-level outcome does not show that cities with a bigger scope of power
outperform their similar counties, we are worried that the reason we observe this result was because
city governments do not have the capacity to carry out these new powers, and not because the new
powers themselves are not useful. In urban governance literature, the powers of a city government
for managing economic development depend on factors of not only its operational scope, but
capacity as well (Davey, 1993). We therefore want to test and see whether newly promoted cities
with higher capacity help firms perform better. Regional disparities in human capital are vast in
China, and we include province fixed effects to offset partly this regional difference when
evaluating firm-level outcomes, in addition to the time and industry fixed effects we have
controlled for.
Since there is not a unified measure of city capacity, we propose using two proxies to measure
capacity to conduct this analysis due to data limitation and availability. We propose using the
percentage of public employees supported by public finance out of total city population as a
measure of city capacity. Adequate and institutionalized human capital is often cited as one of the
key factors in determining city capacity (World Bank, 2009). A recent paper by Acemoglu,
García-Jimeno and Robinson (2014) also used a similar measure to measure capacity: the number
of municipality-level bureaucrats excluding police officers, judges, all other judicial employees,
and public hospital employees.
Alternatively, we propose using the total tax revenues collected, excluding land sales revenues,
out of total city GDP as a proxy of city capacity.5 Fukuyama (2013) proposed using tax revenues
out of GDP as a proxy for state capacity, as the ability to extract tax not only indicates a
government’s capability, but also means the government has revenues to carry out public functions
and hence tax extraction can be a good proxy for capacity.6
From previous results, we have shown that at the aggregate firm level, simply being located in a
newly promoted city does not help firms perform better. However, from Table 11, after taking into
account capacity as measured by more institutionalized human capital available to public services,
firms located in newly promoted cities with higher capacity seem to perform better in terms of
sales, profits and wage rate of employees.
5 The two proxies of city capacity are by no means perfect. In an ideal world, proper understanding and
measurement of capacity would require a combination of quantitative proxies supplemented by qualitative
data. 6 We are interested in whether city-upgrading itself leads to a jump in capacity post-upgrade. Plotting the
two proxies against time period of 1996 to 2004 shows us that city capacity does not change much after the
upgrade. Therefore, we are essentially comparing cities with different initial capacity levels here and report
how capacity matters.

16
Table 11: Firm-level outcomes of city upgrading and city capacity for incumbents
Incumbent Firms
Log main
operating
revenue
Log main
operating
cost
Log main
operating
profit
Log # of
employees
Log labor
vocational
Log
wage per
employee
Log
export
City -1.210** -1.216** -1.311** -0.580 -0.252 -0.452* -0.348
(0.504) (0.501) (0.537) (0.390) (0.357) (0.262) (0.925)
Capacity -21.56*** -22.01*** -17.69*** -14.79*** -15.43*** -0.127 -7.195
(4.616) (4.775) (4.695) (3.426) (4.028) (1.640) (12.58)
City × Capacity 46.61** 46.65** 49.13** 18.57 8.353 17.37* 8.777
(20.33) (20.12) (21.80) (15.02) (13.86) (10.38) (37.08)
Constant 11.85*** 11.43*** 10.12*** 6.673*** 3.117*** 8.353*** 9.227***
(0.672) (0.658) (0.752) (0.385) (0.219) (0.509) (0.990)
Observations 32,517 32,428 21,283 18,193 3,892 17,496 4,759
R-squared 0.330 0.336 0.228 0.245 0.221 0.251 0.179
Block FE Yes Yes Yes Yes Yes Yes Yes
Industry × Year FE Yes Yes Yes Yes Yes Yes Yes
Province FE Yes Yes Yes Yes Yes Yes Yes 1. Significance levels of 10%, 5%, 1% are represented by *, **, ***, respectively.
2. Standard errors are in parentheses and clustered at county-level.
3. Analysis is restricted to firms opened before 1997.
4. Vocational labor data is only available in 2004.

17
Table 12: Re-examine incumbent SOE outcomes after taking into account city capacity
Incumbent Firms
Log main
operating
revenue
Log main
operating
cost
Log main
operating
profit
Log # of
employees
Log labor
vocational
Log
wage per
employee
Log
export
City -0.704 -0.685 -0.848 -0.255 -0.208 -0.209 0.0498
(0.760) (0.767) (0.906) (0.443) (0.444) (0.294) (1.045)
Capacity -4.061 -5.576 4.035 8.095 -2.814 0.945 -5.989
(6.818) (7.159) (8.218) (5.278) (6.852) (3.019) (13.56)
SOE -0.176 -0.206 0.263 0.721*** 0.425** -0.201** -0.772
(0.218) (0.226) (0.242) (0.172) (0.213) (0.0874) (0.565)
City × Capacity 23.63 22.64 29.11 -0.644 -0.324 8.319 -7.217
(31.10) (31.28) (36.52) (16.48) (17.69) (11.62) (42.60)
Capacity × SOE -19.84*** -18.57** -25.01*** -26.82*** -15.12** -1.173 10.27
(7.134) (7.401) (8.443) (5.719) (6.890) (2.958) (20.07)
City × SOE -0.649 -0.721 -0.521 -0.138 0.173 -0.508 -1.901
(1.010) (0.996) (1.232) (0.640) (0.783) (0.334) (2.101)
City × Capacity ×
SOE 30.70 33.60 22.80 17.64 6.978 18.52 80.49
(39.36) (38.63) (47.66) (24.26) (30.54) (12.77) (80.46)
Constant 12.09*** 11.70*** 9.979*** 6.097*** 2.671*** 8.573*** 9.736***
(0.676) (0.667) (0.760) (0.442) (0.265) (0.520) (0.873)
Observations 32,517 32,428 21,283 18,193 3,892 17,496 4,759
R-squared 0.351 0.356 0.236 0.252 0.225 0.264 0.190
Block FE Yes Yes Yes Yes Yes Yes Yes
Industry × Year FE Yes Yes Yes Yes Yes Yes Yes
Province FE Yes Yes Yes Yes Yes Yes Yes 1. Significance levels of 10%, 5%, 1% are represented by *, **, ***, respectively.
2. Standard errors are in parentheses and clustered at county-level.
3. Analysis is restricted to firms opened before 1997.
4. Vocational labor data is only available in 2004.
SOEs located in newly promoted cities outperform non-SOEs (see Table 9). However, once we
account for city capacity, this result no longer holds – see Table 12. This might suggest that cities
with more power but lower capacity are more likely to exploit the extra power to favor certain
types of firms, such as SOEs.
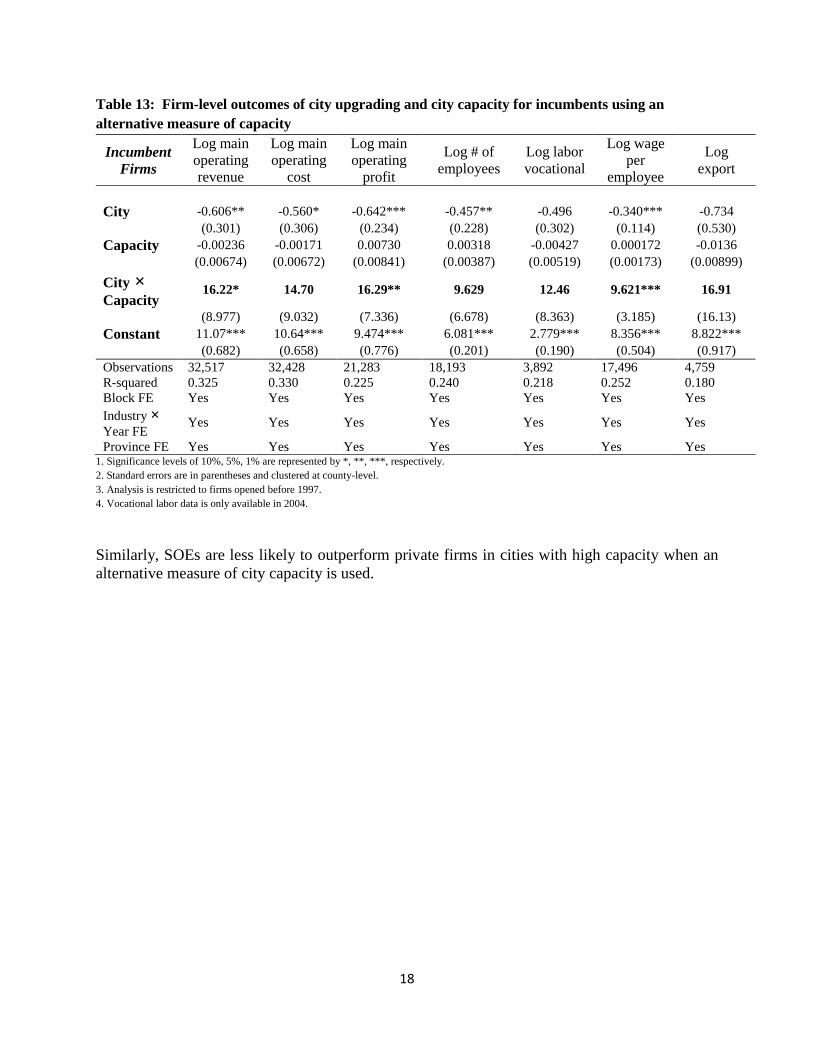
We re-run the above exercise using another proxy for city capacity, i.e. total tax collection as a
proportion of city GDP. We find similar results - only cities with both the scope and capacity to
carry out their additional remit are able to help firms grow and help employees increase wages.
18
Table 13: Firm-level outcomes of city upgrading and city capacity for incumbents using an
alternative measure of capacity
Incumbent
Firms
Log main
operating
revenue
Log main
operating
cost
Log main
operating
profit
Log # of
employees
Log labor
vocational
Log wage
per
employee
Log
export
City -0.606** -0.560* -0.642*** -0.457** -0.496 -0.340*** -0.734
(0.301) (0.306) (0.234) (0.228) (0.302) (0.114) (0.530)
Capacity -0.00236 -0.00171 0.00730 0.00318 -0.00427 0.000172 -0.0136
(0.00674) (0.00672) (0.00841) (0.00387) (0.00519) (0.00173) (0.00899)
City ×
Capacity 16.22* 14.70 16.29** 9.629 12.46 9.621*** 16.91
(8.977) (9.032) (7.336) (6.678) (8.363) (3.185) (16.13)
Constant 11.07*** 10.64*** 9.474*** 6.081*** 2.779*** 8.356*** 8.822***
(0.682) (0.658) (0.776) (0.201) (0.190) (0.504) (0.917)
Observations 32,517 32,428 21,283 18,193 3,892 17,496 4,759
R-squared 0.325 0.330 0.225 0.240 0.218 0.252 0.180
Block FE Yes Yes Yes Yes Yes Yes Yes
Industry ×
Year FE Yes Yes Yes Yes Yes Yes Yes
Province FE Yes Yes Yes Yes Yes Yes Yes 1. Significance levels of 10%, 5%, 1% are represented by *, **, ***, respectively.
2. Standard errors are in parentheses and clustered at county-level.
3. Analysis is restricted to firms opened before 1997.
4. Vocational labor data is only available in 2004.
Similarly, SOEs are less likely to outperform private firms in cities with high capacity when an
alternative measure of city capacity is used.

19
Table 14: Incumbent SOE outcomes of city upgrading (using an alternative measure of capacity)
Incumbent
Firms
Log main
operating
revenue
Log main
operating
cost
Log main
operating
profit
Log # of
employees
Log labor
vocational
Log wage
per
employee
Log
export
City -0.298 -0.251 -0.302 -0.512** -0.418 -0.338** -0.515
(0.340) (0.339) (0.412) (0.236) (0.284) (0.147) (0.687)
Capacity 0.00895** 0.00875* 0.0241*** 0.00706*** 0.00505 0.00402 -0.0114
(0.00401) (0.00446) (0.00579) (0.00252) (0.00508) (0.00701) (0.00845)
SOE -0.708*** -0.706*** -0.394*** 0.00481 0.0168 -0.230*** -0.501***
(0.0689) (0.0709) (0.0699) (0.0535) (0.0709) (0.0261) (0.156)
City ×
Capacity 4.205 2.606 4.621 6.125 4.677 10.16** 10.44
(11.15) (11.06) (13.31) (6.679) (8.124) (4.378) (21.20)
Capacity ×
SOE -0.0148*** -0.0137*** -0.0215*** -0.00400 -0.0105 -0.00508 -0.0159***
(0.00379) (0.00343) (0.00309) (0.00243) (0.0107) (0.00826) (0.00380)
City × SOE -0.340 -0.339 -0.448 0.222 -0.0435 0.00244 -0.0611
(0.410) (0.403) (0.555) (0.317) (0.413) (0.174) (1.158)
City ×
Capacity ×
SOE
16.10 16.16 16.56 4.236 13.08 -1.310 5.910
(12.48) (12.15) (16.50) (9.334) (12.06) (4.969) (31.68)
Constant 11.74*** 11.30*** 9.851*** 6.061*** 2.650*** 8.602*** 9.209***
(0.666) (0.643) (0.766) (0.206) (0.195) (0.513) (0.944)
Observations 32,517 32,428 21,283 18,193 3,892 17,496 4,759
R-squared 0.346 0.350 0.231 0.243 0.221 0.264 0.189
Block FE Yes Yes Yes Yes Yes Yes Yes
Industry × Year
FE Yes Yes Yes Yes Yes Yes Yes
Province FE Yes Yes Yes Yes Yes Yes Yes 1. Significance levels of 10%, 5%, 1% are represented by *, **, ***, respectively.
2. Standard errors are in parentheses and clustered at county-level.
3. Analysis is restricted to firms opened before 1997.
4. Vocational labor data is only available in 2004.
Tax collection represents only a subset of total revenues that are available to a local government
in China, where land sales and transfers from central government are also major sources of
revenues. As a robustness test, we use total government spending as a proportion of city GDP as
a proxy to measure the extent to which public services are being delivered using public funding.
We obtain similar results - firms in high-capacity cities tend to create more jobs, especially skilled
labor jobs, and SOEs are less likely to outperform private firms.
20
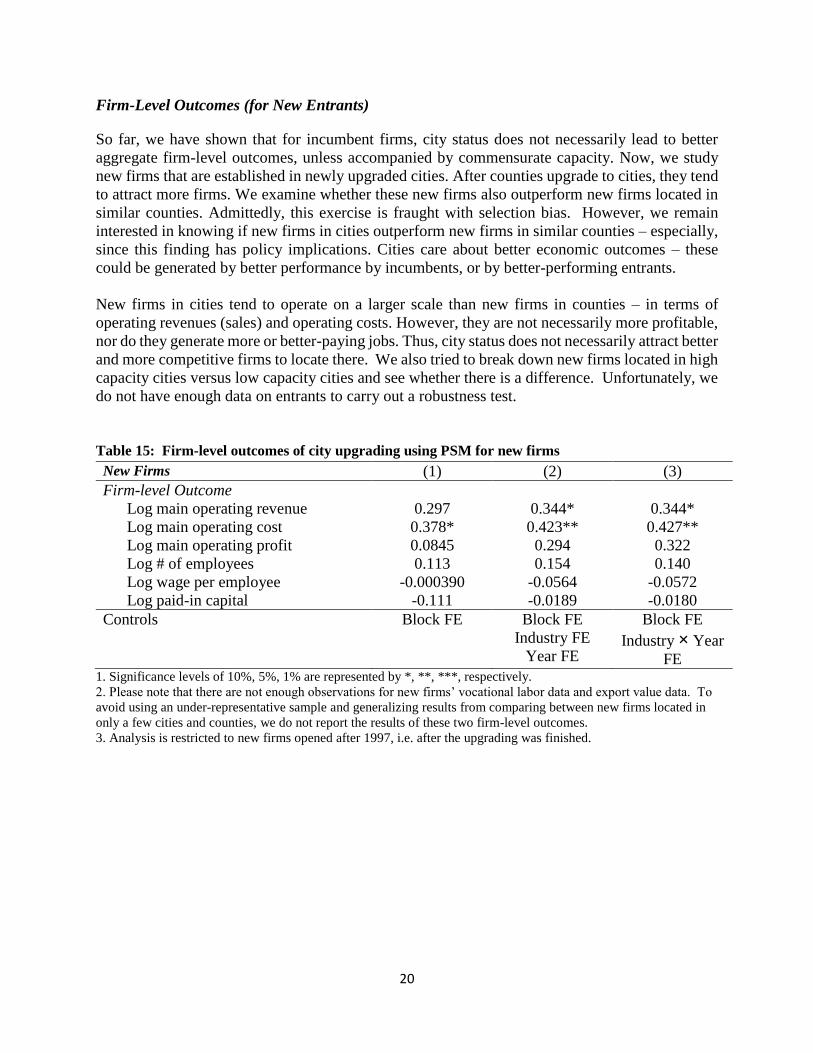
Firm-Level Outcomes (for New Entrants)
So far, we have shown that for incumbent firms, city status does not necessarily lead to better
aggregate firm-level outcomes, unless accompanied by commensurate capacity. Now, we study
new firms that are established in newly upgraded cities. After counties upgrade to cities, they tend
to attract more firms. We examine whether these new firms also outperform new firms located in
similar counties. Admittedly, this exercise is fraught with selection bias. However, we remain
interested in knowing if new firms in cities outperform new firms in similar counties – especially,
since this finding has policy implications. Cities care about better economic outcomes – these
could be generated by better performance by incumbents, or by better-performing entrants.
New firms in cities tend to operate on a larger scale than new firms in counties – in terms of
operating revenues (sales) and operating costs. However, they are not necessarily more profitable,
nor do they generate more or better-paying jobs. Thus, city status does not necessarily attract better
and more competitive firms to locate there. We also tried to break down new firms located in high
capacity cities versus low capacity cities and see whether there is a difference. Unfortunately, we
do not have enough data on entrants to carry out a robustness test.
Table 15: Firm-level outcomes of city upgrading using PSM for new firms
New Firms (1) (2) (3)
Firm-level Outcome
Log main operating revenue 0.297 0.344* 0.344*
Log main operating cost 0.378* 0.423** 0.427**
Log main operating profit 0.0845 0.294 0.322
Log # of employees 0.113 0.154 0.140
Log wage per employee -0.000390 -0.0564 -0.0572
Log paid-in capital -0.111 -0.0189 -0.0180
Controls Block FE Block FE
Industry FE
Year FE
Block FE
Industry × Year
FE 1. Significance levels of 10%, 5%, 1% are represented by *, **, ***, respectively.
2. Please note that there are not enough observations for new firms’ vocational labor data and export value data. To
avoid using an under-representative sample and generalizing results from comparing between new firms located in
only a few cities and counties, we do not report the results of these two firm-level outcomes.
3. Analysis is restricted to new firms opened after 1997, i.e. after the upgrading was finished.

21
5 Conclusion
This paper utilizes a countrywide county-to-city upgrade in the 1990s in China to explore whether
expanding city power leads to better firm performance. When counties are upgraded to cities, their
remit expands and they gain additional administrative and fiscal powers. An increase in city
powers provides these newly-promoted counties with the ability to provide greater support or at
the minimum, a better business environment, for firms, helping to ensure more growth and
employment.
Unfortunately, in this paper we find that this is not always the case. Increasing the policy space
controlled by a city does not necessarily translate into better city and firm performance. This does
not suggest that cities could not utilize their new powers effectively – indeed, we find evidence
that certain types of firms (state-owned enterprises) begin to outperform their non-SOE
counterparts as soon as their credit constraints are relaxed. Newly-established state-owned banks
within cities might help explain better access to credit for SOEs, leading to higher levels of
employment and increased sales by SOEs. This suggests that if access to finance were a market-
based decision, then the gains from the city-upgrading policy may be expanded to all firms, not
just SOEs.
We also examine the effects of an increased “mayor’s wedge” and take into account not just
increased powers, but also city capacity. Governance literature shows that in order for a
government to manage well its economic development goals, both its operational scope and
capacity matter. Therefore, granting additional powers to newly promoted cities does not
necessarily translate into better economic performance unless these cities also have the capacity
to utilize the additional remit and benefits. We measure city capacity by local government’s human
capital level as well as tax extraction ability. We find that incumbent firms located in newly-
promoted cities with high capacity tend to outperform firms in similar counties. Interestingly,
SOEs in cities with high capacity do not necessarily outperform non-SOEs, indicating that low-
capacity cities are more likely to abuse their additional remit to favor certain groups of firms.
The WBG and other development institutions are dealing on an increasing basis with subnational
governments to improve economic outcomes. In addition, many developing countries have
devolved powers to subnational regions. However, there is a lack of evidence about how changing
the powers available to local government policy makers relates to economic outcomes. This paper
attempts to address this gap and provides some rigorous evidence in support of administrative
decentralization accompanied by commensurate increases in capacity.
Governments are making employment their main priority and much of job creation – both in
modern sector activities and in the informal sector – is overwhelmingly urban. This paper adds to
the empirical evidence linking the ability of city governments to implement pro-active policies to
actual economic outcomes. It sheds light on how and under what conditions city leaders can utilize
the policy instruments at their disposal to actively target firm growth and job creation in cities.
The lessons learned in China point overwhelmingly to the importance of local government capacity.
To be an effective strategy for economic development, decentralization should to be accompanied
by large and commensurate increases in capacity.

22
References
Acemoglu, D., García-Jimeno, C., & Robinson, J. A. (2014). State Capacity and Economic
Development: A Network Approach (No. w19813). National Bureau of Economic Research.
Banerjee, A. V., & Duflo, E. (2004). Do firms want to borrow more?: testing credit constraints
using a directed lending program. Centre for Economic Policy Research.
Beck, T., Demirguc-Kunt, A., & Maksimovic, V. (2004). Bank competition and access to finance:
International evidence. Journal of Money, Credit, and Banking, 36(3), 627-648.
Bloom, N., Mahajan, A., McKenzie, D., & Roberts, J. (2010). Why do firms in developing
countries have low productivity?. The American Economic Review, 619-623.
Brandt, L., Van Biesebroeck, J., & Zhang, Y. (2014). Challenges of working with the Chinese NBS
firm-level data. China Economic Review.
Cull, R., & Xu, L. C. (2000). Bureaucrats, state banks, and the efficiency of credit allocation: The
experience of Chinese state-owned enterprises. Journal of Comparative Economics, 28(1), 1-
31.
Davey, K. J. (1993). Elements of urban management.
De Mel, S., McKenzie, D., & Woodruff, C. (2008). Returns to capital in microenterprises:
evidence from a field experiment. The Quarterly Journal of Economics, 123(4), 1329-1372.
Dehejia, R. H., & Wahba, S. (1999). Causal effects in nonexperimental studies: Reevaluating the
evaluation of training programs. Journal of the American statistical Association, 94(448),
1053-1062.
Fan, S., Li, L., & Zhang, X. (2012). Challenges of creating cities in China: Lessons from a short-
lived county-to-city upgrading policy. Journal of Comparative Economics, 40(3), 476-491.
Fukuyama, F. (2013). What is governance?. Governance, 26(3), 347-368.
Heckman, J. J., Ichimura, H., & Todd, P. E. (1997). Matching as an econometric evaluation
estimator: Evidence from evaluating a job training programme. The review of economic
studies, 64(4), 605-654.
Li, L. (2011). The incentive role of creating “cities” in China. China Economic Review, 22(1),
172-181.
Ministry of Civil Affairs. (1993). Guanyu Tiaozheng Sheshi Biaozhun De Baogao (The report on
adjusting the criteria for the designation of new cities). Ministry of Civil Affairs of PRC.
Nie, H, Jiang, T., & Yang, R. (2012). Zhongguo Gongye Qiye Shujuku De Shiyong Xianzhuang
He Qianzai Wenti (Current usage and potential problems of the Chinese industrial enterprises
database). World Economics, 5, 142-158.
Rosenbaum, P. R., & Rubin, D. B. (1984). Reducing bias in observational studies using
subclassification on the propensity score. Journal of the American Statistical Association,
79(387), 516-524.
Song, Z. & Hsieh, C. (2013) Grasp the large, let go of the small: The transformation of the state
sector in China. Meeting Papers 1330, Society for Economic Dynamics.
Wei, S. J., & Wang, T. (1997). The Siamese twins: Do state-owned banks favor state-owned
enterprises in China?. China Economic Review, 8(1), 19-29.
World Bank. (2009). Guidance note human resource management actionable governance
indicators (HRM AGI) instrument. World Bank.
Zhang, L., & Zhao, S. X. (1998). Re-examining China's “urban” concept and the level of
urbanization. The China Quarterly, 154, 330-381.