
Evidence for Free Precession in the Pulsar B1642 - arXiv · PDF fileEvidence for Free...
14
arXiv:astro-ph/0101282v1 17 Jan 2001 Evidence for Free Precession in the Pulsar B1642-03 T.V. Shabanova 1 Astro Space Center, P.N.Lebedev Physical Institute, 53 Leninskij Prospect, Moscow 117924, Russia A.G. Lyne 2 University of Manchester, Jodrell Bank Observatory, Macclesfield, Cheshire SK11 9DL, UK and J.O. Urama 3 Hartebeesthoek Radio Astronomy Observatory (HartRAO), P.O. Box 443, Krugersdorp 1740, South Africa Department of Physics & Astronomy, University of Nigeria, Nsukka, Enugu State, Nigeria ABSTRACT We present an analysis of the timing data of the pulsar B1642-03, collected over a span of 30 years between 1969 and 1999. During this interval, the timing residuals exhibit cyclical changes with amplitude varying from 15 ms to 80 ms and spacing of maxima varying from 3 years to 7 years. Interpretation of these observed cyclical changes in terms of free precession suggests a wobble angle of about 0.8 degrees. Subject headings: free precession — pulsars: general — pulsars: individual (B1642-03) 1. Introduction The pulsar B1642-03 was discovered more than 30 years ago (Huguenin & Taylor 1969) and is known to exhibit interesting timing behaviour. It has a period of 0.387 s and a spindown rate 1.78 × 10 −15 s/s, indicating that it is a relatively young pulsar, with a characteristic age of P/2 ˙ P ∼ 3.4 Myr. Since the pulsar discovery, timing measurements were carried out almost continuously for 13 years between 1969 July and 1982 September at the frequency of 2388 MHz using antennas of the 1 e-mail: [email protected] 2 e-mail: [email protected] 3 e-mail: [email protected]
Transcript of Evidence for Free Precession in the Pulsar B1642 - arXiv · PDF fileEvidence for Free...

arX
iv:a
stro
-ph/
0101
282v
1 1
7 Ja
n 20
01
Evidence for Free Precession in the Pulsar B1642−03
T.V. Shabanova1
Astro Space Center, P.N.Lebedev Physical Institute, 53 Leninskij Prospect, Moscow 117924,
Russia
A.G. Lyne2
University of Manchester, Jodrell Bank Observatory, Macclesfield, Cheshire SK11 9DL, UK
and
J.O. Urama3
Hartebeesthoek Radio Astronomy Observatory (HartRAO), P.O. Box 443, Krugersdorp 1740,
South Africa
Department of Physics & Astronomy, University of Nigeria, Nsukka, Enugu State, Nigeria
ABSTRACT
We present an analysis of the timing data of the pulsar B1642−03, collected over
a span of 30 years between 1969 and 1999. During this interval, the timing residuals
exhibit cyclical changes with amplitude varying from 15 ms to 80 ms and spacing of
maxima varying from 3 years to 7 years. Interpretation of these observed cyclical
changes in terms of free precession suggests a wobble angle of about 0.8 degrees.
Subject headings: free precession — pulsars: general — pulsars: individual (B1642−03)
1. Introduction
The pulsar B1642−03 was discovered more than 30 years ago (Huguenin & Taylor 1969)
and is known to exhibit interesting timing behaviour. It has a period of 0.387 s and a spindown
rate 1.78 × 10⁻¹⁵ s/s, indicating that it is a relatively young pulsar, with a characteristic age of
P/2P ∼ 3.4 Myr.
Since the pulsar discovery, timing measurements were carried out almost continuously for 13
years between 1969 July and 1982 September at the frequency of 2388 MHz using antennas of the
1e-mail: [email protected]
2e-mail: [email protected]
3e-mail: [email protected]
– 2 –
Deep Space Network of NASA (Downs & Reichley 1983; Downs & Krause-Polstorff 1986). From
a timing analysis of the JPL data, Cordes and Downs (1985) found that the timing residuals of
PSR B1642−03 show oscillatory behaviour with an amplitude of about 15 ms. Subsequently it
was revealed that PSR B1642−03 also exhibits periodic changes in the shape of the mean pulse
profile with a period of about 1000 days (Blaskiewicz 1991). According to Cordes (1993), cyclical
timing residuals and periodic changes in the shape can be explained by the precession model with
a wobble angle θp∼0.5◦. This interpretation implies that free precession yields pulse shape changes
from wobble of the beam besides any wobble that is also manifested in timing residuals because of
the spindown torque law.
In this paper we continue to investigate the timing behaviour of the pulsar B1642−03,
analyzing the data collected for 30 years. The extension of the timing data span from 13 years to
30 years has become possible due to regular pulsar timing observations, which were carried out at
Jodrell Bank Observatory in the UK, at Hartebeesthoek Radio Astronomy Observatory in South
Africa and at Pushchino Radio Astronomy Observatory in Russia. The Jodrell Bank data were
obtained in the wide frequency range 0.4 - 1.6 GHz and cover a span of 18 years between 1981
July and 1999 September. The HartRAO timing data obtained at 1.6/2.3 GHz cover a span of
∼14 years between 1985 November and 1999 March. The Pushchino data were obtained at 0.1
GHz and include the timing data between 1991 March and 1999 October and a separate observing
session in 1984 September - December. Together, these provide a continuous data set collected for
30 years with a one year gap between 1983 July and 1984 August. A timing analysis of these data
reveals that the timing residuals of PSR B1642−03 exhibit cyclical behaviour over the entire time
span of observations. The best explanation of the observed cyclical timing residuals is probably
provided by the precession model. Partly these results were earlier published in Proc. IAU Col.
177 (Shabanova & Urama 2000).
2. Observations
At Jodrell Bank, observations of the pulsar with the 76-m Lovell radiotelescope started in
July 1981. Cryogenic receivers sensitive to the two hands of circular polarisation were used at
frequencies centred on 408, 610, 1400 and 1600 MHz with observing bandwidths of 8 MHz at
the lower two frequencies and 32 MHz for the two highest. Each observation typically consisted
of 6 1-minute sub-integrations. The profiles from these were added in polarisation pairs and
then combined to provide a single total-intensity profile. This was then convolved with a
template derived from a single high signal-to-noise ratio profile at the same frequency to give a
time-of-arrival.
At HartRAO, the timing observations of the pulsar B1642−03 commenced in 1985 November
and were performed with the 26-m radiotelescope at frequencies near 1.6 or 2.3 GHz, using the
system described by Flanagan (1993). The observing bandwidth was 10 MHz. Each observation
usually consisted of three integrations. Pulse arrival times were obtained from 12 min on-line
– 3 –
integrations of the pulsed signal sampled at 0.15 ms intervals, using a filter time-constant of 200
microsecs. The pulse was approximated by a Gaussian. Such Gaussian templates have a reference
point, which was chosen to be the centre of the main component.
The pulsar timing observations at Pushchino Observatory were started in 1991 March using
the BSA radiotelescope, making up a linearly polarized transit antenna, which operated at 102.7
MHz until 1998 May and at 111.3 MHz since 1998 November after the BSA reconstruction. A
32-channel receiver with a channel bandwidth of 20 kHz was used for the observations. The
receiver time constant was 3 ms. Each measurement consisted of 3.6 minute integration of the
pulsar signal, synchronized with the apparent pulsar period (Shabanova 1998). Observation time
corresponded to transit time at the declination of the pulsar. The data consist of the mean
pulse profiles recorded approximately three times a month. Pulse arrival times were derived by
cross-correlating the mean pulse profile with a standard, low-noise template.
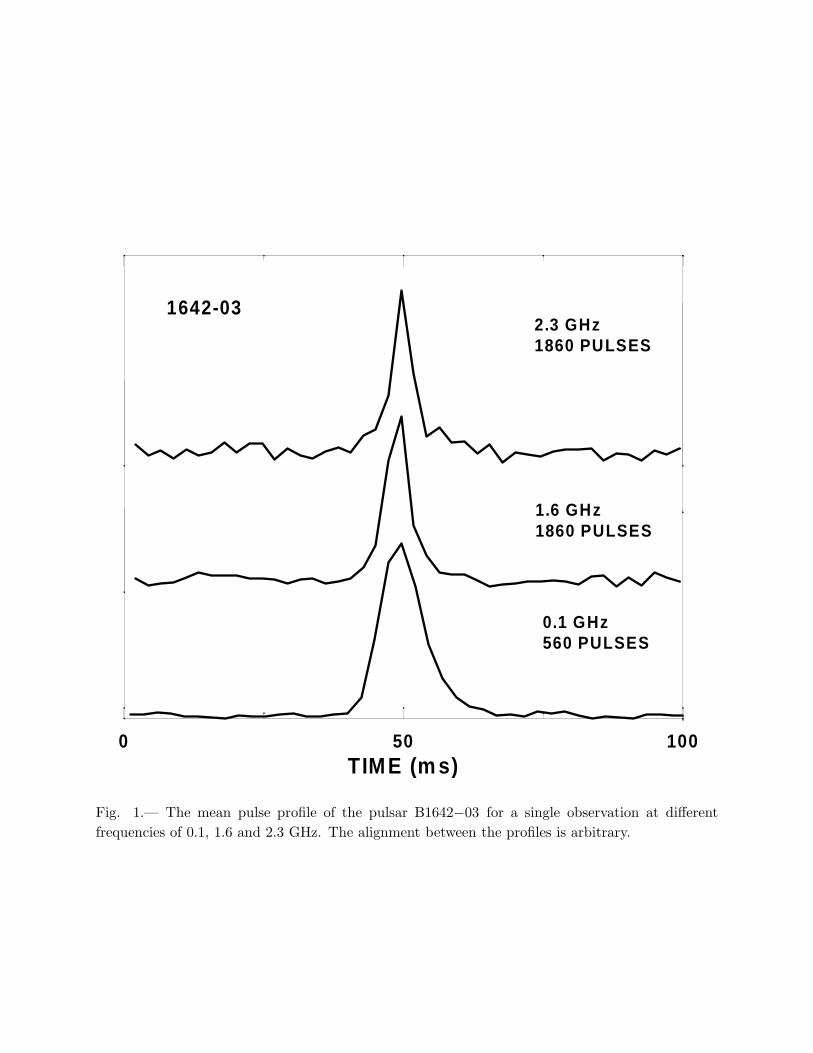
The mean pulse profiles of the pulsar B1642−03 for a single observation at different observing
frequencies are shown in Figure 1.
3. Timing analysis and results
The topocentric arrival times collected at JBO, HartRAO and PRAO and the geocentric
arrival times obtained from the archival JPL timing data (Downs & Reichley 1983; Downs &
Krause-Polstorff 1986) were all referred to the Solar System barycenter at infinite frequency using
a standard pulsar timing technique (Manchester & Taylor 1977). This involved the use of the JPL
DE200 ephemeris and the position given by Downs & Reichley (1983), together with a proper
motion equal to zero. A second-order polynomial describing secular spin-down pulsar behaviour
was fitted to the barycentric arrival times to obtain residuals from a timing model. The timing
residuals derived as the observed times minus the predicted ones were used for improving the
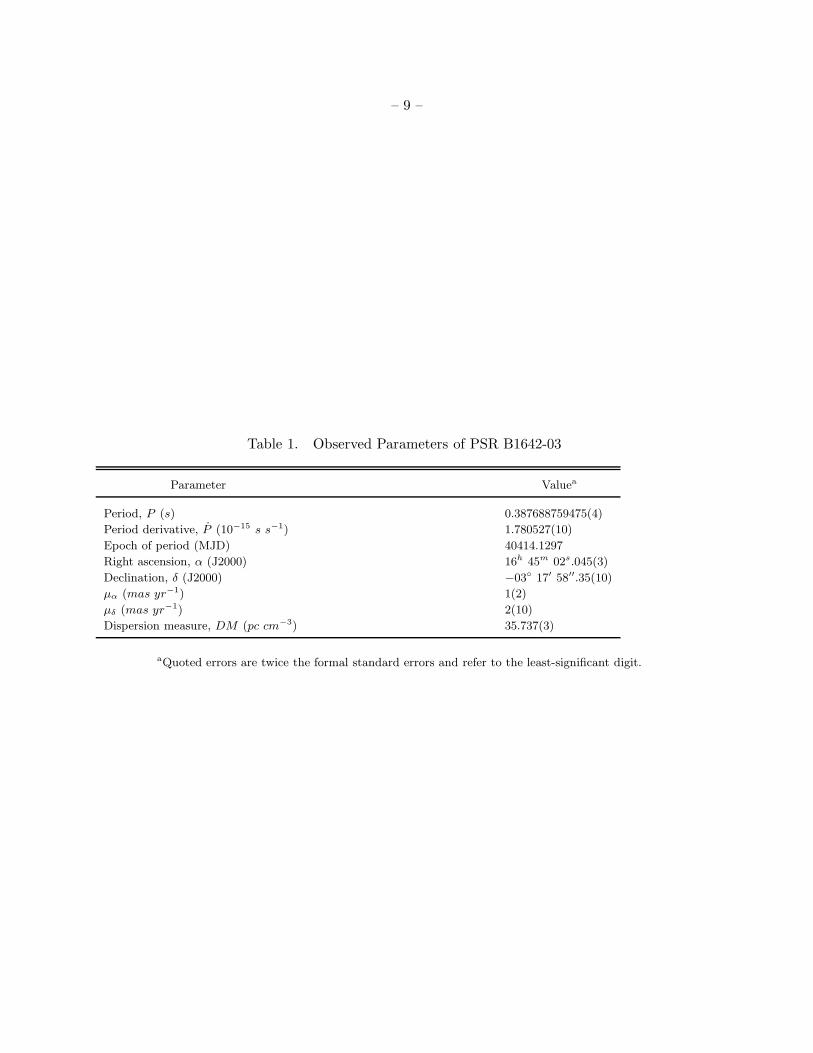
astrometric and the spin-down parameters of the pulsar. Measured timing parameters are shown
in Table 1. The period and the period derivative were determined from the entire interval of
observations from 1969 to 1999 (fit interval MJD 40414 - 51450). Analysis of the timing residuals
showed that the pulsar has a proper motion close to zero. Recent analysis of Martin (1999)
confirmed that the proper motion is 12 ± 8 milliarcsec/year and barely significant. The pulsar
catalog (Taylor, Manchester, & Lyne 1993) quotes a proper motion obtained by Lyne, Anderson,
& Salter (1982) as being much larger. However, their measurements have large errors and this, in
principle, does not exclude a possibility that the proper motion may be zero. The observations of
the pulsar in the range 0.1 - 1.6 GHz permitted to determine the dispersion measure with high
accuracy.
– 4 –
3.1. Timing residuals of PSR B1642−03
Figure 2 shows the timing residuals of PSR B1642−03 after removing the second-order
polynomial from the combined JPL, JBO, HartRAO and PRAO data set of the barycentric arrival
times. As can be seen, the timing residuals for PSR B1642−03 exhibit oscillatory behaviour and
more than 6 cycles are observed over the entire 30-yr data span. The central part of the residual
curve has a one year gap between 1983 July and 1984 August, but nevertheless, it gives adequate
information. The curve presents fluctuations whose amplitudes initially increase and then fade.
The amplitude of the cycles varies between 15 ms and 80 ms and the spacing of maxima varies
between 3 years and 7 years. It will be noticed that the larger amplitudes correspond to the larger
spacings. The curve is asymmetric with respect to the axis X.
The observed cyclical changes are atypical of most timing noise seen from radio pulsars. Most
timing noise is consistent with red, stochastic noise that is aperiodic. The timing residuals from
PSR B1642−03 are not strictly periodic but are sufficiently cyclical that it is plausible to interpret
them as the result of a wobble of the spin axis of the pulsar. Figure 2 demonstrates that the shape
of the residual curve is robust against the particular length of the data set that is analyzed. The
general character of the variations which was found earlier by Cordes & Downs (1985, Fig.10l) for
the interval 1969 - 1981 remained the same in our plot despite the extension of our data span to
30 years.
3.2. Analysis of the spin-down parameters of PSR B1642−03
For a more detailed analysis of the variations, we demonstrate changes of the spin-down
parameters P and P versus time together with the timing residuals in Figure 3. The rotation
period, P , and the period derivative, P , were calculated from the local fits, performed over
intervals of 200 days which overlapped by 100 days. The timing residuals shown in the lower
plot were transformed into a uniform curve by averaging the residuals over 40-day intervals. The
empty intervals were filled with numbers, derived by linear interpolation of average values of
residuals taken from the nearest adjacent intervals. Such a procedure did not deform the initial
curve, since the averaging time was considerably less than the timescale of cyclic changes. As is
seen, the plotted period residuals, ∆P , and the period derivative residuals, ∆P , exhibit cyclical
behaviour and the observed variations in the period derivative P make up about 2% of the mean
value of 1.78 × 10⁻¹⁵. The variations in some cycles are similar in form, although these cycles do
not exhibit a strict periodicity in their recurrence. Besides, the gap in the centre of these plots
makes the picture of the changes incomplete. The variations in rotation parameters can cause
the variations in the pulse shape of the pulsar. An analysis of the JBO data to reveal long-term
variations in the pulse shape showed no significant pulse profile changes. However the precision
of the measurements does not preclude the possibility of changes of the magnitude claimed by
Blaskiewicz (1991). Any pulse shape changes at the low frequency of 0.1 GHz may not be noticed

– 5 –
because the mean pulse profile has a simple shape.
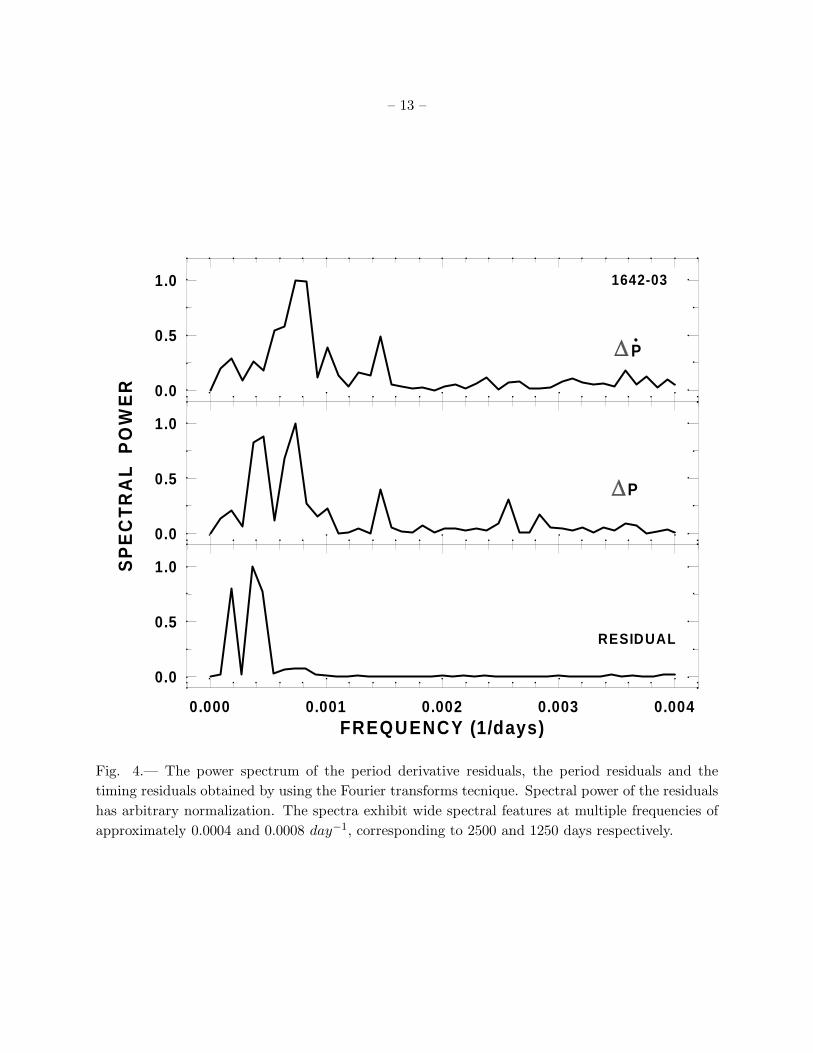
In order to find periodicities contained in these time sequences, the power spectrum was
computed using the Fourier transform. The results are given in Figure 4. There are two wide
spectral features at around 0.0004 and 0.0008 day−1, which are visible in the spectrum of all the
three sequences. They have an identical amplitude in the spectrum of ∆P , whereas the spectrum
of ∆P exhibits more distinctly the second feature at around 0.0008 day−1 and the residual
spectrum shows more clearly the first feature at 0.0004 day−1. These spectral frequencies are
multiple and correspond to the periods of 2500 and 1250 days respectively. The features are wide
because the timing residuals seen in Figure 2 are clearly not a strict periodic function of time.
The spectral feature at around 0.00018 day−1 in the residual plot could be due to the envelope of
the timing residual curve. The spectra of residuals ∆P and ∆P also exhibit the feature at around
0.0015 day−1 corresponding to the period of 667 days.
3.3. Analysis of multifrequency observations of the pulsar
Since 1991, the pulsar rotation has been monitored by JBO, HartRAO and PRAO and the
timing residuals of PSR B1642−03 for these quasi-simultaneous observations in the frequency
range 0.1 - 2.3 GHz are shown in Figure 5. The common span covers almost two cycles of the
oscillatory timing residuals. Although the high- and low-frequency residual curves are similar
in general form, at some phases of the cycle there is an appreciable time offset between the two
different residual curves. The time offset is calculated by subtracting the low-frequency timing
residuals from the high-frequency timing residuals averaged over about 40 days. This time offset
is shown in Figure 5b and has a weak quasi-sinusoidal variation with a maximum amplitude of ∼1
ms. This quasi-sine wave is, more or less, out of phase with the residual curve shown in Figure 5a.
At the maximum of the timing residual curve, the 0.1-GHz pulses arrive ∼1 ms later than the
pulses at high frequencies, and at the curve minimum, the 0.1-GHz pulses arrive earlier than
high-frequency pulses.
The 1-ms amplitude of the quasi-sinusoidal wave of the 0.1-GHz residuals may be interpreted
in two ways. Firstly, it may arise from a change in dispersion measure of ∼ 2.5 × 10⁻³ pc cm−3.
Alternatively, it may be interpreted as a result of changes in the time alignment of the low-
frequency and high-frequency profiles during a cycle of the timing residuals. It is very plausible
that the beam shapes are different at low- and high-frequencies so that the timing residuals could
have different shapes at the two frequencies.
4. Discussion
The pulsar B1642−03 is located above the galactic plane with b ∼ 26◦ and has a large
uncertainty in the distance from the Sun. The pulsar catalog (Taylor, Manchester, & Lyne
– 6 –
1993) quotes the dispersion measure-derived distance of 2900 pc with an uncertainty of ∼ 50%.
On the other hand, Prentice and ter Haar (1969) found for PSR B1642-03 a distance of about
160 pc taking into account the presence of the HII region along the line-of-sight to this pulsar
and its influence on the dispersion measure. Despite a large uncertainty in the distance, a
small proper motion suggests that this pulsar is a low-velocity object. The observed value of
µ = 0.′′002 ± 0.′′007 yr−1 implies a transverse pulsar velocity equal to 2 km s−1 and 30 km s−1 for
an assumed distances of 160 pc and 2900 pc respectively. This low-velocity pulsar has a galactic
z-distance of 70 pc and is inside the thin disk in which extreme Population I objects are born.
The most likely explanation for the cyclical timing residuals for the pulsar B1642−03 lies in
the precession of a neutron star. The spin axis of an isolated pulsar can precess, if a neutron star
has a non-spherical shape and its spin axis is not aligned with the symmetry axis. Free precession
will cause a cyclical change in the angle α between the spin axis and the magnetic moment. The
result will be cyclical variations in the spin-down torque acting on the pulsar and cyclical changes
in the observed pulse profile because the observer will view the pulsar beam from different angles
over the precession cycle (Pines & Shaham 1972; Shaham 1977; Nelson, Finn, & Wasserman 1990;
Cordes 1993). Suggestions that the correlated timing behaviour and variations in the pulse shape
might be related with the precessional effects were discussed earlier for some pulsars (Cordes 1993;
Suleymanova & Shitov 1994; D’Alessandro & McCulloch 1997). A unique result was recently
obtained for the pulsar PSR B1828−11 by Stairs, Lyne, & Shemar (2000). They reported the
discovery of long-term, highly periodic, correlated variations in both the pulse shape and rate
of slow-down of the pulsar PSR B1828−11. The authors explained these periodic changes by
precession of a neutron star spin axis caused by an asymmetry in the shape of the pulsar.
In the case of PSR B1642−03, we observe long-term variations only in the timing residuals
and do not see any profile shape changes in the range 0.1 - 1.6 GHz. Probably, the pulse shape
variations were not detected due to cyclical character of the changes and their small magnitude.
It should be noted that an analysis of the JPL data at 2.3 GHz done earlier by Blaskiewicz
(1991) showed that the pulse shape of the pulsar has slight periodic changes in the brightness of
the leading component with a period of about 1000 days. So, the pulse shape changes do exist
and their timescale agree well with our result. As was mentioned above, the spectral analysis
of the period derivative residuals for PSR B1642−03 indicates the presence of the periodicity of
about 1250 days. Therefore, the long-term variations in the pulsar rotation can be explained in
terms of free precession model as was suggested earlier by Cordes (1993). The measured 1-ms
quasi-sinusoidal time offset between the high- and low-frequency timing data over the cycle may
also testify that it is related to variations in the rotation of the pulsar.
In total, the spectra of the residuals for PSR B1642−03 exhibit a few wide spectral features at
multiple frequencies at around 0.0002, 0.0004 and 0.0008 day−1 that correspond to the periodicities
of approximately 5000, 2500 and 1250 days respectively. Note that these are some preferred
frequencies as the strict periodic behaviour of PSR B1642−03 is absent. Nevertheless, the multiple
character makes this result similar to the result obtained for the pulsar PSR B1828−11 (Stairs,

– 7 –
Lyne, & Shemar 2000), the spectra of which for the residuals and the pulse shape parameter
show harmonically related sinusoids with periods of approximately 1000, 500 and 250 days. The
presence of the multiple frequencies in the spectra of the residuals may testify by analogy with PSR
B1828−11 that it is related with precession of a neutron star spin axis. The observed variations
for PSR B1642−03 in the period derivative P make up 1.7%. We may estimate corresponding
changes in the angle α, using the vacuum dipole model, in which the slow-down rate P ∝ sin2 α.
Suggesting that α ∼ 60◦, the change of similar magnitude in sin2 α will give a variation in the
magnetic inclination angle α of 0.8 degrees. This value is very similar to that obtained by Cordes
(1993).
Observations of the long-term cyclical variations in the pulsar spin for PSR B1642−03 may
provide a valuable tool for investigating the problems of the neutron star structure. The occurrence
of free precession in neutron stars is highly problematic because of the superfluid interior (Shaham
1977; Shaham 1986; Sedrakian, Wasserman, & Cordes 1999). Glitches, which have observed in
several dozen mostly young pulsars, provide strong evidence that superfluid neutrons exist in
neutron stars and these are expected to damp out any free precession on timescales of several
hundred precession periods. However the clear correlated changes in pulse shape and slowdown
rate in B1828−11 and the observations presented here indicate that precession is indeed occurring.
A model will have to be devised which allows for precession to survive, even in the presence of
some superfluid vortices.
TVSH and JOU are grateful to the Director of HartRAO G.D. Nicolson for making the
HartRAO pulsar data available to them, and to C.S. Flanagan who set up the HartRAO pulsar
programme and acquired most of the data. TVSH thanks Yu.P. Shitov for valuable comments
and the staff of PRAO for help with the observations. This work was supported by grant INTAS
96-0154. JOU acknowledges the hospitality and support of HartRAO. IAU Commission 38 grant
enabled him to visit South Africa. The authors are grateful to the referee for helpful comments
and suggestions.
– 8 –
REFERENCES
D’Alessandro, F., & McCulloch, P. M. 1997, MNRAS, 292, 879
Blaskiewicz, M. M. 1991, Ph. D. Thesis, Cornell Univ.
Cordes, J. M., & Downs, G. S. 1985, ApJS, 59, 343
Cordes, J. M., 1993, in ASP Conf. Proc. 36, Planets around Pulsars, ed. J. A. Phillips, S. E.
Thorsett, & S. R. Kulkarni (San Francisco: ASP), 43
Downs, G. S., & Krause-Polstorff, J. 1986, ApJS, 62, 81
Downs, G. S., & Reichley, P. E. 1983, ApJS, 53, 169
Flanagan, C. S. 1993, MNRAS, 260, 643
Huguenin, G. R., & Taylor, J. H. 1969, IAU Circ., 2135
Lyne, A. G., Anderson, B., & Salter, M. J. 1982, MNRAS, 201, 503
Manchester, R. N., & Taylor, J. H. 1977, Pulsars (San Francisco: Freeman)
Martin, C. E. 1999, Ph. D. Thesis, Manchester Univ.
Nelson, R. W., Finn, L. S., & Wasserman, I. 1990, ApJ, 348, 226
Pines, D., & Shaham, J. 1972, Nature Physical Science, 235, 43
Prentice, A. J. R., & ter Haar, D. 1969, MNRAS, 146, 423
Sedrakian, A., Wasserman, I., & Cordes, J. M. 1999, ApJ, 524, 341
Shabanova, T. V. 1998, A&A, 337, 723
Shabanova, T. V., & Urama, J. O. 2000, in Proc. IAU Col. 177, Pulsar Astronomy - 2000 and
Beyond, ed. M. Kramer, N. Wex, & R. Wielebinski (San Francisco: ASP), 99
Shaham, J. 1977, ApJ, 214, 251
Shaham, J. 1986, ApJ, 310, 780
Stairs, I. H., Lyne, A. G., & Shemar, S. L. 2000, Nature, 406, 484
Suleymanova, S. A., & Shitov, Yu. P. 1994, ApJ, 422, L17
Taylor, J. H., Manchester, R. N., & Lyne, A. G. 1993, ApJS, 88, 529
This preprint was prepared with the AAS LATEX macros v4.0.
– 9 –
Table 1. Observed Parameters of PSR B1642-03
Parameter Valuea
Period, P (s) 0.387688759475(4)
Period derivative, P (10−15 s s−1) 1.780527(10)
Epoch of period (MJD) 40414.1297
Right ascension, α (J2000) 16h 45m 02s.045(3)
Declination, δ (J2000) −03◦ 17′ 58′′.35(10)
µα (mas yr−1) 1(2)
µδ (mas yr−1) 2(10)
Dispersion measure, DM (pc cm−3) 35.737(3)
aQuoted errors are twice the formal standard errors and refer to the least-significant digit.
– 10 –
0 50 100TIM E (m s)
1642-032.3 GHz1860 PULSES
1.6 GHz1860 PULSES
0.1 GHz560 PULSES
Fig. 1.— The mean pulse profile of the pulsar B1642−03 for a single observation at different
frequencies of 0.1, 1.6 and 2.3 GHz. The alignment between the profiles is arbitrary.

– 11 –
40000 42000 44000 46000 48000 50000 52000M JD
-40
-20
0
20
40
60
RE
SID
UA
L (
ms)
1970 1980 1990 2000
1642-03
- JPL 2.3 GHz- JBO 0.4 - 1.6 GHz- HartRAO 1.6 or 2.3 GHz - PRAO 0.1 GHz
Fig. 2.— The timing residuals for PSR B1642−03 from the combined JPL, JBO, HartRAO and
PRAO data set over the interval from 1969 to 1999.

– 12 –
40000 42000 44000 46000 48000 50000 52000MJD
-40
-20
0
20
40
60
RE
SID
UA
L (
ms)
-0.6
-0.3
0.0
0.3
0.6
P (
ns)
-0.04
-0.02
0.00
0.02
P (
10
)
1970 1980 1990 2000
-15
1642-03
Fig. 3.— The period derivative residuals, ∆P , the period residuals, ∆P , and the timing residuals
over 30 years of observations relative to the spin-down model given in Table 1.
– 13 –
0.000 0.001 0.002 0.003 0.004FREQUENCY (1/days)
0.0
0.5
1.0
0.0
0.5
1.0
0.0
0.5
1.0 1642-03
RESIDUAL
P
P
SP
EC
TR
AL
PO
WE
R
Fig. 4.— The power spectrum of the period derivative residuals, the period residuals and the
timing residuals obtained by using the Fourier transforms tecnique. Spectral power of the residuals
has arbitrary normalization. The spectra exhibit wide spectral features at multiple frequencies of
approximately 0.0004 and 0.0008 day−1, corresponding to 2500 and 1250 days respectively.

– 14 –
48000 49000 50000 51000 52000M JD
-2
-1
0
1
2
Th
igh
- T
low
(m
s) DM=35.737 pc cm -3
-40
-30
-20
-10
0
10
20
RE
SID
UA
L (
ms)
1992 1994 1996 1998 2000
1642-03
JBO, HartRAO 0.6 - 2.3 GHz ( )PRAO 0.1 GHz ( )
(a)
(b)
Fig. 5.— Top: the timing residuals of PSR B1642−03 between 1991 March and 1999 October.
Bottom: the time-averaged differences in timing residuals obtained at high frequencies in the range
0.6 - 2.3 GHz and at the low frequency of 0.1 GHz.