Evidence for 20th century climate warming and … for 20th century climate warming and wetland...
12
Evidence for 20th century climate warming and wetland drying in the North American Prairie Pothole Region Brett A. Werner 1 , W. Carter Johnson 2 & Glenn R. Guntenspergen 3 1 Department of Environmental Studies, Public Affairs Center 309, University of Illinois, One University Plaza, Springfield, Illinois 62703 2 Department of Natural Resource Management, South Dakota State University, NPBL 138 Box 2140B, Brookings, South Dakota 57007 3 U.S. Geological Survey, Patuxent Wildlife Research Center, Laurel, Maryland 20708 Keywords Climate change, cover cycle, hindcasting, North American wetlands, PPR, Prairie Pothole Region, prairie wetlands, simulation, wetlands. Correspondence Brett Werner, Environmental Studies, Centre College, 600 West Walnut Street, Danville, KY 40422. Tel: 859-238-6502; Fax: 859-238- 5774; E-mail: [email protected] Present address Brett A. Werner, Environmental Studies, Centre College, 600 West Walnut Street, Danville, Kentucky, 40422 Funding Information This study was supported by U.S. Environmental Protection Agency (EPA), Science to Achieve Results (STAR) program, managed by the EPA’s Office of Research and Development, National Center for Environmental Research, U.S. Geological Survey Global Change Research Program. Received: 20 February 2013; Revised: 11 July 2013; Accepted: 15 July 2013 Ecology and Evolution 2013; 3(10): 3471– 3482 doi: 10.1002/ece3.731 Abstract The Prairie Pothole Region (PPR) of North America is a globally important resource that provides abundant and valuable ecosystem goods and services in the form of biodiversity, groundwater recharge, water purification, flood atten- uation, and water and forage for agriculture. Numerous studies have found these wetlands, which number in the millions, to be highly sensitive to climate variability. Here, we compare wetland conditions between two 30-year periods (1946–1975; 1976–2005) using a hindcast simulation approach to determine if recent climate warming in the region has already resulted in changes in wetland condition. Simulations using the WETLANDSCAPE model show that 20th cen- tury climate change may have been sufficient to have a significant impact on wetland cover cycling. Modeled wetlands in the PPR’s western Canadian prai- ries show the most dramatic effects: a recent trend toward shorter hydroperiods and less dynamic vegetation cycles, which already may have reduced the productivity of hundreds of wetland-dependent species. Introduction Freshwater wetlands are among the world’s most valu- able but vulnerable ecosystems (Costanza et al. 1997; Millenium Ecosystem Assessment 2005b; Zedler and Kercher 2005; Gitay et al. 2011). The Prairie Pothole Region (PPR) of North America, a 750,000 km 2 area embedded with 5–8 million wetland basins of recent glacial origin occurring in a grassland climate (Fig. 1), is one of eleven large wetland ecoregions identified worldwide as conservation priorities (Keddy et al. 2009). PPR wetlands are best known as prime nesting and migratory habitat for waterfowl (Mann 1974; Murkin et al. 2000; Millenium Ecosystem Assessment 2005b; Gleason et al. 2008), but they provide other important ecosystem goods and services including flood retention, groundwater recharge, water purification, recreation, agriculture, and regional biodiversity (Galatowitsch and van der Valk 1998; van der Valk 2006; Euliss et al. 2010; Gleason et al. 2011). ª 2013 The Authors. Ecology and Evolution published by John Wiley & Sons Ltd. This is an open access article under the terms of the Creative Commons Attribution License, which permits use, distribution and reproduction in any medium, provided the original work is properly cited. 3471
Transcript of Evidence for 20th century climate warming and … for 20th century climate warming and wetland...

Evidence for 20th century climate warming and wetlanddrying in the North American Prairie Pothole RegionBrett A. Werner1, W. Carter Johnson2 & Glenn R. Guntenspergen3
1Department of Environmental Studies, Public Affairs Center 309, University of Illinois, One University Plaza, Springfield, Illinois 627032Department of Natural Resource Management, South Dakota State University, NPBL 138 Box 2140B, Brookings, South Dakota 570073U.S. Geological Survey, Patuxent Wildlife Research Center, Laurel, Maryland 20708
Keywords
Climate change, cover cycle, hindcasting,
North American wetlands, PPR, Prairie
Pothole Region, prairie wetlands, simulation,
wetlands.
Correspondence
Brett Werner, Environmental Studies, Centre
College, 600 West Walnut Street, Danville,
KY 40422. Tel: 859-238-6502; Fax: 859-238-
5774; E-mail: [email protected]
Present address
Brett A. Werner, Environmental Studies,
Centre College, 600 West Walnut Street,
Danville, Kentucky, 40422
Funding Information
This study was supported by U.S.
Environmental Protection Agency (EPA),
Science to Achieve Results (STAR) program,
managed by the EPA’s Office of Research
and Development, National Center for
Environmental Research, U.S. Geological
Survey Global Change Research Program.
Received: 20 February 2013; Revised: 11 July
2013; Accepted: 15 July 2013
Ecology and Evolution 2013; 3(10): 3471–
3482
doi: 10.1002/ece3.731
Abstract
The Prairie Pothole Region (PPR) of North America is a globally important
resource that provides abundant and valuable ecosystem goods and services in
the form of biodiversity, groundwater recharge, water purification, flood atten-
uation, and water and forage for agriculture. Numerous studies have found
these wetlands, which number in the millions, to be highly sensitive to climate
variability. Here, we compare wetland conditions between two 30-year periods
(1946–1975; 1976–2005) using a hindcast simulation approach to determine if
recent climate warming in the region has already resulted in changes in wetland
condition. Simulations using the WETLANDSCAPE model show that 20th cen-
tury climate change may have been sufficient to have a significant impact on
wetland cover cycling. Modeled wetlands in the PPR’s western Canadian prai-
ries show the most dramatic effects: a recent trend toward shorter hydroperiods
and less dynamic vegetation cycles, which already may have reduced the
productivity of hundreds of wetland-dependent species.
Introduction
Freshwater wetlands are among the world’s most valu-
able but vulnerable ecosystems (Costanza et al. 1997;
Millenium Ecosystem Assessment 2005b; Zedler and
Kercher 2005; Gitay et al. 2011). The Prairie Pothole
Region (PPR) of North America, a 750,000 km2 area
embedded with 5–8 million wetland basins of recent
glacial origin occurring in a grassland climate (Fig. 1),
is one of eleven large wetland ecoregions identified
worldwide as conservation priorities (Keddy et al. 2009).
PPR wetlands are best known as prime nesting and
migratory habitat for waterfowl (Mann 1974; Murkin
et al. 2000; Millenium Ecosystem Assessment 2005b;
Gleason et al. 2008), but they provide other important
ecosystem goods and services including flood retention,
groundwater recharge, water purification, recreation,
agriculture, and regional biodiversity (Galatowitsch and
van der Valk 1998; van der Valk 2006; Euliss et al.
2010; Gleason et al. 2011).
ª 2013 The Authors. Ecology and Evolution published by John Wiley & Sons Ltd.
This is an open access article under the terms of the Creative Commons Attribution License, which permits use,
distribution and reproduction in any medium, provided the original work is properly cited.
3471

Research has shown these wetlands to be especially vul-
nerable to climate warming (Poiani and Johnson 1991,
1993; Larson 1995; Sorenson et al. 1998; Johnson et al.
2005); projections for a doubling of atmospheric CO2
indicate major drying out of wetlands, thus disrupting or
slowing the vegetation cover cycle that regulates wetland
ecosystem primary and secondary productivity (Johnson
et al. 2010). All research to date on climate change and
prairie wetlands has focused on the future projections
and sensitivity to climate change; here we utilize the same
simulation model previously used to make future projec-
tions, but we develop a hindcast approach to detect if
warming in the PPR may have been sufficient to have ini-
tiated wetland drying and thereby reduced the potential
for biological productivity.
The relationship between climate’s geographical and
temporal variability and prairie wetland dynamics and
productivity is complex. Two climatic gradients intersect
to drive regional-scale biodiversity and productivity across
the PPR: a steep west to east precipitation gradient and a
more gradual north to south temperature gradient. These
orthogonal climatic gradients produce a systematic north-
west to southeast gradient of increasing wetness. Average
annual precipitation and air temperature range from
400 mm and 2°C near Saskatoon, Saskatchewan to
900 mm and 9°C near Algona, Iowa (Millett et al. 2009).
These climatic gradients exhibit temporal variability, with
well-known wet and dry interannual cycles.
This dynamic climate, ranging from drought to deluge,
interacts with variable wetland bathymetry to produce
wetlands that range widely in hydroperiod and vegetation
dynamics over space and time (Winter and Rosenberry,
1998; Johnson et al. 2004). Clusters of three main hydro-
logic permanence types (semi-permanent, seasonal, and
temporary wetlands) form wetland complexes (Weller
1988; Johnson et al. 2010), which are often hydrologically
connected by surface or groundwater (Winter and
Rosenberry 1995; Murkin et al. 2000) and ecologically
linked by highly vagile organisms seeking food, water,
and cover (Naugle et al. 2001).
The prairie wetland cover cycle, described for the
longer hydroperiod, semi-permanent wetlands, has been
divided into four stages: dry stage with low or no stand-
ing water; regenerating stage with reflooding and vegeta-
tive propagation; degenerating stage when emergent
plants begin to decline; and the lake stage with deep water
and little emergent vegetation (van der Valk and Davis
1978; Johnson et al. 2004). The extremes of the cycle
Figure 1. The Prairie Pothole Region (PPR) encompasses parts of five U.S. states and three Canadian provinces. Weather stations with long-term
(≥100 years) climate datasets are identified (adapted from Fig. 1 in Johnson et al. 2010).
3472 ª 2013 The Authors. Ecology and Evolution published by John Wiley & Sons Ltd.
Drying of North American Pothole Wetlands B. A. Werner et al.

(drought and deluge) cause plant population turnover
and nutrient release that maintain high primary and
secondary productivity (van der Valk and Davis 1978;
Euliss et al. 1999; Swanson et al. 2003; Johnson et al.
2005). To illustrate, low water and occasional drying of
the wetland bottom during droughts stimulate plant
recruitment from a diverse seed bank and mobilize nutri-
ents through decomposition. Conversely, high water dur-
ing deluges causes mortality of emergent plants and
creates greater interspersion of emergent cover and open
water. The transitional stages (regenerating and degener-
ating) are referred to as hemi-marshes covered by approx-
imately equal proportions of open water and emergent
vegetation; the hemi-marsh condition is considered to be
the most productive. Total productivity during a single
cover cycle may vary 20-fold (Johnson et al. 2005). Indi-
cators of the status of the cover cycle for a given wetland
and climate are the return time and the number of
switches between cover cycle stages (Johnson et al. 2010).
The status of the vegetation cover cycle may be the best
single indicator of a wetland complex’s overall (primary
and secondary) productivity under a given climate (John-
son et al. 2010), and here we focus on semi-permanent
wetland cover cycling to track dynamics throughout the
wetland complex.
While wetlands in the PPR provide numerous ecosys-
tem goods and services, land use change has degraded
large portions of the region and made the PPR as a whole
more vulnerable to future wetland losses, climate variabil-
ity, and climate change. Approximately half of the natural
wetland basins in the PPR were drained many decades
ago for agricultural and urban uses (Tiner 1984; Dahl
2000, 2006, 2011). The proportion of wetlands drained
follows the moisture (and hence cropland productivity)
gradient; nearly all prairie wetlands in the subhumid cli-
mate of Iowa and western Minnesota have been drained,
while at present the majority remain intact in the drier,
central Dakotas and in the western Canadian Prairies
(Johnson et al. 2008), although drainage has continued in
both areas (Environment Canada 1991; Dahl and Watm-
ough 2007; Bartzen et al. 2010; Oslund et al. 2010). Fur-
thermore, the ecological functions of many remaining
wetlands have been impacted by invasive species, habitat
conversion, overgrazing, and by farming in dry years
(Gleason and Euliss 1998; Guntenspergen et al. 2002;
Gleason et al. 2003; van der Valk 2006).
The PPR has warmed in the past century at a level sim-
ilar to that of the global average (Millett et al. 2009).
Considerably more warming is expected in the future.
The Intergovernmental Panel on Climate Change (IPCC
2007) projected a 1.8–4.0°C increase in the mean tem-
perature of the Earth’s atmosphere by the year 2100.
Climate projections for the approximate PPR are temper-
ature increases near 4.0°C and shifts of �5% to 10% in
precipitation (IPCC 2007). Increased frequency of both
drought and deluge are also anticipated due to an intensi-
fied hydrologic cycle (Ojima and Lackett 2002; Johnson
et al. 2004). Millett et al. (2009) found that some PPR
climate stations became warmer and drier during the
20th century, leading to speculation that wetlands may
already exhibit a climate change signature. However,
long-term monitoring data are inadequate across the PPR
to detect broad trends in wetland function (Conly and
Van Der Kamp 2001).
In this study, the WETLANDSCAPE (WLS) model of the
wetland complex (Johnson et al. 2010) was used to simu-
late historic wetland conditions and to determine if recent
warming has been sufficient to impact wetland function.
A cover cycle index (CCI) was incorporated into WLS to
evaluate a range of climate–wetland interactions (Johnson
et al. 2010). Our hindcast approach compares wetland
conditions between two time periods during the second
half of the 20th century (1946–1975; 1976–2005).
Methods
WLS was built on twenty years of research in wetland
simulation modeling (Poiani and Johnson 1993; Poiani
et al. 1995, 1996; Johnson et al. 2004, 2005; Voldseth
et al. 2007, 2009; Johnson et al. 2010). WLS 1.0 uses the
Stella platform (ISEE Systems, Lebanon, NH) and is a
process-based, deterministic, multiple-basin wetland
model constructed to address the effects of climate vari-
ability and land use on landscape-scale wetland dynamics.
WLS simulates wetland surface water, groundwater, and
vegetation dynamics of wetland complexes.
Model inputs include wetland bathymetry, soil proper-
ties, overflow among basins, and climate (10-day averages
of temperature and 10-day sums of precipitation). In
WLS, water moves through the wetland complex, entering
the surface water as precipitation, runoff, infiltration, per-
colation, and groundwater, and leaving the surface water
basin through evapotranspiration, overflow, and seepage
(Fig. 2). At each 10-day time step, depths of surface water
and local groundwater are calculated, and from these sur-
face water depth-duration relationships, wetland functions
and processes such as the vegetation cover cycle are simu-
lated and described.
Model calibration and validation used 20 years of
observation data at the Orchid Meadows field research
site, creating a modeled landscape of three temporary
basins, three seasonal basins, and three semi-permanent
basins (Johnson et al. 2010). Simulations of water levels
and cover cycle classes for this wetland complex at each
of the 19 long-term climate stations might obscure differ-
ences in soils and bathymetry (Winter 2000), but can
ª 2013 The Authors. Ecology and Evolution published by John Wiley & Sons Ltd. 3473
B. A. Werner et al. Drying of North American Pothole Wetlands

show the relative impact of climate on wetland function
(Johnson et al. 2005, 2010), particularly given that field
observations occurred during both drought and deluge
cycles (Johnson et al. 2004).
In this study, WLS simulated three cover classes (lake
marsh, dry marsh, and hemi-marsh combined from
regenerating and degenerating stages in Fig. 3). Shifts
between cover classes occur when weather conditions
cause water depth and duration to cross thresholds
(Table 1). Using a Markov-based approach, each of the
three simulated semi-permanent basins remains in a cover
class until these hydrologic conditions are met: for exam-
ple, a basin in dry marsh switches to hemi-marsh when
water levels are between 0.4 and 1.0 m for 1.5 years of
the ice-free season, and then switches to lake marsh when
the maximum depth remains above 0.75 m for 2 years.
The CCI serves as the primary metric of wetland
functional dynamics in WLS and is based on two vari-
ables given equal weight: the proportion of time, averaged
across three semi-permanent WLS wetlands, spent in the
hemi-marsh stage during the simulation period (in this
case, 30 years), and the average number of cover cycle
state changes (i.e., switches) between cover cycle classes
over the same time period (Johnson et al. 2010).
CCI ¼ ðHM=HM0 þ SW=SW0Þ=2 (1)
Figure 2. Main hydrologic variables computed
by WLS for a prairie wetland complex. ET,
evapotranspiration; GW, groundwater (adapted
from Fig. 2 in Johnson et al. 2010).
Figure 3. The cover cycle of semipermanent
wetlands is driven by drought and deluge
episodes. Extended low surface water periods
create dry marsh conditions, while protracted
high water floods out vegetation, leading to
lake marsh conditions. Normal rainfall allows
for hemi-marsh conditions, a category that
includes both regenerating and degenerating
marsh stages (adapted from Fig. 8 in Poiani
and Johnson 1991).
3474 ª 2013 The Authors. Ecology and Evolution published by John Wiley & Sons Ltd.
Drying of North American Pothole Wetlands B. A. Werner et al.

Where CCI is the Cover Cycle Index; HM is the propor-
tion of three semi-permanent basins’ timesteps spent in
the hemi-marsh stage; HM’ is the maximum proportion
of time spent in the hemi-marsh stage across the simula-
tions; SW is the number of switches in cover classification
stage among the wetland basins; and SW’ is the maxi-
mum number of switches across the simulations.
Each of the two components of CCI was scaled to a
value between zero (0) and one (1) and then averaged.
This yields an index that approaches one (1) when a sim-
ulated wetland complex underwent many switches among
cover cycle classes and had a high proportion of timesteps
in the hemi-marsh stage. The index approaches zero (0)
when a wetland complex has few switches and propor-
tionally few timesteps spent in the hemi-marsh stage. Cli-
mate drives the cover cycle (Weller and Spatcher 1965;
Murkin et al. 2000), determining the speed at which
semi-permanent wetlands switch among lake, dry, and
hemi-marsh conditions (van der Valk and Davis 1978).
Here, we divided simulations into two 30-year periods
(1946–1975 and 1976–2005). The World Meteorological
Organization, recognizes 30 years as a minimum number
of years to be averaged to qualify as climate data, in order
to minimize the role of yearly variability. More impor-
tantly for our purposes, CCI is an output variable capable
of comparing wetland functioning over decadal scales, a
time scale sufficient to capture wet–dry cycles. Finally,
such a split is similar to the comparisons used elsewhere
to detect the onset of climate change effects on ecosys-
tems (e.g., Cherkauer and Sinha 2010).
For each of the 19 climate stations and for both of the
30-year periods, we use equation (1) to calculate CCI, and
then we interpolate these CCI values across the PPR using
ArcGIS 10: Geostatistical Analyst’s kriging (ESRI, Red-
lands, CA). CCI scores are categorized as high (dark
green), medium (light green), and low (yellow), corre-
sponding to projected productivity of the semi-permanent
wetlands, based on the cover cycle. Color coding is based
only on the gradation of the CCI, not on other measures
(i.e., time spent in dry marsh or lake marsh). To interpret
patterns in clusters of climate stations, we grouped the cli-
mate stations by subregion: northwest (Poplar, MT; Medi-
cine Hat, AB; Saskatoon, SK; Regina, SK; Ranfurly, AB;
Muenster, SK), south central (Aberdeen, SD; Academy,
SD; Mitchell, SD; Watertown, SD; Brookings, SD), north-
east (Bottineau, ND; Minot, ND; Graysville, MB; Wahp-
eton, ND; Crookston, MN), and southeast (Morris, MN;
Webster City, IA; Algona, IA). Figure 4 summarizes the
methodological approach in a flow diagram.
Results
The hindcast analysis detected two main geographic shifts
in CCI scores across the PPR during the second half of
Table 1. Water depth thresholds required to produce switches
between cover cycle stages in WLS (after Poiani et al. 1995).
Current stage New stage Maximum depth (meters) Duration
Lake marsh Hemi-marsh <0.5 May–July
Hemi-marsh Lake marsh >0.75 2 years
Hemi-marsh Dry marsh <0.1 May–July
Dry marsh Hemi-marsh Between 0.4 and 1.0 1.5 years
Dry marsh Lake marsh >0.75 2 years
Figure 4. Flow diagram outlines the
methodological approach, including field
observations and calibration, modeling
approach to hydrology and cover cycle, and
simulation assumptions along with input
variables.
ª 2013 The Authors. Ecology and Evolution published by John Wiley & Sons Ltd. 3475
B. A. Werner et al. Drying of North American Pothole Wetlands
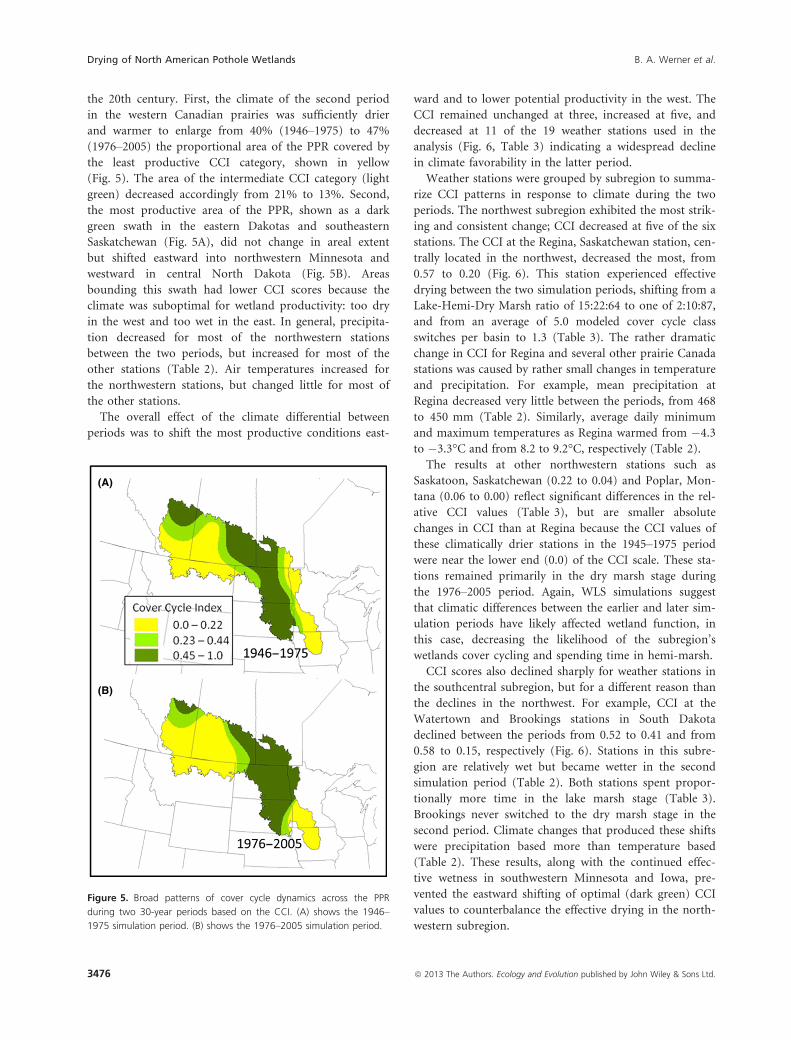
the 20th century. First, the climate of the second period
in the western Canadian prairies was sufficiently drier
and warmer to enlarge from 40% (1946–1975) to 47%
(1976–2005) the proportional area of the PPR covered by
the least productive CCI category, shown in yellow
(Fig. 5). The area of the intermediate CCI category (light
green) decreased accordingly from 21% to 13%. Second,
the most productive area of the PPR, shown as a dark
green swath in the eastern Dakotas and southeastern
Saskatchewan (Fig. 5A), did not change in areal extent
but shifted eastward into northwestern Minnesota and
westward in central North Dakota (Fig. 5B). Areas
bounding this swath had lower CCI scores because the
climate was suboptimal for wetland productivity: too dry
in the west and too wet in the east. In general, precipita-
tion decreased for most of the northwestern stations
between the two periods, but increased for most of the
other stations (Table 2). Air temperatures increased for
the northwestern stations, but changed little for most of
the other stations.
The overall effect of the climate differential between
periods was to shift the most productive conditions east-
ward and to lower potential productivity in the west. The
CCI remained unchanged at three, increased at five, and
decreased at 11 of the 19 weather stations used in the
analysis (Fig. 6, Table 3) indicating a widespread decline
in climate favorability in the latter period.
Weather stations were grouped by subregion to summa-
rize CCI patterns in response to climate during the two
periods. The northwest subregion exhibited the most strik-
ing and consistent change; CCI decreased at five of the six
stations. The CCI at the Regina, Saskatchewan station, cen-
trally located in the northwest, decreased the most, from
0.57 to 0.20 (Fig. 6). This station experienced effective
drying between the two simulation periods, shifting from a
Lake-Hemi-Dry Marsh ratio of 15:22:64 to one of 2:10:87,
and from an average of 5.0 modeled cover cycle class
switches per basin to 1.3 (Table 3). The rather dramatic
change in CCI for Regina and several other prairie Canada
stations was caused by rather small changes in temperature
and precipitation. For example, mean precipitation at
Regina decreased very little between the periods, from 468
to 450 mm (Table 2). Similarly, average daily minimum
and maximum temperatures as Regina warmed from �4.3
to �3.3°C and from 8.2 to 9.2°C, respectively (Table 2).
The results at other northwestern stations such as
Saskatoon, Saskatchewan (0.22 to 0.04) and Poplar, Mon-
tana (0.06 to 0.00) reflect significant differences in the rel-
ative CCI values (Table 3), but are smaller absolute
changes in CCI than at Regina because the CCI values of
these climatically drier stations in the 1945–1975 period
were near the lower end (0.0) of the CCI scale. These sta-
tions remained primarily in the dry marsh stage during
the 1976–2005 period. Again, WLS simulations suggest
that climatic differences between the earlier and later sim-
ulation periods have likely affected wetland function, in
this case, decreasing the likelihood of the subregion’s
wetlands cover cycling and spending time in hemi-marsh.
CCI scores also declined sharply for weather stations in
the southcentral subregion, but for a different reason than
the declines in the northwest. For example, CCI at the
Watertown and Brookings stations in South Dakota
declined between the periods from 0.52 to 0.41 and from
0.58 to 0.15, respectively (Fig. 6). Stations in this subre-
gion are relatively wet but became wetter in the second
simulation period (Table 2). Both stations spent propor-
tionally more time in the lake marsh stage (Table 3).
Brookings never switched to the dry marsh stage in the
second period. Climate changes that produced these shifts
were precipitation based more than temperature based
(Table 2). These results, along with the continued effec-
tive wetness in southwestern Minnesota and Iowa, pre-
vented the eastward shifting of optimal (dark green) CCI
values to counterbalance the effective drying in the north-
western subregion.
(A)
(B)
Figure 5. Broad patterns of cover cycle dynamics across the PPR
during two 30-year periods based on the CCI. (A) shows the 1946–
1975 simulation period. (B) shows the 1976–2005 simulation period.
3476 ª 2013 The Authors. Ecology and Evolution published by John Wiley & Sons Ltd.
Drying of North American Pothole Wetlands B. A. Werner et al.

Changes in the balance between precipitation and tem-
perature at some northeast stations, especially at Minot
(ND), Graysville (MB), and Wahpeton (ND), produced
markedly higher CCI scores (Fig. 6) because conditions
either became slightly wetter or slightly drier (Table 2).
Only the northeastern subregion improved in cover cycle
dynamics in the 1976-2005 period. These results offer a
counterpoint to the apparent decline of potential produc-
tivity in the northwest.
The stations in the southeast subregion, the wettest of
all subregions, remained characteristically unproductive
throughout the 60-year simulation period by remaining in
the lake marsh stage and rarely able to cycle through the
dry and hemi-marsh cover classes (Fig. 6). CCI scores for
the Webster and Algona stations never rose above zero in
either period (Table 3). Air temperature differed little at
these stations between the periods; however, both stations
were considerably wetter in the later period (Table 2).
Table 2. Climate data comparisons for 19 PPR weather stations that show the 30-year means for yearly precipitation (mm) and 30-year means
for minimum and maximum daily air temperatures (°C).
Station Prec 46-75 Prec 76-05 Tmin 46-75 Tmin 76-05 Tmax 46-75 Tmax 76-05
Poplar, MT 406.2 402.2 �2.03 �1.03 13.03 14.23
Medicine Hat, AB 417.6 402.3 �1.47 �0.70 11.49 12.47
Saskatoon, SK 435.6 411.2 �4.59 �3.62 7.46 8.54
Regina, SK 467.6 450.3 �4.29 �3.34 8.23 9.23
Ranfurly, AB 518.1 516.7 �4.37 �3.06 7.13 8.24
Muenster, SK 465.2 477.7 �4.81 �3.63 6.06 7.07
Aberdeen, SD 540.7 620.5 �0.79 0.19 12.71 12.83
Academy, SD 640.5 696.3 1.74 1.57 15.97 15.60
Mitchell, SD 642.1 711.2 1.68 1.94 15.23 14.51
Watertown, SD 660.3 668.0 �0.62 0.32 11.73 12.21
Brookings, SD 641.3 706.7 �0.57 �0.10 12.71 12.07
Bottineau, ND 533.0 526.3 �3.81 �2.75 9.15 9.75
Minot, ND 640.5 696.3 �2.28 �1.43 10.16 10.62
Graysville, MB 614.0 650.0 �3.67 �2.68 8.36 9.33
Wahpeton, ND 653.3 669.3 �0.31 0.26 12.07 12.11
Crookston, MN 540.7 620.5 �1.94 �1.44 10.48 10.37
Morris, MN 713.5 774.2 �0.39 �0.12 11.14 11.50
Webster City, IA 891.7 1022.3 2.50 2.53 14.53 14.67
Algona, IA 870.8 927.0 1.95 2.22 13.92 13.61
Climate variable abbreviations are Prec, precipitation; Tmin, minimum temperature; Tmax, maximum temperature; 46-75, 1946–1975; 76-05,
1976–2005. State and province abbreviations are IA, Iowa; MN, Minnesota; MT, Montana; ND, North Dakota; SD, South Dakota; AB, Alberta;
MB, Manitoba; SK, Saskatchewan.
Figure 6. omparison of CCI scores between
two 30-year periods for 19 weather stations
grouped by subregion in the PPR.
ª 2013 The Authors. Ecology and Evolution published by John Wiley & Sons Ltd. 3477
B. A. Werner et al. Drying of North American Pothole Wetlands

In summary, the temperature and precipitation changes
between the two, 30-year normal periods varied consider-
ably across the relatively small PPR. Interestingly, the cli-
matically drier weather stations became drier and warmer,
while the wetter regions became wetter with minimal
change in temperature. The drier conditions in the north-
west and wetter conditions in the southeast combined to
steepen the west to east climatic gradient caused by the
rain shadow of the Rocky Mountains. The climatic differ-
ences between periods produced relatively large changes
in CCI, some stations cycling slower and some cycling
faster.
Discussion
Our hindcast modeling indicates that the recorded cli-
mate shifts during the two periods was of sufficient mag-
nitude to have produced large changes in wetland
productivity, as measured by the CCI index, in some sub-
regions of the PPR. The analysis presents a complex, yet
patterned, message regarding how semi-permanent wet-
lands have likely responded to recent shifts in climate.
The clearest signal came from the Canadian prairies and
adjacent U.S. border areas identified during earlier analy-
ses as highly sensitive to climate change (Johnson et al.
2005, 2010). An important secondary signal came from
the historically wetter northeastern PPR climate that
became more dynamic in the second time period.
The trends in the northwest subregion of the PPR
deserve special attention for three reasons: globally, eco-
systems at higher latitudes are expected to warm more
than those at lower latitudes (IPCC 2007); the climatically
dry western Canadian prairies historically have been char-
acterized as a “boom or bust” breeding ground for water-
fowl, situated on a climatic “knife edge” highly sensitive to
warming and drying (Johnson et al. 2010); analysis of
climate data show this PPR subregion to have warmed the
most during the 20th century (Millett et al. 2009). Reduc-
tions in productivity simulated by WLS associated with a
warmer and drier climate in the northwest subregion dur-
ing the period 1976–2005 provide evidence that the “knife
edge” threshold may have been crossed recently, meaning
that these areas may already be too dry for cover cycling
in the context of a 30-year simulation period.
Has the more favorable climate for wetlands in the
northeastern PPR counterbalanced the simulated decline
in the northwestern subregion? If functional wetlands were
abundant in the northeast the answer could be “yes.”
However, wetland inventory data show that the western
PPR has the highest functional (undrained) wetland densi-
ties and grassland habitat important for vertebrate life
cycles, while in the east nearly all wetlands have been
Table 3. Cover cycle index (CCI) values are shown for each PPR weather station and period, along with component variables.
Station
1946–1975 1976–2005
Lake Hemi Dry Switches/basin CCI Lake Hemi Dry Switches/basin CCI
Poplar, MT 0 1 99 0.67 0.06 0 0 100 0.00 0.00
Medicine Hat, AB 0 10 90 0.67 0.15 0 0 100 0.00 0.00
Saskatoon, SK 2 6 92 2.33 0.22 0 2 98 0.33 0.04
Regina, SK 15 22 64 5.00 0.57 2 10 87 1.33 0.20
Ranfurly, AB 25 41 34 4.33 0.71 31 30 39 3.33 0.53
Muenster, SK 20 34 46 3.33 0.57 9 41 50 2.33 0.57
Aberdeen, SD 21 51 28 4.00 0.78 39 56 4 3.67 0.82
Academy, SD 32 34 34 6.33 0.79 58 31 11 5.67 0.71
Mitchell, SD 13 25 62 4.33 0.56 66 13 21 5.00 0.49
Watertown, SD 64 36 0 2.33 0.52 81 17 2 3.33 0.41
Brookings, SD 54 30 16 4.00 0.58 92 8 0 1.00 0.15
Bottineau, ND 14 39 46 4.33 0.70 19 23 58 3.67 0.49
Minot, ND 28 15 57 3.00 0.36 42 31 28 4.00 0.59
Graysville, MB 59 14 26 2.67 0.33 60 40 0 2.67 0.59
Wahpeton, ND 57 13 31 3.00 0.34 31 61 8 4.00 0.89
Crookston, MN 48 52 0 1.67 0.63 36 54 10 3.00 0.75
Morris, MN 93 7 0 0.67 0.11 100 0 0 0.00 0.00
Webster City, IA 100 0 0 0.00 0.00 100 0 0 0.00 0.00
Algona, IA 100 0 0 0.00 0.00 100 0 0 0.00 0.00
Variables include the percentage of time spent in each of the three cover cycle classes (Lake: lake marsh; Hemi: hemi-marsh; Dry: dry marsh), and
the average number of switches per semipermanent basin (an average of three modeled basins). The time spent in hemi-marsh and the number
of switches are the two variables used to calculate CCI, and the time spent in lake marsh and dry marsh enable comparisons of the relative wet-
ness or dryness of model wetlands over each 30-year simulation period. See Table 2 for state and province abbreviations.
3478 ª 2013 The Authors. Ecology and Evolution published by John Wiley & Sons Ltd.
Drying of North American Pothole Wetlands B. A. Werner et al.

drained (Dahl 2000, 2006, 2011) and associated grassland
plowed up for agriculture (Samson et al. 2004; Hoekstra
et al. 2005; Stephens et al. 2005). So gains in the east could
only compensate for biological productivity declines in the
west if large numbers of drained wetlands were restored
and watersheds replanted with grassland (Galatowitsch and
van der Valk 1998; Zedler 2003). Until and even after such
a trend toward restoration is realized, grassland and wet-
land conservation in the Dakotas is important (Loesch
et al. 2012). Additionally, Wright and Wimberly (2013)
indicates that land use conversion of grasslands and wet-
lands to corn–soybean agriculture in the eastern Dakotas is
increasing, further compounding the effects of climate
change on prairie wetland ecosystems.
The pattern of change in CCI between the two 30-year
periods bears a striking resemblance to WLS projections
comparing CCI based on a 100-year (20th century) climate
data set for the PPR and that projected by a 2°C increase
in air temperature applied uniformly across all weather sta-
tions (Johnson et al. 2010). The area of the lowest CCI
scores expanded in the western Canadian prairies and the
most favorable category moved eastward. Splitting of the
data set into two 30-year periods revealed that the magni-
tude of climate change late in the 20th century was suffi-
cient to cause a productivity drop comparable to that
projected several decades into the future. In short, condi-
tions simulated for the warmer future may have already
arrived in the northernmost portion of the PPR.
The loss of wetland function is likely to have the largest
effect on animals requiring long wetland hydroperiods
(waterfowl, amphibians, and shorebirds) compared to
shorter hydroperiods (invertebrates, Johnson et al. 2010).
These findings align with other research done on Canada’s
western prairie provinces (Clair 1998; van Kooten et al.
2011; Withey and van Kooten 2011) where climate warm-
ing and human modifications have reduced the flows of
major rivers during the summer months (Schindler and
Donahue 2006). Dry regions, such as Canada’s western
prairie provinces, were identified in the Millenium Ecosys-
tem Assessment as hotspots for future environmental
degradation because of the effects of climate warming
and human activity (Millenium Ecosystem Assessment
2005a).
The global importance of wetlands in general, and Prai-
rie Pothole wetlands in particular, cannot be overstated.
The biodiversity that PPR wetlands support, regionally for
resident species, and globally for migratory bird species,
are the primary reason to closely monitor the status,
trends, and outlook of climate impacts on wetland func-
tioning. Given that these wetlands are already degraded in
certain geographic sectors of the PPR, and under contin-
ual threat to be further degraded in the remaining sectors,
the hindcast modeling approach of this paper is a valu-
able tool to discern and interpret the recent impacts of
climate change on wetlands, especially in the absence of
long-term, region-wide field data. Hindcast simulation
modeling should be a key addition to the wetland ecolo-
gist’s toolbox for determining the vulnerability of global
wetlands to climate change because of the geographic,
temporal, and financial limitations on field research.
We recommend that future research combine modeling
and monitoring in tandem to develop an “early warning”
detection system for climate change effects on prairie wet-
lands. Current wetland monitoring across the PPR is
inadequate to verify these WLS hindcast simulations.
Only three long-term wetland monitoring field sites (St.
Denis, SK; Cottonwood Lake, ND; Orchid Meadows, SD)
with greater than 10 years of continuous records exist in
the PPR; records from none of these three stations spans
the 60-year period examined in this study. And these sites
represent an ad hoc network and are not part of a institu-
tionalized monitoring effort. Further, data from the
4-mile2 (Johnson and Grier 1988) and May Pond data
sets (Cowardin et al. 1995), while spatially robust and
containing many years of data, offer only a snapshot of
wetland conditions in any year since water condition in
these wetlands are only monitored once a year, and are
thereby less useful to judge the impacts of climate warm-
ing on wetland water budgets in ways that could make
spring ice-out times earlier and stronger summer draw-
downs due to increased evapotranspiration. Wetland sci-
entists have called for more extensive long-term
monitoring across the PPR to detect future climate
change impacts (Conly and Van Der Kamp 2001; Johnson
et al. 2004, 2005; Dahl and Watmough 2007; Johnson
et al. 2010; Niemuth et al. 2010). Monitoring data from
these long-term stations and other field monitoring pro-
grams need to be institutionalized, standardized where
possible, and made available to the wetland science com-
munity. Bringing selected wildlife refuges in North Amer-
ica that possess historic wetland data into an integrated
monitoring system would be one approach to begin to fill
the large geographic gaps in the current network.
Modeling, as demonstrated in this paper, can identify
alternate futures based on the best science and data avail-
able, separate the climate signal from the considerable
“noise” present in the human-impacted prairie wetland
system, and make monitoring more streamlined and
purposeful by suggesting where and what to monitor.
Conversely, monitoring is needed to build accurate mod-
els, check projections, and to determine when models
have attained adequate levels of predictability to justify
scaling back or eliminating monitoring to reduce costs or
redirect effort to management solutions. Thus, monitor-
ing and modeling should be adapted as an iterative
process that improves model forecasting and optimizes
ª 2013 The Authors. Ecology and Evolution published by John Wiley & Sons Ltd. 3479
B. A. Werner et al. Drying of North American Pothole Wetlands

the cost of extensive and long-term monitoring programs.
Hindcast modeling and recent analysis of climate data
provide strong arguments for immediate development of
an early warning system to detect and understand the
nature of threats to this valued international resource.
Conclusions
Modeling indicates that freshwater wetlands of North
America’s PPR may have already been impacted by
climate change during the past 3 decades. This research
has shown that 20th century warming in the northern
latitudes of the PPR identified by previous studies has
been sufficient to have had significant impact on wetland
cover cycling, a key indicator of wetland productivity and
biodiversity. Because of climate change, the northwestern
PPR’s wetlands of Canada’s Western Prairie Provinces
may have been contributing less to migratory populations
of avifauna than it has in the past. An expanded program
of modeling and monitoring in tandem is proposed
for the PPR to produce an early warning system needed
to check on model predictions and to streamline moni-
toring.
Acknowledgments
Preliminary research for this manuscript was funded by
the U.S. Environmental Protection Agency (EPA), Science
to Achieve Results (STAR) program, managed by the
EPA’s Office of Research and Development, National
Center for Environmental Research, and the U.S. Geologi-
cal Survey Global Change Research Program. We thank
Phil Fay and anonymous reviewers for improvements
made to this draft, and the WETLANDSCAPE develop-
ment team for collaboration throughout the project,
including Richard Voldseth, Bruce Millett, David Naugle,
Mirela Tulbure, John Tracy, Rosemary Carroll, Richard
Adams, Ben Rashford, Craig Olawsky, and Jennifer Olker.
Any use of trade, product, or firm names is for descriptive
purposes only and does not imply endorsement by the
U.S. Government.
Conflict of Interest
None declared.
References
Bartzen, B. A., K. W. Dufour, R. G. Clark, and F. D. Caswell.
2010. Trends in agricultural impact and recovery of
wetlands in prairie Canada. Ecol. Appl. 20:525–538.
Cherkauer, K. A., and T. Sinha. 2010. Hydrologic impacts of
projected future climate change in the Lake Michigan
region. J. Great Lakes Res. 36(Suppl. 2):33–50.
Clair, T. A. 1998. Canadian freshwater wetlands and climate
change. Clim. Change 40:163–165.
Conly, F. M., and G. Van Der Kamp. 2001. Monitoring the
hydrology of Canadian prairie wetlands to detect the effects
of climate change and land use changes. Environ. Monit.
Assess. 67:195–215.
Costanza, R., R. D’arge, R. De Groot, S. Farber, M. Grasso,
B. Hannon, et al. 1997. The value of the world’s ecosystem
services and natural capital. Nature 387:253–260.
Cowardin, L. M., T. L. Shaffer, and P. M. Arnold. 1995.
Evaluations of duck habitat and estimation of duck
population size with remote-sensing-based system.
Biological Sciences Report 2. US Department of Interior,
Washington.
Dahl, T. E. 2000. Status and trends of wetlands in the
conterminous United States 1986 to 1997. U.S. Department
of the Interior, Fish and Wildlife Service, Washington, DC.
Dahl, T. E. 2006. Status and trends of wetlands in the
conterminous United States 1998 to 2004. U.S. Department
of the Interior, Fish and Wildlife Service, Washington, DC.
Dahl, T. E. 2011. Status and trends of wetlands in the
conterminous United States 2004 to 2009. U.S. Department
of the Interior, Fish and Wildlife Service, Washington, DC.
Dahl, T. E., and M. D. Watmough. 2007. Current approaches
to wetland status and trends monitoring in prairie Canada
and the continental United States of America. Can. J.
Remote Sens. 33:S17–S27.
Environment Canada. 1991. The federal policy on wetland
conservation.
Euliss, N. H., D. A. Wrubleski, and D. M. Mushet. 1999.
Wetlands of the Prairie Pothole Region: invertebrate species
composition, ecology, and management. Invertebr. Freshw.
Wetlands N. Am. Ecol. Manage. 471–514.
Euliss, N. H. Jr., L. M. Smith, S. Liu, W. G. Duffy,
S. P. Faulkner, R. A. Gleason, et al. 2010. Integrating
estimates of ecosystem services from conservation programs
and practices into models for decision makers. Ecol. Appl.
21:S128–S134.
Galatowitsch, S. M., and A. van der Valk. 1998. Restoring
prairie wetlands: an ecological approach. Iowa State Univ.
Press, Ames, IA.
Gitay, H., C. M. Finlayson, and N. C. Davidson. 2011.
A framework for assessing the vulnerability of wetlands to
climate change. Pp. 1–15 in M. F. Heather Mackay and N.
Davidson, eds. Ramsar technical report No. 5/CBD technical
series No. 57. Ramsar Convention Secretariat, Gland,
Switzerland & Montreal, Canada, Gland, Switzerland &
Secretariat of the Convention on Biological Diversity,
Montreal, Canada.
Gleason, R. A., N. H. Euliss; Northern Prairie Wildlife
Research Center. 1998. Sedimentation of prairie wetlands.
Northern Prairie Wildlife Research Center, Jamestown, ND.
Gleason, R., N. Euliss, D. Hubbard, and W. Duffy. 2003.
Effects of sediment load on emergence of aquatic
3480 ª 2013 The Authors. Ecology and Evolution published by John Wiley & Sons Ltd.
Drying of North American Pothole Wetlands B. A. Werner et al.

invertebrates and plants from wetland soil egg and seed
banks. Wetlands 23:26–34.
Gleason, R. A., M. K. Laubhan, and N. H. Euliss Jr., eds. 2008.
Ecosystem services derived from wetland conservation
practices in the United States Prairie Pothole Region with
an emphasis on the U.S. Department of Agriculture
Conservation Reserve and Wetlands Reserve Programs.
Pp. 1–56. U.S. geological professional paper 1745. U.S.
Geological Survey.
Gleason, R. A., N. H. Euliss, B. A. Tangen, M. K. Laubhan,
and B. A. Browne. 2011. USDA conservation program and
practice effects on wetland ecosystem services in the Prairie
Pothole Region. Ecol. Appl. 21:S65–S81.
Guntenspergen, G. R., S. A. Peterson, S. G. Leibowitz, and
L. M. Cowardin. 2002. Indicators of wetland condition for
the Prairie Pothole Region of the United States. Environ.
Monit. Assess. 78:229–252.
Hoekstra, J. M., T. M. Boucher, T. H. Ricketts, and
C. Roberts. 2005. Confronting a biome crisis: global
disparities of habitat loss and protection. Ecol. Lett.
8:23–29.
IPCC. 2007. Climate change 2007: synthesis report.
Contribution of working groups I, II and III to the fourth
assessment report of the intergovernmental panel on climate
change. P. 45 in R. A. Pachauri, ed. Fourth assessment
report. IPCC, Geneva, Switzerland.
Johnson, D. H., and J. W. Grier. 1988. Determinants of
breeding distributions of ducks. Wildlife Monogr. 100:1–37.
Jamestown ND: Northern Prairie Wildlife Research Center
Online. http://www.npwrc.usgs.gov/resource/birds/distduck/
index.htm (version 15APR98).
Johnson, W. C., S. E. Boettcher, K. A. Poiani, and
G. Guntenspergen. 2004. Influence of weather extremes on
the water levels of glaciated prairie wetlands. Wetlands
24:385–398.
Johnson, W. C., B. V. Millett, T. Gilmanov, R. A. Voldseth,
G. R. Guntenspergen, and D. E. Naugle. 2005. Vulnerability
of northern prairie wetlands to climate change. Bioscience
55:863–872.
Johnson, R. R., F. T. Oslund, and D. R. Hertel. 2008. The past,
present, and future of prairie potholes in the United States.
J. Soil Water Conserv. 63:84A–87A.
Johnson, W. C., B. Werner, G. R. Guntenspergen,
R. A. Voldseth, B. Millett, D. E. Naugle, et al. 2010. Prairie
wetland complexes as landscape functional units in a
changing climate. Bioscience 60:128–140.
Keddy, P. A., L. H. Fraser, A. I. Solomeshch, W. J. Junk,
D. R. Campbell, M. T. K. Arroyo, et al. 2009. Wet and
wonderful: the world’s largest wetlands are conservation
priorities. Bioscience 59:39–51.
van Kooten, G. C., P. Withey, and L. Wong. 2011.
Bioeconomic modeling of wetlands and waterfowl in
western Canada: accounting for amenity values. Can. J.
Agric. Econ. Rev. Can. Econ. 59:167–183.
Larson, D. L. 1995. Effects of climate on numbers of northern
prairie wetlands. Clim. Change 30:169–180.
Loesch, C. R., R. E. Reynolds, and L. T. Hanson. 2012. An
assessment of re-directing breeding waterfowl conservation
relative to predictions of climate change. J. Fish Wildl.
Manage. 3:1–22.
Mann, G. E. 1974. The Prairie Pothole Region – a zone of
environmental opportunity. Naturalist 25:2–7.
Millenium Ecosystem Assessment. 2005a. Ecosystems
and human well-being: synthesis. Island Press,
Washington, DC.
Millenium Ecosystem Assessment. 2005b. Ecosystems
and human well-being: wetlands and water
synthesis. Pp. 1–68. World Resources Institute,
Washington, DC.
Millett, B., W. C. Johnson, and G. Guntenspergen. 2009.
Climate trends of the North American Prairie Pothole
Region 1906–2000. Clim. Change 93:243–267.
Murkin, H. R., A. V. D. Valk, W. R. Clark; Marsh Ecology
Research Program. 2000. Prairie wetland ecology: the
contribution of the marsh ecology research program. Iowa
State Univ. Press, Ames.
Naugle, D. E., R. R. Johnson, M. E. Estey, and K. F. Higgins.
2001. A landscape approach to conserving wetland bird
habitat in the Prairie Pothole Region of eastern South
Dakota. Wetlands 21:1–17.
Niemuth, N., B. Wangler, and R. Reynolds. 2010. Spatial and
temporal variation in wet area of wetlands in the Prairie
Pothole Region of North Dakota and South Dakota.
Wetlands 30:1053–1064.
Ojima, D. S., J. M. Lackett; Central Great Plains Steering
Committee and Assessment Team. 2002. P. 103 in Preparing
for a changing climate: the potential consequences of
climate variability and change – Central Great Plains.
Report for the US Global Change Research Program.
Colorado State University.
Oslund, F. T., R. R. Johnson, and D. R. Hertel. 2010.
Assessing wetland changes in the Prairie Pothole Region of
Minnesota from 1980 to 2007. J. Fish Wildl. Manage.
1:131–135.
Poiani, K. A., and W. C. Johnson. 1991. Global warming and
prairie wetlands. Bioscience 41:611–618.
Poiani, K. A., and W. C. Johnson. 1993. A spatial
simulation-model of hydrology and vegetation dynamics
in semi-permanent prairie wetlands. Ecol. Appl.
3:279–293.
Poiani, K. A., W. C. Johnson, and T. G. F. Kittel. 1995.
Sensitivity of a prairie wetland to increased temperature
and seasonal precipitation changes. Water Resour. Bull.
31:283–294.
Poiani, K. A., W. C. Johnson, G. A. Swanson, and
T. C. Winter. 1996. Climate change and northern prairie
wetlands: simulations of long-term dynamics. Limnol.
Oceanogr. 41:871–881.
ª 2013 The Authors. Ecology and Evolution published by John Wiley & Sons Ltd. 3481
B. A. Werner et al. Drying of North American Pothole Wetlands

Samson, F. B., F. L. Knopf, and W. R. Ostlie. 2004. Great
Plains ecosystems: past, present, and future. Wildl. Soc. Bull.
32:6–15.
Schindler, D. W., and W. F. Donahue. 2006. An impending
water crisis in Canada’s western prairie provinces. Proc.
Natl. Acad. Sci. USA 103:7210–7216.
Sorenson, L. G., R. Goldberg, T. L. Root, and M. G. Anderson.
1998. Potential effects of global warming on waterfowl
populations breeding in the northern Great Plains. Clim.
Change 40:343–369.
Stephens, S. E., J. J. Rotella, M. S. Lindberg, M. L. Taper,
and J. K. Ringelman. 2005. Duck nest survival in
the Missouri Coteau of North Dakota: landscape
effects at multiple spatial scales. Ecol. Appl. 15:2137–2149.
Swanson, G. A., N. H. Euliss, B. Hanson, and D. M. Mushet.
2003. Dynamics of a prairie pothole wetland complex:
implications for wetland management. Pp. 55–94 in
T. C. Winter, ed. Hydrological, chemical, and biological
characteristics of a Prairie Pothole Wetland complex under
highly variable climate conditions–the Cottonwood Lake
Area, East-Central North Dakota. U.S. Geological Survey,
Washington, DC.
Tiner, R. W. Jr. 1984. Wetlands of the United States: current
status and recent trends. U.S. Department of Interior; Fish
and Wildlife Service, Washington, DC.
van der Valk, A. G. 2006. The biology of freshwater wetlands.
Oxford Univ. Press, Oxford, U.K.
van der Valk, A. G., and C. B. Davis. 1978. The role of seed
banks in the vegetation dynamics of prairie glacial marshes.
Ecology 59:322–335.
Voldseth, R. A., W. C. Johnson, T. Gilmanov,
G. R. Guntenspergen, and B. V. Millett. 2007. Model
estimation of land-use effects on water levels of northern
prairie wetlands. Ecol. Appl. 17:527–540.
Voldseth, R. A., W. C. Johnson, G. R. Guntenspergen,
T. Gilmanov, and B. V. Millett. 2009. Adaptation of farming
practices could buffer effects of climate change on northern
prairie wetlands. Wetlands 29:635–647.
Weller, M. W. 1988. Issues and approaches in assessing
cumulative impacts on waterbird habitat in wetlands.
Environ. Manage. 12:695–701.
Weller, M. W., and C. S. Spatcher. 1965. Role of habitat in the
distribution and abundance of marsh birds. Iowa
Agricultural and Home Economic Experiment Station, Iowa
State University of Science and Technology, Ames.
Winter, T. C. 2000. The vulnerability of wetlands to climate
change: a hydrologic landscape perspective. J. Am. Water
Resour. Assoc. 36:305–311.
Winter, T. C., and D. O. Rosenberry. 1995. The interaction of
ground water with prairie pothole wetlands in the
Cottonwood Lake area, east central North Dakota,
1979–1990. Wetlands 15:193–211.
Winter, T. C., and D. O. Rosenberry. 1998. Hydrology of
prairie pothole wetlands during drought and deluge: A
17-year study of the Cottonwood Lake wetland complex in
North Dakota in the perspective of longer term measured
and proxy hydrological records. Climatic Change
40:189–209.
Withey, P., and G. C. van Kooten. 2011. The effect of climate
change on optimal wetlands and waterfowl management in
Western Canada. Ecol. Econ. 70:798–805.
Wright, C. K., and M. C. Wimberly. 2013. Recent land
use change in the Western Corn Belt threatens
grasslands and wetlands. Proc. Natl. Acad. Sci. USA
110:4134–4139. Published online before print: February 19,
2013.
Zedler, J. B. 2003. Wetlands at your service: reducing impacts
of agriculture at the watershed scale. Front. Ecol. Environ.
1:65–72.
Zedler, J. B., and S. Kercher. 2005. Wetland resources: status,
trends, ecosystem services, and restorability. Annu. Rev.
Environ. Resour. 30:39–74.
3482 ª 2013 The Authors. Ecology and Evolution published by John Wiley & Sons Ltd.
Drying of North American Pothole Wetlands B. A. Werner et al.