Event Synchronization of EEG data using the Lab...
5
Neuroelectrics White Paper (WP201401) www.neuroelectrics.com 1 Event Synchronization of EEG data using the Lab Streaming Layer (LSL) Neuroelectrics White Paper WP201401 Released: Jan 7th, 2014 (rev1.0) Reviewed: July 3 rd , 2014 (rev2.0)
-
Upload
trinhquynh -
Category
Documents
-
view
230 -
download
2
Transcript of Event Synchronization of EEG data using the Lab...

Neuroelectrics White Paper (WP201401)
www.neuroelectrics.com 1
Event Synchronization of EEG data using the Lab Streaming Layer (LSL)
Neuroelectrics White Paper WP201401
Released: Jan 7th, 2014 (rev1.0) Reviewed: July 3rd, 2014 (rev2.0)

Neuroelectrics White Paper (WP201401)
www.neuroelectrics.com 2
Event Synchronization of EEG data using the LSL
Neuroelectrics Barcelona SL
In this document we describe the integration of the Lab Streaming Layer into NIC, the Neuroelectrics Instrument Controller software for Enobio and Starstim. This allows for millisecond jitter network synchronization of events generated by third party programs such as Presentation with NE EEG data streams. Please visit our Wikipedia for more information on how to interact with NIC software.
In the performed tests, two triggers were generated by Presentation on a computer and recorded by NIC on a second computer on the same local network (connected by the LAN). A hardware trigger here is a pulse generated by the parallel port and recorded using one of the Enobio electrodes connected to a NE testboard. The software triggers are generated by sending markers through an LSL outlet following typical LSL examples. NIC was thus used to record both the trigger signals from the electrodes and the received local area network markers. A Matlab script measured the relative separation between the software and hardware triggers (in milliseconds). In the second version of this white paper, Neuroelectrics added a synchronization algorithm to improve the synchronization of events.
There are different factors affecting the relative synchronization of events, which can be related as
where: • t is the time instant in which the trigger event has been sent. • t’ is the timestamp written in the output EEG file. • α, a long-term drift reflecting intrinsic differences in the frequencies of the computer clock (used for
timestamping of triggers) and the NECBOX1 clock used to timestamp the EEG samples. • b, the latency of Bluetooth transmission from the NECBOX to the computer file (created by NIC),
which can be characterized by a constant bias. • η, a zero-mean stochastic process with variance of the order of a few ms. This represents the jitter in
the received network triggers.
1 Recall that the Enobio/Starstim NECBOX is the wearable device which contains the EEG amplifiers and which communicates with a computer running the NIC software via Bluetooth.
NE’s test-board provides an electrical interface for simulation of EEG impedances and signals. Shown here attached to a Starstim NECBOX.

Neuroelectrics White Paper (WP201401)
www.neuroelectrics.com 3
These factors are properly compensated using the following approaches: • The long-term drift (α) is compensated by means of long-term syncronization between NECBOX
and computer clocks. • The bias (b) is compensated by the synchronization algorithm while NIC is in idle state (no EEG
streaming, no stimulation). In order for the synchronization algorithm to properly compute this parameter, NIC has to be in idle state at least 20 seconds before starting to stream EEG data or stimulate (see Table 1).
• The jitter (η) is compensated according to the timestamped EEG data from the NECBOX. This also compensates the possible interruptions of the communication or lost packets. In order to avoid jitter at the trigger reception that might be produced by the TCP/IP timing uncertainty, the triggers can be sent via the LSL that synchronizes the clock between computers (if more than one) and sends the markers in a timestamped format.
As can be seen in the table and figures below, after 100 repeated tests we conclude that the mean of the bias (b) between the software and hardware triggers is around 0 ms with a standard deviation lower than 2 ms. The jitter (η) is also reduced to 2 ms. When using simple TCP/IP triggering, the jitter is of the order of 12 ms.
Table 1: Comparative results with and without the synchronization algorithm and taking more or less than 10 seconds for synchronizing.
Figure 1: Distance between the first software and hardware trigger using synchronization algorithm and waiting
at least 10 seconds before starting the EEG streaming.
Measurement
Number of samples (frequency rate = 500 samples/second)
Without synchronization algorithm
With synchronization algorithm
Time >= 10 Time < 10
Maximum distance 8 -3 -3
Minimum distance -10 -1 -1
Mean -1.41 -1.87 -2.25
Standard deviation 3.16 0.46 0.64
Neuroelectrics White Paper (WP201401)
www.neuroelectrics.com 4
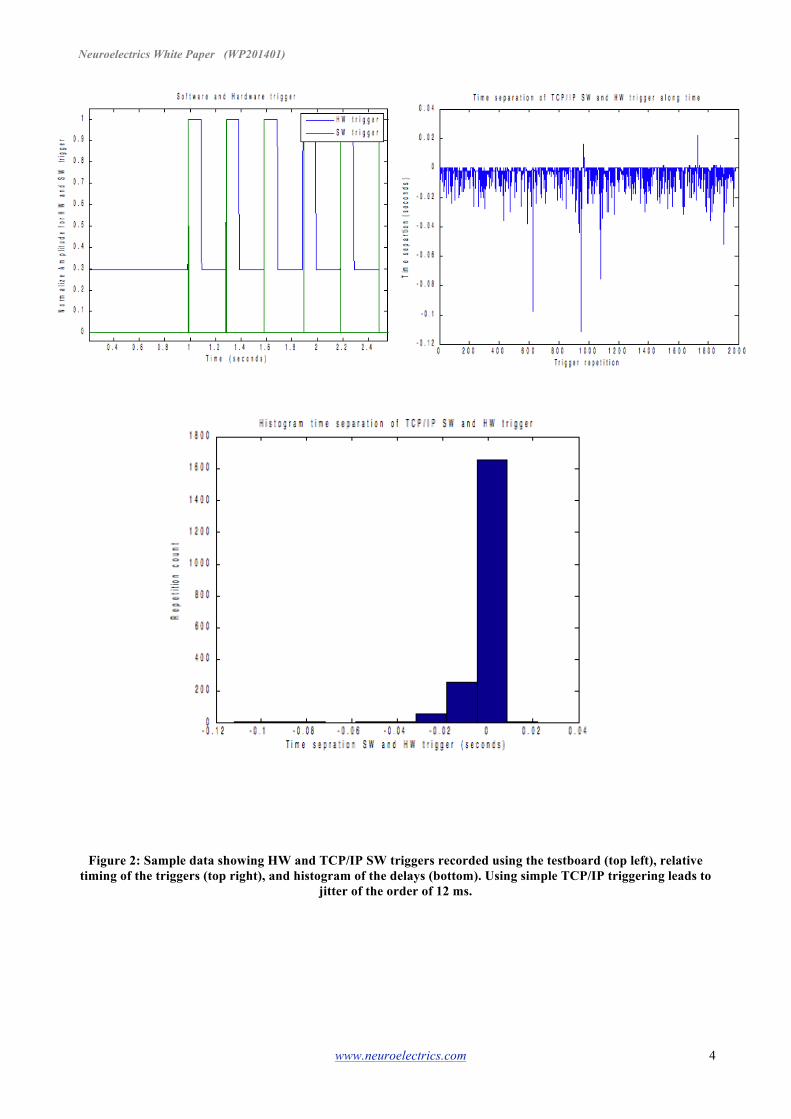
Figure 2: Sample data showing HW and TCP/IP SW triggers recorded using the testboard (top left), relative
timing of the triggers (top right), and histogram of the delays (bottom). Using simple TCP/IP triggering leads to jitter of the order of 12 ms.

Neuroelectrics White Paper (WP201401)
www.neuroelectrics.com 5
Figure 3: Sample data showing HW and LSL SW relative timing of the triggers (top), and histogram of the delays (bottom). Using LSL triggering leads to an overall bias of 0 ms with a 2 ms jitter.