Even Education and Experience Has Its Limits: Closing the ...
36
DISCUSSION PAPER SERIES Forschungsinstitut zur Zukunft der Arbeit Institute for the Study of Labor Even Education and Experience Has Its Limits: Closing the Wage Gap IZA DP No. 8737 December 2014 Gil S. Epstein Dalit Gafni Erez Siniver
Transcript of Even Education and Experience Has Its Limits: Closing the ...

DI
SC
US
SI
ON
P
AP
ER
S
ER
IE
S
Forschungsinstitut zur Zukunft der ArbeitInstitute for the Study of Labor
Even Education and Experience Has Its Limits:Closing the Wage Gap
IZA DP No. 8737
December 2014
Gil S. EpsteinDalit GafniErez Siniver
Even Education and Experience Has Its
Limits: Closing the Wage Gap
Gil S. Epstein Bar-Ilan University,
CReAM, IZA and LdA
Dalit Gafni College of Management, Israel
Erez Siniver
College of Management, Israel
Discussion Paper No. 8737 December 2014
IZA
P.O. Box 7240 53072 Bonn
Germany
Phone: +49-228-3894-0 Fax: +49-228-3894-180
E-mail: [email protected]
Any opinions expressed here are those of the author(s) and not those of IZA. Research published in this series may include views on policy, but the institute itself takes no institutional policy positions. The IZA research network is committed to the IZA Guiding Principles of Research Integrity. The Institute for the Study of Labor (IZA) in Bonn is a local and virtual international research center and a place of communication between science, politics and business. IZA is an independent nonprofit organization supported by Deutsche Post Foundation. The center is associated with the University of Bonn and offers a stimulating research environment through its international network, workshops and conferences, data service, project support, research visits and doctoral program. IZA engages in (i) original and internationally competitive research in all fields of labor economics, (ii) development of policy concepts, and (iii) dissemination of research results and concepts to the interested public. IZA Discussion Papers often represent preliminary work and are circulated to encourage discussion. Citation of such a paper should account for its provisional character. A revised version may be available directly from the author.

IZA Discussion Paper No. 8737 December 2014
ABSTRACT
Even Education and Experience Has Its Limits: Closing the Wage Gap*
Economic outcomes are compared for university graduates in Israel belonging to four different ethnic groups. A unique dataset is used that includes all individuals who graduated with a first degree from universities and colleges in Israel between the years 1995 and 2008 and which tracks them for up to 10 years from the year they graduated. The main finding is that education and experience appear to have a strong effect on earnings in the long run and that an ethnic group can improve its position relative to specific groups while it has no effects relative to other groups. JEL Classification: J15, J24, J31 Keywords: wage differences, immigrants, discrimination Corresponding author: Gil. S. Epstein Department of Economics Bar-Ilan University 52900, Ramat-Gan Israel E-mail: [email protected]
* We are grateful for the productive comments received from participants of the CReAM conference “MIGRATION: Global Development, New Frontier” held at University College London. 10-13 April, 2013
2
1. Introduction
There are various explanations proposed for economic gaps between different segments of
the population, particularly in a country with sizable minority groups. Among them is
discrimination in the job market. For example, if a member of a minority group enters the
job market with no experience or education, he may be subject to statistical discrimination
when looking for a job and in the determination of his wage when he finds one. The
resulting wage gaps between the various groups will be negatively correlated with level of
education (see Neal and Johnson, 1996).0F
1 This is due to the fact that a higher level of
education reduces the uncertainty of employers regarding the productivity of job candidates
and in this way may lessens statistical discrimination (see Lang and Manove (2011) who
present a signaling model to explain this phenomenon).1F
2 Therefore, education as a signal of
productivity may play an important role in closing wage gaps between various groups in the
economy.
Experience is another important factor in determining wage gaps in the economy.
Experience enables a potential employer to more precisely evaluate the abilities of workers,
rather than using membership in a particular minority group as a proxy. Thus, it may take
longer for employers to recognize the individual skills of minority group members.
However, education and experience may also have the reverse effect since at higher levels of
experience and education employers have more degrees of freedom in determining wages.
Thus, if workers are earning low or even minimum wage, it is harder for the employer to
discriminate between them when setting wages. Lehmann (2013) finds that highly-educated
and experienced workers have a greater chance of being employed but that they suffer from
larger wage gaps than less-skilled and less-experienced workers. 2F
3
As mentioned, both education and experience may have important effects on wage gaps
between various groups in the economy. We use data for Israel to test for this effect on wage
differences between the majority and minority groups. The Israeli economy provides an
1 Neal and Johnson (1996) find that after controlling for age and performance on the Armed Forces Qualifying Test (AFQT), the black-white earnings differential among young men is only about 7 percent and insignificant. 2 They argue that when the AFQT score is controlled for, educated blacks earn noticeably less than whites with the same education and cognitive score. 3 Using a unique longitudinal survey that tracked 4,000 lawyers, Lehmann (2013) finds that compared to whites with similar credentials, blacks are more likely to be hired but are assigned to lower-level tasks and are less likely to be a partner seven years after entering the bar. Siniver (2011) finds that the wage gap between immigrant and native physicians is due to statistical, rather than taste-based discrimination.

3
ideal setting to test for this effect, for the following reasons: 1. Israel has four well-defined
ethnic groups, which differ in size, years since migration and other characteristics. 2. A
unique dataset exists for Israel which includes all individuals who graduated with a first
degree from universities and colleges between the years 1995 and 2008. The database
includes psychometric test scores (similar to the SAT), type and name of academic
institution, field of study and occupation (note that immigration to Israel is not for the most
part self-selected but rather is a result of push factors). In particular, the use of psychometric
test scores enables us to control for an individual's abilities and thus more precisely to
interpret the results.
The Israeli population
Immigrants currently represent over 15 percent of the Israeli labor force, one of the highest
rates in the world. This provides a unique opportunity to study some of the unresolved
questions related to return on experience and migration.
Israel’s population can be divided into four main ethnic groups: native Jews, Jewish
immigrants from the Former Soviet Union (FSU), Jewish immigrants from Ethiopia and
Israeli Arabs. The population is distributed as follows: about 4,100,000 native Jews (53
percent of the total); about 1,587,000 Israeli Arabs (20.5 percent of the total); about
1,000,000 FSU immigrants (13 percent of the total); and about 140,000 Ethiopian
immigrants (1.8 percent of the total). Native Jews, FSU immigrants and Ethiopian
immigrants are similar in terms of culture, in that they are all Jews, while Israeli Arabs have
their own separate culture. The immigrants from the FSU and from Ethiopia do not live in
enclaves, as a result of the deliberate government policy of dispersing them throughout the
country and thus preventing the formation of enclaves. The geographic distribution of these
immigrants is thus very similar to that of the general population. In contrast, the Arabs do
live in enclaves.3F
4
We use a unique dataset that includes all individuals who graduated with a first degree
from universities and colleges in Israel between the years 1995 and 2008. The sample
includes 269,596 individuals: 226,285 native Jews (83.93 percent), 23,730 FSU immigrants
4 According to the Central Bureau of Statistics, Arabs tend to live in enclaves. The following cities have an almost entirely Arab population: Nazareth (75,000), Umm-Al-Fahm (50,000), Tayibe (30,000), Sakhnin (70,000), Tira (25,000), Kafr-Qasim (20,000) and Tamra (30,000).

4
(8.8 percent), 18,406 Israeli Arabs (6.83 percent) and 1175 Ethiopian immigrants (0.44
percent). As mentioned, cultural differences (such as customs and language), size of enclave
and skin color can affect the wage gaps between the different groups and we will attempt to
determine the effect of each.
Immigration to Israel is usually induced by political pressure in the country of origin.
Thus, in 1989, the Soviet Union removed restrictions on immigrating to Israel, while the US
restricted the possibility of Soviet immigrants receiving refugee status. The result was a
major wave of immigration to Israel, which began in the fall of 1989. By 2000, about
800,000 immigrants had arrived, thus increasing the Israeli population by 14%.
Other related literature
Kohler (2012a, 2012b) found that in Switzerland ethnic groups that are culturally less
similar to natives encounter greater economic discrimination. Epstein and Gang (2009)
found that cultural differences affect both assimilation and economic outcomes. Most of the
studies in Israel have focused on FSU immigrants, while ignoring Ethiopian immigrants who
are black-skinned and thus differ from both FSU immigrants and native Jews in that respect.
Researchers in the US, including Couch and Daly (2004), Smith and Welch (1977), Blau
and Beller (1992) and Card and Krueger (1992), have found that the earnings of native
whites are higher than those of native blacks.
Chiswick (1978) found that immigrants in the US earn less than natives in the period
following their arrival.4F
5 If the earnings gap persists over time, this is likely due to one of
two reasons: (1) a persistent deficit in knowledge required to succeed in the labor market or
(2) taste-based discrimination against immigrants in hiring, in the determination of wages,
etc. Since Chiswick (1978), it has become widely recognized that the earnings of immigrants
increase more rapidly than those of natives. Although there are a number of possible factors
5 He shows that: (1) They have less knowledge of the customs and language relevant for jobs in the US,
less information about local job opportunities and less firm-specific training. (2) Employers are likely to have less information about the productivity of a job applicant, (i,e. it is more difficult for them to verify schooling and previous employment references). (3) Knowledge and skills are not perfectly mobile across countries. On the other hand, the gap will narrow with years in the US and the earnings of immigrants may eventually exceed those of natives, as a result of self-selection in migration (i.e. migration in response to economic incentives is more profitable for those with higher levels of skill and motivation). As a result of the aforementioned differences between immigrants and natives, it is difficult to empirically determine whether the gap in earnings between immigrants and natives is due to statistical or taste-based discrimination.

5
to explain this phenomenon, only two have been extensively studied: (1) fluency in the
local language (see McManus, Gould and Welch (1983), Kossoudji (1988), Chiswick
(1991), Dustmann (1994) and Carliner (2000)) and (2) the existence of enclaves. Tienda and
Lii (1987) found that the earnings loss for Hispanic and Asian men living in ethnic enclaves
is highest for college graduates and lowest for those lacking a high school education. Lazear
(1999) and Card (1990) found that an enclave serves as a platform for networking, which
increases the opportunities for employment. Thus, living in an enclave can improve
earnings, especially for recent immigrants. Daneshvary and Schwer (1994), Dodoo and
Baffour (2002) and Model (1991) found an earnings gap between black and non-black
immigrants in favor of the latter.
One of the main factors determining an immigrant's degree of assimilation is age on
arrival (see, for example, Friedberg (1992) and Bleakley and Chin (2010)).
In the Israeli context, Eckstein and Weiss (1998) found that the rate of growth in
earnings increases with an immigrant’s skill level. Berman, Lang and Siniver (2003)
obtained similar results for FSU immigrants. Chiswick (1998), Chiswick and Reppeto
(2001) and Friedberg (2000) also found that the earnings gap between FSU immigrants and
native Jews narrows over time and Epstein and Hizler (2006) found that FSU immigrants
who decided to settle in an ethnic enclave were more successfully absorbed.
Our study
A database was constructed in order to control for all variables that differ between
immigrants and natives. The database includes all individuals who graduated with a first
degree from universities in Israel during the period 1995-2008. As a result, immigrants in
the sample are likely to have earning power characteristics that are similar to those of
natives. Thus, FSU immigrants have similar levels of human capital to natives, they speak
Hebrew fluently and because they have studied in Israel, Israeli employers have sufficient
information to judge their productivity.
If it is found that natives earn more than immigrants and Arabs, this may be because
employers have better information about the productivity of natives. However, over time the
market recognizes the skills of immigrants and Arabs. If there is no taste-based
discrimination against these groups, then after several years in the labor market they should
be able to close the earnings gap with natives with similar psychometric test scores.

6
However, if the earnings gap persists, it is likely that taste-based discrimination against
immigrants and/or Arabs does indeed exist.
The results obtained in this study show that on average native Jews attain the best
economic outcomes, followed by FSU immigrants, Israeli Arabs and finally Ethiopian
immigrants. While this result is not new (see Epstein and Siniver, 2012), the unique
database used here makes it possible to improve the precision of the results. For example,
while the above mentioned results hold for men, among women Ethiopian immigrants do
better than Israeli Arabs. Even though native Jews initially have higher earnings, FSU
immigrants have a higher return on experience and after two years in the labor market they
overtake native Jews. Ethiopian immigrants who arrived before the age of 13 have a higher
return on experience than Israeli Arabs and within four years after graduation are earning a
higher wage than comparable Israeli Arabs. Thus, education combined with work experience
can improve the position of Ethiopian immigrants relative to Israeli Arabs.
It is worth emphasizing that despite the use of psychometric test scores to control for the
abilities of individuals wage gaps still exist, although they are smaller than in the estimation
that does not include a measure of ability.
We also consider the effect of gender, age, age on arrival, choice of occupation and
other characteristics on economic performance.
2. Description of the data
The database includes all individuals who graduated with a first degree from universities and
colleges in Israel between the years 1995 and 2008. The data for each individual starts from
the year of his graduation and ends in 2008. Thus, for example, an individual who graduated
in 1995 will have data from 1995 until 2008.
The basic database was constructed from various sources within the Central Bureau of
Statistics and merged; the data on academic degrees was obtained from the universities and
colleges; the data on wages was obtained from the Income Tax Authority; and demographic
information was obtained from the Population Registry.
The data includes the following information for each graduate and for each year
following graduation:

7
1. Wage and employment data: average monthly wage, number of months
worked, number of jobs held, the sector in which the highest monthly wage
was earned and the average wage for all workers in the individual’s place of
employment.
2. Demographic information: gender, country of origin, father’s country of origin,
age, marital status, occurrence of a birth that year, number of children and
place of residence.
3. Education: psychometric test scores, type and name of the academic institution,
field of study and occupation, both for a first degree and for more advanced
degrees.
The research population is limited to graduates who remained in Israel and are salaried
employees (i.e. it excludes emigrants and the self-employed). The database consists of a
panel, where the time variable is the number of years since graduation. The analysis is
limited to no more than 10 years since graduation, which is imposed due to the low number
of observations for Ethiopian immigrants. Thus, those who graduated in 1995, 1996, 1997
and 1998 are tracked for 10 years until 2005, 2006, 2007 and 2008, respectively. Those who
graduated after 1998 are tracked until 2008. For example, an individual who graduated in
1999 is tracked for only 9 years (until 2008).
We also estimated the models for a period of 7 years after graduation and added a
quadratic term to the 10-year model, but the results remained unchanged.
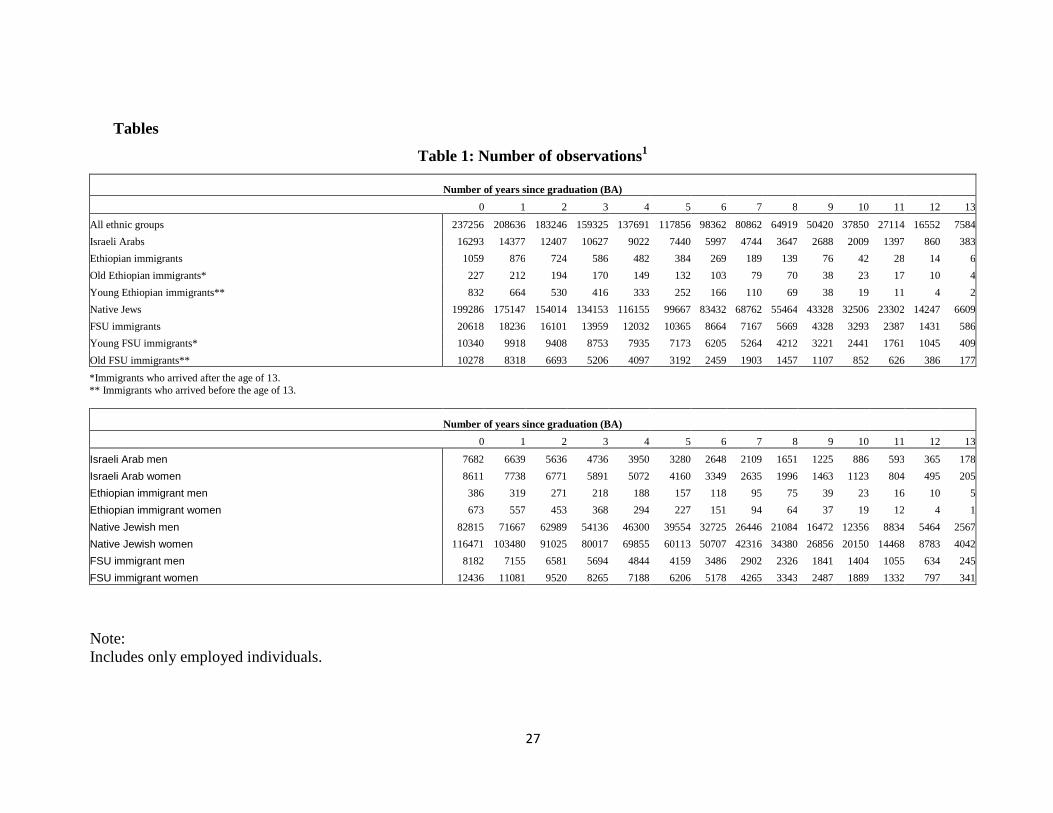
Table 1 presents the number of observations for each ethnic group. There are a total of
1,376,423 observations and a total of 237,256 individuals, resulting in an average of 5.8
observations per individual. It should be noted that the data for each individual is not
necessarily continuous since only years with a positive salary are included.
< Place Table 1 here >

8
3. Empirical Analysis
We wish to empirically examine the development of wages over time for university
graduates with a first degree. The population is divided into four groups: native Jews (who
constitute the majority) and three minority groups – FSU immigrants, Israeli Arabs and
Ethiopian immigrants. The database is restricted to individuals who obtained their degree in
Israel.
In order to examine the earnings gaps between the various groups, we estimated the
monthly wage (in logarithmic terms) using the following independent variables for each
individual and each year: years since graduation, age, gender, country of origin, religion, age
on arrival (for immigrants), family status, number of children, place of residence, number of
months employed, industry, psychometric scores and information on the individual’s
education, including type of degree, year of graduation, institution where the degree was
obtained, type of institution and field of study. All regressions are estimated using OLS.
Our main focus is on the effect of years since graduation on earnings.
3.1 General analysis
Figure 1 presents the average wage over time (since graduation) for the four groups. As can
be seen, native Jews earn the highest wage, with FSU immigrants close behind and Israeli
Arabs and Ethiopian immigrants well behind them.

9
4000
6000
8000
10000
12000
14000
16000
18000
20000
0 1 2 3 4 5 6 7 8 9 10
Aver
age
mon
thly
wag
e
Years since graduation Israeli Arabs Ethiopian immigrants Native Jews FSU immigrants
Figure 1: Average monthly wage of each ethnic group by years since graduation
(raw data)
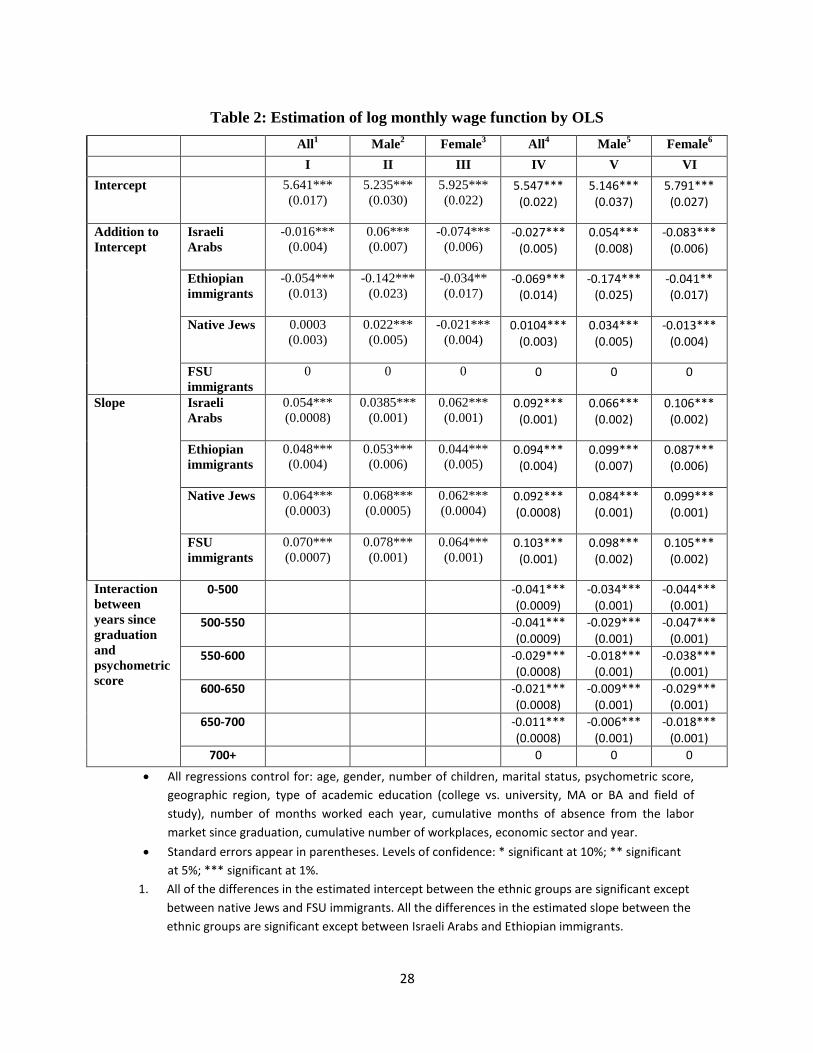
Table 2 (columns 1-3) and figures 2, 2a and 2b below present the estimated log wage for
each ethnic group as a function of years since graduation, while controlling for: age, gender,
number of children, marital status, psychometric score, geographic region, type of academic
education (college vs. university, MA or BA and field of study), number of months worked
each year, cumulative months of absence from the labor market since graduation, cumulative
number of workplaces, economic sector and year.
< Place Table 2 here >
10
5,25
5,5
5,75
6
6,25
6,5
0 1 2 3 4 5 6 7 8 9 10
Estim
ated
log
wag
e
years since graduation Israeli Arabs Ethiopian immigrants Native Jews FSU immigrants
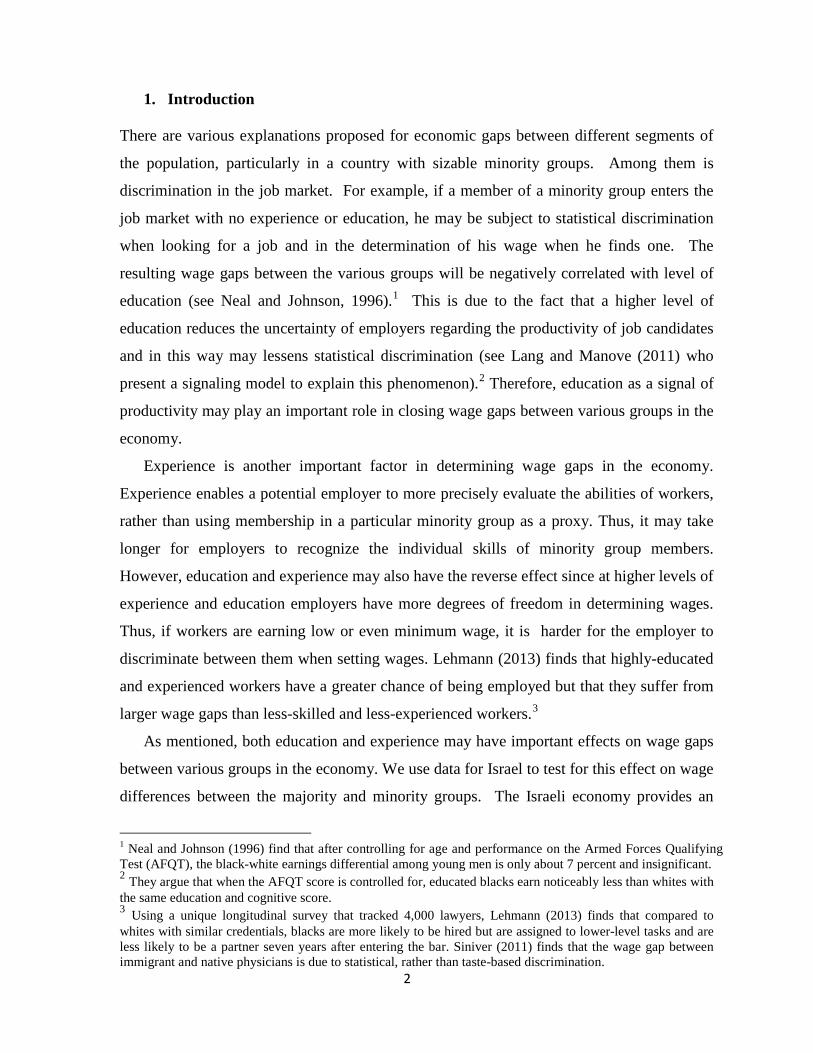
Figure 2: Estimated log wage by ethnic group and years since graduation
It was found that the coefficient for experience (i.e. years since graduation) is highest for
FSU immigrants, followed by native Jews, Israeli Arabs and finally Ethiopian
immigrants.
The intercept for Israeli Arabs is higher than that for Ethiopian immigrants and the
difference is statistically significant. The slope is identical and therefore Ethiopian
immigrants never close the gap. Meanwhile, the intercepts are the same for FSU immigrants
and native Jews (the difference is not statistically significant). The slope for FSU immigrants
is larger (the difference is statistically significant), which means that their earnings grow
faster than those of native Jews. Thus, the wage function of Israeli Arabs is always above
that of Ethiopian immigrants following graduation and Ethiopian immigrants never manage
to close the gap (since they start at a lower wage and have the same rate of wage growth).
FSU immigrants and native Jews have the same starting point on graduation but the wage of
FSU immigrants grows faster than that of native Jews.
11
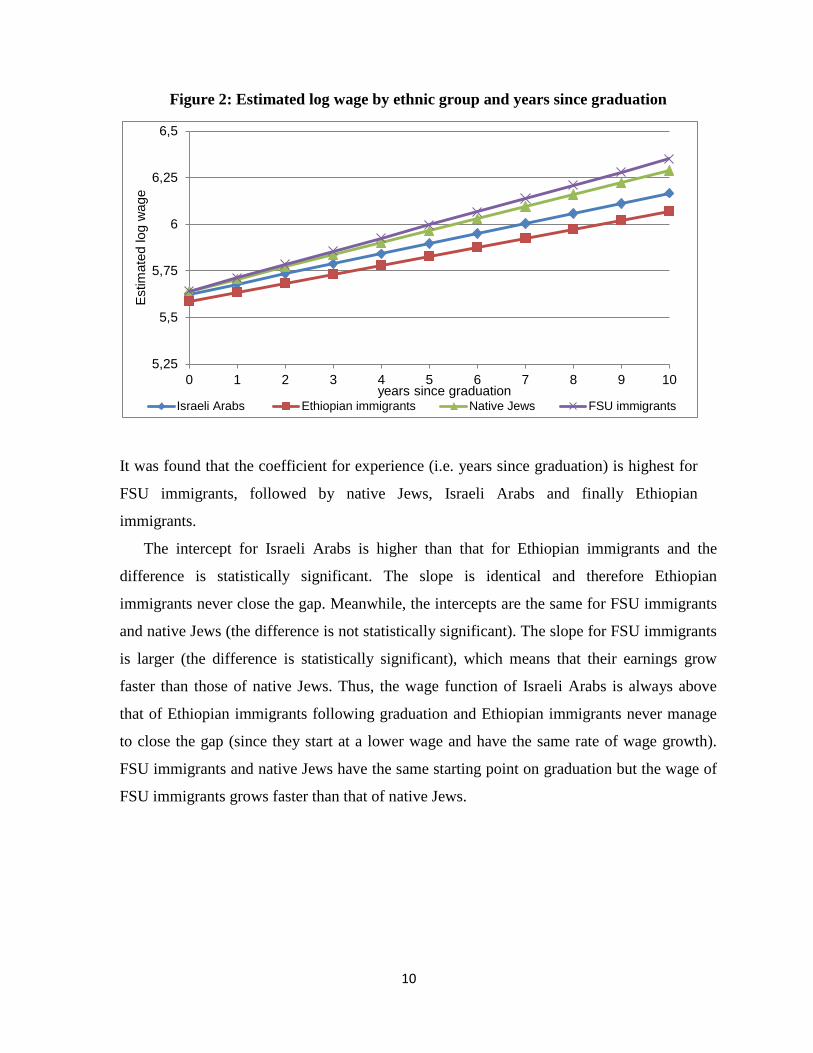
Figure 2a: Estimated log wage by ethnic group and years since graduation –
Men only
Figure 2b: Estimated log wage by ethnic group and years since graduation –
Women only

12
In the case of men, FSU immigrants start lower than native Jews following graduation;
however, the rate of growth in their wages is higher than that of native Jews and therefore the
gap is closed after two years and following that the wage profile of FSU immigrants remains
above that of native Jews.
The intercept for Israeli Arabs is higher than that for Ethiopian immigrants and the gap is
statistically significant. Since the slope of the Ethiopian immigrants’ wage function is larger
than that of Israeli Arabs (the difference is statistically significant), the gap diminishes over
time.
In the case of women, the intercept for Israeli Arabs is lower than that for Ethiopian
immigrants and the difference is significant. The slope of the wage function for Israeli Arabs
is larger than that for Ethiopian immigrants and again the difference is significant. Therefore,
Israeli Arab women close the gap after two years and following that their wage remains
above that of Ethiopian immigrant women.
The intercept for FSU immigrant women is above that for native Jewish women (the
difference is statistically significant) and the slopes of their wage functions are equivalent
(the difference is not statistically significant). Therefore, the wage function of FSU
immigrant women remains above that of native Jewish women.
3.2 General analysis and psychometric score
In order to explain the difference in return on experience between the ethnic groups, we
estimate the regression such that the return on experience can vary with psychometric test
score and ethnic group. We were unable to test whether the ethnic groups perform differently
on the psychometric exam because there were not enough Ethiopian immigrants with high
psychometric scores.
The following table presents the number of graduates in each ethnic group by
psychometric score.

13
Ethiopian immigrants Israeli Arabs Native Jews FSU immigrants
Psychometric score
Number of graduates Percent
Number of graduates Percent
Number of graduates Percent
Number of graduates Percent
0-500 855 92.4% 7261 50.7% 23272 13.9% 3931 21.9% 500--550 33 3.6% 2670 18.6% 23856 14.2% 3527 19.7% 550--600 21 2.3% 2103 14.7% 32032 19.1% 3853 21.5% 600-650 8 0.9% 1420 9.9% 35825 21.4% 3382 18.9% 650--700 6 0.6% 678 4.7% 32669 19.5% 2369 13.2%
+ 700 2 0.2% 194 1.4% 19935 11.9% 864 4.8% All 925 14326 167589 17926
Added to the regression was the interaction between the psychometric score and experience
for all groups combined. The results show that the return on experience increases with the
psychometric test score.
Table 2 ( columns 4-6) and figures 2d, 2e and 2f below present the estimated log
wage for each ethnic group as a function of years since graduation after controlling for all the
variables mentioned above and allowing the return on experience to vary according to
psychometric test score.
Figure 2d: Estimated log wage by ethnic group and years since graduation
allowing for the return on experience to vary with psychometric score
Different results were obtained once we allowed the return on experience to vary with
psychometric score. Thus, although there was still an earnings gap between Israeli Arabs and
5,25
5,5
5,75
6
6,25
6,5
6,75
0 1 2 3 4 5 6 7 8 9 10
Estim
ated
log
wag
e
years since graduation Israeli Arabs Ethiopian immigrants Native Jews FSU immigrants
14
Ethiopian immigrants it was significantly reduced in size, and the earnings of both groups
approached those of native Jews over time (in contrast to the earlier results in which the gap
widened over time). On the other hand, the gap between FSU immigrants and native Jews
became larger.
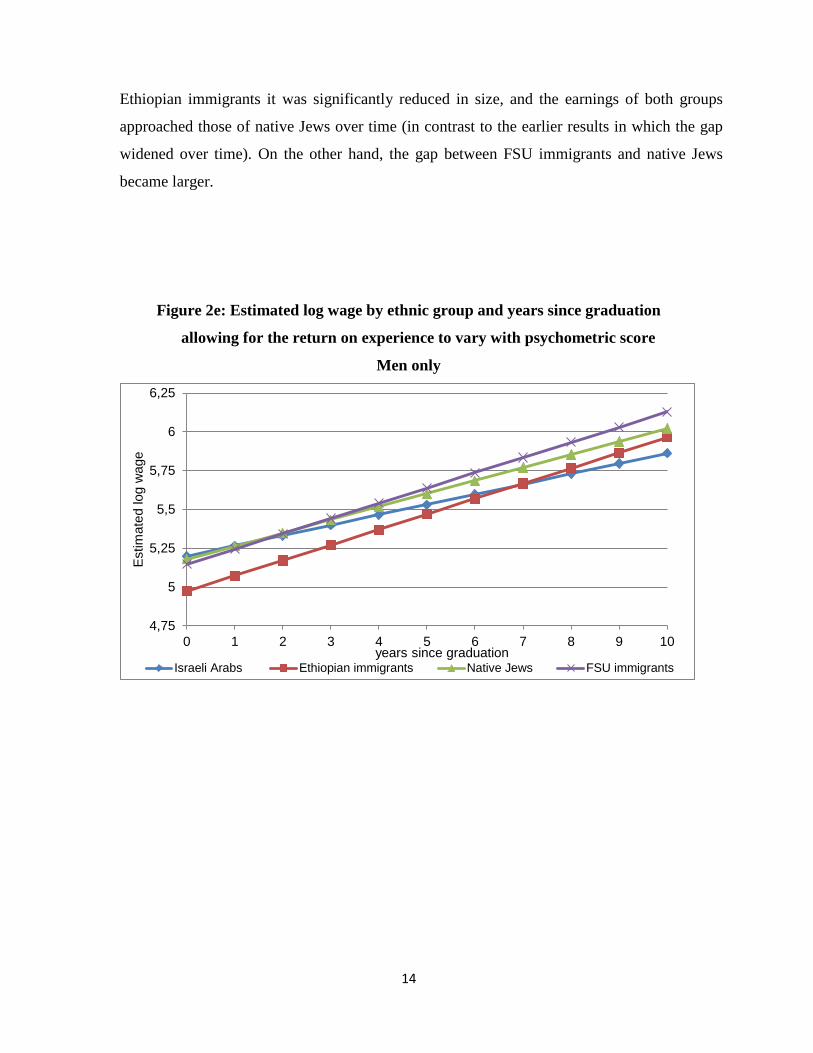
Figure 2e: Estimated log wage by ethnic group and years since graduation
allowing for the return on experience to vary with psychometric score
Men only
4,75
5
5,25
5,5
5,75
6
6,25
0 1 2 3 4 5 6 7 8 9 10
Estim
ated
log
wag
e
years since graduation Israeli Arabs Ethiopian immigrants Native Jews FSU immigrants
15
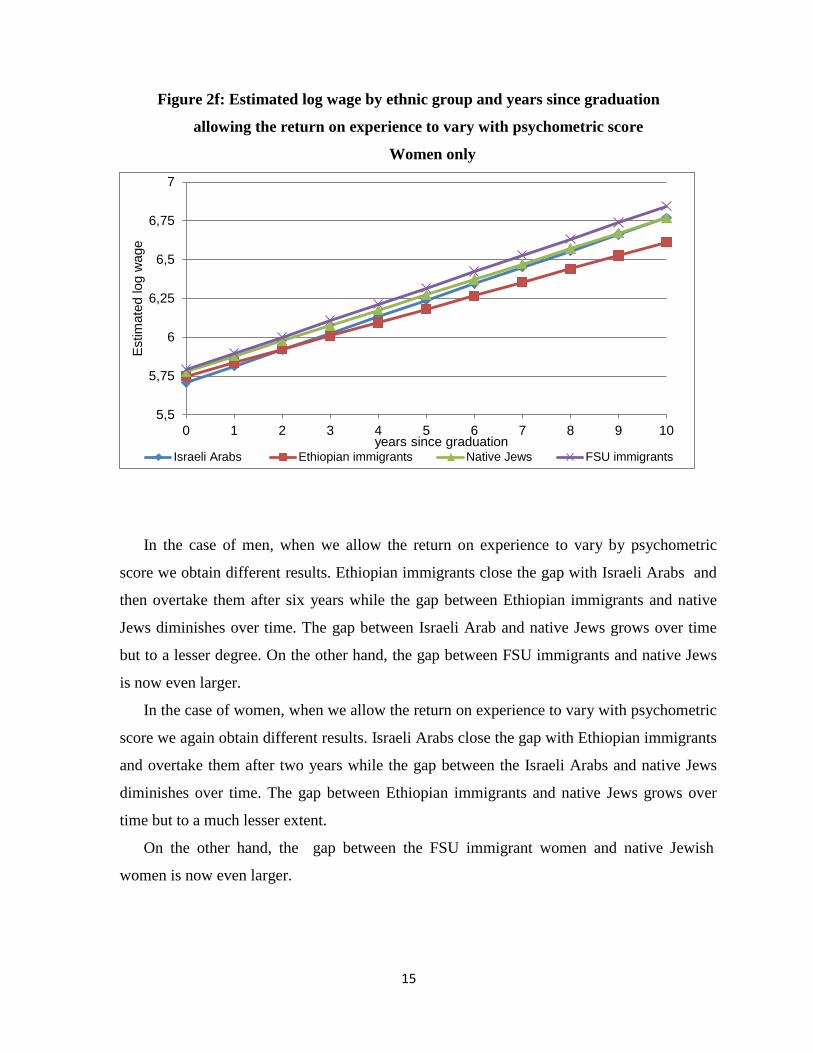
Figure 2f: Estimated log wage by ethnic group and years since graduation
allowing the return on experience to vary with psychometric score
Women only
In the case of men, when we allow the return on experience to vary by psychometric
score we obtain different results. Ethiopian immigrants close the gap with Israeli Arabs and
then overtake them after six years while the gap between Ethiopian immigrants and native
Jews diminishes over time. The gap between Israeli Arab and native Jews grows over time
but to a lesser degree. On the other hand, the gap between FSU immigrants and native Jews
is now even larger.
In the case of women, when we allow the return on experience to vary with psychometric
score we again obtain different results. Israeli Arabs close the gap with Ethiopian immigrants
and overtake them after two years while the gap between the Israeli Arabs and native Jews
diminishes over time. The gap between Ethiopian immigrants and native Jews grows over
time but to a much lesser extent.
On the other hand, the gap between the FSU immigrant women and native Jewish
women is now even larger.
5,5
5,75
6
6,25
6,5
6,75
7
0 1 2 3 4 5 6 7 8 9 10
Estim
ated
log
wag
e
years since graduation Israeli Arabs Ethiopian immigrants Native Jews FSU immigrants

16
3.3 Age on arrival
We now consider the effect of age on arrival and set the age of 13 as the dividing point
between “young” and “old” immigrants. In other words, those who arrived after the age of 13
are viewed as first generation while those who arrived before that are viewed as second
generation.
Table 3 (columns 1-3) and figures 3, 3a and 3b present the estimated log wage for each
ethnic group as a function of years since graduation while controlling for the following
variables: age, gender, number of children, marital status, psychometric score, geographic
region, type of academic education (college vs. university, MA or BA and field of study),
number of months worked each year, cumulative months of absence from the labor market
since graduation, cumulative number of workplaces, economic sector and year.
< Place Table 3 here >
Figure 3: Estimated log wage by ethnic group, age on arrival
and years since graduation

17
The results show that the starting point of Israeli Arabs is significantly higher than that of
Ethiopian immigrants who arrived after the age of 13; however, the difference in the rate of
growth in wages due to accumulated years of experience is not significant and thus the gap
between the two groups does not close over time and Israeli Arabs always earn more than
Ethiopian immigrants who arrived after the age of 13. On the other hand, there is no
significant difference between Israeli Arabs and Ethiopian immigrants who arrived in the
country before the age of 13.
The results also show that there is no effect of age on arrival on the return on experience
for FSU immigrants; thus, both groups (FSU immigrants who arrived after the age of 13 and
FSU immigrants who arrived before the age 13) have a higher return on experience than
native Jews.
Figure 3a: Estimated log wage by ethnic group, age on arrival and
years since graduation – Men only
18
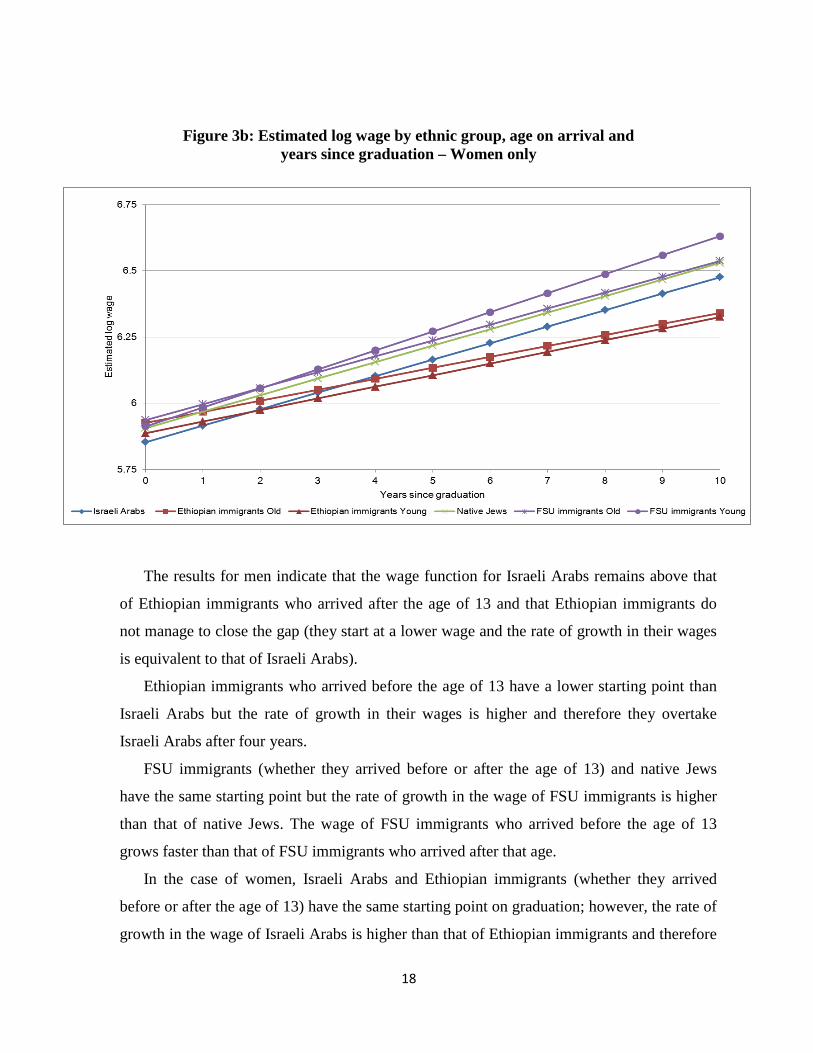
Figure 3b: Estimated log wage by ethnic group, age on arrival and years since graduation – Women only
The results for men indicate that the wage function for Israeli Arabs remains above that
of Ethiopian immigrants who arrived after the age of 13 and that Ethiopian immigrants do
not manage to close the gap (they start at a lower wage and the rate of growth in their wages
is equivalent to that of Israeli Arabs).
Ethiopian immigrants who arrived before the age of 13 have a lower starting point than
Israeli Arabs but the rate of growth in their wages is higher and therefore they overtake
Israeli Arabs after four years.
FSU immigrants (whether they arrived before or after the age of 13) and native Jews
have the same starting point but the rate of growth in the wage of FSU immigrants is higher
than that of native Jews. The wage of FSU immigrants who arrived before the age of 13
grows faster than that of FSU immigrants who arrived after that age.
In the case of women, Israeli Arabs and Ethiopian immigrants (whether they arrived
before or after the age of 13) have the same starting point on graduation; however, the rate of
growth in the wage of Israeli Arabs is higher than that of Ethiopian immigrants and therefore
19
their wage is always higher. There is no difference in the rate of growth in wages according
to age on arrival among Ethiopian immigrants and therefore their wage functions are
virtually identical.
FSU immigrant women (whatever their age on arrival) and native Jewish women have
the same starting point but the rate of growth in the wage of FSU immigrant women is higher
and therefore they always earn more than native Jewish women.
Native Jewish women have a lower starting point than FSU immigrant women who
arrived after the age of 13 but the rate of growth in their wages is higher and therefore they
are able to close the gap within 6-7 years.
These results may be explained by the network effect. The three minority groups can be
ranked with respect to their cultural similarity to the majority group, as follows (from most to
least similar): FSU immigrants, Ethiopian immigrants and Israeli Arabs. They can also be
ranked by size (from largest to smallest): Israeli Arabs (about 1,587,000 or 20.5 percent of
the population), FSU immigrants (about 1,000,000 or 13 percent of the population) and
Ethiopian immigrants (about 140,000 or about 1.8 percent of the population).
Thus, even though Israeli Arabs are least similar to the majority group in terms of
culture, they are the largest minority group and have the potential to generate employment
within their enclave. Native Jews can help members of their own group find jobs and thus
generate higher earnings following graduation; however, over time FSU immigrants overtake
them as the network effect decreases in importance and experience starts to play a greater
role in determining wages. The explanation is similar for the comparison of Israeli Arabs to
Ethiopian immigrants.
3.4 Age on arrival and psychometric score
Table 3 (columns 4-6) and figures 3c, 3d and 3e below present the estimated log wage for
each ethnic group as a function of years since graduation after controlling for all the
variables mentioned above and allowing the return on experience to vary with the
psychometric test score.

20
Figure 3c: Estimated log wage by ethnic group, age on arrival
and years since graduation allowing the return on experience to vary with
psychometric score
When we allow return on experience to vary with psychometric score, we obtain different
results. The gap between Israeli Arabs, young Ethiopian immigrants and old Ethiopian
immigrants diminishes over time, and the wage of each group approaches that of native Jews
(in contrast to the previous results according to which the gap widens). On the other hand,
the gap between FSU immigrants and native Jews becomes even larger.
5,25
5,5
5,75
6
6,25
6,5
6,75
0 1 2 3 4 5 6 7 8 9 10
Estim
ated
log
wag
e
Years since graduation Israeli Arabs Ethiopian immigrants Old Ethiopian immigrants YoungNative Jews FSU immigrants Old FSU immigrants Young

21
Figure 3d: Estimated log wage by ethnic group, age on arrival and
years since graduation allowing the return on experience to vary with psychometric
score - Men only
Figure 3e: Estimated log wage by ethnic group, age on arrival and years since graduation allowing the return on experience to vary with psychometric
score - Women only
4,75
5
5,25
5,5
5,75
6
6,25
0 1 2 3 4 5 6 7 8 9 10
Estim
ated
log
wag
e
Years since graduation Israeli Arabs Ethiopian immigrants Old Ethiopian immigrants YoungNative Jews FSU immigrants Old FSU immigrants Young
5,5
5,75
6
6,25
6,5
6,75
7
0 1 2 3 4 5 6 7 8 9 10
Estim
ated
log
wag
e
Years since graduation
Israeli Arabs Ethiopian immigrants Old Ethiopian immigrants YoungNative Jews FSU immigrants Old FSU immigrants Young
22
In the case of men, when we allow the return on experience to vary with psychometric score
we obtain different results. Young Ethiopian immigrants close the gap with Israeli Arabs
after four years and even overtake native Jews.
The gap between old Ethiopian immigrants and Israeli Arabs diminishes over time,
while the gap between them and native Jews grows over time but to a lesser extent. On the
other hand, the gap between FSU immigrants and native Jews remains almost unchanged.
The gap between older and younger FSU immigrants grows over time.
Also in the case of women, when we allow the return on experience to vary with
psychometric score we obtain different results. Israeli Arab women and older Ethiopian
immigrant women close the gap with native Jews they are all bigger the younger Ethiopian
immigrants women but less than the FSU immigrants. The gap between young and old FSU
immigrants grows over time.
4. Conclusion
The economic outcomes of university and college graduates were compared for four
different ethnic groups in Israel: native Jews, Jewish immigrants from the Former Soviet
Union (FSU), Jewish immigrants from Ethiopia and Israeli Arabs. A unique dataset was
used which includes all individuals who graduated with a first degree between the years
1995 and 2008 and which tracks the individuals for up to ten years from the year of
graduation. .
Native Jews earn more than Ethiopian immigrants and Israeli Arabs even when
controlling for psychometric test score, academic institution, field of study and
occupation. Moreover, the earnings gap between natives on the one hand and Ethiopian
immigrants and Israeli Arabs on the other persists over time.
On the aggregate level, native Jews and FSU immigrants have similar wage functions,
as do Ethiopian immigrants and Israeli Arabs who both lag far behind native Jews and
FSU immigrants.
The results support the conclusion that education has the power to narrow wage gaps
between ethnic groups, but only to a certain extent. Thus, for example, Ethiopian
immigrants overtake Israeli Arabs over time, but they remain far behind native Jews and
FSU immigrants.

23
When we control for experience together with psychometric test scores, many of the
gaps narrow, indicating that individual abilities together with experience and education
can help to close wage gaps. However, not all the gaps disappear.
Note that we did not include an interaction term between the psychometric test scores
and ethnicity. If we had, it may well be that the already small wage gaps would have been
eliminated altogether, although it appears likely that some of the gap would have
remained.
The results indicate that the difference in earnings between native Jews and Ethiopian
immigrants and between native Jews and Israeli Arabs is real. The gaps do diminish with
growth in experience and education and when we control for the ability of individuals;
however, gaps still remain and they are likely due to taste-based discrimination.
24
References
Berman, E., Lang,K., and Siniver, E., (2003) 'Language-skill complementarity: returns to immigrant language acquisition', Labor Economics, 10 (3), pp. 265-290. Blau, F.D., and Beller A.H., (1992) 'Black-white earnings over the 1970s and 1980s: gender differences in trends', The Review of Economics and Statistics, 74(2), pp. 276-286. Bleakley, H., and Chin, A., (2010) 'Age on arrival, English proficiency, and social assimilation among U.S. immigrants', American Economic Journal: Applied Economics, 2(1), pp. 165-192. Card, D., (1990) 'The impact of the Mariel boatlift on the Miami labor market', Industrial and Labor Relations Review, 43(2), pp. 245-257. Card, D. and Krueger, A.B., (1992) 'School quality and black – white relative earnings: a direct assessment', The Quarterly Journal of Economics, 107 (1), pp. 151-200. Carliner, G., (2000) 'The language ability of U.S. immigrants: assimilation and cohort effects', International Migration Review, 34(1), pp. 158–182. Chiswick, B.R., (1978) 'The effect of Americanization on the earnings of foreign-born men', Journal of Political Economy, 86(5), pp. 897-921. Chiswick, B.R., (1991) 'Speaking, reading and earning among low-skilled immigrants', Journal of Labor Economics, 9(2), pp. 149-170. Chiswick, B.R., (1998) 'Hebrew language usage: determinants and effects on earnings among immigrants to Israel', Journal of Population Economics, 11(2), pp. 253-271. Chiswick, B.R., and Reppeto, G.L., (2001) 'Immigrants adjustment in Israel: literacy and fluency in Hebrew and earnings', in Djajic S., editor: International Migration: Trends, Policy and Economic Impact, New York: Routledge, pp. 204-228. Also in: IZA Discussion Paper No. 177. Couch K.A. and Daly M.C., (2004) 'The improving relative status of black men', Working Papers in Applied Economic Theory 2004-02, Federal Reserve Bank of San Francisco. Also in: Journal of Income Distribution, 12(3-4), pp. 56-78. Daneshvary, N. and Schwer K. R., (1994) 'Black immigrants in the U.S labor market: an earnings analysis', The Review of Black Political Economy, 22(3), pp. 77-98.

25
Dodoo, F.N-A., and Baffour, K.T., (2002) 'Africans in the diaspora: black-white Africans earnings differences among America's Africans', Ethnic and Racial Studies, 25(6), pp. 913-941. Dustmann, C., (1994) 'Speaking fluency, writing fluency and earnings of migrants', Journal of Population Economics, 7(2), pp. 133– 156.
Eckstein, Z., and Weiss, Y., (1998) 'The absorption of highly Skilled Immigrants: Israel, 1990-1995', Tel-Aviv University, The Foerder Institute For Economic Research.
Epstein G.S. and Gang I. N., (2009) 'Ethnicity, assimilation and harassment in the labor market', Research in Labor Economics, 29, pp. 67-88. Epstein G.S., and Hizler, O., (2006) 'Immigrants during 1990's from former Soviet Union: herd effect and net work externalities', The Economics quarterly, 53(1), pp. 166-201. Epstein G.S., and Siniver, E., (2012) 'Can an ethnic group climb up from the bottom of the ladder?', Economics Bulletin, 32(3), pp. 2414-2441. Friedberg, R.M., (1992) 'The labor market assimilation of immigrants in the United States: the role of age on arrival', Brown University, Working Paper. Friedberg, R.M., (2000), 'You can’t take it with you? Immigrant assimilation and the portability of human capital: evidence from Israel', Journal of Labor Economics, 18(2), pp. 221-251. Kohler, P., (2012a) 'Economic discrimination and cultural differences as barriers to migrant integration: is reverse causality symmetric?', Graduate Institute of International and Development Studies, Working Paper No: 07-2012. Kohler, P., (2012b) 'The effect of host society culture on migrant wage discrimination: approaching the Roestigraben', Graduate Institute of International and Development Studies Working Paper No: 08-2012. Kossoudji, S.A., (1988) 'English language ability and the labor market opportunities of Hispanic and east Asian immigrant men', Journal of Labor Economics, 6(2), pp. 205-228. Lehmann, J-Y, K., (2011), 'Job assignment and promotion under statistical discrimination: evidence from the early careers of lawyers', MPRA Paper Item ID 33466. Lang, K., Manove, M., (2011), 'Education and labor market discrimination', American Economic Review, Vol. 101(4), pp. 1467-1496. Lazear, E., (1999) 'Culture and language', Journal of Political Economy, University of Chicago Press, 107(S6), pp. S95-S126.
26
McManus, W., Gould, W. and Welch, F., (1983) 'Earnings of Hispanic men: the role of English language proficiency', Journal of Labor Economics, 1(2), pp. 101– 130. Model, S., (1991) 'Caribbean immigrants: A black success story?', International Migration Review, 25(2), pp. 248-276.
Neal, D.A., Johnson, W.R., (1996), 'The role of pre-market factors in black-white wage differences', Journal of Political Economy, 104(5), pp. 869-895.
Piore, J.M., (1979) 'Birds of passage: migrant labor and industrial societies', Cambridge, UK: Cambridge University Press. ISBN 0-521-22452-7. Siniver, E., (2011) 'Testing the statistical discrimination: the case of immigrant physicians in Israel', Labour, 25(2), pp. 155-166. Smith, J.P. and Welch, F., (1977) 'Black–white earnings and employment 1960-1970', American Economic Review, 67, pp. 323-338. Tienda, M. and Lii, D-T., (1987) 'Minority concentration and earnings inequality blacks, Hispanics , and Asians compared', American journal of Sociology, 93(1), pp. 141-165.
27
Tables
Table 1: Number of observations1
Number of years since graduation (BA) 0 1 2 3 4 5 6 7 8 9 10 11 12 13
All ethnic groups 237256 208636 183246 159325 137691 117856 98362 80862 64919 50420 37850 27114 16552 7584 Israeli Arabs 16293 14377 12407 10627 9022 7440 5997 4744 3647 2688 2009 1397 860 383 Ethiopian immigrants 1059 876 724 586 482 384 269 189 139 76 42 28 14 6 Old Ethiopian immigrants* 227 212 194 170 149 132 103 79 70 38 23 17 10 4 Young Ethiopian immigrants** 832 664 530 416 333 252 166 110 69 38 19 11 4 2 Native Jews 199286 175147 154014 134153 116155 99667 83432 68762 55464 43328 32506 23302 14247 6609 FSU immigrants 20618 18236 16101 13959 12032 10365 8664 7167 5669 4328 3293 2387 1431 586 Young FSU immigrants* 10340 9918 9408 8753 7935 7173 6205 5264 4212 3221 2441 1761 1045 409 Old FSU immigrants** 10278 8318 6693 5206 4097 3192 2459 1903 1457 1107 852 626 386 177 *Immigrants who arrived after the age of 13.
** Immigrants who arrived before the age of 13.
Number of years since graduation (BA)
0 1 2 3 4 5 6 7 8 9 10 11 12 13
Israeli Arab men 7682 6639 5636 4736 3950 3280 2648 2109 1651 1225 886 593 365 178 Israeli Arab women 8611 7738 6771 5891 5072 4160 3349 2635 1996 1463 1123 804 495 205 Ethiopian immigrant men 386 319 271 218 188 157 118 95 75 39 23 16 10 5 Ethiopian immigrant women 673 557 453 368 294 227 151 94 64 37 19 12 4 1 Native Jewish men 82815 71667 62989 54136 46300 39554 32725 26446 21084 16472 12356 8834 5464 2567 Native Jewish women 116471 103480 91025 80017 69855 60113 50707 42316 34380 26856 20150 14468 8783 4042 FSU immigrant men 8182 7155 6581 5694 4844 4159 3486 2902 2326 1841 1404 1055 634 245 FSU immigrant women 12436 11081 9520 8265 7188 6206 5178 4265 3343 2487 1889 1332 797 341
Note: Includes only employed individuals.
28
Table 2: Estimation of log monthly wage function by OLS
All1 Male2 Female3 All4 Male5 Female6 I II III IV V VI Intercept 5.641***
(0.017)
5.235*** (0.030)
5.925*** (0.022)
5.547*** (0.022)
5.146*** (0.037)
5.791*** (0.027)
Addition to Intercept
Israeli Arabs
-0.016*** (0.004)
0.06*** (0.007)
-0.074*** (0.006)
-0.027*** (0.005)
0.054*** (0.008)
-0.083*** (0.006)
Ethiopian immigrants
-0.054*** (0.013)
-0.142*** (0.023)
-0.034** (0.017)
-0.069*** (0.014)
-0.174*** (0.025)
-0.041** (0.017)
Native Jews 0.0003 (0.003)
0.022*** (0.005)
-0.021*** (0.004)
0.0104*** (0.003)
0.034*** (0.005)
-0.013*** (0.004)
FSU immigrants
0 0 0 0 0 0
Slope
Israeli Arabs
0.054*** (0.0008)
0.0385*** (0.001)
0.062*** (0.001)
0.092*** (0.001)
0.066*** (0.002)
0.106*** (0.002)
Ethiopian immigrants
0.048*** (0.004)
0.053*** (0.006)
0.044*** (0.005)
0.094*** (0.004)
0.099*** (0.007)
0.087*** (0.006)
Native Jews 0.064*** (0.0003)
0.068*** (0.0005)
0.062*** (0.0004)
0.092*** (0.0008)
0.084*** (0.001)
0.099*** (0.001)
FSU immigrants
0.070*** (0.0007)
0.078*** (0.001)
0.064*** (0.001)
0.103*** (0.001)
0.098*** (0.002)
0.105*** (0.002)
Interaction between years since graduation and psychometric score
0-500 -0.041*** (0.0009)
-0.034*** (0.001)
-0.044*** (0.001)
500-550 -0.041*** (0.0009)
-0.029*** (0.001)
-0.047*** (0.001)
550-600 -0.029*** (0.0008)
-0.018*** (0.001)
-0.038*** (0.001)
600-650 -0.021*** (0.0008)
-0.009*** (0.001)
-0.029*** (0.001)
650-700 -0.011*** (0.0008)
-0.006*** (0.001)
-0.018*** (0.001)
700+ 0 0 0
• All regressions control for: age, gender, number of children, marital status, psychometric score, geographic region, type of academic education (college vs. university, MA or BA and field of study), number of months worked each year, cumulative months of absence from the labor market since graduation, cumulative number of workplaces, economic sector and year.
• Standard errors appear in parentheses. Levels of confidence: * significant at 10%; ** significant at 5%; *** significant at 1%.
1. All of the differences in the estimated intercept between the ethnic groups are significant except between native Jews and FSU immigrants. All the differences in the estimated slope between the ethnic groups are significant except between Israeli Arabs and Ethiopian immigrants.

29
2. In the case of men, all the differences in the estimated intercept and slope between ethnic groups are significant.
3. In the case of women, all the differences in the estimated intercept between the ethnic groups are significant except between Ethiopian immigrants and native Jews. All the differences in the estimated slope between the ethnic groups are significant except between Israeli Arabs on the one hand and native Jews and FSU immigrants on the other.
4. In the case of graduates with a psychometric score, all of the differences in the estimated intercept between the ethnic groups are significant. All the differences in the estimated slope between the ethnic groups are significant except between Israeli Arabs and Ethiopian immigrants on the one hand and native Jews on the other.
5. In the case of male graduates with a psychometric score, all the differences in the estimated intercept and slope between ethnic groups are significant except for the difference in estimated slope between Ethiopian immigrants and FSU immigrants.
6. In the case of female graduates with a psychometric score, all the differences in the estimated intercept between the ethnic groups are significant except between Ethiopian immigrants and native Jews. All the differences in the estimated slope between the ethnic groups are significant except between Israeli Arabs and FSU immigrants.
7. The differences between the wage functions of the various ethnic groups are presented in table 1 in the appendix.

30
Table 3: Estimation of log monthly wage by OLS for each ethnic group and gender
by age on arrival and years since graduation All1 Male2 Female3 All4 Male5 Female6
I II III IV V VI Intercept 5.641***
(0.018) 5.246*** (0.031)
5.913*** (0.022)
5.551*** (0.022)
5.165*** (0.038)
5.7832*** (0.027)
Addition to Intercept
Israeli Arabs
-0.017*** (0.005)
0.045*** (0.009)
-0.060*** (0.007)
-0.034*** (0.006)
0.026*** (0.009)
-0.072*** (0.007)
Old Ethiopian immigrants•
-0.140*** (0.027)
-0.249*** (0.035)
0.014 (0.041)
-0.172*** (0.029)
-0.306*** (0.039)
-0.0122 (0.046)
Young Ethiopian immigrants••
-0.033** (0.016)
-0.101*** (0.030)
-0.026 (0.019)
-0.052*** (0.017)
-0.139*** (0.032)
-0.0329* (0.019)
Native Jews -0.001 (0.004)
0.007 (0.007)
-0.006 (0.005)
0.003 (0.005)
0.007 (0.008)
-0.0016 (0.006)
Old FSU immigrants•
-0.004 (0.006)
-0.025*** (0.009)
0.024*** (0.007)
-0.015** (0.006)
-0.044*** (0.01)
0.0181** (0.007)
Young FSU immigrants••
0 0 0 0 0 0
Slope Israeli Arabs
0.054*** (0.001)
0.038*** (0.001)
0.062*** (0.001)
0.092*** (0.001)
0.066*** (0.002)
0.106*** (0.002)
Old Ethiopian immigrants•
0.043*** (0.007)
0.047*** (0.008)
0.0041*** (0.011)
0.102*** (0.008)
0.099*** (0.009)
0.0979*** (0.012)
Young Ethiopian immigrants••
0.057*** (0.005)
0.072*** (0.009)
0.044*** (0.006)
0.094*** (0.005)
0.107*** (0.009)
0.0829*** (0.006)
Native Jews 0.065*** (0.0003)
0.068*** (0.001)
0.062*** (0.0004)
0.092*** (0.0008)
0.084*** (0.001)
0.099*** (0.001)
Old FSU immigrants•
0.070*** (0.001)
0.081*** (0.001)
0.060*** (0.001)
0.103*** (0.001)
0.102*** (0.002)
0.101*** (0.001)
Young FSU immigrants••
0.073*** (0.001)
0.073*** (0.002)
0.072*** (0.002)
0.105*** (0.001)
0.089*** (0.002)
0.115*** (0.002)
Interaction between years since graduation and psychometric score
0-500 -0.041*** (0.0009)
-0.034*** (0.001)
-0.044*** (0.001)
500-550 -0.041*** (0.0009)
-0.029*** (0.001)
-0.047*** (0.001)
550-600 -0.029*** (0.0008)
-0.018*** (0.001)
-0.038*** (0.001)
600-650 -0.021*** (0.0008)
-0.009*** (0.001)
-0.029*** (0.001)
650-700 -0.011*** (0.0008)
-0.006*** (0.001)
-0.018*** (0.001)
700+ 0 0 0 • Immigrants who arrived in Israel after the age of 13. •• Immigrants who arrived in Israel before the age of 13.
• All regressions control for: age, gender, number of children, marital status, psychometric score, geographic region, type of academic education (college vs. university, MA or BA and field of study), number of months worked each year, cumulative months of absence from the labor market since graduation, cumulative number of workplaces, economic sector and year.
• Standard errors appear in parentheses. Levels of confidence: * significant at 10%; ** significant at 5%; *** significant at 1%.

31
1. All the differences in the estimated intercept between the ethnic groups are significant except between native Jews and all FSU immigrants and between Israeli Arabs and young Ethiopian immigrants. All the differences in the estimated slope between the ethnic groups are significant except between Israeli Arabs and Ethiopian immigrants and between young Ethiopian immigrants and native Jews.
2. All the differences in the estimated intercept between ethnic groups are significant for men except between native Jews and young FSU immigrants. All the differences in the estimated slope between ethnic groups are significant for men except between Israeli Arabs and old Ethiopian immigrants and between young Ethiopian immigrants on the one hand and native Jews and all FSU immigrants on the other.
3. All the differences in the estimated intercept between ethnic groups are significant for women except between old Ethiopian immigrants on the one hand and native Jews and all FSU immigrants on the other, between young Ethiopian immigrants on the one hand and native Jews and young FSU immigrants on the other and between native Jews and young FSU immigrants. All the differences in the estimated slope between ethnic groups are significant for women except between Israeli Arabs on the one hand and native Jews and old FSU immigrants on the other and between old Ethiopian immigrants and young Ethiopian immigrants.
4. For graduates with a psychometric score, all the differences in the estimated intercept between the ethnic groups are significant except between native Jews and young FSU immigrants and between Israeli Arabs and young Ethiopian immigrants. None of the differences in the estimated slope between the ethnic groups are significant except between Israeli Arabs and all FSU immigrants, between young Ethiopian immigrants and all FSU immigrants and between native Jews and all FSU immigrants.
5. For male graduates with a psychometric score, all the differences in the estimated intercept between the ethnic groups are significant except between native Jews and young FSU immigrants. All the differences in the estimated slope between ethnic groups are significant except between old Ethiopian immigrants and young Ethiopian immigrants, native Jews and all FSU immigrants and between young Ethiopian immigrants and old FSU immigrants.
6. For female graduates with a psychometric score, all the differences in the estimated intercept between the ethnic groups are significant except between old Ethiopian immigrants and all other ethnic groups and between native Jews and young FSU immigrants. All the differences in the estimated slope between ethnic groups are significant except between old Ethiopian immigrants and all other ethnic groups
7. The differences between the wage functions of the various ethnic groups are presented in table 2 in the appendix.

32
Appendix Table 1: Differences in the estimated intercept and coefficient of years since
graduation between the ethnic groups and by gender All Male Female All Male Female I II III IV V VI
Differences in the intercept
Israeli Arabs in comparison to Ethiopian immigrants
0.038*** (0.014)
0.202*** (0.023)
-0.039** (0.017)
0.042*** (0.015)
0.227*** (0.025)
-0.042** (0.018)
Israeli Arabs in comparison to native Jews
-0.016*** (0.004)
0.038*** (0.005)
-0.053*** (0.005)
-0.037*** (0.004)
0.019*** (0.006)
-0.070*** (0.005)
Israeli Arabs in comparison to FSU immigrants
-0.016*** (0.004)
0.06*** (0.007)
-0.074*** (0.006)
-0.027*** (0.005)
0.054*** (0.008)
-0.083*** (0.006)
Ethiopian immigrants in comparison to native Jews
-0.054*** (0.013)
-0.164*** (0.022).
-0.014 (0.016)
-0.079*** (0.014)
-0.208*** (0.025)
-0.026* (0.017)
Ethiopian immigrants in comparison to FSU immigrants
-0.054*** (0.014)
-0.142*** (0.023)
-0.034** (0.017)
-0.069*** (0.014)
-0.174*** (0.025)
-0.041** (0.017)
Native Jews in comparison to FSU immigrants
0.0003 (0.003)
0.022*** (0.005)
-0.021*** (0.004)
0.010*** (0.003)
0.034*** (0.005)
-0.013*** (0.004)
Differences in the effect of years since graduation
Israeli Arabs in comparison to Ethiopian immigrants
0.006 (0.004)
-0.015** (0.006)
0.018*** (0.005)
-0.002 (0.004)
-0.033*** (0.007)
0.019*** (0.005)
Israeli Arabs in comparison to native Jews
-0.011*** (0.0008)
-0.029*** (0.001)
-0.0001 (0.001)
-0.0005 (0.0009)
-0.018*** (0.002)
0.007*** (0.001)
Israeli Arabs in comparison to FSU immigrants
-0.017*** (0.001)
-0.039*** (0.002)
-0.002 (0.001)
-0.011*** (0.001)
-0.032*** (0.002)
0.0008 (0.001)
Ethiopian immigrants in comparison to native Jews
-0.016*** (0.004)
-0.015** (0.006)
-0.018*** (0.005)
0.002 (0.004)
0.015** (0.007)
-0.013** (0.005)
Ethiopian immigrants in comparison to FSU immigrants
-0.022*** (0.004)
-0.025*** (0.006)
-0.020*** (0.005)
-0.009** (0.004)
0.001 (0.007)
-0.019*** (0.005)
Native Jews in comparison to FSU immigrants
-0.006*** (0.0007)
-0.011*** (0.001)
-0.002* (0.0009)
-0.011*** (0.0008)
-0.014*** (0.001)
-0.006*** (0.001)
• Standard errors appear in parentheses. Levels of confidence: * significant at 10%; ** significant at 5%; *** significant at 1%.
• Columns IV, V and VI - only graduates with a psychometric score.

33
Table 2: Differences in the estimated intercept and coefficient of years since graduation between the ethnic groups and genders and by age on arrival
All Male Female All Male Female I II III IV V VI
Difference in the intercept
Israeli Arabs in comparison to old Ethiopian immigrants•
0.123*** 0.026
0.294*** (0.035)
-0.074* (0.041)
0.137*** (0.029)
0.332*** (0.039)
-0.059 (0.046)
Israeli Arabs in comparison to young Ethiopian immigrants••
0.016 0.016
0.145*** (0.030)
-0.034* (0.018)
0.017 (0.016)
0.166*** (0.032)
-0.039** (0.019)
Israelis Arabs in comparison to native Jews
-0.016*** 0.004
0.038*** (0.005)
-0.053*** (0.005)
-0.037*** (0.004)
0.019*** (0.006)
-0.070*** (0.005)
Israeli Arabs in comparison to old FSU immigrants•
-0.014*** (0.005)
0.070*** (0.008)
-0.084*** (0.007)
-0.019*** (0.005)
0.07*** (0.008)
-0.090*** (0.007)
Israeli Arabs in comparison to young FSU immigrants••
-0.017*** (0.005)
0.045*** (0.009)
-0.060*** (0.007)
-0.034*** (0.006)
0.026*** (0.009)
-0.072*** (0.007)
Old Ethiopian immigrants• in comparison to young Ethiopian immigrants••
-0.107*** (0.030)
-0.149*** (0.045)
0.040 (0.045)
-0.120*** (0.034)
-0.167*** (0.049)
0.021 (0.049)
Old Ethiopian immigrants• in comparison to native Jews
-0.139*** (0.026)
-0.256*** (0.035)
0.020 (0.041)
-0.174*** (0.029)
-0.313*** (0.039)
-0.011 (0.046)
Old Ethiopian immigrants in comparison to old FSU immigrants•
-0.136*** (0.027)
-0.224*** (0.035)
-0.010 (0.041)
-0.156*** (0.029)
-0.262*** (0.039)
-0.030 (0.046)
Old Ethiopian immigrants• in comparison to young FSU immigrants••
-0.140*** (0.027)
-0.249*** (0.035)
0.014 (0.041)
-0.172*** (0.029)
-0.306*** (0.039)
-0.012 (0.046)
Young Ethiopian immigrants•• in comparison to native Jews
-0.032** (0.015)
-0.107*** (0.029)
-0.020 (0.018)
-0.054*** (0.016)
-0.146*** (0.032)
-0.031* (0.018)
Young Ethiopian immigrants•• in comparison to old FSU immigrant•
-0.029* (0.016)
-0.076** (0.030)
-0.050*** (0.019)
-0.036** (0.017)
-0.096*** (0.032)
-0.051*** (0.019)
Young Ethiopian immigrants in comparisons to young FSU immigrants••
-0.033** (0.016)
-0.101*** (0.030)
-0.026 (0.019)
-0.052*** (0.017)
-0.139*** (0.032)
-0.033* (0.019)
Native Jews in comparison to old FSU immigrants•
0.003 (0.004)
0.032*** (0.006)
-0.030*** (0.005)
0.018*** (0.004)
0.050*** (0.006)
-0.019*** (0.005)
Native Jews in comparison to young FSU immigrants••
-0.001 (0.004)
0.007 (0.007)
-0.006 (0.005)
0.003 (0.005)
0.007 (0.008)
-0.002 (0.006)
Old FSU immigrants• in comparison to young FSU immigrants••
-0.004 (0.006)
-0.025*** (0.009)
0.024*** (0.007)
-0.015** (0.006)
-0.042*** (0.01)
0.018** (0.007)
• Immigrants who arrived in Israel after the age of 13. •• Immigrants who arrived in Israel before the age of 13.

34
Table 2 – continued All Male Female All Male Female I II III IV V VI
Difference in the effect of years since graduation
Israeli Arabs in comparison to old Ethiopian immigrants•
0.011 (0.007)
-0.009 (0.008)
0.021* (0.011)
-0.01 (0.008)
-0.032*** (0.009)
0.008 (0.012)
Israeli Arabs in comparison to young Ethiopian immigrants••
-0.003 (0.005)
-0.033*** (0.009)
0.018*** (0.006)
-0.002 (0.005)
-0.041*** (0.009)
0.023*** (0.006)
Israelis Arabs in comparison to native Jews
-0.011*** (0.001)
-0.029*** (0.001)
-0.0001 (0.001)
-0.0005 (0.0009)
-0.018*** (0.002)
0.007*** (0.001)
Israeli Arabs in comparison to old FSU immigrants•
-0.016*** (0.001)
-0.042*** (0.002)
0.002 (0.002)
-0.012*** (0.001)
-0.036*** (0.002)
0.005*** (0.002)
Israeli Arabs in comparison to young FSU immigrants••
-0.019*** (0.001)
-0.035*** (0.002)
-0.010*** (0.002)
-0.013*** (0.002)
-0.024*** (0.003)
-0.009*** (0.002)
Old Ethiopian immigrants• in comparison to young Ethiopian immigrants••
-0.014* (0.008)
-0.025** (0.012)
-0.003 (0.012)
0.008 (0.009)
-0.009 (0.013)
0.015 (0.014)
Old Ethiopian immigrants• in comparison to native Jews
-0.021*** (0.007)
-0.021** (0.008)
-0.021* (0.011)
0.009 (0.008)
0.015 (0.009)
-0.001 (0.012)
Old Ethiopian immigrants in comparison to old FSU immigrants•
-0.027*** (0.007)
-0.034*** (0.008)
-0.019* (0.011)
-0.002 (0.008)
-0.004 (0.009)
-0.003 (0.012)
Old Ethiopian immigrants• in comparison to young FSU immigrants••
-0.030*** (0.007)
-0.026*** (0.008)
-0.030*** (0.011)
-0.003 (0.008)
0.009 (0.010)
-0.017 (0.012)
Young Ethiopian immigrants•• in comparison to native Jews
-0.008 (0.005)
0.004 (0.009)
-0.018*** (0.006)
0.001 (0.005)
0.023** (0.009)
-0.016*** (0.006)
Young Ethiopian immigrants•• in comparison to old FSU immigrant•
-0.014*** (0.005)
-0.009 (0.009)
-0.016*** (0.006)
-0.009* (0.005)
0.005 (0.009)
-0.018*** (0.006)
Young Ethiopian immigrants in comparisons to young FSU immigrants••
-0.016*** (0.005)
-0.002 (0.009)
-0.028*** (0.006)
-0.011** (0.005)
0.017* (0.009)
-0.032*** (0.006)
Native Jews in comparison to old FSU immigrants•
-0.006*** (0.001)
-0.013*** (0.001)
0.002** (0.001)
-0.011*** (0.0009)
-0.018*** (0.002)
-0.002* (0.001)
Native Jews in comparison to young FSU immigrants••
-0.008*** (0.001)
-0.006*** (0.002)
-0.010*** (0.002)
-0.012*** (0.001)
-0.006** (0.002)
-0.016*** (0.002)
Old FSU immigrants• in comparison to young FSU immigrants••
-0.002* (0.002)
0.008*** (0.002)
-0.012*** (0.002)
-0.001 (0.002)
0.013*** (0.003)
-0.014*** (0.002)
• Immigrants who arrived in Israel after the age of 13. •• Immigrants who arrived in Israel before the age of 13.
1. Standard errors appear in parentheses. Levels of confidence: * significant at 10%; ** significant at 5%; *** significant at 1%.
2. Columns IV, V and VI - only graduates with a psychometric score.