
Evaporation kinetics and phase of laboratory and ambient ... · Evaporation kinetics and phase of...
6
Evaporation kinetics and phase of laboratory and ambient secondary organic aerosol Timothy D. Vaden a , Dan Imre b , Josef Beránek a , Manish Shrivastava a , and Alla Zelenyuk a,1 a Pacific Northwest National Lab, 902 Battelle Boulevard, Richland, WA 99352; and b Imre Consulting, Richland, WA 99352 Edited by* Barbara J. Finlayson-Pitts, University of California, Irvine, CA, and approved December 15, 2010 (received for review September 8, 2010) Field measurements of secondary organic aerosol (SOA) find signif- icantly higher mass loads than predicted by models, sparking intense effort focused on finding additional SOA sources but leav- ing the fundamental assumptions used by models unchallenged. Current air-quality models use absorptive partitioning theory assuming SOA particles are liquid droplets, forming instantaneous reversible equilibrium with gas phase. Further, they ignore the effects of adsorption of spectator organic species during SOA for- mation on SOA properties and fate. Using accurate and highly sen- sitive experimental approach for studying evaporation kinetics of size-selected single SOA particles, we characterized room-tempera- ture evaporation kinetics of laboratory-generated α-pinene SOA and ambient atmospheric SOA. We found that even when gas phase organics are removed, it takes ∼24 h for pure α-pinene SOA particles to evaporate 75% of their mass, which is in sharp contrast to the ∼10 min time scale predicted by current kinetic models. Adsorption of “spectator” organic vapors during SOA formation, and aging of these coated SOA particles, dramatically reduced the evaporation rate, and in some cases nearly stopped it. Ambient SOA was found to exhibit evaporation behavior very similar to that of laboratory-generated coated and aged SOA. For all cases studied in this work, SOA evaporation behavior is nearly size-independent and does not follow the evaporation kinetics of liquid droplets, in sharp contrast with model assumptions. The findings about SOA phase, evaporation rates, and the importance of spectator gases and aging all indicate that there is need to reformulate the way SOA formation and evaporation are treated by models. single-particle mass spectrometry ∣ morphology A tmospheric particles have a strong, yet poorly characterized effect on climate (1). Organic aerosols (OA) comprise 20–90% of atmospheric dry particles mass (2), the majority and least understood of which is secondary organic aerosol (SOA), formed from oxidation of gas phase organic vapors in the atmosphere (3–6). Despite an ongoing intense research effort aimed at understanding the formation and atmospheric evolution of OA, current models severely underestimate the formation of SOA in the atmosphere (5, 7). The effort to resolve the persistent discrepancy between field measurements and the amount of SOA predicted by atmospheric chemistry models has mostly focused on improving the understanding of SOA formation yields and finding new sources (8–11). In contrast, present models maintain the following fundamental assumptions: (i) Gas-particle parti- tioning is modeled assuming that all organics form a pseudoideal solution in the condensed particle phase, (ii) SOA particles remain liquid-like throughout their lifetime in the atmosphere, (iii) reversible thermodynamic equilibrium exists between gas and particle phases, and (iv) adsorption of other organic species and their effects on SOA properties and evaporation are ignored. The assumption that particles are liquid is central to all modeling studies and affects calculations of condensation and evaporation of particles in the atmosphere. Properties and beha- vior of multicomponent liquids are clearly very different from multicomponent solids. Seven orders of magnitude lower diffu- sion rates within a solid phase limit most gas–particle interactions to surface layer for solid particles (12). As mixed solid particle evaporation proceeds, the solid surfaces change resulting in dynamic changes in evaporation rates. As we show below, the evaporation kinetics of laboratory- generated and ambient SOA indicate that these particles are not liquid and do not behave as expected by the models. These find- ings are in accord with a recent report, in which SOA particle bouncing behavior was used to conclude that SOA particles are amorphous solids (13). In their box modeling study of the Mexico City plume, Dzepina et al. (6) found that adding precursors and SOA formation mechanisms (9) increases modeled SOA mass, bringing model predictions closer to measurements. However, when evaporation is considered, their models predict that more than 3∕4 of the SOA mass evaporates upon dilution by a factor of 10, in sharp contrast with measurements. The same study attempted to model mea- sured SOA evaporation in thermodenuder (TD) and concluded that to get better agreement with field measurements requires SOA evaporation coefficients that are 1–3 orders of magnitude below unity (6), which leads to inconsistency with smog chamber SOA formation measurements. Nearly all SOA evaporation studies rely on TD, which involve measurements on particles exposed for a short time to elevated temperatures. Using TD, Huffman et al. (14) observed that laboratory-generated SOA is more volatile than ambient SOA. Most recent analysis of field TD datasets concludes that a signif- icant fraction of the atmospheric OA consist of nonvolatile components (15). Although TD produces valuable data, their interpretation is challenging. There are issues related to non- linear coupling effects between various parameters such as initial aerosol compositions, enthalpies of vaporization, volatility distri- butions, and evaporation coefficients governing particle evapora- tion rates (16). Most importantly, if the SOA particles are not liquid droplets, increasing particle temperature may result in phase change and with it a change in evaporation behavior. Grieshop et al. (17) studied the kinetics of dilution-induced evaporation of polydisperse SOA in a smog chamber at room temperature and concluded that the system returns to equili- brium by evaporation within ∼2.5 h. They attributed this “surpris- ingly slow” evaporation rate to the formation of low-volatility oligomers (17). However, comparison between the evaporation kinetics observed in Grieshop et al. (17) and in our laboratory indicates that 2.5 h is most likely the point at which the evapora- tion rate slows down and not where it ends. It has also been sug- gested that this dilution-induced evaporation type of experiment could be strongly affected by material deposited on smog cham- ber walls (18). In this paper, we present results from a comprehensive inves- tigation of SOA evaporation kinetics using a newly developed, Author contributions: D.I., M.S., and A.Z. designed research; T.D.V., J.B., and A.Z. performed research; A.Z. contributed new reagents/analytic tools; T.D.V., D.I., J.B., M.S., and A.Z. analyzed data; and T.D.V., D.I., J.B., M.S., and A.Z. wrote the paper. The authors declare no conflict of interest. *This Direct Submission article had a prearranged editor. 1 To whom correspondence should be addressed. E-mail: [email protected]. This article contains supporting information online at www.pnas.org/lookup/suppl/ doi:10.1073/pnas.1013391108/-/DCSupplemental. 2190–2195 ∣ PNAS ∣ February 8, 2011 ∣ vol. 108 ∣ no. 6 www.pnas.org/cgi/doi/10.1073/pnas.1013391108 Downloaded by guest on May 10, 2020
Transcript of Evaporation kinetics and phase of laboratory and ambient ... · Evaporation kinetics and phase of...

Evaporation kinetics and phase of laboratoryand ambient secondary organic aerosolTimothy D. Vadena, Dan Imreb, Josef Beráneka, Manish Shrivastavaa, and Alla Zelenyuka,1
aPacific Northwest National Lab, 902 Battelle Boulevard, Richland, WA 99352; and bImre Consulting, Richland, WA 99352
Edited by* Barbara J. Finlayson-Pitts, University of California, Irvine, CA, and approved December 15, 2010 (received for review September 8, 2010)
Field measurements of secondary organic aerosol (SOA) find signif-icantly higher mass loads than predicted by models, sparkingintense effort focused on finding additional SOA sources but leav-ing the fundamental assumptions used by models unchallenged.Current air-quality models use absorptive partitioning theoryassuming SOA particles are liquid droplets, forming instantaneousreversible equilibrium with gas phase. Further, they ignore theeffects of adsorption of spectator organic species during SOA for-mation on SOA properties and fate. Using accurate and highly sen-sitive experimental approach for studying evaporation kinetics ofsize-selected single SOA particles, we characterized room-tempera-ture evaporation kinetics of laboratory-generated α-pinene SOAand ambient atmospheric SOA. We found that even when gasphase organics are removed, it takes ∼24 h for pure α-pinene SOAparticles to evaporate 75% of their mass, which is in sharp contrastto the ∼10 min time scale predicted by current kinetic models.Adsorption of “spectator” organic vapors during SOA formation,and aging of these coated SOA particles, dramatically reducedthe evaporation rate, and in some cases nearly stopped it. AmbientSOAwas found to exhibit evaporation behavior very similar to thatof laboratory-generated coated and aged SOA. For all cases studiedin this work, SOA evaporation behavior is nearly size-independentand does not follow the evaporation kinetics of liquid droplets, insharp contrast with model assumptions. The findings about SOAphase, evaporation rates, and the importance of spectator gasesand aging all indicate that there is need to reformulate the waySOA formation and evaporation are treated by models.
single-particle mass spectrometry ∣ morphology
Atmospheric particles have a strong, yet poorly characterizedeffect on climate (1). Organic aerosols (OA) comprise
20–90% of atmospheric dry particles mass (2), the majorityand least understood of which is secondary organic aerosol(SOA), formed from oxidation of gas phase organic vapors inthe atmosphere (3–6). Despite an ongoing intense research effortaimed at understanding the formation and atmospheric evolutionof OA, current models severely underestimate the formation ofSOA in the atmosphere (5, 7). The effort to resolve the persistentdiscrepancy between field measurements and the amount of SOApredicted by atmospheric chemistry models has mostly focusedon improving the understanding of SOA formation yields andfinding new sources (8–11). In contrast, present models maintainthe following fundamental assumptions: (i) Gas-particle parti-tioning is modeled assuming that all organics form a pseudoidealsolution in the condensed particle phase, (ii) SOA particlesremain liquid-like throughout their lifetime in the atmosphere,(iii) reversible thermodynamic equilibrium exists between gasand particle phases, and (iv) adsorption of other organic speciesand their effects on SOA properties and evaporation are ignored.
The assumption that particles are liquid is central to allmodeling studies and affects calculations of condensation andevaporation of particles in the atmosphere. Properties and beha-vior of multicomponent liquids are clearly very different frommulticomponent solids. Seven orders of magnitude lower diffu-sion rates within a solid phase limit most gas–particle interactionsto surface layer for solid particles (12). As mixed solid particle
evaporation proceeds, the solid surfaces change resulting indynamic changes in evaporation rates.
As we show below, the evaporation kinetics of laboratory-generated and ambient SOA indicate that these particles are notliquid and do not behave as expected by the models. These find-ings are in accord with a recent report, in which SOA particlebouncing behavior was used to conclude that SOA particles areamorphous solids (13).
In their box modeling study of theMexico City plume, Dzepinaet al. (6) found that adding precursors and SOA formationmechanisms (9) increases modeled SOA mass, bringing modelpredictions closer to measurements. However, when evaporationis considered, their models predict that more than 3∕4 of the SOAmass evaporates upon dilution by a factor of 10, in sharp contrastwith measurements. The same study attempted to model mea-sured SOA evaporation in thermodenuder (TD) and concludedthat to get better agreement with field measurements requiresSOA evaporation coefficients that are 1–3 orders of magnitudebelow unity (6), which leads to inconsistency with smog chamberSOA formation measurements.
Nearly all SOA evaporation studies rely on TD, which involvemeasurements on particles exposed for a short time to elevatedtemperatures. Using TD, Huffman et al. (14) observed thatlaboratory-generated SOA is more volatile than ambient SOA.Most recent analysis of field TD datasets concludes that a signif-icant fraction of the atmospheric OA consist of nonvolatilecomponents (15). Although TD produces valuable data, theirinterpretation is challenging. There are issues related to non-linear coupling effects between various parameters such as initialaerosol compositions, enthalpies of vaporization, volatility distri-butions, and evaporation coefficients governing particle evapora-tion rates (16). Most importantly, if the SOA particles are notliquid droplets, increasing particle temperature may result inphase change and with it a change in evaporation behavior.
Grieshop et al. (17) studied the kinetics of dilution-inducedevaporation of polydisperse SOA in a smog chamber at roomtemperature and concluded that the system returns to equili-brium by evaporation within ∼2.5 h. They attributed this “surpris-ingly slow” evaporation rate to the formation of low-volatilityoligomers (17). However, comparison between the evaporationkinetics observed in Grieshop et al. (17) and in our laboratoryindicates that 2.5 h is most likely the point at which the evapora-tion rate slows down and not where it ends. It has also been sug-gested that this dilution-induced evaporation type of experimentcould be strongly affected by material deposited on smog cham-ber walls (18).
In this paper, we present results from a comprehensive inves-tigation of SOA evaporation kinetics using a newly developed,
Author contributions: D.I., M.S., and A.Z. designed research; T.D.V., J.B., and A.Z.performed research; A.Z. contributed new reagents/analytic tools; T.D.V., D.I., J.B., M.S.,and A.Z. analyzed data; and T.D.V., D.I., J.B., M.S., and A.Z. wrote the paper.
The authors declare no conflict of interest.
*This Direct Submission article had a prearranged editor.1To whom correspondence should be addressed. E-mail: [email protected].
This article contains supporting information online at www.pnas.org/lookup/suppl/doi:10.1073/pnas.1013391108/-/DCSupplemental.
2190–2195 ∣ PNAS ∣ February 8, 2011 ∣ vol. 108 ∣ no. 6 www.pnas.org/cgi/doi/10.1073/pnas.1013391108
Dow
nloa
ded
by g
uest
on
May
10,
202
0

highly sensitive experimental setup that allowed us to conducta number of measurements that were not made before. We(i) characterized the evaporation of size-selected SOA particlesat room temperature, (ii) monitored SOA evaporation for over24 h, (iii) investigated the effect of hydrophobic “spectator”organic vapors on SOA evaporation, (iv) quantified the effectof aging on the evaporation kinetics of pure and coated SOAparticles, and (v) studied the evaporation kinetics of size and che-mically resolved ambient SOA particles at room temperature.
Results and DiscussionThe schematic of the experimental setup is shown in Fig. 1.Laboratory SOA particles were generated in a Teflon bag bythe reaction of α-pinene with ozone. Once reaction was complete,they were classified using a differential mobility analyzer (DMA),and the resulting monodisperse aerosol was transported throughtwo room-temperature activated charcoal denuders and loadedinto an evaporation chamber containing activated charcoal.The fact that particles were generated in a separate chamberand that gas phase organics in the evaporation chamber were con-tinuously removed eliminates the issue of gas–wall repartitioning.Low particle number–concentrations in the chamber (∼10–200particles cm−3) provide the means to follow kinetics of single-particle evaporation. SOA evaporation kinetics were monitoredfor over a ∼24-h period by periodically measuring changes in par-ticle vacuum aerodynamic diameter, dva, distributions, and massspectra using our single-particle mass spectrometer, SPLAT II(19). In experiments involving spectator gases, small amountsof dioctyl phthalate (DOP), dioctyl sebacate (DOS), and pyrene(PY), or a mixture of organics were placed at the bottom of theTeflon bag and allowed to equilibrate before reaction started. Asevident by the particle mass spectra, SOA formed under theseconditions acquire a coating of the spectator organic compound(20). Ambient particles were dried and then treated in the samemanner as the laboratory particles.
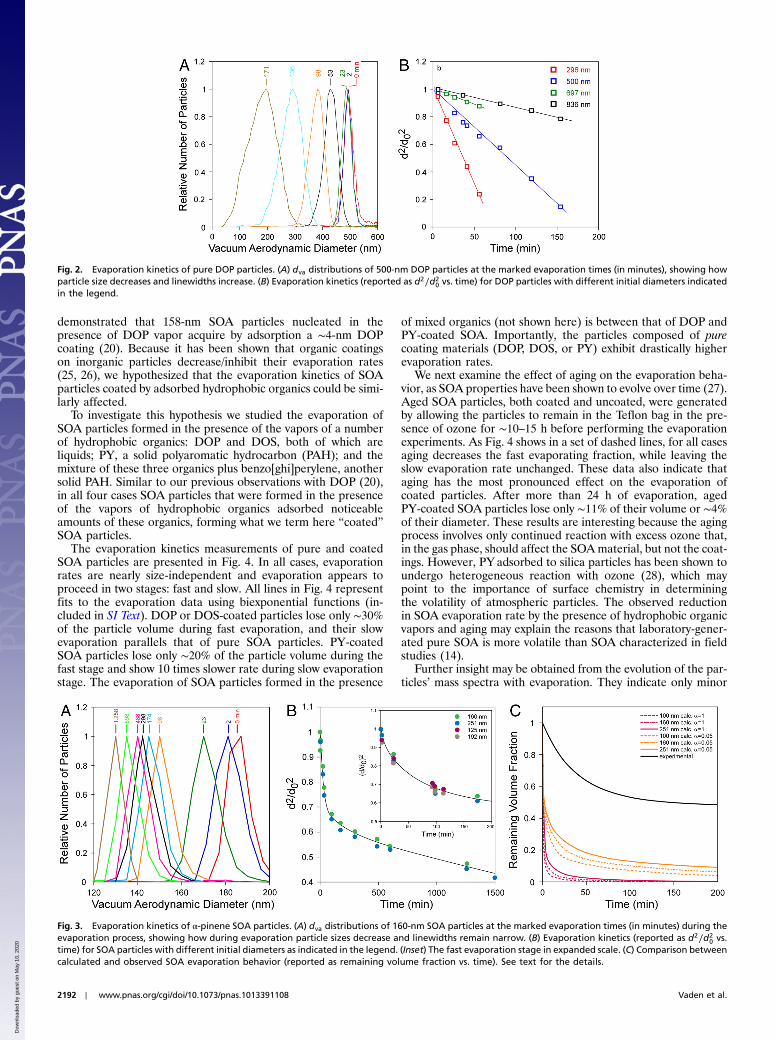
Evaporation Kinetics of Single-Component Test Particles.We first pre-sent, in Fig. 2, results of evaporation studies for single-componentparticles composed of DOP. Fig. 2A shows how the dva of DOPparticles with initial diameter d0 ¼ 500 nm decreases as a func-tion of time as the particles evaporate. Fig. 2B shows how particlediameters, d, decrease during evaporation in a plot of d2∕d20 vs.time. The data agree with traditional models of single-componentliquid droplet evaporation, which predict that the square of theparticle diameter decreases nearly linearly with time (21) and thatthe slope of d2∕d20 vs. time is size-dependent; that is, smaller par-ticles evaporate faster. This size-dependent evaporation behavioralso quantitatively explains the observed increase in the width ofthe dva distributions as the particles evaporate. DOP particles onthe left edge of the size distribution (slightly smaller) evaporatefaster than the larger particles on the right edge of the distribu-tion. Applying the analysis of Zhang et al. (22) to these data, weobtain, from the slope of d2∕d20 vs. time, a vapor pressure of 10−7Torr, in excellent agreement with previously reported values (23).
These measurements validate the experimental methodologyand introduce the time scales expected for particle evaporation:300-nm DOP particles, whose vapor pressure is 10−7 Torr, losemore than 70% of their volume by evaporation in 1 h, whereas700-nm DOP particles lose less than 20% of their volume overthe same time.
Evaporation Kinetics of Pure Laboratory SOA. We proceed to inves-tigate the evaporation kinetics of α-pinene SOA particles. Theresults of these measurements are summarized in Fig. 3. Fig. 3Ashows how the dva of SOA particles with d0 ¼ 160 nm, i.e., dva0 ¼187 nm, decreases during evaporation. After comparison withFig. 2, two observations are notable. First, the diameters ofSOA particles decrease with time significantly slower, and sec-ond, the dva distributions remain narrow during SOA particlesevaporation. Fig. 3B shows d2∕d20 as a function of evaporationtime for SOA particles with different initial diameters. Evidently,SOA particles undergo evaporation in two distinct stages. In thefast evaporation stage particles lose ∼50% of their volume in lessthan 100 min, whereas in the slow stage, it takes an additional1,400 min to lose another ∼25% of their initial volume. Moreover,Fig. 3B shows that the evaporation kinetics of SOA particles isnearly size-independent.
Fig. 3C presents a comparison between modeled and observedSOA evaporation behavior, plotted here and in the rest of thefigures as d3va∕d3va0, i.e., the remaining volume fraction, as a func-tion of time. Calculations for three particle sizes (100, 160, and251 nm) are performed using a detailed kinetic model thatemploys the seven-product volatility basis sets developed to fitSOA formation data during α-pinene ozonolysis (24), and usingtwo different mass accommodation coefficients (α) of 1.0 and0.05 (16). Note that although α ¼ 1 is consistent with observedSOA formation rates, α ¼ 0.05 leads to SOA formation rates thatare inconsistent with smog chamber measurements. Nevertheless,we use both values to illustrate that even unreasonably low α donot yield agreement with experiment. There are two importantdifferences between modeled and observed evaporation kinetics.First, calculated evaporation rates are much faster than observed.For example, according to the model, 151-nm particles will lose75% of their volume in 1 to 20 min of evaporation, depending onthe mass accommodation coefficient, whereas the data show thatin reality it takes over 24 h, independent of particle size. Second,calculated SOA evaporation behavior shows the expected sizedependence, with larger particles evaporating significantlyslower. In contrast, the observed data are nearly size-indepen-dent. It should be noted that all models based on fits to smogchamber data yield similar fast evaporation rates and size-depen-dent behavior. The simple fact that SOA evaporation does notfollow the size-dependent evaporation behavior expected ofliquid droplets indicates that these particles are not liquid-like.
Evaporation Kinetics of Coated Laboratory SOA. In the real atmo-sphere SOA particles form in the presence of a mixture of organicvapors, some of which are hydrophobic. We have previously
Fig. 1. Schematic of the experimental setup.
Vaden et al. PNAS ∣ February 8, 2011 ∣ vol. 108 ∣ no. 6 ∣ 2191
ENVIRONMEN
TAL
SCIENCE
S
Dow
nloa
ded
by g
uest
on
May
10,
202
0
demonstrated that 158-nm SOA particles nucleated in thepresence of DOP vapor acquire by adsorption a ∼4-nm DOPcoating (20). Because it has been shown that organic coatingson inorganic particles decrease/inhibit their evaporation rates(25, 26), we hypothesized that the evaporation kinetics of SOAparticles coated by adsorbed hydrophobic organics could be simi-larly affected.
To investigate this hypothesis we studied the evaporation ofSOA particles formed in the presence of the vapors of a numberof hydrophobic organics: DOP and DOS, both of which areliquids; PY, a solid polyaromatic hydrocarbon (PAH); and themixture of these three organics plus benzo[ghi]perylene, anothersolid PAH. Similar to our previous observations with DOP (20),in all four cases SOA particles that were formed in the presenceof the vapors of hydrophobic organics adsorbed noticeableamounts of these organics, forming what we term here “coated”SOA particles.
The evaporation kinetics measurements of pure and coatedSOA particles are presented in Fig. 4. In all cases, evaporationrates are nearly size-independent and evaporation appears toproceed in two stages: fast and slow. All lines in Fig. 4 representfits to the evaporation data using biexponential functions (in-cluded in SI Text). DOP or DOS-coated particles lose only ∼30%of the particle volume during fast evaporation, and their slowevaporation parallels that of pure SOA particles. PY-coatedSOA particles lose only ∼20% of the particle volume during thefast stage and show 10 times slower rate during slow evaporationstage. The evaporation of SOA particles formed in the presence
of mixed organics (not shown here) is between that of DOP andPY-coated SOA. Importantly, the particles composed of purecoating materials (DOP, DOS, or PY) exhibit drastically higherevaporation rates.
We next examine the effect of aging on the evaporation beha-vior, as SOA properties have been shown to evolve over time (27).Aged SOA particles, both coated and uncoated, were generatedby allowing the particles to remain in the Teflon bag in the pre-sence of ozone for ∼10–15 h before performing the evaporationexperiments. As Fig. 4 shows in a set of dashed lines, for all casesaging decreases the fast evaporating fraction, while leaving theslow evaporation rate unchanged. These data also indicate thataging has the most pronounced effect on the evaporation ofcoated particles. After more than 24 h of evaporation, agedPY-coated SOA particles lose only ∼11% of their volume or ∼4%of their diameter. These results are interesting because the agingprocess involves only continued reaction with excess ozone that,in the gas phase, should affect the SOAmaterial, but not the coat-ings. However, PYadsorbed to silica particles has been shown toundergo heterogeneous reaction with ozone (28), which maypoint to the importance of surface chemistry in determiningthe volatility of atmospheric particles. The observed reductionin SOA evaporation rate by the presence of hydrophobic organicvapors and aging may explain the reasons that laboratory-gener-ated pure SOA is more volatile than SOA characterized in fieldstudies (14).
Further insight may be obtained from the evolution of the par-ticles’ mass spectra with evaporation. They indicate only minor
Fig. 2. Evaporation kinetics of pure DOP particles. (A) dva distributions of 500-nm DOP particles at the marked evaporation times (in minutes), showing howparticle size decreases and linewidths increase. (B) Evaporation kinetics (reported as d2∕d2
0 vs. time) for DOP particles with different initial diameters indicatedin the legend.
Fig. 3. Evaporation kinetics of α-pinene SOA particles. (A) dva distributions of 160-nm SOA particles at the marked evaporation times (in minutes) during theevaporation process, showing how during evaporation particle sizes decrease and linewidths remain narrow. (B) Evaporation kinetics (reported as d2∕d2
0 vs.time) for SOA particles with different initial diameters as indicated in the legend. (Inset) The fast evaporation stage in expanded scale. (C) Comparison betweencalculated and observed SOA evaporation behavior (reported as remaining volume fraction vs. time). See text for the details.
2192 ∣ www.pnas.org/cgi/doi/10.1073/pnas.1013391108 Vaden et al.
Dow
nloa
ded
by g
uest
on
May
10,
202
0

changes for m∕z smaller than 200 amu, disappearance of the peakat m∕z ¼ 201 after 2 min of evaporation, and, at later times, slowincrease of intensity of peaks with m∕z higher than 202, whichcould indicate oligomer formation (29). However, we note thataging alone produces no observable changes in particle massspectra. The changes in mass-spectral intensities with evapora-tion time are illustrated in Fig. S1. The intensity of the DOP-char-acteristic peak (C6H4ðCOÞ2OHþ, m∕z ¼ 149) in DOP-coatedSOA particles, rapidly drops with evaporation time, and thenremains constant. The PY parent ion peak (m∕z ¼ 202), in PY-coated SOA, decreases slowly, such that ∼50% of it remains evenafter 25 h of evaporation. The comparison between PYand DOPsuggests that there are differences in morphological distributionof solid PY and liquid DOP in the coated SOA.
Evaporation Kinetics of Atmospheric SOA.To address the question ofhow closely the laboratory observations described above reflectreality in the atmosphere, we characterized the evaporationkinetics of atmospheric SOA particles sampled in situ duringthe recent Carbonaceous Aerosols and Radiative Effects Study(CARES) field campaign in Sacramento, CA, in June 2010.Because in the real atmosphere aerosol compositions changethroughout the day, the first task was to identify the point atwhich SOA dominates the particle compositions. This was accom-plished by following the diurnal evolution of particle number con-centrations, size distributions, compositions, and densities. Early
in the morning aerosol loadings and number concentrations werelow, and most particles were composed of organics mixed with asignificant fraction of sulfate, with larger particles containing alarger fraction of sulfate (30). By ∼9:00 AM, the number concen-trations of very small particles (<14 nm) started to increase,indicating the beginning of SOA nucleation events. As the dayprogressed and emissions of the volatile organic compounds wereprocessed, SOA particles increased in size, making it possible tocharacterize their size, composition, and density with SPLAT II.By early afternoon aerosol composition was dominated by oxyge-nated organics mixed with a small amount of organic amines andsulfate (∼12% volume fraction), and the density of both 100-nmand 151-nm particles was measured to be 1.32� 0.02 g cm−3. Atthis point size-selected 100- and 151-nm particles were loadedinto the evaporation chamber and their evaporation behaviorwas studied.
Fig. 5 shows the changes in the measured dva distributions of100-nm ambient particles measured on June 26 over 208 min ofevaporation. At t ¼ 0 the particles average dva is 133 nm, whichyields a density of 1.33 g cm−3 (see SI Text). With time in thechamber, the particles evaporate and after 208 min they shrinkto 125 nm, i.e., lose 17% of their volume. Note that as the organicfraction of the particle evaporates, its sulfate fraction, and hencedensity, slightly increases, which when taken into account meansthat the actual evaporated volume of organics is 20%. Fig. 5Bshows the remaining volume fraction for 100-nm and 151-nm par-ticles as a function of time. Notably, the evaporation behavior ofthe atmospheric SOA is similar to that of laboratory-generatedcoated SOA. It is slow, size-independent, and can be fit with abiexponential curve that represents the fast and slow evaporationphases (see SI Text). Here, only a small fraction of the volume(0.135) is lost during the fast evaporation phase.
Although it is true that the vast majority of atmospheric par-ticles were SOA, it is worth keeping in mind that the data in Fig. 5are an average of all sampled particle types. It is possible to refinethe analysis by classifying the data according to particle composi-tions and examine the evaporation of the individual classes. Themass spectra show that in addition to SOA-dominated particles, asmall fraction of biomass burning and soot particles were alsopresent, but their small numbers prevent us from analyzing theirbehavior in the evaporation chamber.
Two distinct types of SOA particles mixed with sulfate wereobserved on June 25, 26, and 27. Both types, labeled Type 44and Type 43 to denote which of these two mass-spectral peakshas higher intensity prior to particle evaporation (Fig. S2), aredominated by oxygenated organics, have identical density, andare mixed with the same amount of sulfate (∼12%). Type 43 par-ticles contain in addition to oxygenated organics and sulfate asmall amount of organic amines.
Fig. 4. Evaporation kinetics (reported as remaining volume fraction vs. time)for a number of the particle types indicated in the legend. All lines representbiexponential fits to the data. For each particle type, a single line is used to fitdifferent sizes, and a single line is used to fit the DOP- and DOS-coated par-ticles. Dashed lines represent evaporation of aged particles.
Fig. 5. Evaporation kinetics of ambient particles. (A) dva distributions of 100-nm ambient particles at the marked evaporation times (in minutes). (B) Evapora-tion kinetics (reported as remaining volume fraction) for ambient 100-nm and 151-nm particles. The solid line is a biexponential fit to the data.
Vaden et al. PNAS ∣ February 8, 2011 ∣ vol. 108 ∣ no. 6 ∣ 2193
ENVIRONMEN
TAL
SCIENCE
S
Dow
nloa
ded
by g
uest
on
May
10,
202
0
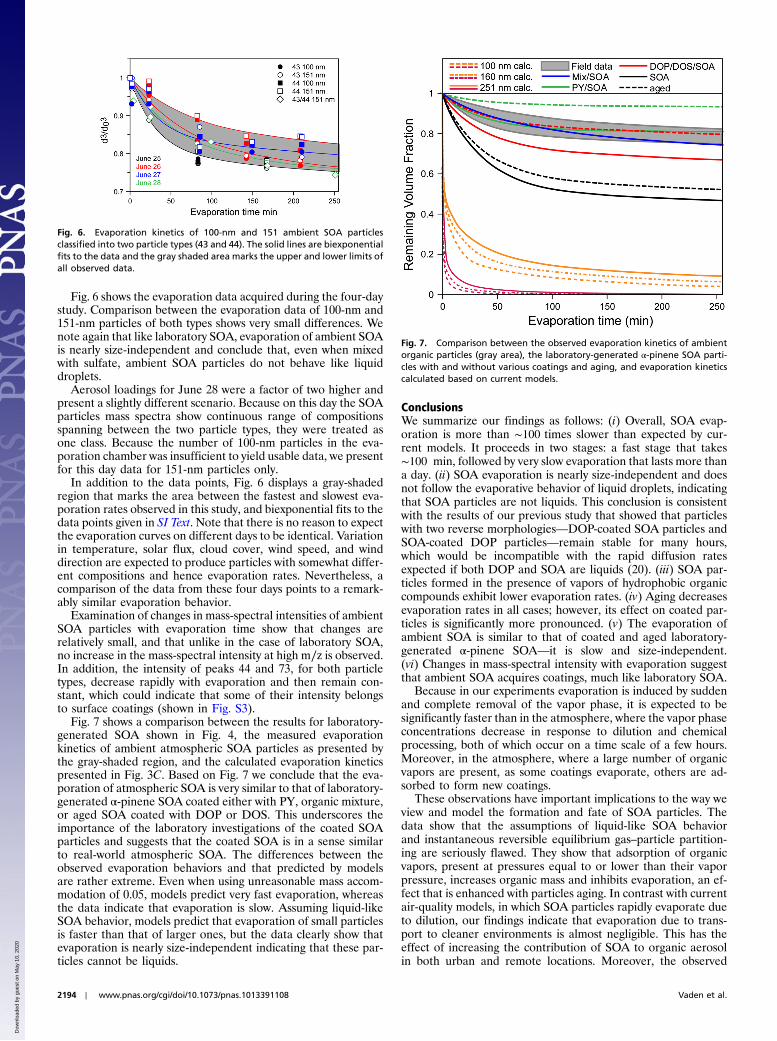
Fig. 6 shows the evaporation data acquired during the four-daystudy. Comparison between the evaporation data of 100-nm and151-nm particles of both types shows very small differences. Wenote again that like laboratory SOA, evaporation of ambient SOAis nearly size-independent and conclude that, even when mixedwith sulfate, ambient SOA particles do not behave like liquiddroplets.
Aerosol loadings for June 28 were a factor of two higher andpresent a slightly different scenario. Because on this day the SOAparticles mass spectra show continuous range of compositionsspanning between the two particle types, they were treated asone class. Because the number of 100-nm particles in the eva-poration chamber was insufficient to yield usable data, we presentfor this day data for 151-nm particles only.
In addition to the data points, Fig. 6 displays a gray-shadedregion that marks the area between the fastest and slowest eva-poration rates observed in this study, and biexponential fits to thedata points given in SI Text. Note that there is no reason to expectthe evaporation curves on different days to be identical. Variationin temperature, solar flux, cloud cover, wind speed, and winddirection are expected to produce particles with somewhat differ-ent compositions and hence evaporation rates. Nevertheless, acomparison of the data from these four days points to a remark-ably similar evaporation behavior.
Examination of changes in mass-spectral intensities of ambientSOA particles with evaporation time show that changes arerelatively small, and that unlike in the case of laboratory SOA,no increase in the mass-spectral intensity at high m∕z is observed.In addition, the intensity of peaks 44 and 73, for both particletypes, decrease rapidly with evaporation and then remain con-stant, which could indicate that some of their intensity belongsto surface coatings (shown in Fig. S3).
Fig. 7 shows a comparison between the results for laboratory-generated SOA shown in Fig. 4, the measured evaporationkinetics of ambient atmospheric SOA particles as presented bythe gray-shaded region, and the calculated evaporation kineticspresented in Fig. 3C. Based on Fig. 7 we conclude that the eva-poration of atmospheric SOA is very similar to that of laboratory-generated α-pinene SOA coated either with PY, organic mixture,or aged SOA coated with DOP or DOS. This underscores theimportance of the laboratory investigations of the coated SOAparticles and suggests that the coated SOA is in a sense similarto real-world atmospheric SOA. The differences between theobserved evaporation behaviors and that predicted by modelsare rather extreme. Even when using unreasonable mass accom-modation of 0.05, models predict very fast evaporation, whereasthe data indicate that evaporation is slow. Assuming liquid-likeSOA behavior, models predict that evaporation of small particlesis faster than that of larger ones, but the data clearly show thatevaporation is nearly size-independent indicating that these par-ticles cannot be liquids.
ConclusionsWe summarize our findings as follows: (i) Overall, SOA evap-oration is more than ∼100 times slower than expected by cur-rent models. It proceeds in two stages: a fast stage that takes∼100 min, followed by very slow evaporation that lasts more thana day. (ii) SOA evaporation is nearly size-independent and doesnot follow the evaporative behavior of liquid droplets, indicatingthat SOA particles are not liquids. This conclusion is consistentwith the results of our previous study that showed that particleswith two reverse morphologies—DOP-coated SOA particles andSOA-coated DOP particles—remain stable for many hours,which would be incompatible with the rapid diffusion ratesexpected if both DOP and SOA are liquids (20). (iii) SOA par-ticles formed in the presence of vapors of hydrophobic organiccompounds exhibit lower evaporation rates. (iv) Aging decreasesevaporation rates in all cases; however, its effect on coated par-ticles is significantly more pronounced. (v) The evaporation ofambient SOA is similar to that of coated and aged laboratory-generated α-pinene SOA—it is slow and size-independent.(vi) Changes in mass-spectral intensity with evaporation suggestthat ambient SOA acquires coatings, much like laboratory SOA.
Because in our experiments evaporation is induced by suddenand complete removal of the vapor phase, it is expected to besignificantly faster than in the atmosphere, where the vapor phaseconcentrations decrease in response to dilution and chemicalprocessing, both of which occur on a time scale of a few hours.Moreover, in the atmosphere, where a large number of organicvapors are present, as some coatings evaporate, others are ad-sorbed to form new coatings.
These observations have important implications to the way weview and model the formation and fate of SOA particles. Thedata show that the assumptions of liquid-like SOA behaviorand instantaneous reversible equilibrium gas–particle partition-ing are seriously flawed. They show that adsorption of organicvapors, present at pressures equal to or lower than their vaporpressure, increases organic mass and inhibits evaporation, an ef-fect that is enhanced with particles aging. In contrast with currentair-quality models, in which SOA particles rapidly evaporate dueto dilution, our findings indicate that evaporation due to trans-port to cleaner environments is almost negligible. This has theeffect of increasing the contribution of SOA to organic aerosolin both urban and remote locations. Moreover, the observed
Fig. 6. Evaporation kinetics of 100-nm and 151 ambient SOA particlesclassified into two particle types (43 and 44). The solid lines are biexponentialfits to the data and the gray shaded area marks the upper and lower limits ofall observed data.
Fig. 7. Comparison between the observed evaporation kinetics of ambientorganic particles (gray area), the laboratory-generated α-pinene SOA parti-cles with and without various coatings and aging, and evaporation kineticscalculated based on current models.
2194 ∣ www.pnas.org/cgi/doi/10.1073/pnas.1013391108 Vaden et al.
Dow
nloa
ded
by g
uest
on
May
10,
202
0
size-independent evaporation behavior implies that, in contrastwith models, small (∼100 nm) particles do not evaporate fasterand thus retain their potential to serve as cloud condensationnuclei. Because SOA formation is modeled on the assumptionsthat these particles are liquids and that spectator gases play norole, the findings presented here have implications for this aspectof SOA modeling as well. This work could provide an essentialmissing link to process representation of organics aerosols inmodels.
Materials and MethodsParticle Generation.DOP and DOS particles were generated by atomization ofthe neat liquids. Homogeneous nucleation of SOA was initiated by injecting200 ppb of α-pinene, ∼500 ppb of O3, and ∼250 ppm of cyclohexane, used asan OH scavenger, into a clean 100-L Teflon bag filled with zero air. Coatedparticles were generated by carrying out the SOA generation procedurein a Teflon bag that contained a small amount of bulk coating material.Ambient particles were sampled in situ, dried, and characterized using SPLATII and a DMA, as described elsewhere (31).
Particle Analysis. Particles were size-selectedwith a DMA, passed through twocharcoal denuders, and loaded in the stainless steel evaporation chamber,partially filled with activated charcoal.
A single-particle mass spectrometer, SPLAT II, was used to measure indi-vidual particle composition, vacuum aerodynamic diameter, dva, density,and shape , as described elsewhere (19, 32). Particle evaporation kineticswas quantified by measuring changes in particle dva, with 0.5% precision.A more detailed description of the experimental setup is provided in SI Text.
ACKNOWLEDGMENTS. The authors thank Prof. Paul Ziemann, Prof. PeteMcMurry, and Dr. Chen Song for helpful discussions. Special thanks toMr. Mike Ezell for his help with manufacturing Teflon bags and Dr. IlonaRiipinen and Dr. Richard Easter for initial help with model configuration.This work was supported by the US Department of Energy Office of BasicEnergy Sciences, Division of Chemical Sciences, Geosciences, and Biosciencesand Office of Biological and Environmental Research. This research wasperformed in the Environmental Molecular Sciences Laboratory, a nationalscientific user facility sponsored by the Department of Energy’s Officeof Biological and Environmental Research at Pacific Northwest NationalLaboratory (PNNL). PNNL is operated by the US Department of Energy byBattelle Memorial Institute under Contract DE-AC0676RL0 1830.
1. Houghton JT, et al. (2001) Contribution of working group I to the Third AssessmentReport of the Intergovernmental Panel on Climate Change. Climate Change 2001:The Scientific Basis (Cambridge Univ Press, Cambridge, UK).
2. Kanakidou M, et al. (2005) Organic aerosol and global climate modelling: A review.Atmos Chem Phys 5:1053–1123.
3. Kroll JH, Seinfeld JH (2008) Chemistry of secondary organic aerosol: Formation andevolution of low-volatility organics in the atmosphere. Atmos Environ 42:3593–3624.
4. Zhang Q, et al. (2007) Ubiquity and dominance of oxygenated species in organicaerosols in anthropogenically-influenced Northern Hemisphere midlatitudes. Geo-phys Res Lett 34:L13801.
5. de Gouw J, Jimenez JL (2009) Organic aerosols in the Earth’s atmosphere. Environ SciTechnol 43:7614–7618.
6. Dzepina K, et al. (2009) Evaluation of recently-proposed secondary organic aerosolmodels for a case study in Mexico City. Atmos Chem Phys 9:5681–5709.
7. de Gouw JA, et al. (2005) Budget of organic carbon in a polluted atmosphere: Resultsfrom the New England Air Quality Study in 2002. J Geophys Res 110:D16305.
8. Odum JR, et al. (1996) Gas/particle partitioning and secondary organic aerosol yields.Environ Sci Technol 30:2580–2585.
9. Robinson AL, et al. (2007) Rethinking organic aerosols: Semivolatile emissions andphotochemical aging. Science 315:1259–1262.
10. Pye HOT, Seinfeld JH (2010) A global perspective on aerosol from low-volatility organiccompounds. Atmos Chem Phys 10:4377–4401.
11. Donahue NM, Robinson AL, Stanier CO, Pandis SN (2006) Coupled partitioning,dilution, and chemical aging of semivolatile organics. Environ Sci Technol40:2635–2643.
12. Ravishankara AR (1997) Heterogeneous and multiphase chemistry in the troposphere.Science 276:1058–1065.
13. Virtanen A, et al. (2010) An amorphous solid state of biogenic secondary organicaerosol particles. Nature 467:824–827.
14. Huffman JA, et al. (2009) Chemically-resolved volatility measurements of organicaerosol from different sources. Environ Sci Technol 43:5351–5357.
15. Cappa CD, Jimenez JL (2010) Quantitative estimates of the volatility of ambientorganic aerosol. Atmos Chem Phys 10:5409–5424.
16. Riipinen I, Pierce JR, Donahue NM, Pandis SN (2010) Equilibration time scales oforganic aerosol inside thermodenuders: Evaporation kinetics versus thermodynamics.Atmos Environ 44:597–607.
17. Grieshop AP, Donahue NM, Robinson AL (2007) Is the gas-particle partitioning inalpha-pinene secondary organic aerosol reversible? Geophys Res Lett 34:L14810.
18. Matsunaga A, Ziemann PJ (2010) Gas-wall partitioning of organic compounds in aTeflon film chamber and potential effects on reaction product and aerosol yieldmeasurements. Aerosol Sci Tech 44:881–892.
19. Zelenyuk A, Yang J, Choi E, Imre D (2009) SPLAT II: An aircraft compatible, ultra-sensitive, high precision instrument for in-situ characterization of the size andcomposition of fine and ultrafine particles. Aerosol Sci Tech 43:411–424.
20. Vaden TD, Song C, Zaveri RA, Imre D, Zelenyuk A (2010) Morphology of mixed primaryand secondary organic particles and the adsorption of spectator organic gases duringaerosol formation. Proc Natl Acad Sci 107:6658–6663.
21. Davis EJ, Ravindran P, Ray AK (1980) A review of theory and experiments on diffusionfrom submicroscopic particles. Chem Eng Commun 5:251–268.
22. Zhang S-H, Seinfeld JH, Flagan RC (1993) Determination of particle vapor pressuresusing the tandem differential mobility analyzer. Aerosol Sci Tech 19:3–14.
23. Tang IN, Munkelwitz HR (1991) Determination of vapor pressure from dropletevaporation kinetics. J Colloid Interf Sci 141:109–118.
24. Pathak RK, et al. (2007) Ozonolysis of alpha-pinene: Parameterization of secondaryorganic aerosol mass fraction. Atmos Chem Phys 7:3811–3821.
25. Cruz CN, Dassios KG, Pandis SN (2000) The effect of dioctyl phthalate films on theammonium nitrate aerosol evaporation rate. Atmos Environ 34:3897–3905.
26. Zelenyuk A, et al. (2010) Characterization of organic coatings on hygroscopic saltparticles and their atmospheric impacts. Atmos Environ 44:1209–1218.
27. Rudich Y, Donahue NM, Mentel TF (2007) Aging of organic aerosol: Bridging the gapbetween laboratory and field studies. Annu Rev Phys Chem 58:321–352.
28. Miet K, Le Menach K, Flaud PM, Budzinski H, Villenave E (2009) Heterogeneousreactions of ozone with pyrene, 1-hydroxypyrene and 1-nitropyrene adsorbed onparticles. Atmos Environ 43:3699–3707.
29. Gao S, et al. (2004) Low-molecular-weight and oligomeric components in secondaryorganic aerosol from the ozonolysis of cycloalkenes and alpha-pinene. J Phys Chem A108:10147–10164.
30. Vaden TD, Imre D, Beránek J, Zelenyuk A (2011) Extending the capabilities of singleparticle mass spectrometry: II. Measurements of aerosol particle density without DMA.Aerosol Sci Tech 45:125–135.
31. Zelenyuk A, Imre D, Han JH, Oatis S (2008) Simultaneous measurements of individualambient particle size, composition, effective density, and hygroscopicity. Anal Chem80:1401–1407.
32. Zelenyuk A, Imre D (2009) Beyond single particle mass spectrometry: multidimensionalcharacterisation of individual aerosol particles. Int Rev Phys Chem 28:309–358.
Vaden et al. PNAS ∣ February 8, 2011 ∣ vol. 108 ∣ no. 6 ∣ 2195
ENVIRONMEN
TAL
SCIENCE
S
Dow
nloa
ded
by g
uest
on
May
10,
202
0


