Evangelical Attitudes Toward Israel Research...
25
_____________________________________________________________________________________ Evangelical Attitudes Toward Israel Research Study Evangelical Attitudes Towards Israel and the Peace Process Sponsored By Chosen People Ministries and Author Joel C. Rosenberg
Transcript of Evangelical Attitudes Toward Israel Research...
_____________________________________________________________________________________
Evangelical Attitudes
Toward Israel
Research Study
Evangelical Attitudes Towards Israel
and the Peace Process
Sponsored By
Chosen People Ministries and
Author Joel C. Rosenberg

2
Chosen People Ministries & Author, Joel C. Rosenberg
Table of Contents
Page
Executive Summary 3
Methodology 5
Quantitative Findings
Perceptions of Modern Israel 6
Practical Concerns Regarding Israelis and Palestinians 10
Perceptions of the Abrahamic Covenant and Israeli Claims to the Land 12
Support for the Existence, Security, and Prosperity of the State of Israel 16
Perceptions of the Peace Process 21
Demographics 23
3
Chosen People Ministries & Author, Joel C. Rosenberg
Executive Summary
Quantitative Findings
Perceptions of Modern Israel Positive perceptions of the country of Israel are strongest among those age 65+. Millennials
show significantly less support for Israel than their parents’ and grandparents’ age groups
67% of those with Evangelical Beliefs have a positive perception of Israel
o Those age 65+ are the most likely age group to indicate they have a “Positive”
view of Israel today (76%) followed by age 50-64 (69%), age 35-49 (64%) and
age 18-34 (58%).
o African Americans with Evangelical Beliefs are the least likely ethnic group to
select “positive” (50%)
o Those age 18-34 (30%) and 35-49 (29%) are more likely to be “not sure” what
their perception of the country of Israel is compared to those age 50-64 (22%) and
65+ (16%)
o African American Evangelicals are the most likely ethnic group to be “not sure”
of their perception of the country of Israel
“When you think of the modern rebirth of the State of Israel in 1948 and the re-gathering
of millions of Jewish people to Israel” 80% say these events were fulfillments of Bible
prophecy that show we are getting closer to the return of Jesus Christ
45% say that the Bible has most influenced their opinions about Israel
Practical Concerns Regarding Israelis and Palestinians Americans with Evangelical Beliefs strongly support Israel maintaining its security, but they
also believe Christians should demonstrate more love and concern for Palestinians
73% agree that Christians should support Israel’s defense of itself from terrorist and
foreign enemies including 53% who strongly agree
73% are concerned for the safety of Christians in areas controlled by the Palestinian
Authority
59% agree that Christians should do more to love and care for Palestinian people
o Millennials age 18-34 (66%) are more likely to Agree than those 50-64 (57%) and
65+ (54%).
o Black, Non-Hispanics (65%) are more likely to Agree than White, Non-Hispanics
(56%)
Perceptions of the Abrahamic Covenant and Israeli Claims to the Land 80% agree that God’s promise to Abraham and his descendants was for all time
76% agree that Christian should support the Jewish people’s right to live in the sovereign
state of Israel
69% agree that Jewish people have a historic right to the land of Israel
19% agree and 46% disagree that Palestinian people have a historic right to the land of
Israel
4
Chosen People Ministries & Author, Joel C. Rosenberg
63% disagree that biblical passages about Jewish people having a right to the land of
Israel no longer apply today
51% disagree that the Jewish people lost the promise of the land because they rejected
Jesus
41% agree that Jewish people have a biblical right to the land of Israel, but also have a
responsibility to share the land with Palestinian Arabs
41% disagree that the Christian church has fulfilled or replaced the nation of Israel in
God’s plan
Support for the existence, security, and prosperity of the State of Israel 42% support the existence of the State of Israel but don’t feel the need to support
everything Israel does
A quarter (24%) support the State of Israel no matter what Israel does
1% do not support the existence, security, and prosperity of the State of Israel
Almost a third (32%) have no strong views about the State of Israel
o More than 4 in 10 Millennials age 18-34 (41%) say they have “no strong views
about the State of Israel”
o Those age 50-46 (33%) and 65+ (22%) are less likely to have “no strong views”
o Black, Non-Hispanics (52%) are the most likely ethnic group to have “no strong
views”
A majority of supporters indicate the reason for their support includes:
o 63% The Bible says God gave the land of Israel to the Jewish people
o 60% Israel is the historic Jewish homeland
o 52% Israel is important for fulfilling biblical prophecy
The majority of those with Evangelical Beliefs attribute the primary reason for their
support of Israel to the Bible including 33% who select select “the Bible says God gave
the land of Israel to the Jewish people” and 14% who select “The Bible says Christians
should support Israel”
71% say that their support for the State of Israel has stayed the same over the last 5 years
72% wish they knew more about what the Bible teaches about Israel’s future
97% have not traveled to Israel
51% of those who have never been to Israel are interested or very interested in traveling
to Israel
31% believe the U.S. does the right amount to help Israel
Perceptions on the Peace Process When asked their level of agreement with the statement “the state of Israel should sign a
peace treaty that allows Palestinians to create their own sovereign state in the West Bank
and Gaza” 23% agree, 31% disagree, and 46% are not sure
50% disagree that the modern rebirth of the State of Israel has been an injustice to the
Arab people while 14% agree and 36% are not sure
41% disagree that modern Israel has been unfair to the Palestinian people while 22%
agree and 37% are not sure
5
Chosen People Ministries & Author, Joel C. Rosenberg
Methodology
The Evangelicals Attitudes Toward Israel Research Study was sponsored by Chosen People
Ministries and author, Joel C. Rosenberg. This is the first of two reports from this study.
LifeWay Research conducted the study September 20-28, 2017. The survey was conducted using
the web-enabled KnowledgePanel®, a probability-based panel designed to be representative of
the U.S. population. Initially, participants are chosen scientifically by a random selection of
telephone numbers and residential addresses. Persons in selected households are then invited by
telephone or by mail to participate in the web-enabled KnowledgePanel®. For those who agree
to participate, but do not already have Internet access, GfK provides at no cost a laptop and ISP
connection.
Sample stratification and weights were used for gender by age, ethnicity, region, education, and
household income to reflect the most recent US Census data. The completed sample is 2,002
surveys. The sample provides 95 percent confidence that the sampling error does not exceed plus
or minus 2.7 percent. Margins of error are higher in sub-groups.
Respondents were screened to only include adults with Evangelical Beliefs. Evangelical Beliefs
are defined using the NAE LifeWay Research Evangelical Beliefs Research Definition based on
respondent beliefs.
Respondents are asked their level of agreement with four separate statements using a four-point,
forced choice scale (strongly agree, somewhat agree, somewhat disagree, strongly disagree).
Those who strongly agree with all four statements are categorized as having Evangelical Beliefs
The Bible is the highest authority for what I believe
It is very important for me personally to encourage non-Christians to trust Jesus Christ as
their Savior
Jesus Christ’s death on the cross is the only sacrifice that could remove the penalty of my
sin
Only those who trust in Jesus Christ alone as their Savior receive God’s free gift of
eternal salvation
Percentages that combine agree or disagree responses may not match the total of the individual
responses due to rounding.
6
Chosen People Ministries & Author, Joel C. Rosenberg
Quantitative Findings
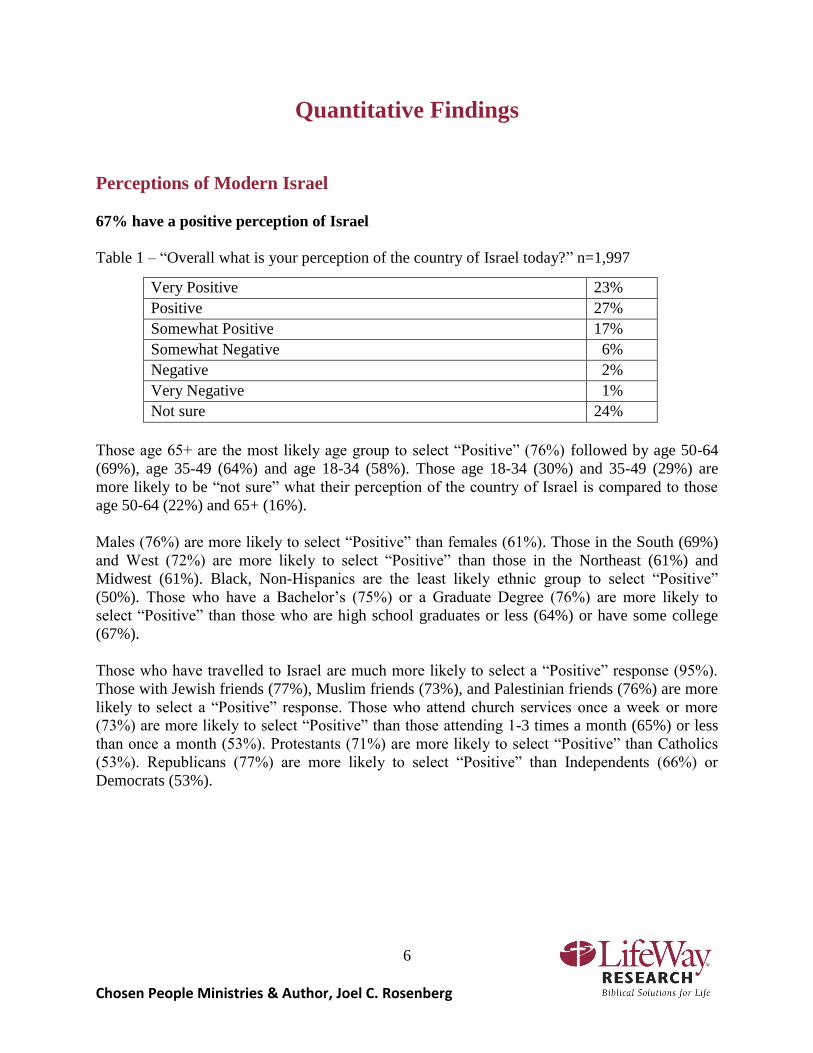
Perceptions of Modern Israel
67% have a positive perception of Israel
Table 1 – “Overall what is your perception of the country of Israel today?” n=1,997
Very Positive 23%
Positive 27%
Somewhat Positive 17%
Somewhat Negative 6%
Negative 2%
Very Negative 1%
Not sure 24%
Those age 65+ are the most likely age group to select “Positive” (76%) followed by age 50-64
(69%), age 35-49 (64%) and age 18-34 (58%). Those age 18-34 (30%) and 35-49 (29%) are
more likely to be “not sure” what their perception of the country of Israel is compared to those
age 50-64 (22%) and 65+ (16%).
Males (76%) are more likely to select “Positive” than females (61%). Those in the South (69%)
and West (72%) are more likely to select “Positive” than those in the Northeast (61%) and
Midwest (61%). Black, Non-Hispanics are the least likely ethnic group to select “Positive”
(50%). Those who have a Bachelor’s (75%) or a Graduate Degree (76%) are more likely to
select “Positive” than those who are high school graduates or less (64%) or have some college
(67%).
Those who have travelled to Israel are much more likely to select a “Positive” response (95%).
Those with Jewish friends (77%), Muslim friends (73%), and Palestinian friends (76%) are more
likely to select a “Positive” response. Those who attend church services once a week or more
(73%) are more likely to select “Positive” than those attending 1-3 times a month (65%) or less
than once a month (53%). Protestants (71%) are more likely to select “Positive” than Catholics
(53%). Republicans (77%) are more likely to select “Positive” than Independents (66%) or
Democrats (53%).
7
Chosen People Ministries & Author, Joel C. Rosenberg
Personal views on the modern rebirth of the State of Israel in 1948
Table 2 – “When you think of the modern rebirth of the State of Israel in 1948 and the re-
gathering of millions of Jewish people to Israel, which of the following statements best
represents your personal views?”
These events were fulfillments of Bible prophecy that show we are
getting closer to the return of Jesus Christ. 80%
These events were interesting geopolitical events but they were not the
result or fulfillment of biblical prophecy. 20%
Those age 50-64 (82%) are more likely to select “These events were fulfillments of Bible
prophecy that show we are getting closer to the return of Jesus Christ” than those 35-49 (76%).
Other Ethnicities are the most likely ethnic group to select “These events were fulfillments of
Bible prophecy that show we are getting closer to the return of Jesus Christ” (91%). Those who
are high school graduates or less (82%) or with some college (81%) are more likely to select
“These events were fulfillments of Bible prophecy that show we are getting closer to the return
of Jesus Christ” than those with a Graduate Degree (73%).
“Which of the following have influenced your opinions about Israel?”
Table 3 – “Which of the following have influenced your opinions about Israel?” n=1,995
The Bible 56%
The media 27%
Your local church 25%
Friends and family 18%
National Christian Leaders 15%
Personal experiences with Jewish people 11%
Positions of elected officials 7%
Teachers or professors 4%
Personal experiences with Muslim people 3%
Not sure 22%
The Bible Those in the South (58%) and West (60%) are more likely to select than those in the Northeast
(48%) and Midwest (50%). Those age 65+ are the most likely age group to select (65%),
followed by those age 50-64 (58%). White, Non-Hispanics (60%) and Hispanics (55%) are more
likely to select than Black, Non-Hispanics (45%). Those with a Bachelor’s Degree (64%) are
more likely to select than those who are high school graduates or less (52%) or with some
college (56%).
8
Chosen People Ministries & Author, Joel C. Rosenberg
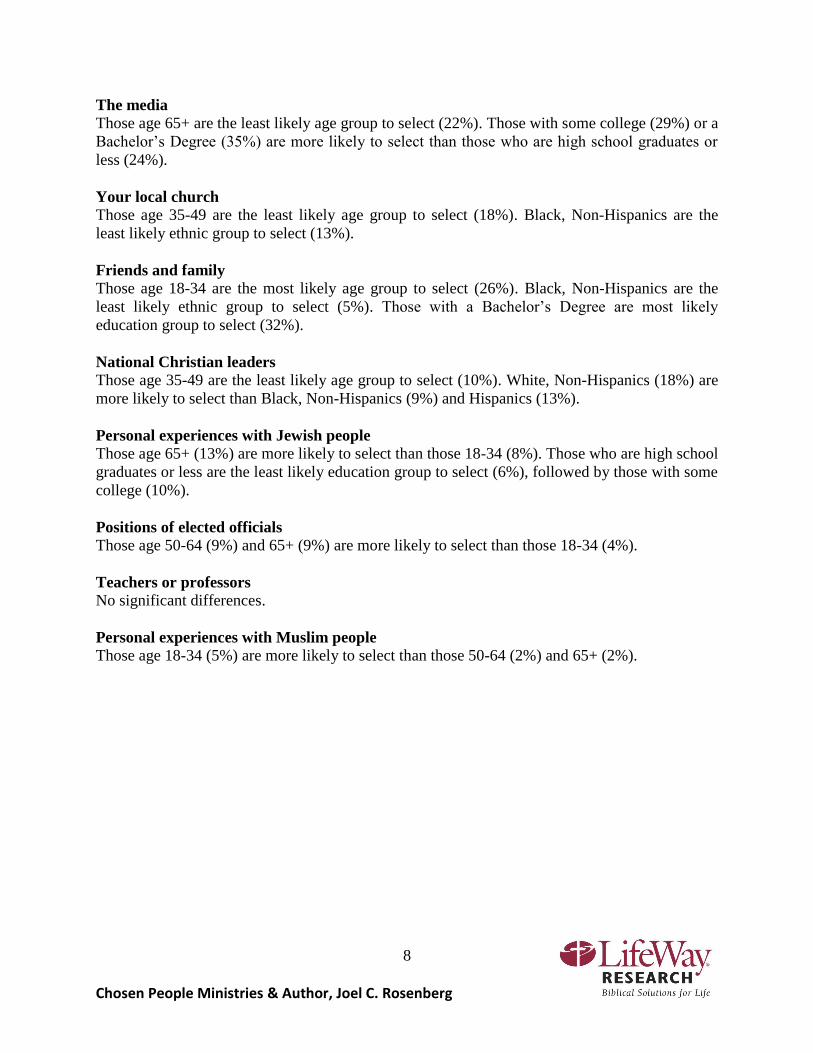
The media Those age 65+ are the least likely age group to select (22%). Those with some college (29%) or a
Bachelor’s Degree (35%) are more likely to select than those who are high school graduates or
less (24%).
Your local church Those age 35-49 are the least likely age group to select (18%). Black, Non-Hispanics are the
least likely ethnic group to select (13%).
Friends and family Those age 18-34 are the most likely age group to select (26%). Black, Non-Hispanics are the
least likely ethnic group to select (5%). Those with a Bachelor’s Degree are most likely
education group to select (32%).
National Christian leaders Those age 35-49 are the least likely age group to select (10%). White, Non-Hispanics (18%) are
more likely to select than Black, Non-Hispanics (9%) and Hispanics (13%).
Personal experiences with Jewish people Those age 65+ (13%) are more likely to select than those 18-34 (8%). Those who are high school
graduates or less are the least likely education group to select (6%), followed by those with some
college (10%).
Positions of elected officials Those age 50-64 (9%) and 65+ (9%) are more likely to select than those 18-34 (4%).
Teachers or professors No significant differences.
Personal experiences with Muslim people Those age 18-34 (5%) are more likely to select than those 50-64 (2%) and 65+ (2%).
9
Chosen People Ministries & Author, Joel C. Rosenberg
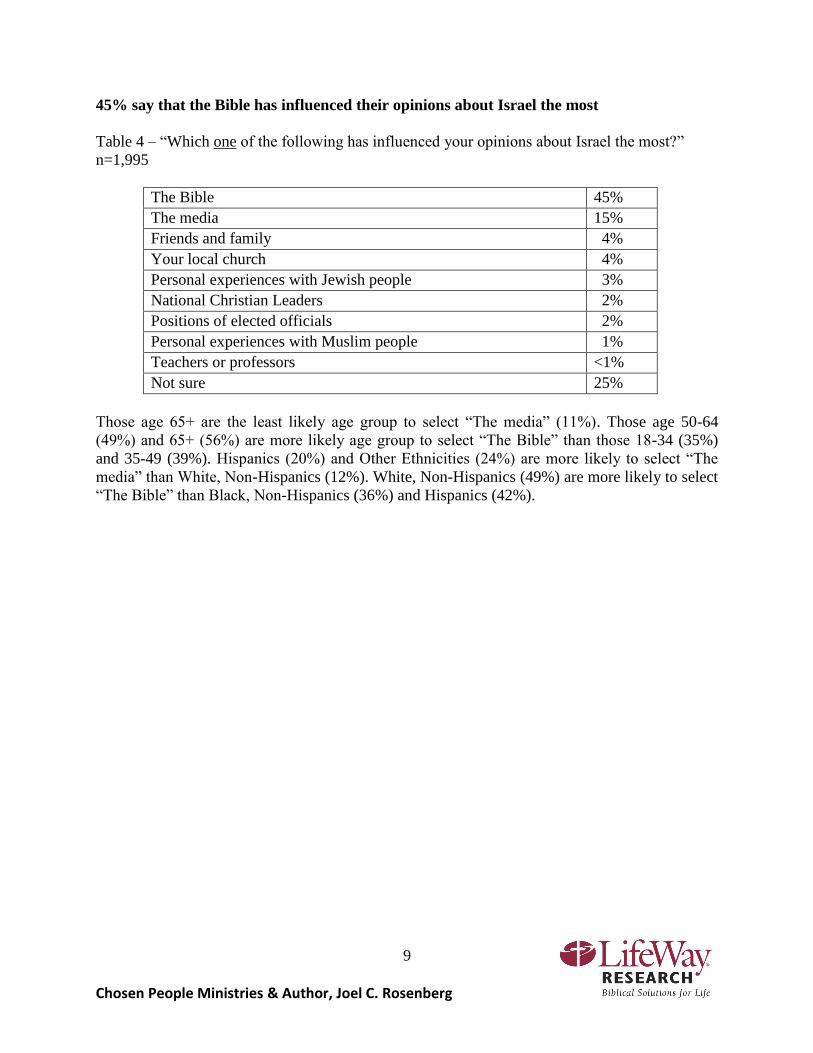
45% say that the Bible has influenced their opinions about Israel the most
Table 4 – “Which one of the following has influenced your opinions about Israel the most?”
n=1,995
The Bible 45%
The media 15%
Friends and family 4%
Your local church 4%
Personal experiences with Jewish people 3%
National Christian Leaders 2%
Positions of elected officials 2%
Personal experiences with Muslim people 1%
Teachers or professors <1%
Not sure 25%
Those age 65+ are the least likely age group to select “The media” (11%). Those age 50-64
(49%) and 65+ (56%) are more likely age group to select “The Bible” than those 18-34 (35%)
and 35-49 (39%). Hispanics (20%) and Other Ethnicities (24%) are more likely to select “The
media” than White, Non-Hispanics (12%). White, Non-Hispanics (49%) are more likely to select
“The Bible” than Black, Non-Hispanics (36%) and Hispanics (42%).
10
Chosen People Ministries & Author, Joel C. Rosenberg
Practical Concerns Regarding Israelis and Palestinians
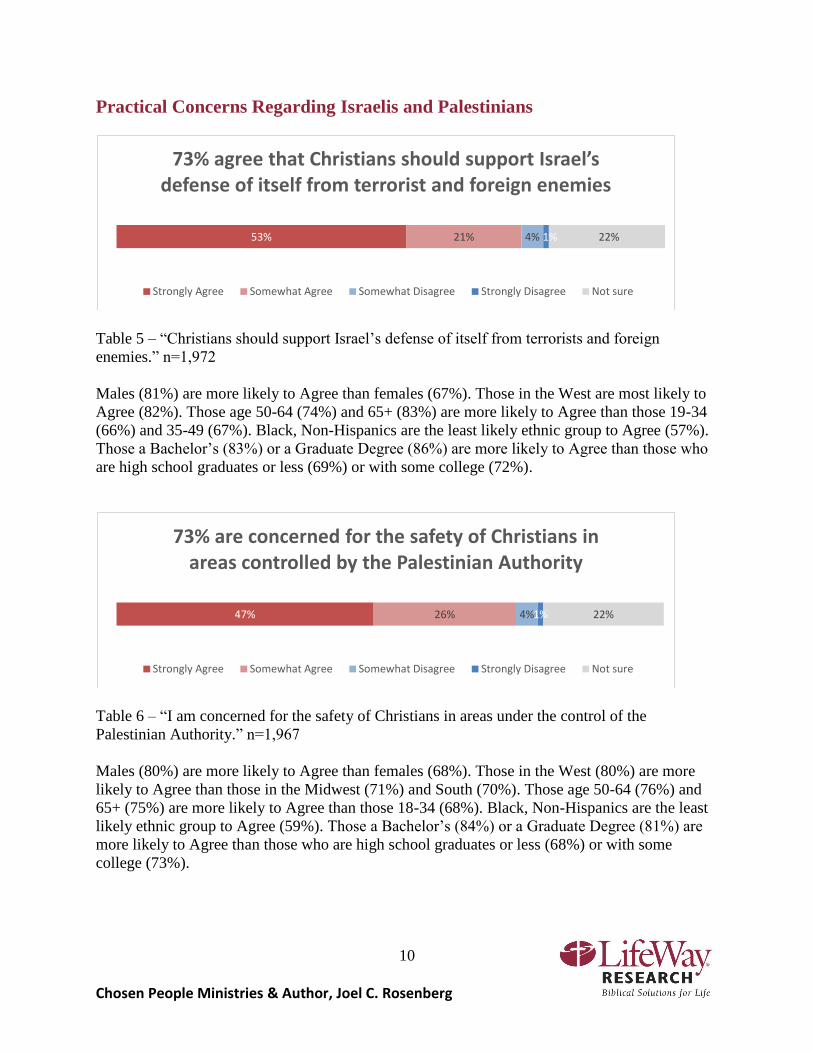
Table 5 – “Christians should support Israel’s defense of itself from terrorists and foreign
enemies.” n=1,972
Males (81%) are more likely to Agree than females (67%). Those in the West are most likely to
Agree (82%). Those age 50-64 (74%) and 65+ (83%) are more likely to Agree than those 19-34
(66%) and 35-49 (67%). Black, Non-Hispanics are the least likely ethnic group to Agree (57%).
Those a Bachelor’s (83%) or a Graduate Degree (86%) are more likely to Agree than those who
are high school graduates or less (69%) or with some college (72%).
Table 6 – “I am concerned for the safety of Christians in areas under the control of the
Palestinian Authority.” n=1,967
Males (80%) are more likely to Agree than females (68%). Those in the West (80%) are more
likely to Agree than those in the Midwest (71%) and South (70%). Those age 50-64 (76%) and
65+ (75%) are more likely to Agree than those 18-34 (68%). Black, Non-Hispanics are the least
likely ethnic group to Agree (59%). Those a Bachelor’s (84%) or a Graduate Degree (81%) are
more likely to Agree than those who are high school graduates or less (68%) or with some
college (73%).
53% 21% 4% 1% 22%
73% agree that Christians should support Israel’s defense of itself from terrorist and foreign enemies
Strongly Agree Somewhat Agree Somewhat Disagree Strongly Disagree Not sure
47% 26% 4% 1% 22%
73% are concerned for the safety of Christians in areas controlled by the Palestinian Authority
Strongly Agree Somewhat Agree Somewhat Disagree Strongly Disagree Not sure
11
Chosen People Ministries & Author, Joel C. Rosenberg
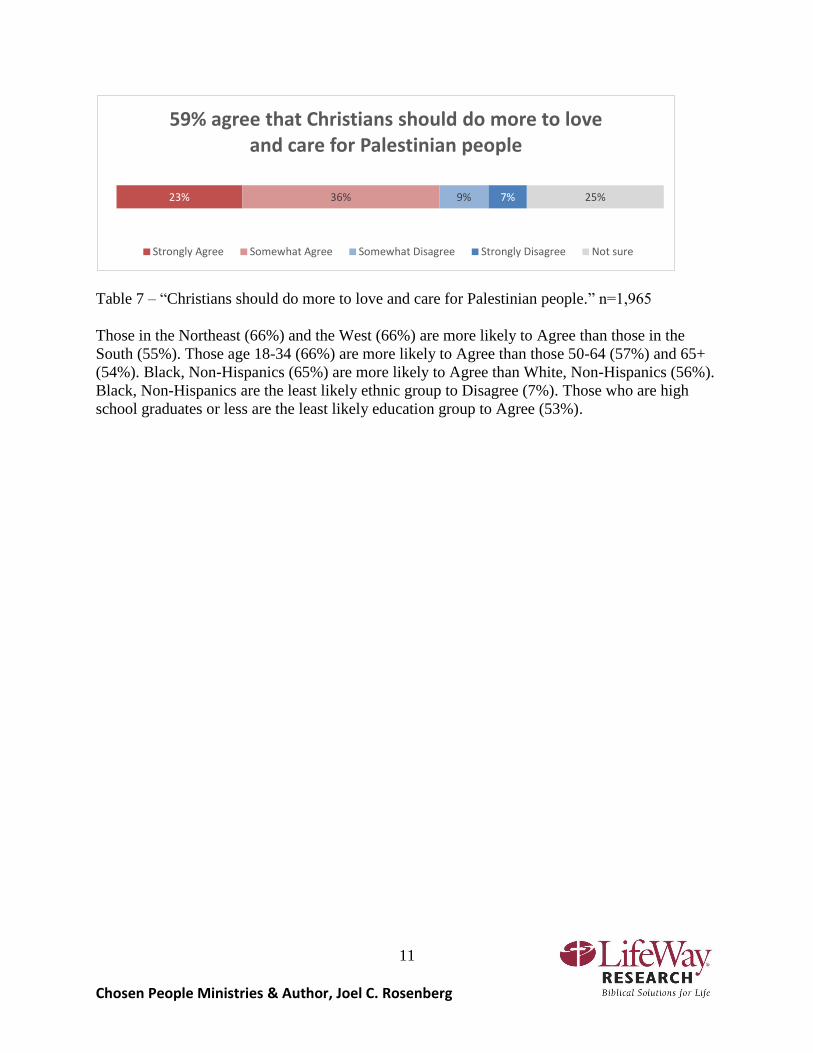
Table 7 – “Christians should do more to love and care for Palestinian people.” n=1,965
Those in the Northeast (66%) and the West (66%) are more likely to Agree than those in the
South (55%). Those age 18-34 (66%) are more likely to Agree than those 50-64 (57%) and 65+
(54%). Black, Non-Hispanics (65%) are more likely to Agree than White, Non-Hispanics (56%).
Black, Non-Hispanics are the least likely ethnic group to Disagree (7%). Those who are high
school graduates or less are the least likely education group to Agree (53%).
23% 36% 9% 7% 25%
59% agree that Christians should do more to love and care for Palestinian people
Strongly Agree Somewhat Agree Somewhat Disagree Strongly Disagree Not sure
12
Chosen People Ministries & Author, Joel C. Rosenberg
Perceptions of the Abrahamic Covenant and Israeli Claims to the Land
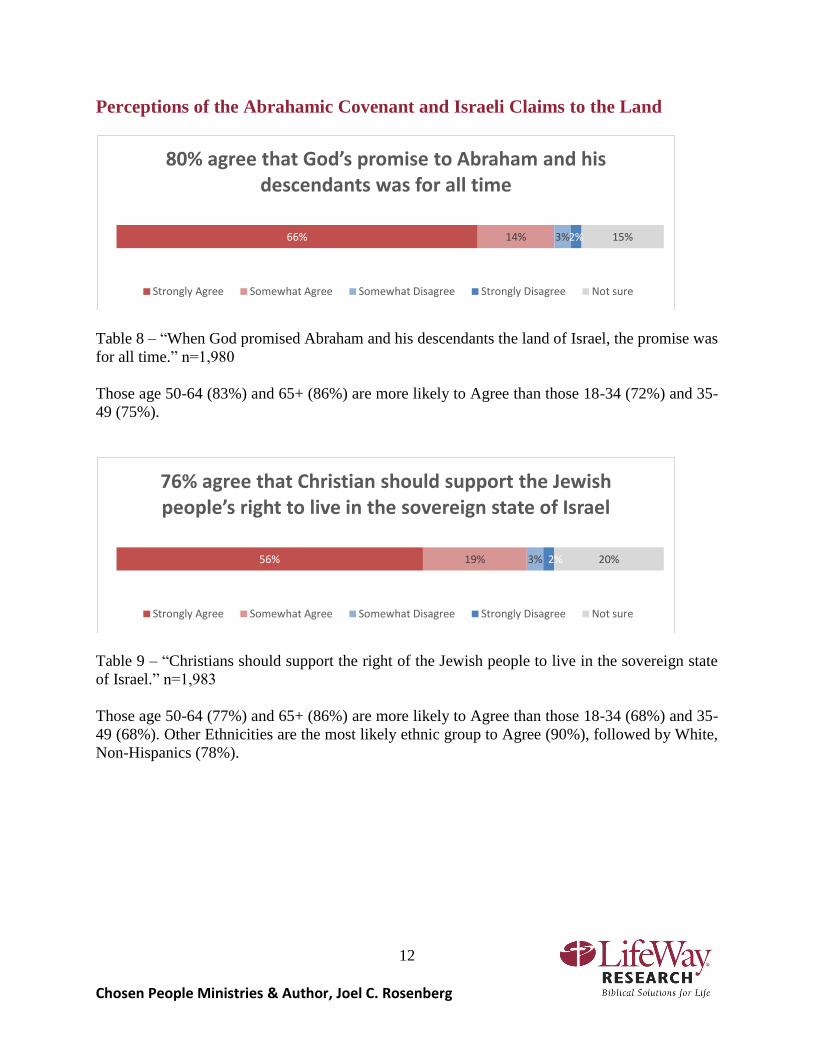
Table 8 – “When God promised Abraham and his descendants the land of Israel, the promise was
for all time.” n=1,980
Those age 50-64 (83%) and 65+ (86%) are more likely to Agree than those 18-34 (72%) and 35-
49 (75%).
Table 9 – “Christians should support the right of the Jewish people to live in the sovereign state
of Israel.” n=1,983
Those age 50-64 (77%) and 65+ (86%) are more likely to Agree than those 18-34 (68%) and 35-
49 (68%). Other Ethnicities are the most likely ethnic group to Agree (90%), followed by White,
Non-Hispanics (78%).
66% 14% 3% 2% 15%
80% agree that God’s promise to Abraham and his descendants was for all time
Strongly Agree Somewhat Agree Somewhat Disagree Strongly Disagree Not sure
56% 19% 3% 2% 20%
76% agree that Christian should support the Jewish people’s right to live in the sovereign state of Israel
Strongly Agree Somewhat Agree Somewhat Disagree Strongly Disagree Not sure
13
Chosen People Ministries & Author, Joel C. Rosenberg
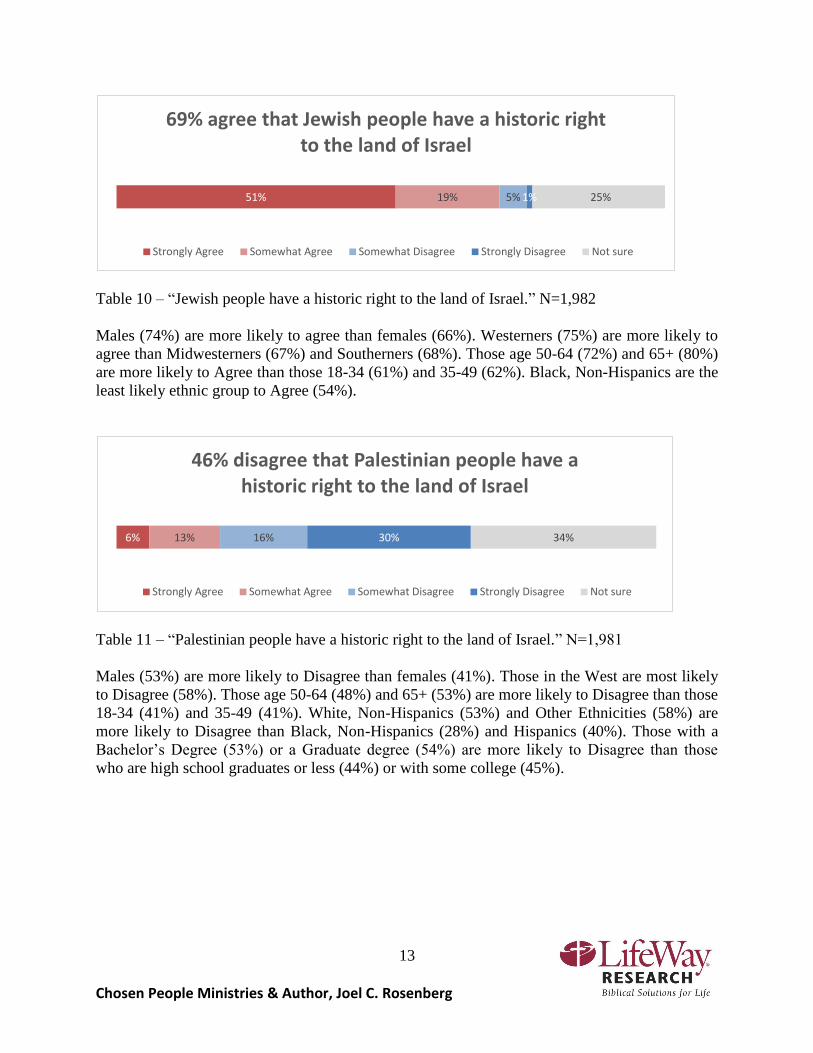
Table 10 – “Jewish people have a historic right to the land of Israel.” N=1,982
Males (74%) are more likely to agree than females (66%). Westerners (75%) are more likely to
agree than Midwesterners (67%) and Southerners (68%). Those age 50-64 (72%) and 65+ (80%)
are more likely to Agree than those 18-34 (61%) and 35-49 (62%). Black, Non-Hispanics are the
least likely ethnic group to Agree (54%).
Table 11 – “Palestinian people have a historic right to the land of Israel.” N=1,981
Males (53%) are more likely to Disagree than females (41%). Those in the West are most likely
to Disagree (58%). Those age 50-64 (48%) and 65+ (53%) are more likely to Disagree than those
18-34 (41%) and 35-49 (41%). White, Non-Hispanics (53%) and Other Ethnicities (58%) are
more likely to Disagree than Black, Non-Hispanics (28%) and Hispanics (40%). Those with a
Bachelor’s Degree (53%) or a Graduate degree (54%) are more likely to Disagree than those
who are high school graduates or less (44%) or with some college (45%).
51% 19% 5% 1% 25%
69% agree that Jewish people have a historic right to the land of Israel
Strongly Agree Somewhat Agree Somewhat Disagree Strongly Disagree Not sure
6% 13% 16% 30% 34%
46% disagree that Palestinian people have a historic right to the land of Israel
Strongly Agree Somewhat Agree Somewhat Disagree Strongly Disagree Not sure
14
Chosen People Ministries & Author, Joel C. Rosenberg
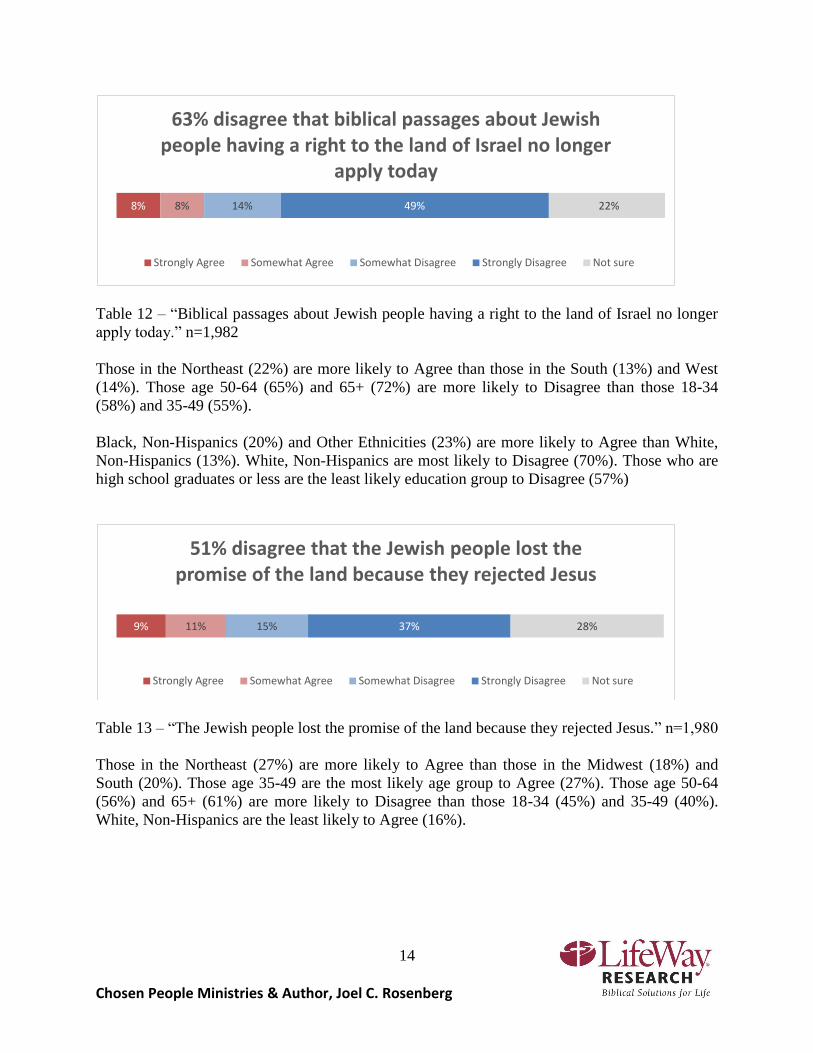
Table 12 – “Biblical passages about Jewish people having a right to the land of Israel no longer
apply today.” n=1,982
Those in the Northeast (22%) are more likely to Agree than those in the South (13%) and West
(14%). Those age 50-64 (65%) and 65+ (72%) are more likely to Disagree than those 18-34
(58%) and 35-49 (55%).
Black, Non-Hispanics (20%) and Other Ethnicities (23%) are more likely to Agree than White,
Non-Hispanics (13%). White, Non-Hispanics are most likely to Disagree (70%). Those who are
high school graduates or less are the least likely education group to Disagree (57%)
Table 13 – “The Jewish people lost the promise of the land because they rejected Jesus.” n=1,980
Those in the Northeast (27%) are more likely to Agree than those in the Midwest (18%) and
South (20%). Those age 35-49 are the most likely age group to Agree (27%). Those age 50-64
(56%) and 65+ (61%) are more likely to Disagree than those 18-34 (45%) and 35-49 (40%).
White, Non-Hispanics are the least likely to Agree (16%).
8% 8% 14% 49% 22%
63% disagree that biblical passages about Jewish people having a right to the land of Israel no longer
apply today
Strongly Agree Somewhat Agree Somewhat Disagree Strongly Disagree Not sure
9% 11% 15% 37% 28%
51% disagree that the Jewish people lost the promise of the land because they rejected Jesus
Strongly Agree Somewhat Agree Somewhat Disagree Strongly Disagree Not sure

15
Chosen People Ministries & Author, Joel C. Rosenberg
Table 14 – “Jewish people have a biblica right to the land of Israel, but also have a responsibility
to share the land with Palestian Arabs.”
Those age 65+ (48%) are more likely to Agree than those 18-34 (37%). White, Non-Hispanics
are the least likely ethnic group to Agree (38%). Those with a Graduate Degree (49%) are more
likely to Agree than those who are high school graduates or less (40%) or with some college
(39%).
Table 15 – “The Christian church has fulfilled or replaced the nation of Israel in God’s plan.”
n=1,956
Those in the Northeast are the most likely to Agree (39%). Those age 18-34 (34%) and 35-49
(31%) are more likely to Agree than those 50-49 (24%) and 65+ (23%). White, Non-Hispanics
are the most likely ethnic group to Disagree (45%). Those a Bachelor’s (46%) or a Graduate
Degree (55%) are more likely to Disagree than those who are high school graduates or less
(37%).
18% 23% 13% 15% 31%
41% agree that Jewish people have a biblical right to the land of Israel, but also have a responsibility
to share
Strongly Agree Somewhat Agree Somewhat Disagree Strongly Disagree Not sure
12% 16% 13% 28% 32%
41% disagree that the Christian church has fulfilled or replaced the nation of Israel
Strongly Agree Somewhat Agree Somewhat Disagree Strongly Disagree Not sure
16
Chosen People Ministries & Author, Joel C. Rosenberg
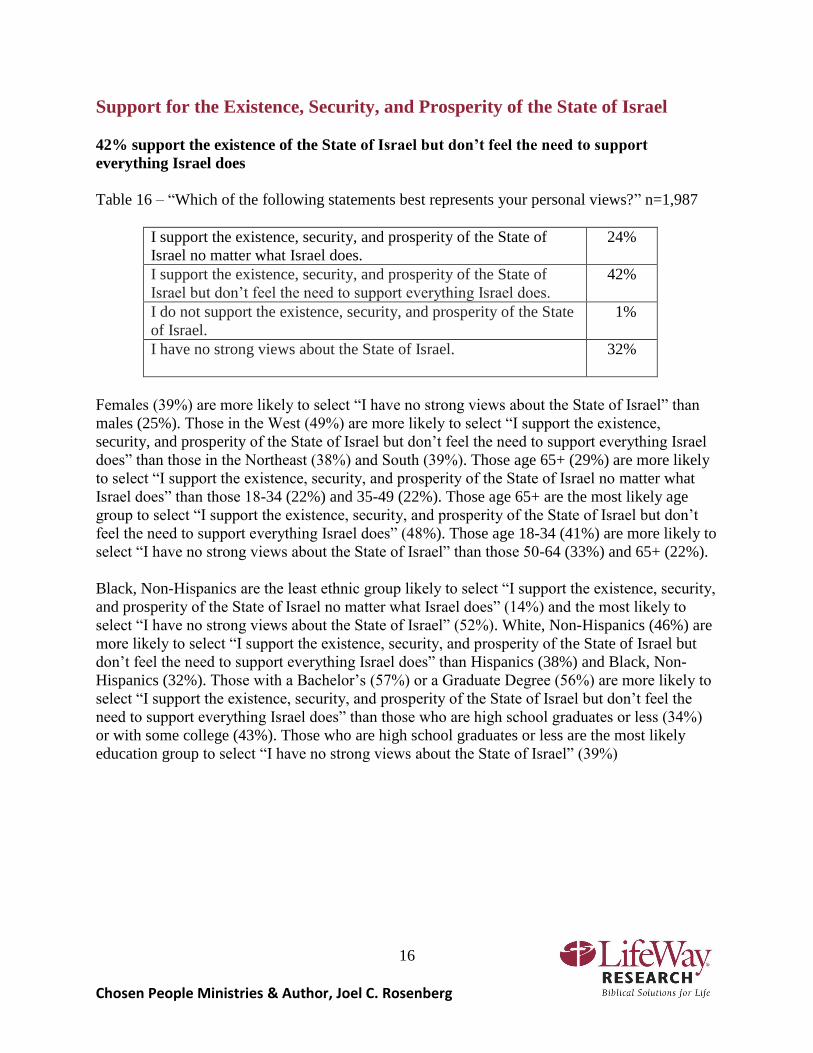
Support for the Existence, Security, and Prosperity of the State of Israel
42% support the existence of the State of Israel but don’t feel the need to support
everything Israel does
Table 16 – “Which of the following statements best represents your personal views?” n=1,987
I support the existence, security, and prosperity of the State of
Israel no matter what Israel does.
24%
I support the existence, security, and prosperity of the State of
Israel but don’t feel the need to support everything Israel does.
42%
I do not support the existence, security, and prosperity of the State
of Israel.
1%
I have no strong views about the State of Israel.
32%
Females (39%) are more likely to select “I have no strong views about the State of Israel” than
males (25%). Those in the West (49%) are more likely to select “I support the existence,
security, and prosperity of the State of Israel but don’t feel the need to support everything Israel
does” than those in the Northeast (38%) and South (39%). Those age 65+ (29%) are more likely
to select “I support the existence, security, and prosperity of the State of Israel no matter what
Israel does” than those 18-34 (22%) and 35-49 (22%). Those age 65+ are the most likely age
group to select “I support the existence, security, and prosperity of the State of Israel but don’t
feel the need to support everything Israel does” (48%). Those age 18-34 (41%) are more likely to
select “I have no strong views about the State of Israel” than those 50-64 (33%) and 65+ (22%).
Black, Non-Hispanics are the least ethnic group likely to select “I support the existence, security,
and prosperity of the State of Israel no matter what Israel does” (14%) and the most likely to
select “I have no strong views about the State of Israel” (52%). White, Non-Hispanics (46%) are
more likely to select “I support the existence, security, and prosperity of the State of Israel but
don’t feel the need to support everything Israel does” than Hispanics (38%) and Black, Non-
Hispanics (32%). Those with a Bachelor’s (57%) or a Graduate Degree (56%) are more likely to
select “I support the existence, security, and prosperity of the State of Israel but don’t feel the
need to support everything Israel does” than those who are high school graduates or less (34%)
or with some college (43%). Those who are high school graduates or less are the most likely
education group to select “I have no strong views about the State of Israel” (39%)
17
Chosen People Ministries & Author, Joel C. Rosenberg
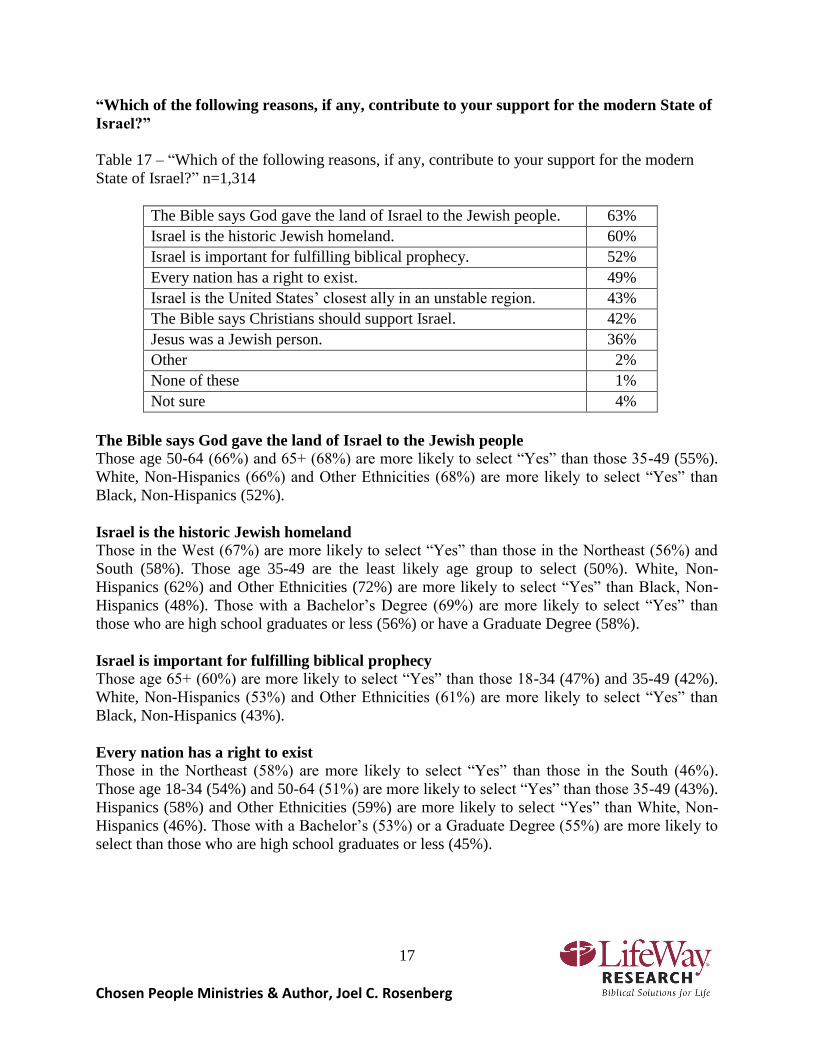
“Which of the following reasons, if any, contribute to your support for the modern State of
Israel?”
Table 17 – “Which of the following reasons, if any, contribute to your support for the modern
State of Israel?” n=1,314
The Bible says God gave the land of Israel to the Jewish people. 63%
Israel is the historic Jewish homeland. 60%
Israel is important for fulfilling biblical prophecy. 52%
Every nation has a right to exist. 49%
Israel is the United States’ closest ally in an unstable region. 43%
The Bible says Christians should support Israel. 42%
Jesus was a Jewish person. 36%
Other 2%
None of these 1%
Not sure 4%
The Bible says God gave the land of Israel to the Jewish people Those age 50-64 (66%) and 65+ (68%) are more likely to select “Yes” than those 35-49 (55%).
White, Non-Hispanics (66%) and Other Ethnicities (68%) are more likely to select “Yes” than
Black, Non-Hispanics (52%).
Israel is the historic Jewish homeland Those in the West (67%) are more likely to select “Yes” than those in the Northeast (56%) and
South (58%). Those age 35-49 are the least likely age group to select (50%). White, Non-
Hispanics (62%) and Other Ethnicities (72%) are more likely to select “Yes” than Black, Non-
Hispanics (48%). Those with a Bachelor’s Degree (69%) are more likely to select “Yes” than
those who are high school graduates or less (56%) or have a Graduate Degree (58%).
Israel is important for fulfilling biblical prophecy Those age 65+ (60%) are more likely to select “Yes” than those 18-34 (47%) and 35-49 (42%).
White, Non-Hispanics (53%) and Other Ethnicities (61%) are more likely to select “Yes” than
Black, Non-Hispanics (43%).
Every nation has a right to exist Those in the Northeast (58%) are more likely to select “Yes” than those in the South (46%).
Those age 18-34 (54%) and 50-64 (51%) are more likely to select “Yes” than those 35-49 (43%).
Hispanics (58%) and Other Ethnicities (59%) are more likely to select “Yes” than White, Non-
Hispanics (46%). Those with a Bachelor’s (53%) or a Graduate Degree (55%) are more likely to
select than those who are high school graduates or less (45%).
18
Chosen People Ministries & Author, Joel C. Rosenberg
Israel is the United States’ closest ally in an unstable region Males (50%) are more likely to select “Yes” than females (36%). Those age 65+ (49%) are more
likely to select “Yes” than those 35-49 (39%) and 50-64 (41%). Black, Non-Hispanics are the
least likely ethnic group to select “Yes” (27%), followed by Hispanics (37%). Those with a
Bachelor’s Degree (49%) or a Graduate Degree (49%) are more likely to select “Yes” than those
who are high school graduates or less (40%).
The Bible says Christians should support Israel Those age 18-34 (45%) and 50-64 (47%) are more likely to select “Yes” than those 35-49 (37%).
Other Ethnicities (51%) are more likely to select “Yes” than Black, Non-Hispanics (36%) and
Hispanics (38%).
Jesus was a Jewish person Those age 35-49 are the least likely age group to select “Yes” (28%). Hispanics (43%) are more
likely to select “Yes” than White, Non-Hispanics (33%). Those who are high school graduates or
less are the most likely education group to select “Yes” (41%).
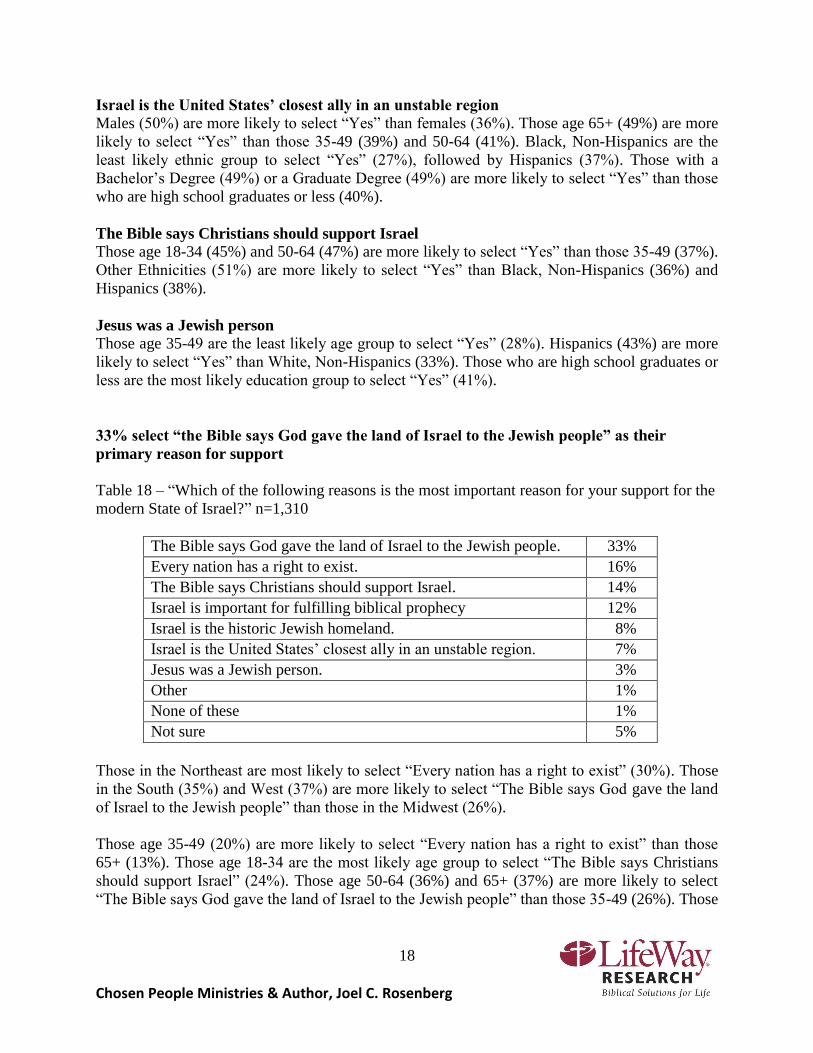
33% select “the Bible says God gave the land of Israel to the Jewish people” as their
primary reason for support
Table 18 – “Which of the following reasons is the most important reason for your support for the
modern State of Israel?” n=1,310
The Bible says God gave the land of Israel to the Jewish people. 33%
Every nation has a right to exist. 16%
The Bible says Christians should support Israel. 14%
Israel is important for fulfilling biblical prophecy 12%
Israel is the historic Jewish homeland. 8%
Israel is the United States’ closest ally in an unstable region. 7%
Jesus was a Jewish person. 3%
Other 1%
None of these 1%
Not sure 5%
Those in the Northeast are most likely to select “Every nation has a right to exist” (30%). Those
in the South (35%) and West (37%) are more likely to select “The Bible says God gave the land
of Israel to the Jewish people” than those in the Midwest (26%).
Those age 35-49 (20%) are more likely to select “Every nation has a right to exist” than those
65+ (13%). Those age 18-34 are the most likely age group to select “The Bible says Christians
should support Israel” (24%). Those age 50-64 (36%) and 65+ (37%) are more likely to select
“The Bible says God gave the land of Israel to the Jewish people” than those 35-49 (26%). Those

19
Chosen People Ministries & Author, Joel C. Rosenberg
age 18-34 are the least likely age group to select “Israel is important for fulfilling biblical
prophecy” (6%).
Hispanics (21%) and Other Ethnicities (24%) are more likely to select “Every nation has a right
to exist” than White, Non-Hispanics (14%). Those with a Graduate degree (14%) are most likely
to select “Israel is the United States’ closest ally in an unstable region”
Those who attend church services 1-3 times a month (13%) are more likely to select “Israel is the
historic Jewish homeland” than those attending once a week or more (8%) or less than once a
month (6%). Those who attend church services once a week or more (36%) are more likely to
select “The Bible says God gave the land of Israel to the Jewish people” than those attending 1-3
times a month (22%) or less than once a month (26%). Those attending church services less than
once a month (16%) are more likely to select “Israel is important for fulfilling biblical prophecy”
than those attending once a week or more (11%) or 1-3 times a month (9%).
71% say that their support for the State of Israel has stayed the same over the last 5 years
Table 19 – “Which of the following best represents your personal views? My support for the
existence, security, and prosperity of the State of Israel has” n=1,970
Increased over the last 5 years 24%
Stayed the same over the last 5 years 71%
Decreased over the last 5 years 5%
Those age 65+ (29%) are more likely “Increased over the last 5 years” to select than those 18-34
(19%) and 50-64 (23%). Those age 18-34 (75%) are more likely to select “Stayed the same over
the last 5 years” than those 65+ (67%).
Table 20 – “I wish I knew more about what the Bible teaches about Israel’s future.” n=1,962
Those age 65+ are the most likely age group to Agree (79%). Other Ethnicities are the most
likely ethnic group to Agree (87%).
40% 33% 7% 6% 14%
72% wish they knew more about what the Bible teaches about Israel’s future
Strongly Agree Somewhat Agree Somewhat Disagree Strongly Disagree Not sure

20
Chosen People Ministries & Author, Joel C. Rosenberg
97% have not traveled to Israel
Table 21 – “Have you ever traveled to Israel?” n=1,998
Yes 3%
No 97%
51% of those who have never been to Israel are interested or very interested in traveling to
Israel
Table 22 – “How interested would you be to travel to Israel if it was financially possible?”
n=1,925
Very Interested 34%
Interested 17%
Somewhat Interested 19%
Not Interested at All 21%
Not sure 10%
31% believe the U.S. does the right amount to help Israel
Table 23 – “Which of the following best describes your views on American involvement in
Israel?” n=1,985
The U.S. does too much to help Israel 6%
The U.S. is doing the right amount to help Israel 31%
The U.S. does not do enough to help Israel 24%
Not sure 38%
21
Chosen People Ministries & Author, Joel C. Rosenberg
Perceptions of the Peace Process
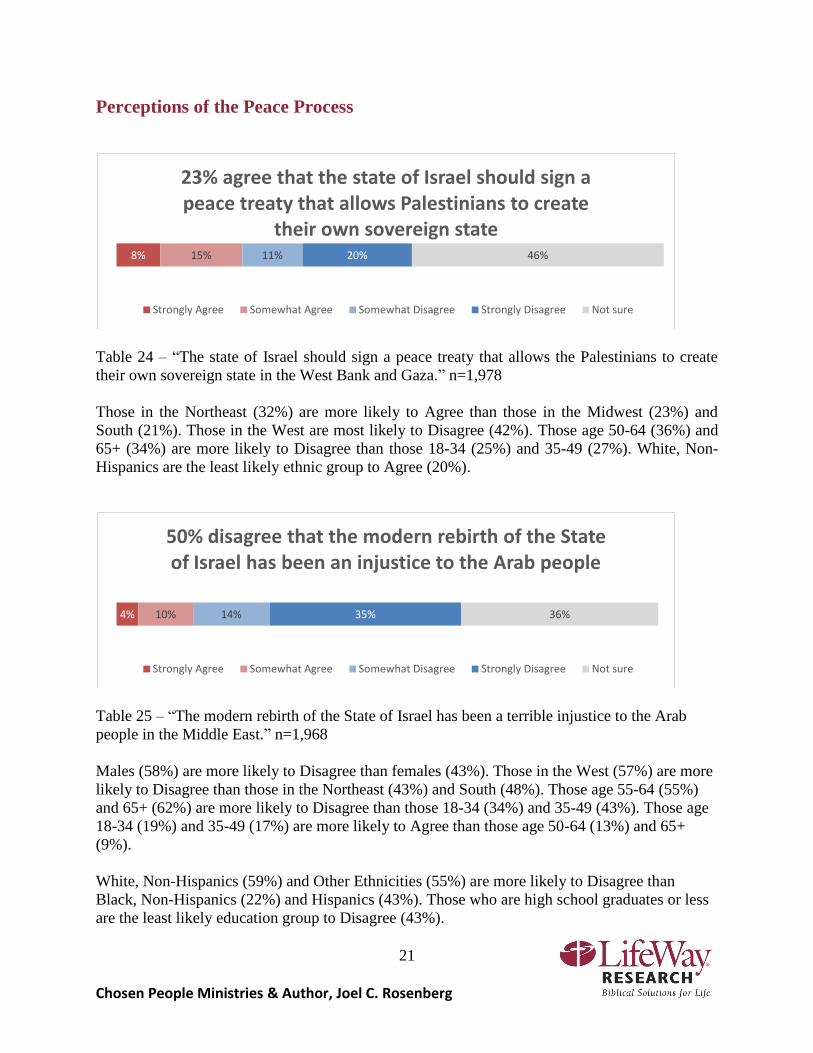
Table 24 – “The state of Israel should sign a peace treaty that allows the Palestinians to create
their own sovereign state in the West Bank and Gaza.” n=1,978
Those in the Northeast (32%) are more likely to Agree than those in the Midwest (23%) and
South (21%). Those in the West are most likely to Disagree (42%). Those age 50-64 (36%) and
65+ (34%) are more likely to Disagree than those 18-34 (25%) and 35-49 (27%). White, Non-
Hispanics are the least likely ethnic group to Agree (20%).
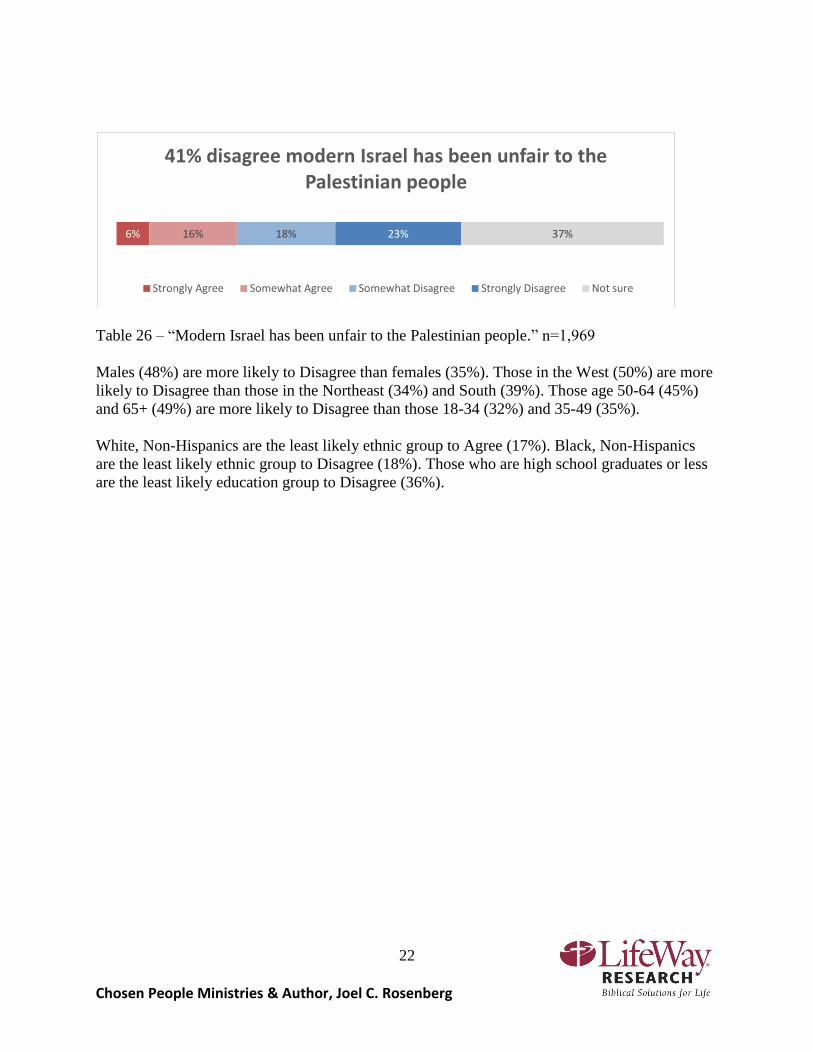
Table 25 – “The modern rebirth of the State of Israel has been a terrible injustice to the Arab
people in the Middle East.” n=1,968
Males (58%) are more likely to Disagree than females (43%). Those in the West (57%) are more
likely to Disagree than those in the Northeast (43%) and South (48%). Those age 55-64 (55%)
and 65+ (62%) are more likely to Disagree than those 18-34 (34%) and 35-49 (43%). Those age
18-34 (19%) and 35-49 (17%) are more likely to Agree than those age 50-64 (13%) and 65+
(9%).
White, Non-Hispanics (59%) and Other Ethnicities (55%) are more likely to Disagree than
Black, Non-Hispanics (22%) and Hispanics (43%). Those who are high school graduates or less
are the least likely education group to Disagree (43%).
8% 15% 11% 20% 46%
23% agree that the state of Israel should sign a peace treaty that allows Palestinians to create
their own sovereign state
Strongly Agree Somewhat Agree Somewhat Disagree Strongly Disagree Not sure
4% 10% 14% 35% 36%
50% disagree that the modern rebirth of the State of Israel has been an injustice to the Arab people
Strongly Agree Somewhat Agree Somewhat Disagree Strongly Disagree Not sure
22
Chosen People Ministries & Author, Joel C. Rosenberg
Table 26 – “Modern Israel has been unfair to the Palestinian people.” n=1,969
Males (48%) are more likely to Disagree than females (35%). Those in the West (50%) are more
likely to Disagree than those in the Northeast (34%) and South (39%). Those age 50-64 (45%)
and 65+ (49%) are more likely to Disagree than those 18-34 (32%) and 35-49 (35%).
White, Non-Hispanics are the least likely ethnic group to Agree (17%). Black, Non-Hispanics
are the least likely ethnic group to Disagree (18%). Those who are high school graduates or less
are the least likely education group to Disagree (36%).
6% 16% 18% 23% 37%
41% disagree modern Israel has been unfair to the Palestinian people
Strongly Agree Somewhat Agree Somewhat Disagree Strongly Disagree Not sure
23
Chosen People Ministries & Author, Joel C. Rosenberg
Demographics
Political ideology of participants
Table 27: “Which description best represents your political ideology?” n=1,989
Progressive/Very Liberal 2%
Liberal 6%
Moderate 15%
Conservative 39%
Very Conservative 18%
Libertarian 2%
Not sure 19%
Political affiliation of participants
Table 28: “In which party are you registered to vote or do you consider yourself to be a
member?” n=1,989
Democrat 29%
Republican 46%
Independent 16%
Libertarian 1%
Green <1%
Constitution 1%
Other 7%
Worship service attendance of participants
Table 29: “How often do you attend worship services at a church?” n=1,976
Once a week or more 65%
Three times a month 5%
Twice a month 4%
Once a month 2%
Several times a year 7%
Rarely 14%
Never 4%

24
Chosen People Ministries & Author, Joel C. Rosenberg
Denomination of Protestant and non-denominational participants
Table 30: “What specific religious group or denomination type do you prefer?” n=1,740
Assemblies of God 3%
Baptist 32%
Christian & Missionary Alliance 2%
Church of Christ 3%
Church of God 3%
Evangelical Free 2%
Lutheran 5%
Methodist 5%
Non-denominational 19%
Pentecostal 7%
Presbyterian 3%
None 5%
Denominations receiving 1% or less: African Methodist Episcopal (AME), Anglican, Apostolic,
Brethren, Calvary Chapel, Christian Methodist Episcopal, Church of God in Christ,
Congregational, Disciples of Christ, Episcopal, Evangelical Covenant Church, Foursquare
Gospel, Mennonite, Messianic Jewish, Nazarene, Reformed, Seventh Day Adventist, Vineyard
Church, Wesleyan, Other
Gender of participants
Male 44%
Female 56%
Region of participants
Northeast 10%
Midwest 20%
South 54%
West 16%
25
Chosen People Ministries & Author, Joel C. Rosenberg
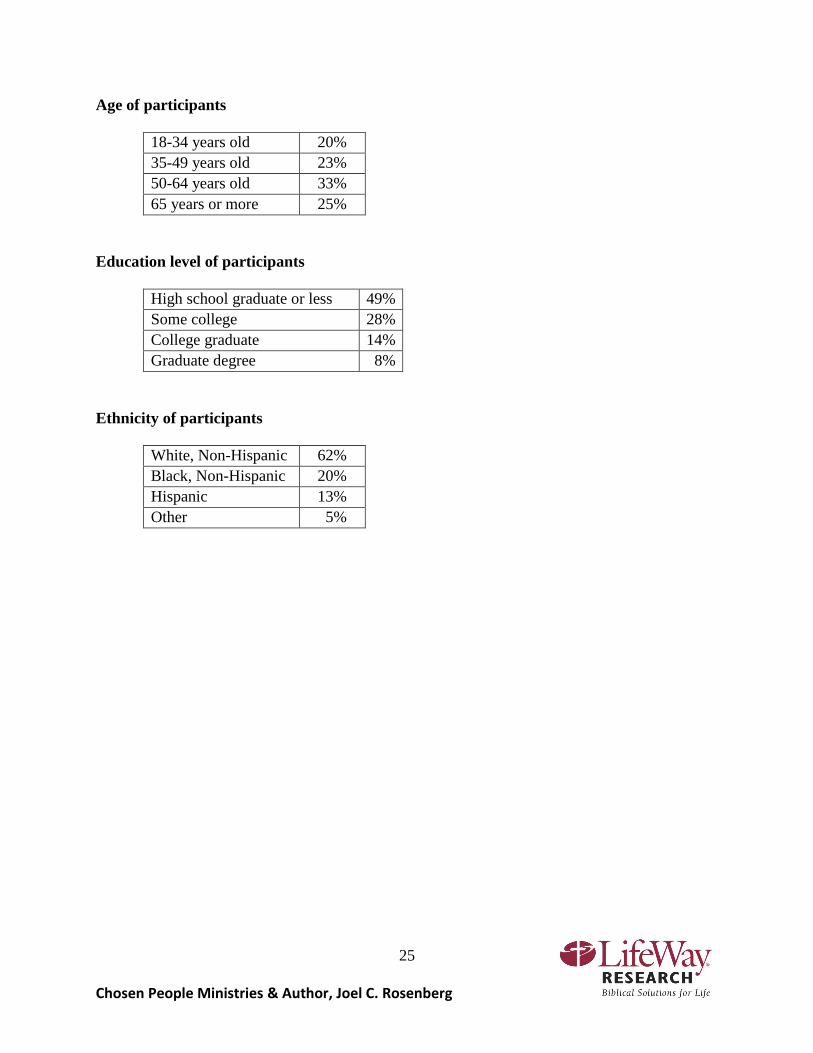
Age of participants
18-34 years old 20%
35-49 years old 23%
50-64 years old 33%
65 years or more 25%
Education level of participants
High school graduate or less 49%
Some college 28%
College graduate 14%
Graduate degree 8%
Ethnicity of participants
White, Non-Hispanic 62%
Black, Non-Hispanic 20%
Hispanic 13%
Other 5%